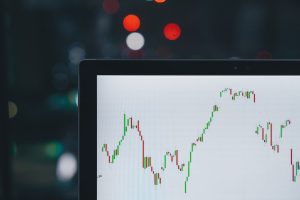
Forex trading is an exciting and lucrative way to make money online. It involves buying and selling currency pairs in the foreign exchange market. One of the most popular tools used by traders to analyze the market is the Fibonacci retracement tool. This tool is based on a mathematical sequence discovered by Leonardo Fibonacci, an Italian mathematician, in the 13th century. In this article, we will explain what Fibonacci retracement is and how to draw it in Forex trading.

What is Fibonacci Retracement?
Fibonacci retracement is a technical analysis tool used to identify potential levels of support and resistance in the price movement of a currency pair. It is based on the idea that the market tends to retrace a predictable portion of a move, after which it continues in the original direction. The levels are calculated based on the Fibonacci sequence, which is a series of numbers in which each number is the sum of the two preceding ones (0, 1, 1, 2, 3, 5, 8, 13, 21, 34, etc.).
The most commonly used Fibonacci levels in Forex trading are 38.2%, 50%, and 61.8%. These levels are drawn by connecting two points on a chart: the high point and the low point of a trend. The 38.2% level is drawn by measuring the distance between the high and low points, multiplying it by 0.382, and then subtracting the result from the high point. The 50% level is drawn by measuring the distance between the high and low points, multiplying it by 0.5, and then subtracting the result from the high point. The 61.8% level is drawn by measuring the distance between the high and low points, multiplying it by 0.618, and then subtracting the result from the high point.
How to Draw Fibonacci Retracement in Forex Trading?
To draw Fibonacci retracement in Forex trading, follow these steps:
Step 1: Identify the High and Low Points
The first step is to identify the high and low points of the trend you want to analyze. These points should be the most extreme points of the trend. If the trend is bullish, the high point should be the highest point of the trend, and the low point should be the lowest point of the trend. If the trend is bearish, the high point should be the lowest point of the trend, and the low point should be the highest point of the trend.
Step 2: Draw the Fibonacci Levels
Once you have identified the high and low points, you can draw the Fibonacci levels. Most charting software will have a Fibonacci retracement tool that you can use. Simply select the tool, click on the high point, and drag it down to the low point. The software should automatically draw the Fibonacci levels for you. If your software does not have a Fibonacci retracement tool, you can draw the levels manually by using the formula we mentioned earlier.
Step 3: Analyze the Levels
After drawing the Fibonacci levels, you should analyze them to identify potential levels of support and resistance. The 38.2% level is considered a shallow retracement level and may not provide strong support or resistance. The 50% level is considered a moderate retracement level and may provide some support or resistance. The 61.8% level is considered a deep retracement level and may provide strong support or resistance. In addition, the 50% level is often used as a target for traders who are looking to take profits.
Conclusion
Fibonacci retracement is a powerful tool that can help Forex traders identify potential levels of support and resistance. By drawing the levels based on the Fibonacci sequence, traders can gain insight into the market’s behavior and make more informed trading decisions. However, it is important to remember that Fibonacci levels are not always accurate, and should be used in conjunction with other technical analysis tools and market indicators. With practice and experience, drawing Fibonacci retracement levels can become an essential part of any Forex trader’s toolkit.