Forex trading is a global market that operates 24 hours a day, five days a week. It is a decentralized market where currencies are traded globally, and it is the largest financial market in the world with an average daily trading volume of over $5 trillion. Forex trading is done through a network of banks, financial institutions, and individual traders. The market is open 24 hours a day, and it is divided into four major trading sessions: the Sydney session, the Tokyo session, the London session, and the New York session.

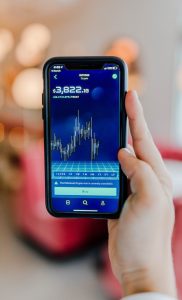
Forex traders use charts to analyze the market and make trading decisions. The most popular type of chart used in forex trading is the candlestick chart. Candlesticks are used to show the price movements of a currency pair over a specific period. Each candlestick represents a specific time frame, which can be anything from one minute to one month.
The duration of a candlestick can vary depending on the time frame used. For example, a one-minute candlestick represents one minute of trading activity, while a one-hour candlestick represents one hour of trading activity. The most common time frames used in forex trading are the 1-minute, 5-minute, 15-minute, 30-minute, 1-hour, 4-hour, daily, weekly, and monthly charts.
The duration of a daily candlestick is 24 hours. The candlestick represents the trading activity of a currency pair for one full day. The daily candlestick is the most important time frame used by long-term traders. It provides a clear view of the market trend, which is essential for making trading decisions.
The daily candlestick is made up of four components: the opening price, the closing price, the high price, and the low price. The opening price is the price of the currency pair at the start of the trading day, while the closing price is the price at the end of the trading day. The high price is the highest price that the currency pair reached during the trading day, while the low price is the lowest price that the currency pair reached during the trading day.
Traders use daily candlesticks to identify trends in the market. A bullish trend is identified when the closing price is higher than the opening price, while a bearish trend is identified when the closing price is lower than the opening price. The high and low prices are used to identify the range of the trading day. If the high and low prices are close together, it indicates that there was little volatility in the market. If the high and low prices are far apart, it indicates that there was a lot of volatility in the market.
In conclusion, the daily candlestick is an essential tool used by forex traders to analyze the market and make trading decisions. It represents the trading activity of a currency pair for one full day and provides a clear view of the market trend. The duration of a daily candlestick is 24 hours, and it is the most important time frame used by long-term traders. Understanding the daily candlestick is crucial for successful forex trading.