Forex Daily: Understanding the Role of Technical Analysis in Trading
In the world of forex trading, there are two primary approaches that traders use to make decisions: fundamental analysis and technical analysis. While fundamental analysis focuses on economic indicators, news events, and political developments, technical analysis is all about studying historical price patterns and utilizing various tools and indicators to predict future price movements.
Technical analysis is based on the assumption that historical price data can help predict future price movements. It involves studying charts, identifying patterns, and using various indicators to make trading decisions. Traders who use technical analysis believe that all relevant information is already reflected in the price, and by analyzing historical price data, they can identify trends and patterns that can be used to predict future price movements.
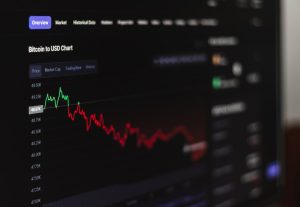
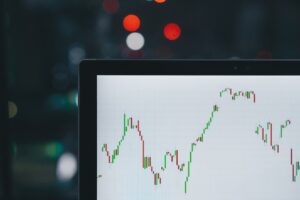
One of the primary tools used in technical analysis is the price chart. A price chart is a graphical representation of the historical price movements of a currency pair. Traders use different types of charts, such as line charts, bar charts, and candlestick charts, to analyze price patterns and identify potential trading opportunities.
Support and resistance levels are key concepts in technical analysis. Support levels are price levels where buying pressure is strong enough to prevent the price from falling further. Resistance levels, on the other hand, are price levels where selling pressure is strong enough to prevent the price from rising further. By identifying these levels, traders can make informed decisions about when to enter or exit a trade.
Another important tool in technical analysis is trend lines. Trend lines are lines drawn on a chart to connect a series of highs or lows. They help traders identify the direction of the market and can be used to determine potential entry and exit points. An uptrend is characterized by higher highs and higher lows, while a downtrend is characterized by lower highs and lower lows.
Indicators are also widely used in technical analysis. These are mathematical calculations based on price and volume data that are used to generate trading signals. There are many different types of indicators, including moving averages, oscillators, and trend-following indicators. Traders often use a combination of indicators to confirm their trading decisions.
One popular indicator is the moving average. Moving averages are used to smooth out price fluctuations and identify the overall trend. They can be calculated using different time periods, such as the 50-day or 200-day moving average. When the price crosses above or below a moving average, it can be a signal to buy or sell.
Oscillators are another type of indicator commonly used in technical analysis. Oscillators measure the momentum of price movements and indicate whether a currency pair is overbought or oversold. Examples of oscillators include the relative strength index (RSI) and the stochastic oscillator. When an oscillator reaches extreme levels, it can signal a potential reversal in the price.
While technical analysis is a valuable tool for forex traders, it is important to note that it is not foolproof. Markets can be influenced by unexpected events and news releases that may not be reflected in historical price data. Therefore, it is essential for traders to combine technical analysis with other forms of analysis, such as fundamental analysis, to make well-informed trading decisions.
In conclusion, technical analysis plays a crucial role in forex trading. By studying historical price patterns, using various tools and indicators, and identifying key levels and trends, traders can make informed decisions about when to enter or exit a trade. However, it is important to remember that technical analysis is just one piece of the puzzle, and traders should always consider other factors, such as economic indicators and news events, to make successful trades.


