The cryptocurrency sector has spent the day trying to push higher highs but failed as Bitcoin didn’t make it above $11,500. Bitcoin is currently trading for $11,486, representing an increase of 0.65% on the day. Meanwhile, Ethereum lost 0.64% on the day, while XRP lost 1.42%.
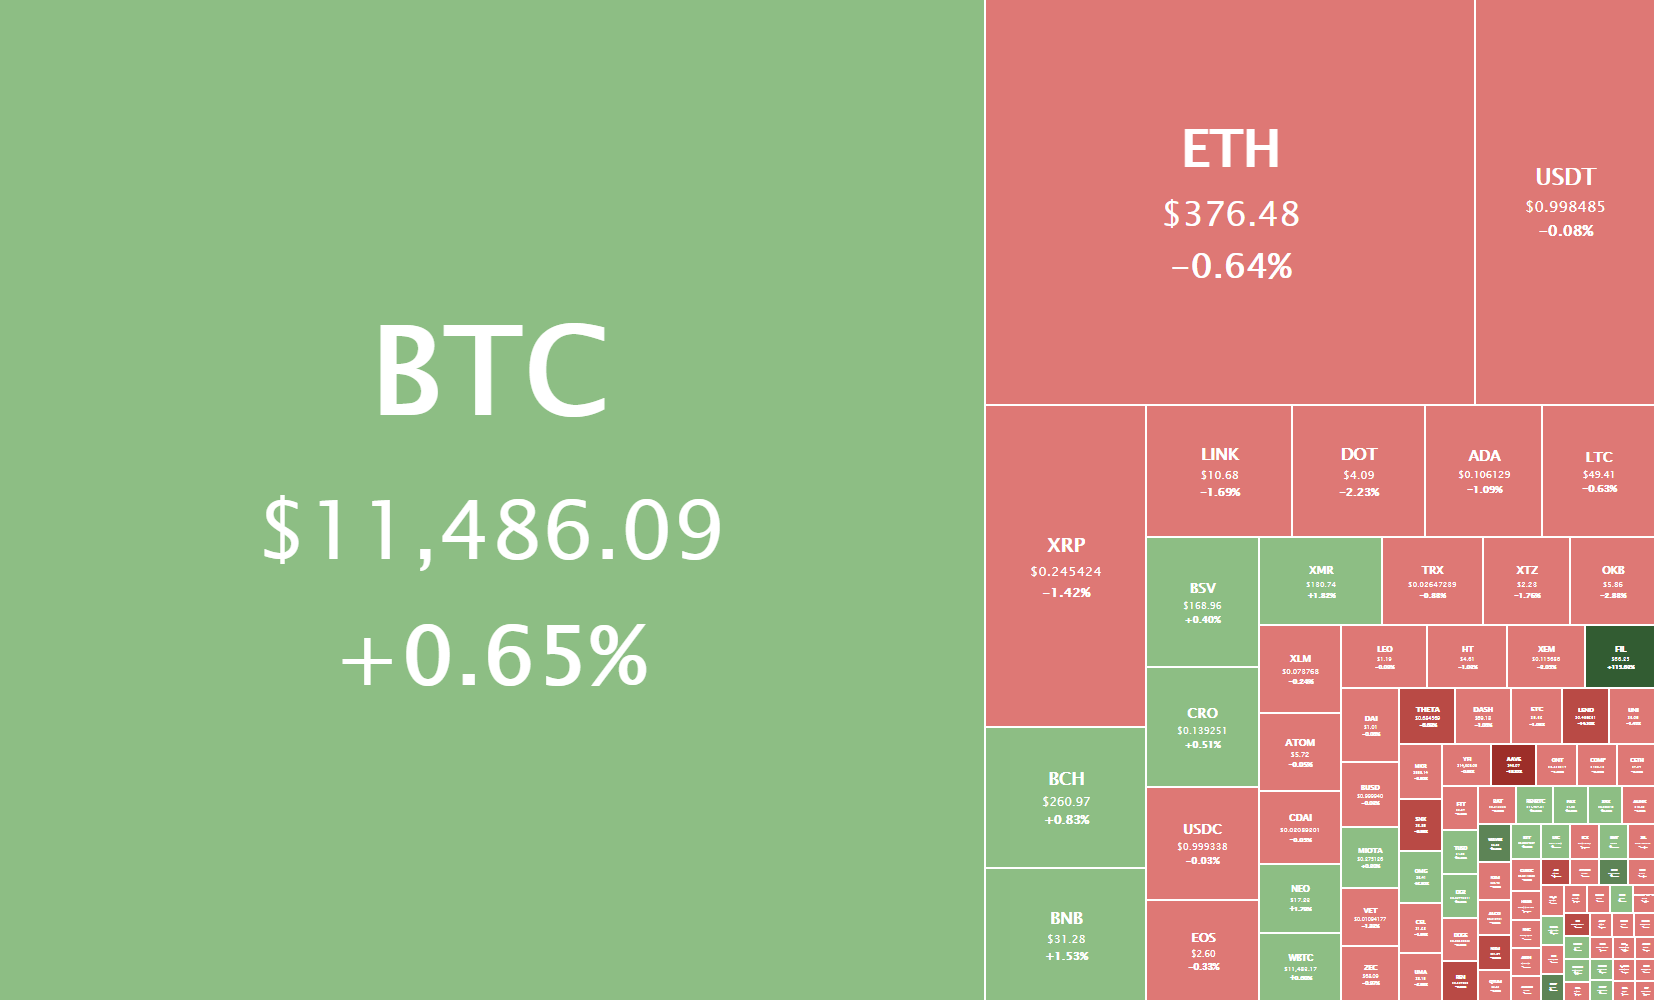

Daily Crypto Sector Heat Map
If we look at the top 100 cryptocurrencies, we can see that Filecoin gained an astonishing 120.78% in the past 24 hours, making it the top daily gainer. ABBC Coin (39.25%) and Blockstack (9.35%) also did great. On the other hand, Aave lost 15.89%, making it the most prominent daily loser. It is followed by Arweave’s loss of 14.13% and Synthetix Network Token’s loss of 8.96%.

Top 10 24-hour Performers (Click to enlarge)

Bottom 10 24-hour Performers (Click to enlarge)
Bitcoin’s market dominance level has stayed at the same level since our last report, with its value currently being 58.7%. This value represents a 0% difference when compared to when we last reported.
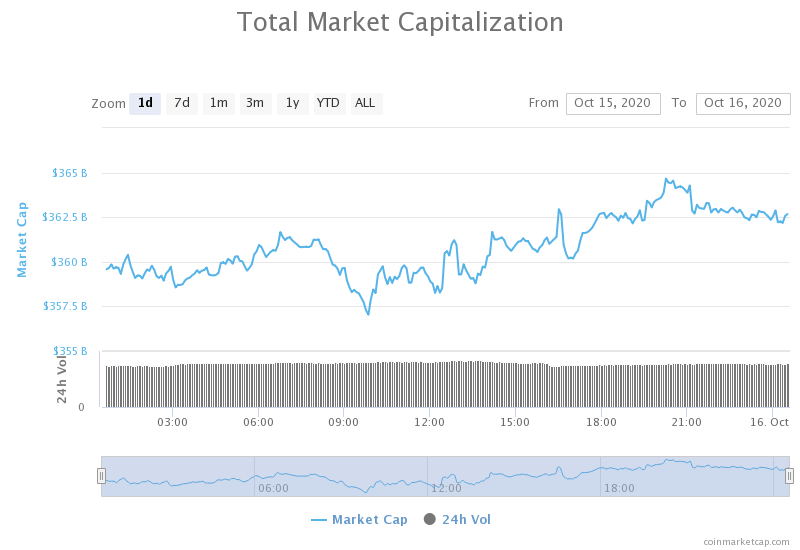
Daily Crypto Market Cap Chart
The crypto sector capitalization has gained a bit of its value over the course of the past 24 hours. Its current value is $362.56 billion, representing an increase of $1.46 billion compared to our previous report.
_______________________________________________________________________
What happened in the past 24 hours?
_______________________________________________________________________
- Libra hires another HSBC alum as its CFO and CRO (The Block)
- Coinbase to sponsor Bitcoin core developers for the first time (The Block)
- Bahamas central bank officials say the digital ‘Sand Dollar’ will eventually work internationally (The Block)
- $257 Million ICO Project Filecoin Goes Live After 3 Long Years (Cryptobriefing)
- Nearly 2,000 Accounts Compromised in Latest Robinhood Hack (Cryptobriefing)
- Associated Press to Publish U.S. Election Results on EOS Blockchain (Cryptobriefing)
- These 3 long-term indicators show Ethereum has “never been healthier” (Cryptoslate)
- Fed Chairman Powell to Speak About Digital Currencies Next Week at IMF (Coindesk)
- ‘Shorts will be dead’ — Why Dan Tapiero expects a massive Bitcoin shortage (Cointelegraph)
- Bitstamp says its users are now covered against a broad web of crime (Cointelegraph)
_______________________________________________________________________
Technical analysis
_______________________________________________________________________
Bitcoin
The oldest cryptocurrency spent the past 24 hours trying to push past the $11,500 resistance. While the fight for it still continues, there is a strong possibility that Bitcoin will actually stabilize its price above it. If that happens, bulls might come in even stronger and push the price towards $11,630, or even $11,730.
If, however, Bitcoin moves back below $11,500, the sentiment won’t change to a lot more bearish one, as Bitcoin is used to trading above $11,300 as of lately.
BTC/USD 1-day Chart
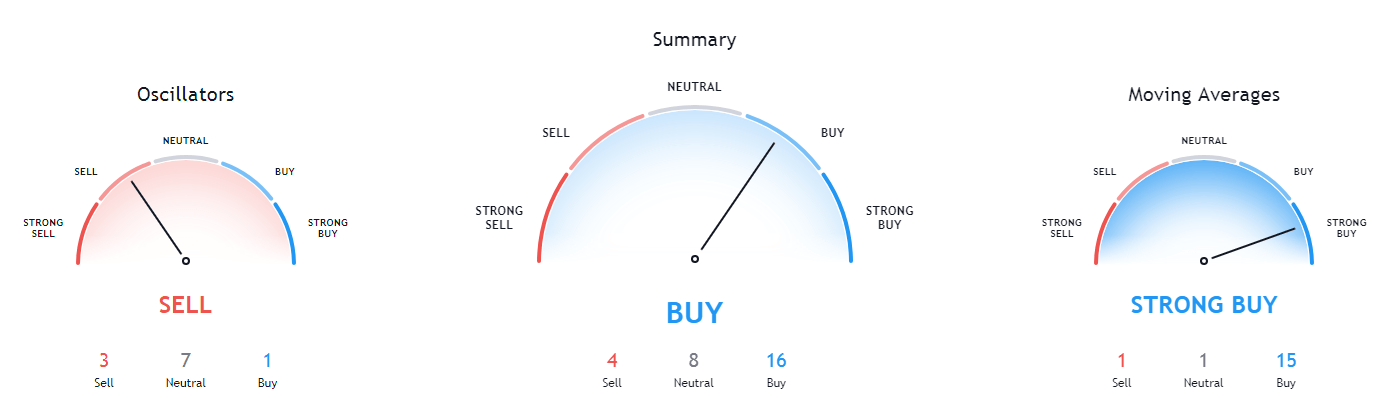
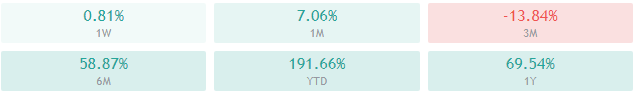
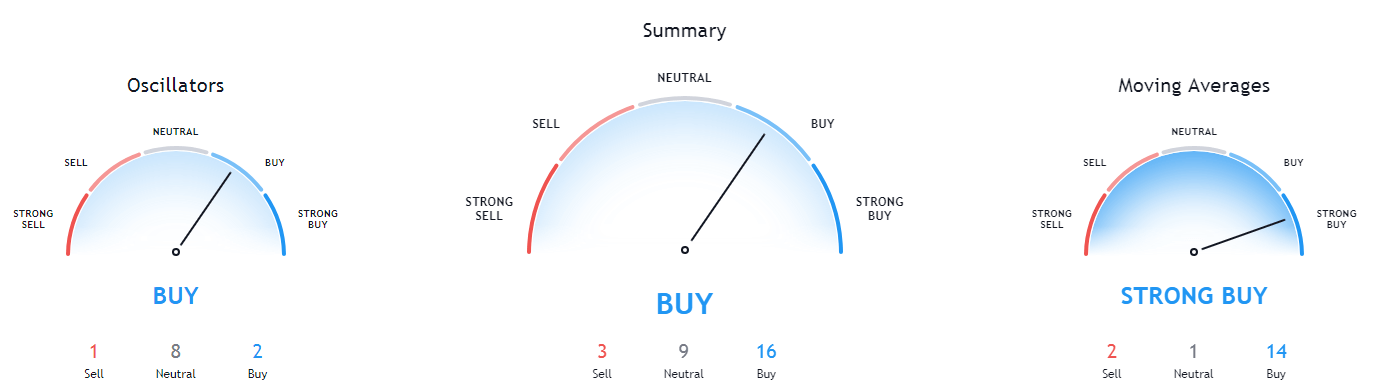
Bitcoin’s technical overview is extremely bullish on every single time-frame for almost a month now, with longer time-frames showing complete bullish sentiment, while the shorter ones are slightly less tilted towards the buy-side.
BTC/USD 1-day Technicals
Technical factors (4-hour Chart):
- Price is above its 50-period EMA and at its 21-period EMA
- Price near its top Bollinger band
- RSI is neutral (60.70)
- Volume is average
Key levels to the upside Key levels to the downside
1: $11,500 1: $11,300
2: $11,630 2: $11,180
3: $12,000 3: $11,000
Ethereum
Unlike Bitcoin that tried to push towards its resistance level, Ethereum spent the day fighting to stay above the $378 level it recently fell under. The second-largest cryptocurrency by market cap tested the $371 support level, which held up quite nicely and attempted a push towards (now) resistance level of $378. While the fight for it still lasts, Ethereum will most likely end up above it if Bitcoin’s price doesn’t drop and pull ETH alongside.
ETH/USD 4-hour Chart
Ethereum’s technicals on all time-frames are a varying degree of bullish. While its 4-hour and monthly overviews are a bit more neutral, its daily and weekly overviews are strongly tilted towards the buy-side.
ETH/USD 1-day Technicals
Technical Factors (4-hour Chart):
- The price is above its 50-period and right at its 21-period EMA
- The price at its middle Bollinger band
- RSI is neutral (54.03)
- Volume is average
Key levels to the upside Key levels to the downside
1: $378 1: $371
2: $400 2: $360
3: $415 3: $334
Ripple
XRP has spent the past 24 hours continuing its drop towards the $0.2454 support level. XRP is approaching a quarterly price drop of 20% if the price breaks to the downside. However, so far, the $0.2454 support level is holding up, and XRP bears are not able to break it. If the support level break, we can expect XRP to move towards $0.235.
Traders should either wait for a bounce towards the upside (less likely and riskier) or wait for a possible break below $0.2454 to trade alongside the strong move to the downside.
XRP/USD 4-hour Chart
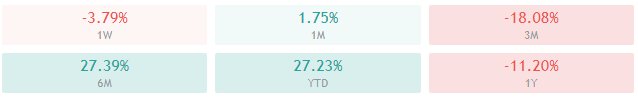
XRP’s technicals have changed the sentiment to quite bearish in the past couple of days. While its monthly sentiment was bearish for a while, its 4-hour and 1-day overviews have turned completely towards the sell-side. On the other hand, XRP’s weekly overview is still slightly bullish.
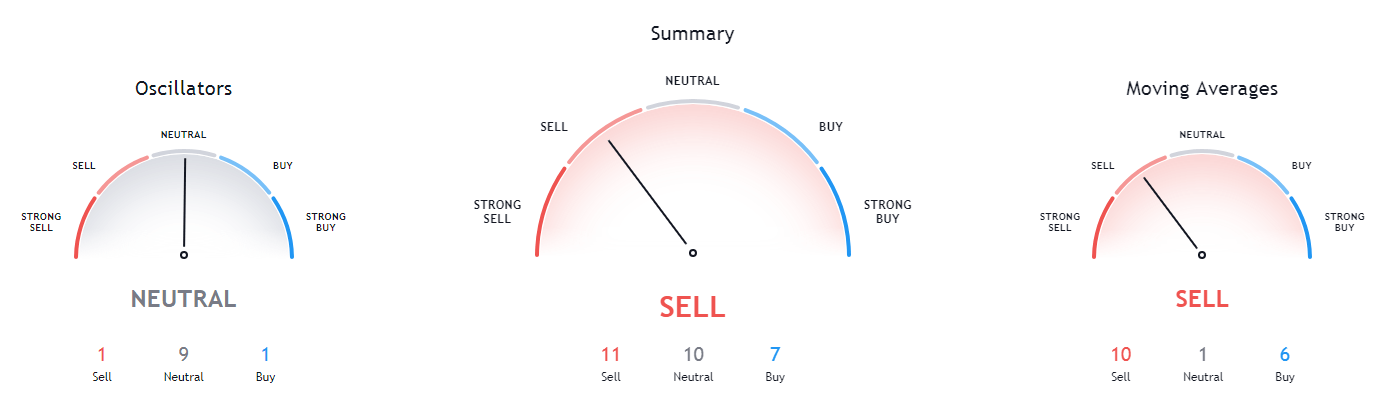
XRP/USD 1-day Technicals
Technical factors (4-hour Chart):
- The price is below both its 50-period EMA and its 21-period EMA
- Price is slightly above its lower Bollinger band
- RSI is neutral (40.83)
- Volume is average (except for a couple of huge volume candle)
Key levels to the upside Key levels to the downside
1: $0.266 1: $0.2454
2: $0.27 2: $0.235
3: $0.273 3: $0.227

Related posts