

The cryptocurrency sector has shot up as Bitcoin pushed towards $11,000. Most cryptos ended up in the green, with some even outperforming Bitcoin. Bitcoin is currently trading for $11,019, which represents an increase of 2.72% on the day. Meanwhile, Ethereum gained 5.58% on the day, while XRP gained an astonishing 7.24%.
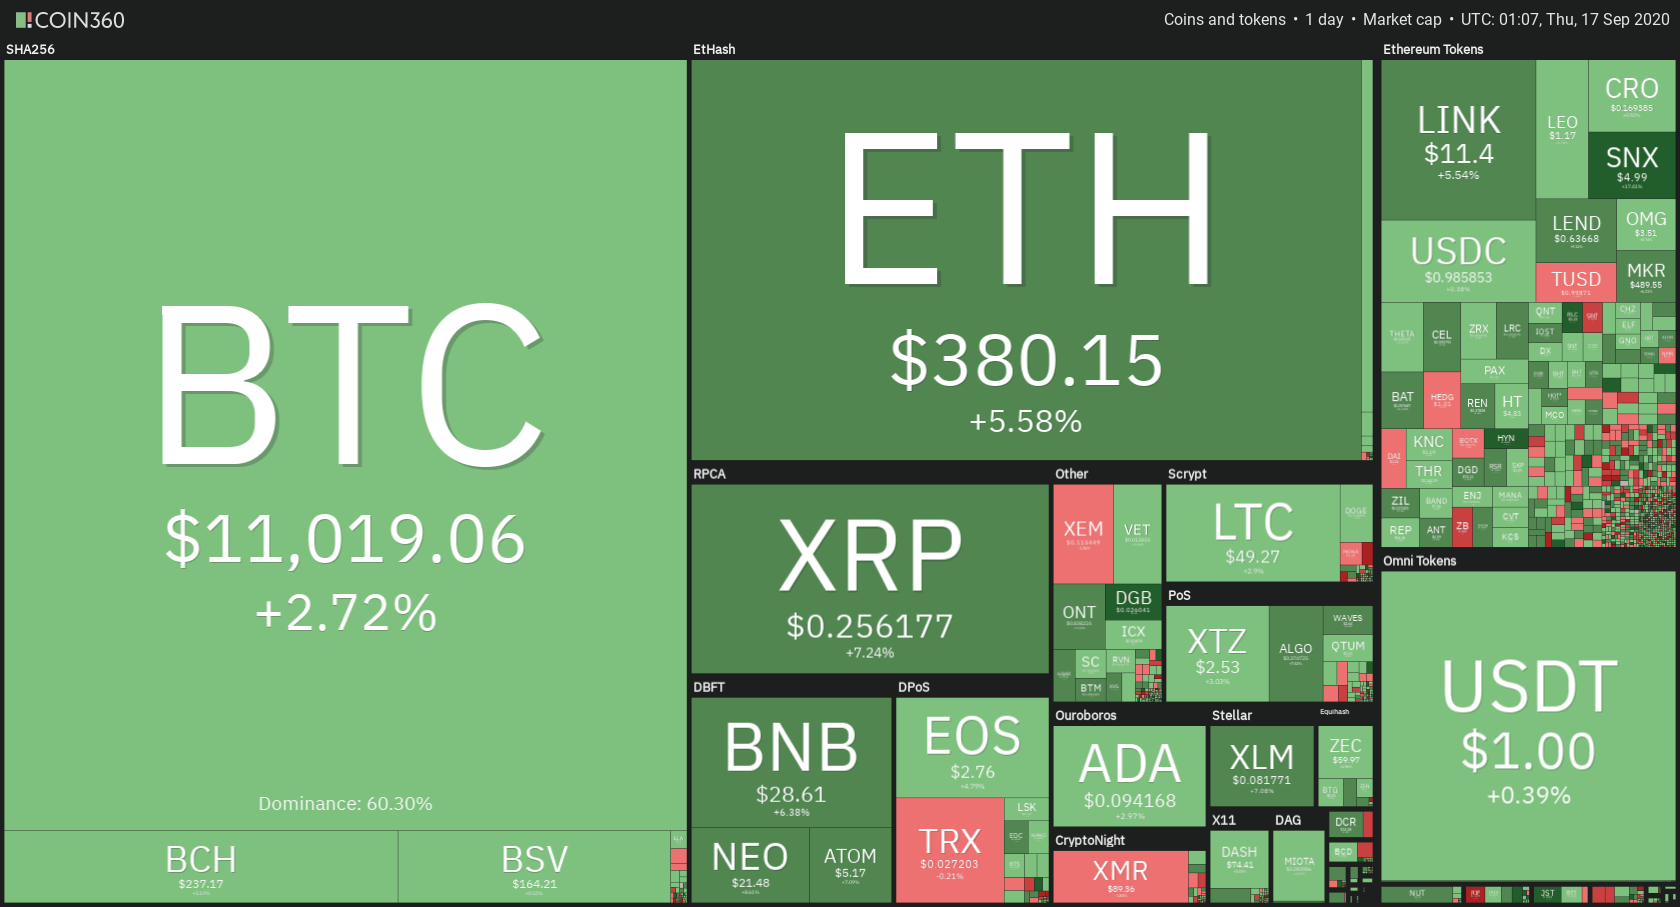

Daily Crypto Sector Heat Map
If we look at the top100 cryptocurrencies, DigiByte gained 23.07% on the day, making it the most prominent daily gainer. Hyperion (19.61%) and Kusama (11.85%) also did great. On the other hand, SushiSwap lost 15.68%, making it the most prominent daily loser. It is followed by Flexacoin’s loss of 11.46% and UMA’s loss of 11.43%.
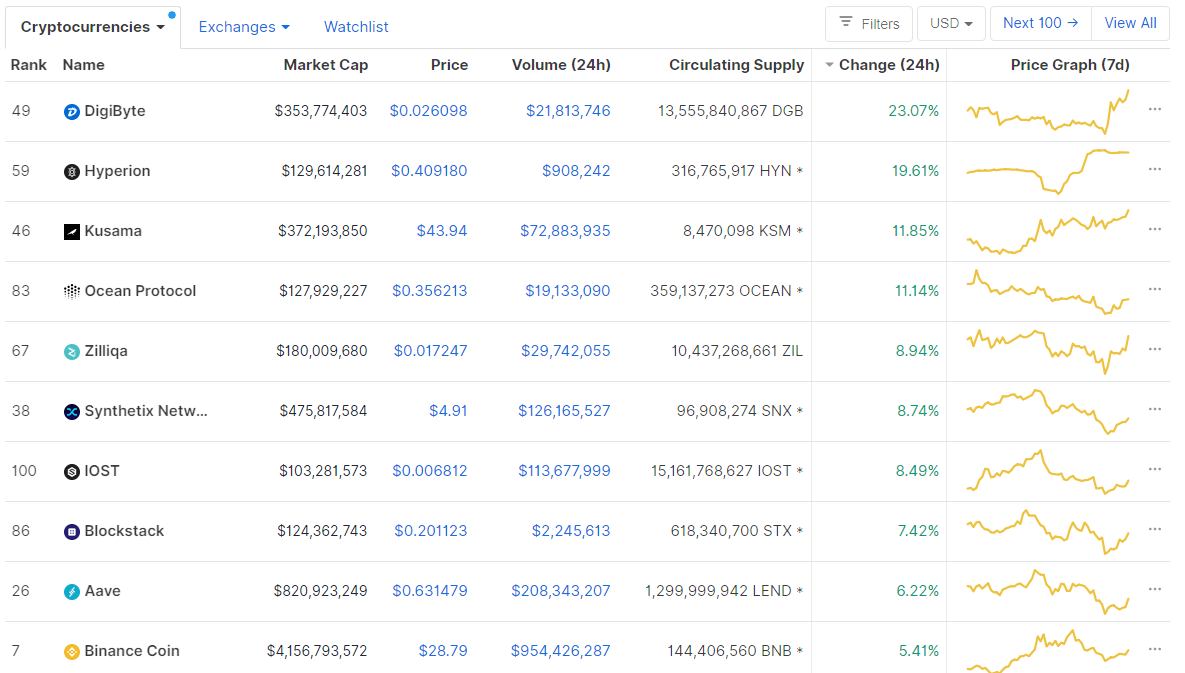
Top 10 24-hour Performers (Click to enlarge)
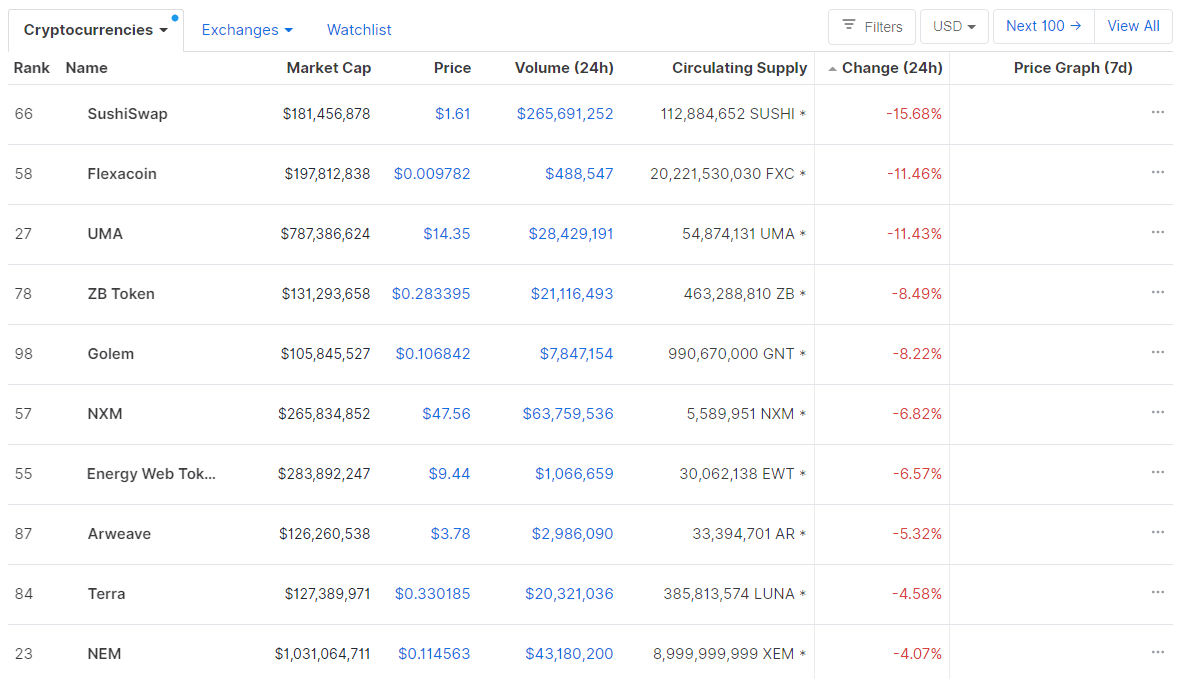
Bottom 10 24-hour Performers (Click to enlarge)
Bitcoin’s dominance level experienced a slight decrease since our last report, with its value currently being at 60.30%. This value represents a 0.21% difference to the downside when compared to when we last reported.

Daily Crypto Market Cap Chart
The crypto sector capitalization has gone up significantly in the past 24 hours. Its current value is $353.89 billion, which represents an increase of $10.48 billion when compared to our previous report.
_______________________________________________________________________
What happened in the past 24 hours?
_______________________________________________________________________
- You can now send an email right from your Ethereum address (Cointelegraph)
- Bitcoin futures volumes on U.S. exchange Bakkt hits record (Cryptoslate)
- MicroStrategy Outperforms Nasdaq Composite After $175 Million Bitcoin Purchase (Cryptobriefing)
- Japanese Crypto Exchange Sues Binance for Role in $63 Million Bitcoin Hack (Cryptobriefing)
- Ethereum 2.0 Imminent, Serenity Phase 0 EIP Submitted (Cryptobriefing)
- Tezos to Power France’s CBDC Stablecoin Experiment (Cryptobriefing)
- Decentralized exchange Uniswap goes live with a governance token, dubbed UNI (The Block)
- Rep. Emmer says DeFi represents an alternative ‘monetary philosophy’ — and its time is coming (The Block)
- US indictments against Chinese hackers include allegations of ‘crypto-jacking’ attacks (The Block)
- Kraken is launching a crypto bank in Wyoming, paving the way for possible stock offerings (The Block)
_______________________________________________________________________
Technical analysis
_______________________________________________________________________
Bitcoin
Bitcoin has, as we said in our previous article, pushed towards the upside, attempting an $11,000 break. While it has broken the $11,000 psychological resistance, it got stopped out at the $11,090 resistance level. Bitcoin will have to make a confirmation move in order to stay above $11,000, which may be hard since it will be in such a tight range ($11,000 to $11,090).
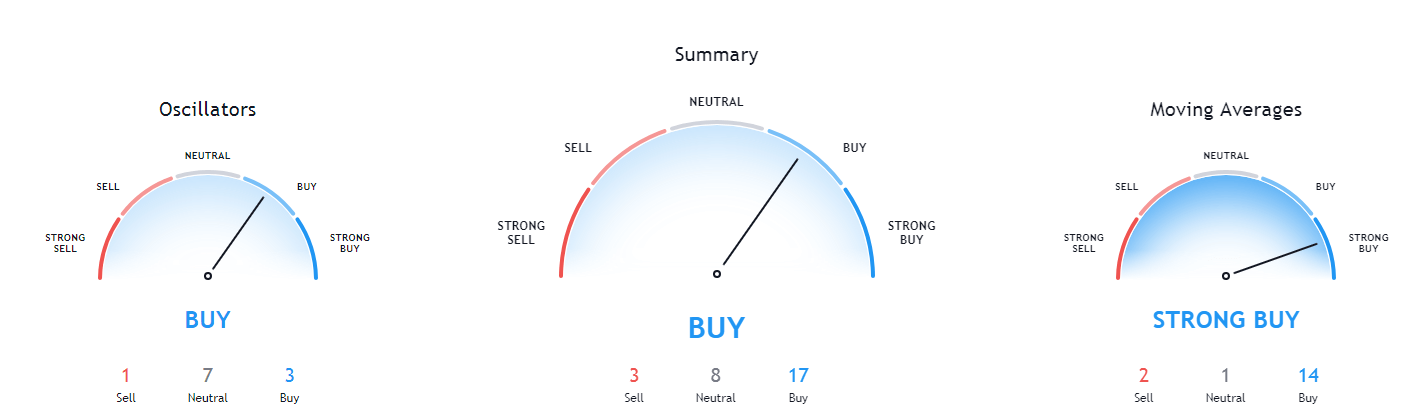
Bitcoin’s short-term indicators are extremely bullish, but its longer-term indicators are also tilted towards the bull side. Traders should look out for how Bitcoin handles the $11,000 level and trade off of it.
BTC/USD 4-hour Chart
Technical factors:
- Price is above both its 50-period EMA and 21-period EMA
- Price is near its top Bollinger band
- RSI is overextended to the upside (71.42)
- Volume is stable (with a couple of spikes)
Key levels to the upside Key levels to the downside
1: $11,000 1: $10,850
2: $11,090 2: $10,630
3: $11,460 3: $10,500
Ethereum
As we said in our previous article, it would take a strong push towards the upside to pull Ethereum out of the 35% downside prognosis, which many trades called since the ETH/USD pair created a bear flag. However, Bitcoin’s push towards $11,000 prompted Ethereum to push towards the upside and get back into the range.
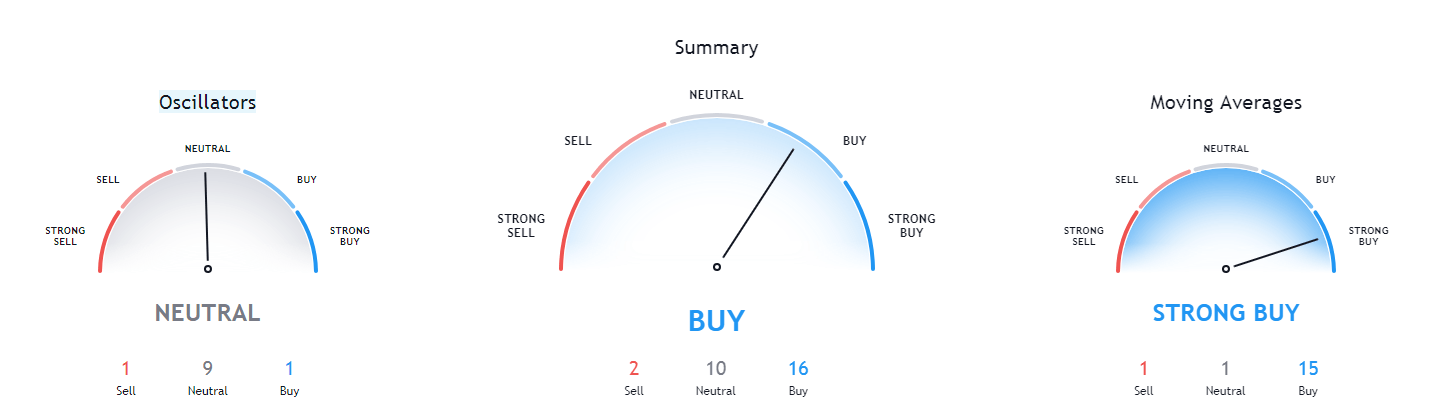
With this being said, Ethereum hasn’t confirmed its position above the bear flag lower line, which is because the $371 level it passed will remain in our “key level to the upside” section until ETH confirms otherwise. Still, its short-term indicators have changed to a bit more bullish scenario.
ETH/USD 4-hour Chart
Technical Factors:
- The price is above both its 21-period and its 50-period EMA
- The price is right at its top Bollinger band
- RSI is neutral but pushing towards the upside (59.82)
- Volume is low and stable
Key levels to the upside Key levels to the downside
1: $371 1: $360
2: $400 2: $340
3: $415 3: $300
Ripple
XRP had an amazing day, with its price pushing over 7% on the day. The third-largest cryptocurrency by market cap has used this influx of bulls to its fullest, confirming its position above $0.2454 and even pushing towards $0.266.

XRP has joined Ethereum in terms of technicals, with the short-term overview changing to a short-term buy, while its long-term technicals are still showing slight bearishness. Traders can look for a pullback that XRP will inevitably make and trade off of it.
XRP/USD 4-hour Chart
Technical factors:
- The price is above its 21-period EMA and its 50-period EMA
- Price is above its top Bollinger band
- RSI is skyrocketing and pushing towards overbought (67.99)
- Volume is low (but slowly increasing)
Key levels to the upside Key levels to the downside
1: $0.266 1: $0.2454
2: $0.285 2: $0.235
3: $0.31 3: $0.227

Related posts


One reply on “Daily Crypto Review, Sept 17 – Bitcoin Above $11,000; XRP Skyrocketing”
Interesting end to the week coming