In this week’s BTC/USD analysis, we will be taking an in-depth look at the most recent technical formations, as well as look for the possible short-term price outcomes.
Overview
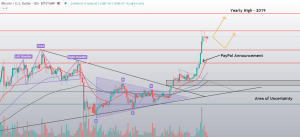
Bitcoin has had quite a volatile week experienced yet another steep decrease in price as a continuation of the bear retracement after the cryptocurrency couldn’t post new all-time highs with confidence. However, the largest cryptocurrency by market cap has recovered from the decline in a matter of days, with its price over $19,000 once again.

While Bitcoin’s fundamentals only grew stronger as more and more institutional investors acknowledge it as a competitor to gold. This trend of large public companies investing in the best-known cryptocurrency has been seen throughout 2020, and many say that this is the sole reason for the current Bitcoin’s run.
Technical factors
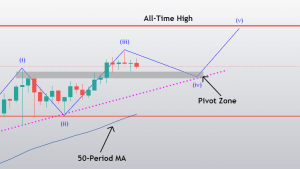
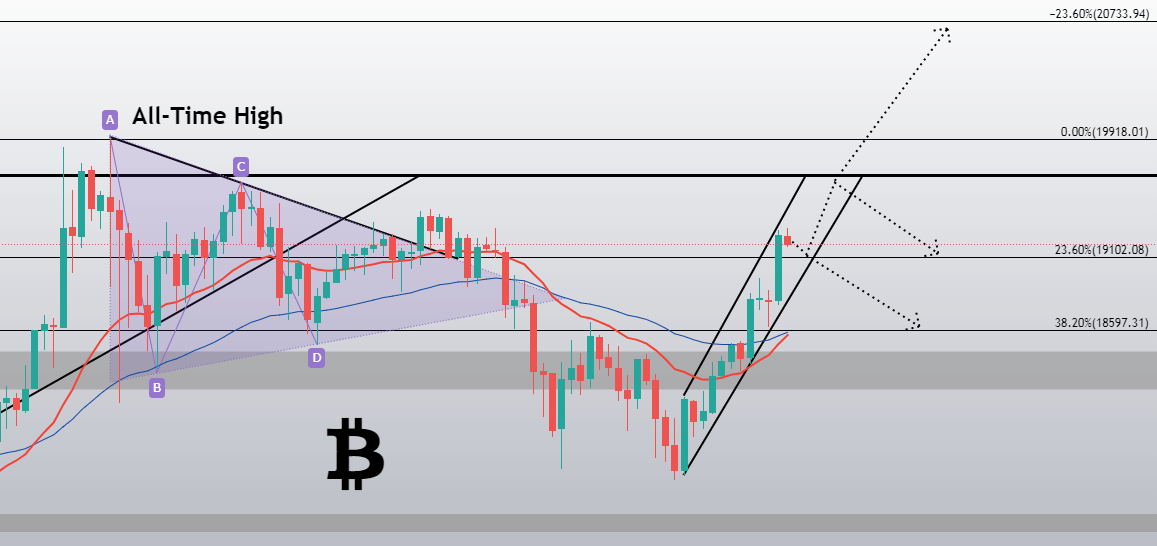
Bitcoin is currently in a steep upwards-facing trend, which brought its price from $17,600 all the way to $19,000. While the channel is way too steep to be considered a long-term option, Bitcoin has the option to follow it for a little bit more, possibly riding the way up to the $19,666 major resistance (and a previous all-time high on Bistamp). This will most likely be the pivot point for Bitcoin, which will decide if it will try to tackle the levels above $20,000 or stay below it and seek support near $19,100.
Likely Outcomes
Bitcoin’s currently sending out very bullish signals, but we included a slightly bearish scenario as well, just to make sure all bases are covered.
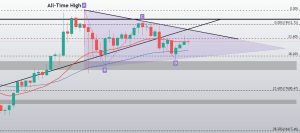
1: In case Bitcoin heads further up, its price will most likely stop at the major pivot point, which sits at $19,666. This level is the all-time high from 2017 and is a major resistance level. From here, Bitcoin bulls will have to decide whether they will push towards the upside or remain below this level:
- In case that the price moves further up, its next possible resistance level (there isn’t much resistance above $20,000, so all possible resistance levels will be extensions of the Fib retracements) is most likely to be sitting at around $20,750.
- In case the price decides to stay below $19,666, we can expect it to move down and look for support at $19,100 or $18,600 levels.
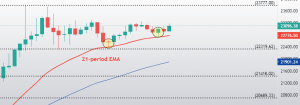
2: If Bitcoin breaks the ascending channel early and pushes towards the downside, its first strong support level is $19,100 (which it will inevitably break if it pushes down and breaks the channel) and then $18,600.
Entering any short trades could be quite risky at the moment due to the bullish momentum Bitcoin has gathered. However, trading above $20,000 is equally as risky as Bitcoin would be entering a zone with no set resistance and support levels. However, entering long traders is certainly a safer option at the moment.