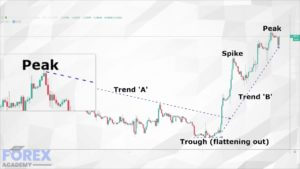

Trading Breakouts

In the area of financial trading and in particular within the Forex market, the movement of a currency pair, or price action, does one of three things: it moves up, it moves down, or it moves sideways. Within these types of moves, especially when the price action is moving up and down, we will find trends forming. We also find pullbacks, or price reversals, continuations, slowdowns in volatility, and pauses and hesitations, which are also known as periods of consolidation. Typically at these times you might see very small movements, where price moves sideways in a narrow range. In other words, currency exchange rates in the Forex market do not travel in a continuous straight line. And this is what makes trading so difficult to predict.
Each time you pull the trigger and execute a trade, and especially as a retail trader, you are up against institutional traders, including sovereign wealth funds, hedge funds, governments and their central banks and high net worth individuals, all of whom might well have a different price move expectation than yourself and be trading in the opposite direction, i.e, against you!
This is why it is so important to learn the peculiarities, twists, and turns, the dynamics and unpredictability of the Forex market. And the best way to do this is to study your charts and to study the markets and to practice on a demo account. In other words, learn the ropes, find the best time of day to trade that suits your trading style and methodology, try to determine when the aforementioned big guns are all likely to be singing from the same hymn sheet, in other words when the majority are trading in the same direction.
One of the most popular and rewarding styles of trading the Forex market is identifying breakouts. This type of trading relates to technical analysis only. That Is not to say that we can take our eyes off of the fundamentals, because these events can be triggered by economic data releases. However, after periods of consolidation, where price action becomes narrow and congested, and show a lack of direction, traders look for potential breakouts to test new levels, and these events regularly occur purely on technical analysis, alone.
Because breakouts are so popular, price action can be extremely volatile at these times. It’s almost as if everybody pounces to trade at the same time and either buys or sells a particular currency pair because their charts tell them so. This tends to cause strong moves, as price breaks out of bottlenecks and where quite often those entities who are trading counter to the breakout may be stopped out of their trades. This is often because breakouts regularly happen at, or close to, round numbers. At these levels, traders tend to place their stop losses or limit orders to buy or sell. This can often result in a spoof breakout, where price action breaks out of a period of consolidation only to reverse quickly and start a trend in the opposite direction. And therefore, some breakouts can be short-lived, and which are also known as false breakouts.
Example A
Let’s turn our attention to example ‘A.’ This is a 1-hour chart of the EURUSD pair. Always read your charts from left to right, because it tells you a story of where price action has been, and where it is possibly going to go in the future.
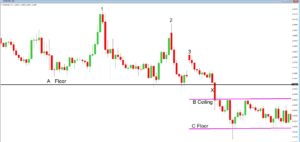
In this example, we can see that we have drawn a horizontal line at position ‘A.’ This has become an area of support; it is effectively a floor. Although we have a high, as marked at the position marked 1, and where price action moves back to our floor, the second move higher at position 2 becomes a lower high than at position 1. This tells us that the market is running out of momentum to the upside, and where indeed price action returns to the floor after this push higher falters. And then, price action forms a new lower high at position 3. This now tells us that bull traders have effectively thrown the towel in, and then, when price again returns to the floor, we see a breakout, as marked by the X, which punches through the floor, or support level. Therefore, this would have been the breakout candlestick that traders were looking for In order to go short on this pair.

Price action continues to move to the downside. However, we now see a new floor at position C, and a new ceiling at position B. And where price action consolidates in a sideways trading fashion.
In the example ‘B,’ we have moved the charts along to the next session. Price action continued to trend sideways between the ceiling marked ‘B’ and the floor marked ‘C’ until it becomes a second breakout occurs and where price action punches through to a new floor marked ‘D’ and where the previous floor, ‘C’ has now become a ceiling.
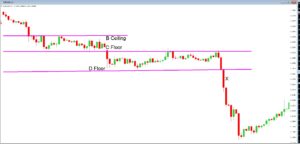

Again, price action returns to a consolidation or sideways momentum, until, eventually, at candlestick marked X – a series of strong bearish candlesticks form another breakout to the downside. Had we entered a short trade at the first breakout to the downside in example A, we could have realised a profit of over 180 pips.
An important lesson to learn from this section is that breakouts often occur when price action punches through floors and ceilings, and which are also known as levels of support, being the floor, and resistance being the ceiling.
So keep an eye out for possible breakouts and especially at key technical levels when support and resistance levels begin to fail. They will be far stronger in momentum after extended periods of consolidation.