Introduction
The global macro analysis of the NZD/USD pair will involve the endogenous and exogenous analyses of the US and New Zealand economies. The endogenous analysis will focus on domestic macroeconomic factors that drive the economy. The exogenous analysis will focus on economic indicators that comprehensively compare both the US and New Zealand economies.
Ranking Scale
Both the endogenous and exogenous factors will be ranked on a scale of -10 to +10. A negative ranking for the endogenous means that the factor had a negative impact on either the currency, while a positive ranking had a bullish impact on the currency.


Similarly, when the exogenous factor is negative, it has a bearish impact on the currency pair, while a positive ranking means it had a bullish impact.
Summary – USD Endogenous Analysis

From the above table, a clear deflationary effect can be seen on the USD currency and implies that USD has depreciated in its value since the beginning of 2020. For the complete USD Endogenous Analysis, please check here.
Summary – NZD Endogenous Analysis
The NZD endogenous analysis has a total score of 4. This shows that the NZD appreciated in 2020.
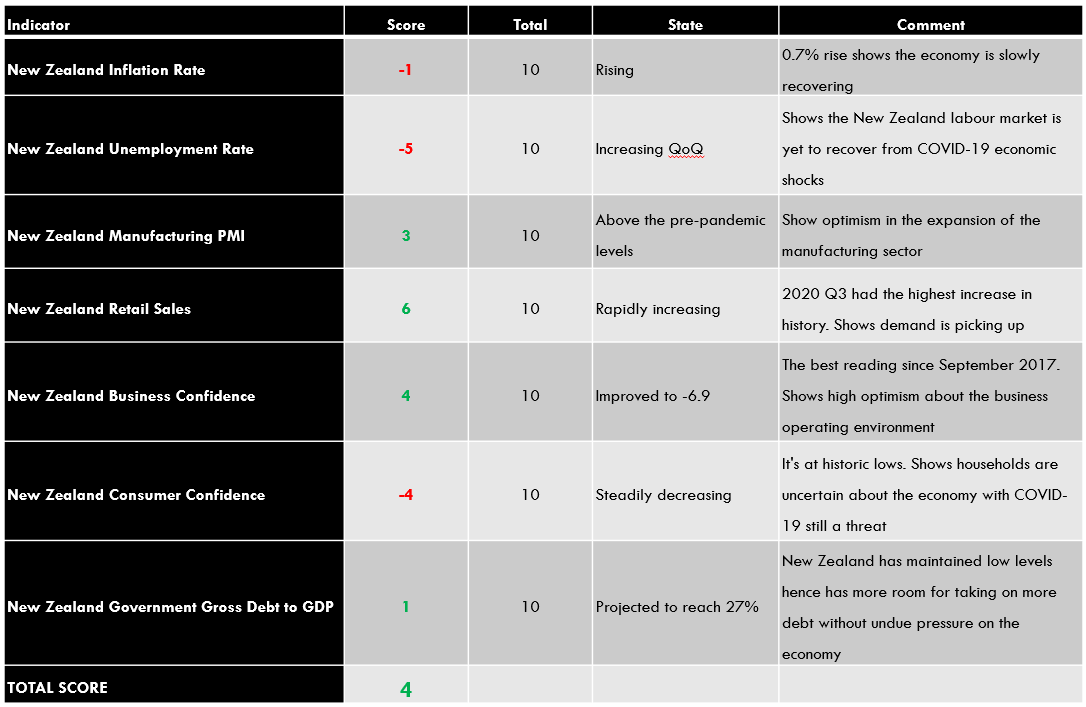
- New Zealand Inflation Rate
The CPI is the most commonly used measure of inflation in New Zealand. Here are the top categories included in the CPI: Housing with a weight of 24.2%; food and non-alcoholic drinks 18.8%; transportation 15%; recreation 9.4%; alcoholic drinks 7%; clothing, household goods and services, health, and education all have a combined weight of 18.2%.

In September 2020, New Zealand CPI increased by 0.7%. Based on the correlation with the GDP, we assign a score of -1.
- New Zealand Unemployment Rate
This rate shows the number of New Zealand’s working population out of work and actively looking for gainful employment. As an economic indicator, it can be used to show the economy’s ability to add new jobs to the market.
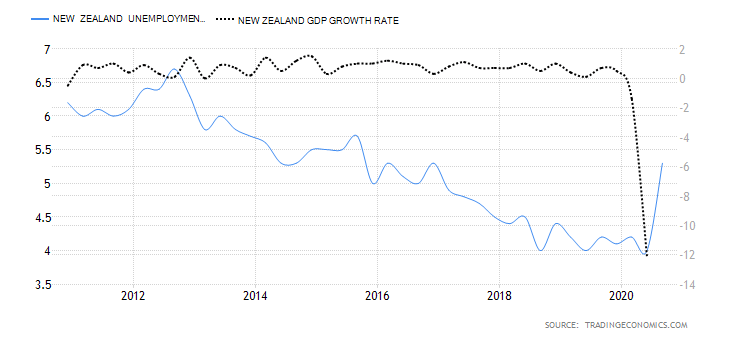
In Q3 of 2020, the New Zealand unemployment rate increased to 5.3% from 4% in Q2. This shows that the labor market is yet to recover from the economic shocks of the coronavirus pandemic. Based on correlation analysis, we assign a score of -5.
- New Zealand Manufacturing PMI
This is an index that measures the growth in the manufacturing sector in New Zealand. It is a composite of new orders, employment, inventories, and orders delivered from the manufacturing sector. When the index is above 50, it means that the manufacturing sector in New Zealand is expanding. The sector is seen to be contracting when the index is below 50.

In October 2020, the index declined to 51.7 from 54. However, the index is above the pre-coronavirus levels. That implies the manufacturing sector is recovering swiftly. Based on the correlation analysis with GDP, we assign it a score of 3.
- New Zealand Business Confidence
In any economy, business confidence goes hand-in-hand with business confidence. In New Zealand, the business confidence index is based on a survey of about 700 businesses. The index is the difference between the number of businesses that anticipate economic improvements and those that expect the economic conditions will decline. The index covers export intentions, profit expectations, employment intentions, activity outlook, and capacity utilization.

In November 2020, the ANZ Business Confidence was -6.9 compared to -15.7 in October. Although in the negative territory, the November reading is the highest since September 2017. This shows that more businesses are becoming optimistic about the future operating environment, mostly thanks to the aggressive expansionary monetary and fiscal policies.
Based on correlation analysis with the GDP, we assign ANZ business confidence a score of 4.
- New Zealand Retail Sales
In New Zealand, retail sales data is aggregated quarterly. It measures the change in the value of goods and services purchased by households. Remember that consumer expenditure is the main driver of economic growth, which makes the retail sales data a leading indicator of GDP growth.
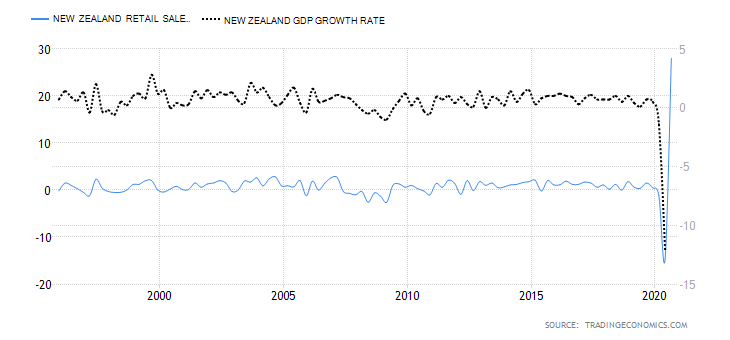
In Q3 of 2020, the New Zealand retail sales increased by 28% from a drop of 14.6% and 1.2% in Q2 and Q1, respectively. The 28% increase is the largest quarterly increase in 25 years. The YoY retail sales increased by 8.3% in Q3 compared to a 14.2% drop in Q2. Based on our correlation analysis, we assign the New Zealand retail sales a score of 6.
- New Zealand Consumer Confidence
In New Zealand, consumer confidence tends to correlate with households’ willingness to spend in the economy. The Westpac McDermott Miller Consumer Confidence Index gauges the optimist of New Zealand households regarding the economy. The index covers households’ views on their finances, purchases in the economy, and the overall economy.
A score of above 100 shows an increasing level of optimism, while below 100 shows increasing pessimism.
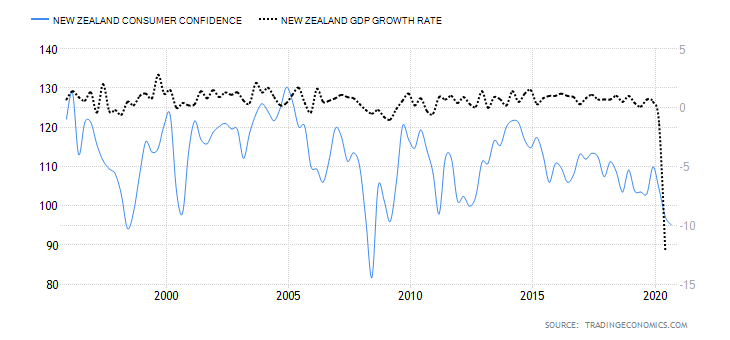
In Q3 of 2020, the New Zealand consumer confidence index dropped to 95.1 from 97.2 in Q2 and 104.2 in Q1. Q3 reading is the lowest in New Zealand since 2008. Based on its correlation with GDP, we assign a score of -4.
- New Zealand Government Net Debt to GDP
Gross national Debt to GDP helps both local and foreign creditors gauge a country’s ability to service its debt. This indicator shows the level at which the domestic economy is leveraged. A lower ratio is preferable since it means that the country has a higher GDP compared to its debt. This means that it can be able to access cheap debt in the future.
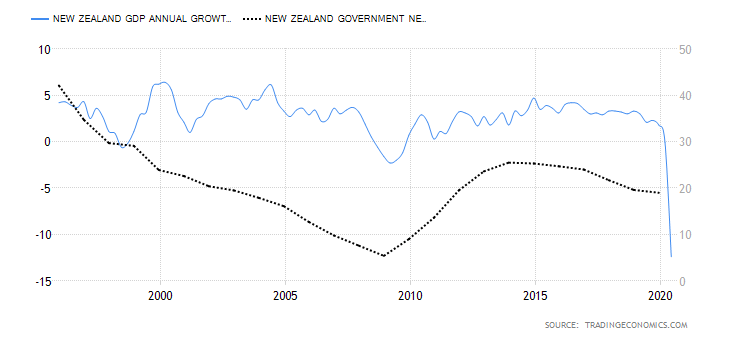
In the 2018/2019 fiscal year, the New Zealand government debt to GDP dropped to 19% from 19.6% in the 2017/2018 fiscal year. In 2020, the New Zealand government debt to GDP is projected to increase to 27% on account of the government’s aggressive spending to ease the economic pressure from the coronavirus pandemic. Based on correlation analysis with GDP, we assign New Zealand government debt to GDP a score of 1.
In the very next article, let’s analyze the exogenous indicators and forecast if this currency pair seems to be bullish or bearish in the near future.