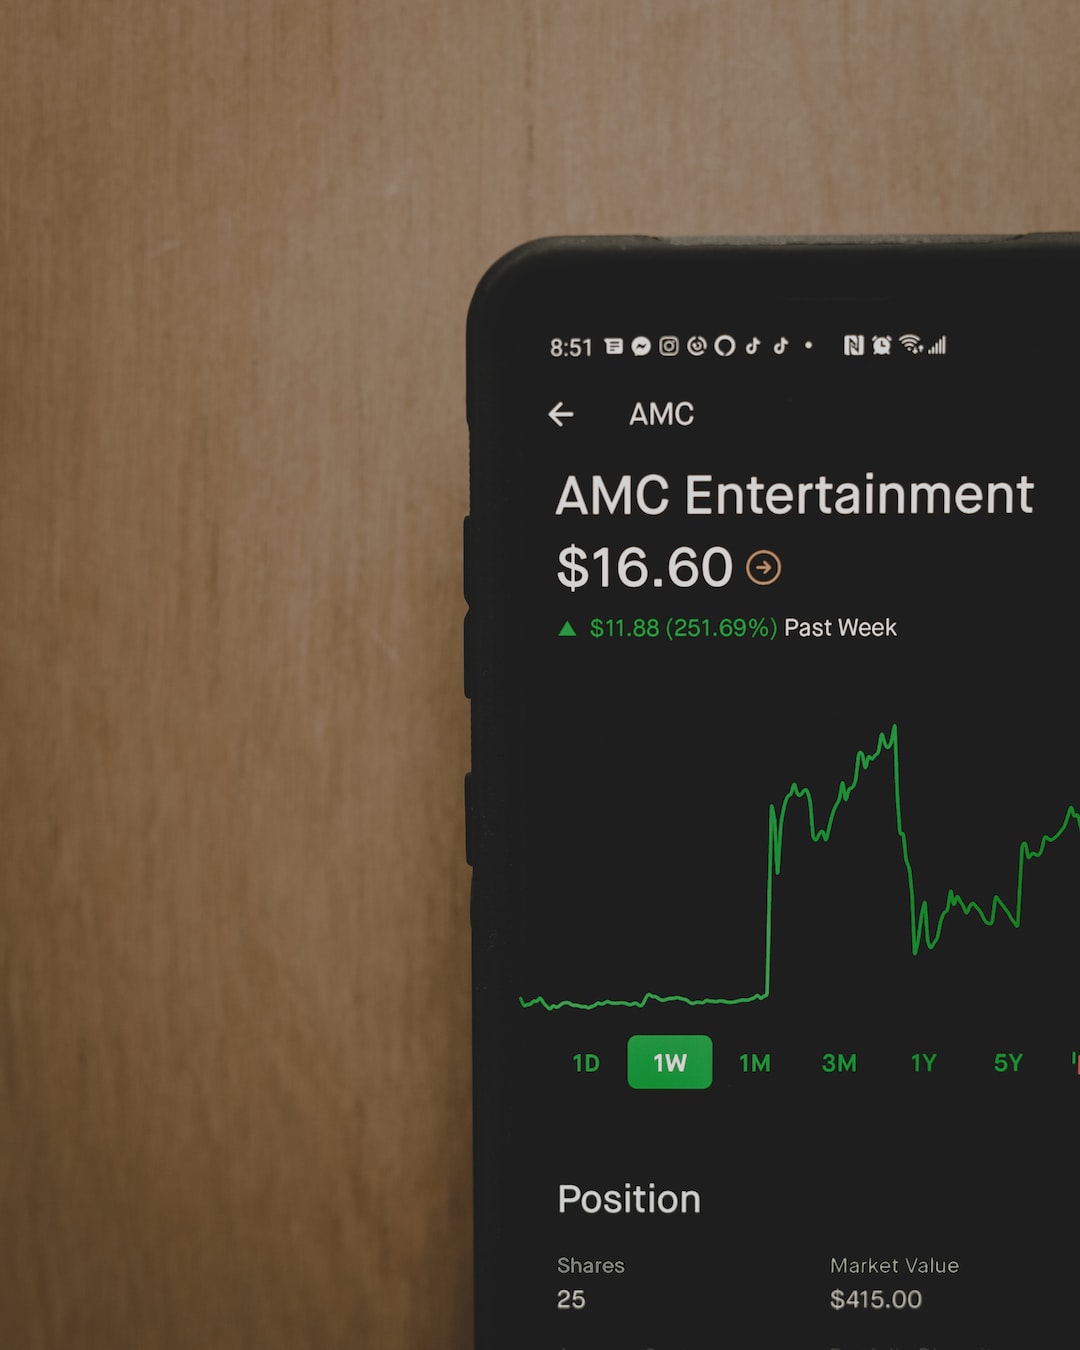
Forex trading can be a highly lucrative venture, but it requires a lot of skill and experience. One of the most important skills that a forex trader must possess is the ability to identify the highs and lows of the day. This is because these highs and lows are critical indicators of the market trend, and they can help traders make informed trading decisions. In this article, we will explore in-depth how to spot the highs and lows of the day in forex.
What are Highs and Lows?
Highs and lows are the highest and lowest points in the price of a currency pair during a particular trading day. These points are key indicators of market sentiment, and they provide traders with valuable information about the market trend. A high is the highest point reached by a currency pair during a trading day, while a low is the lowest point reached by the currency pair during the same trading day.
Why are Highs and Lows Important?
As mentioned earlier, highs and lows are important indicators of market sentiment. They provide traders with information about the strength of the market trend, and they can help traders make informed trading decisions. For instance, if the market is experiencing a bullish trend, traders can use the highs and lows to identify potential trade entry and exit points. Conversely, if the market is experiencing a bearish trend, traders can use the highs and lows to identify potential trade entry and exit points.
How to Spot Highs and Lows in Forex
There are several ways to spot highs and lows in forex. Some of these methods include:
1. Candlestick Charts
Candlestick charts are one of the most popular tools used by forex traders to spot highs and lows. These charts provide traders with valuable information about the price movement of a currency pair, and they are highly effective in identifying market trends. On a candlestick chart, the high is represented by the upper shadow, while the low is represented by the lower shadow. The body of the candlestick represents the opening and closing prices of the currency pair.
2. Line Charts
Line charts are another popular tool used by forex traders to spot highs and lows. These charts provide a simple representation of the price movement of a currency pair, and they can be used to identify key support and resistance levels. To spot highs and lows using a line chart, traders need to draw horizontal lines at the highest and lowest points of the currency pair during the trading day.
3. Bar Charts
Bar charts are similar to candlestick charts, but they provide a more simplified representation of the price movement of a currency pair. On a bar chart, the high is represented by the top of the vertical line, while the low is represented by the bottom of the line. The opening and closing prices of the currency pair are represented by the horizontal lines on each side of the vertical line.
Conclusion
In conclusion, spotting highs and lows is an essential skill that every forex trader must possess. These indicators provide traders with valuable information about the market trend, and they can help traders make informed trading decisions. The most popular tools used to spot highs and lows include candlestick charts, line charts, and bar charts. By mastering these tools, traders can increase their chances of success in the forex market.


