Description
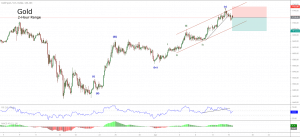
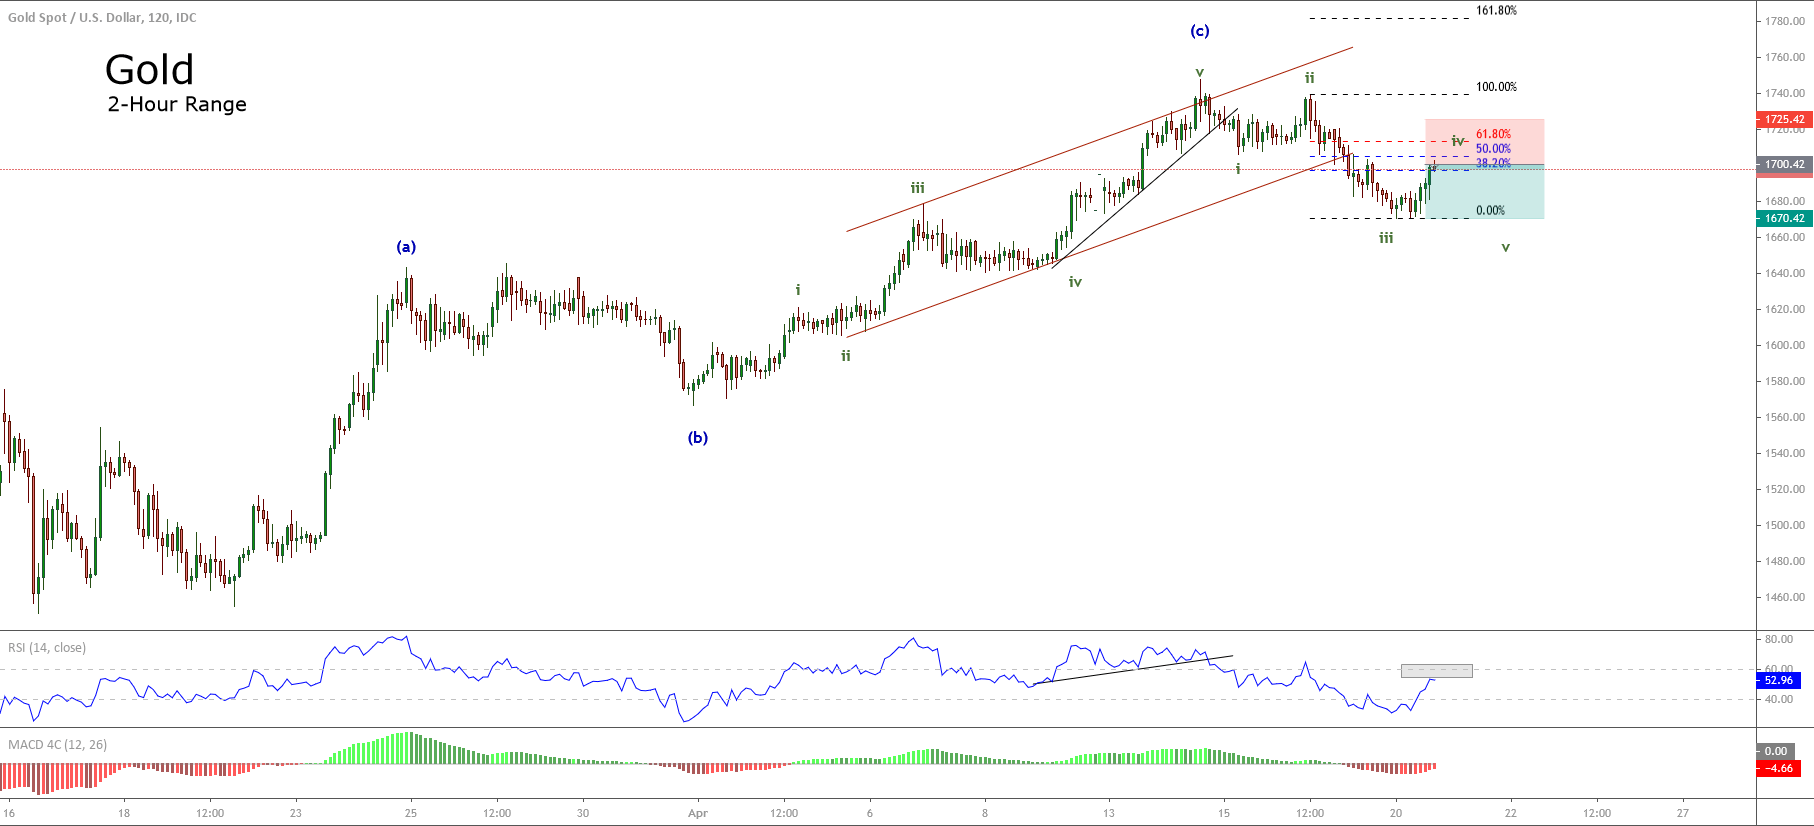
Gold, in its 2-hour chart, shows an intraday recovery after the bearish sequence started on April 14th when the price found sellers at $1,747.47 per ounce.
Once the price soared above the upper line of the ascending channel and sellers pulled-down the precious metal, Gold began to develop a downward movement. This sequence looks like the third wave of Subminuette degree identified in green.

If our intraday analysis is correct, the recovery observed on Monday’s session should reach the zone between 38.2% and 50% of the third wave.
On the other hand, the RSI oscillator bounced and didn’t surpass the level 60, which make us foresee further declines.
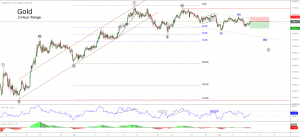
The sell-side position will activate at the psychological level at $1,700 per ounce. As a conservative scenario, we expect a re-test of the previous low at $1,670, which would correspond to the fifth wave of Subminuette degree in green.
Finally, our bearish setup will be invalid if the price soars and closes above $1,725 per ounce.
Chart

Trading Plan Summary
- Entry Level: $1,700
- Protective Stop: $1,725
- Profit Target: $1,670
- Risk/Reward Ratio: 1.2
- Position Size: 0.01 lot per $1,000 in account.