Introduction
The global macro analysis of the EUR/JPY forex pair will involve the analysis of endogenous and exogenous economic factors. The endogenous analysis will cover indicators that drive economic growth in the EU and Japan. Exogenous factors will cover the analysis of factors that impact the exchange rate between the Euro and the Japanese Yen.
Ranking Scale
We will use a scale of -10 to +10 to rank the impact of these factors. When the endogenous factors are negative, it implies that they resulted in the depreciation of the local currency. a positive ranking implies that they led to an increase in the value of the domestic currency. The ranking of the endogenous factors is determined by their correlation with the domestic GDP growth.

When the exogenous factors get a negative score, it means they have a bearish impact on the EUR/JPY pair. A positive score implies they’ve had a bullish impact. The ranking of the exogenous factors is determined by their correlation to the exchange rate of the EUR/JPY pair.
EUR Endogenous Analysis – Summary
The endogenous analysis of the EUR has an overall score of -3. Based on the factors we have analyzed, we can expect that the Euro had marginally depreciated in 2020.

JPY Endogenous Analysis – Summary
A score of -12 implies a strong deflationary effect on the JPY currency pair, and we can conclude that this currency has depreciated this year.
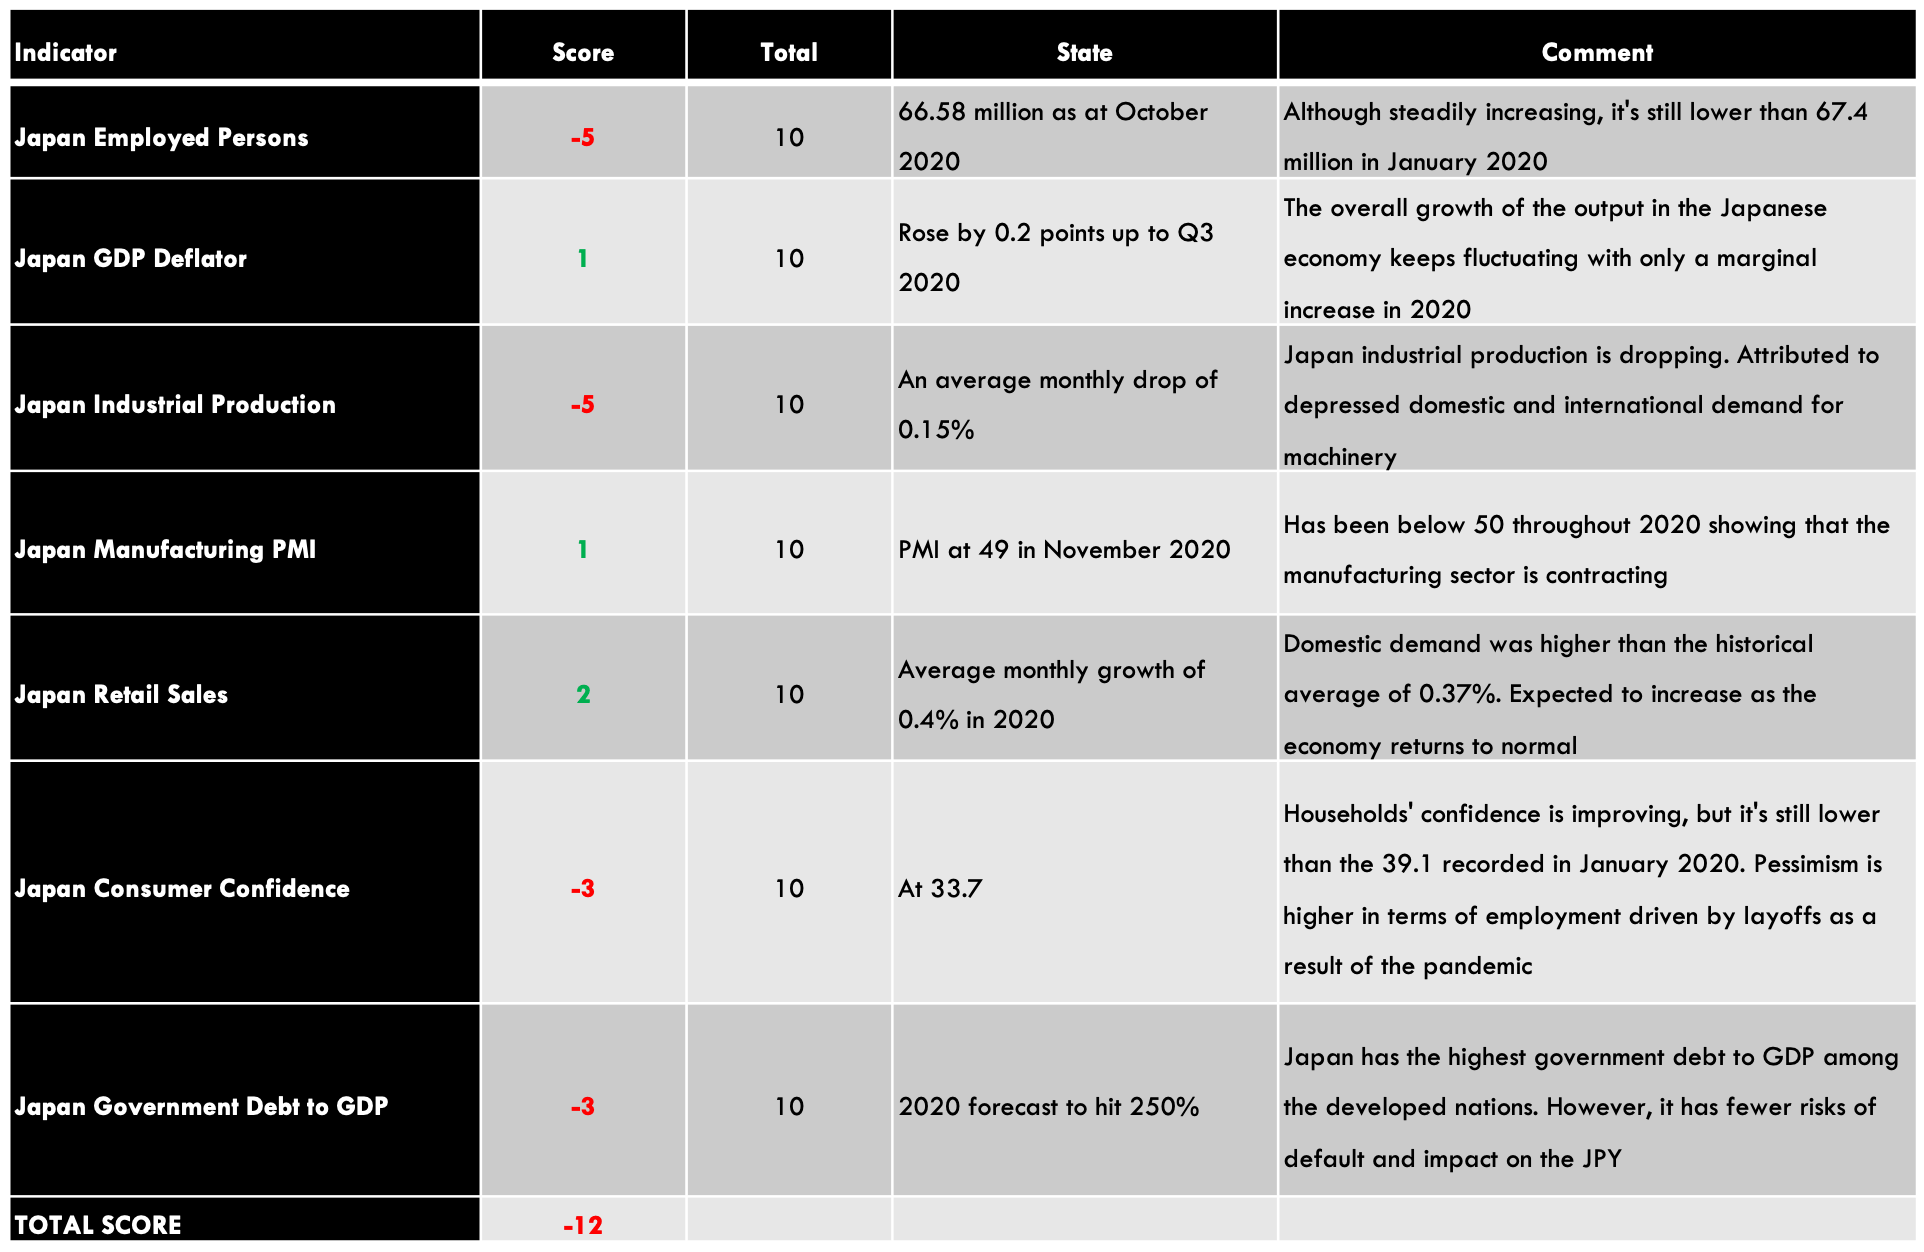
- Japan Employed Persons
This indicator measures the changes in the number of workers over a particular period. It only tracks the section of the labor force that has attained the minimum working age. Changes in the labor market are seen as leading indicators of economic development.
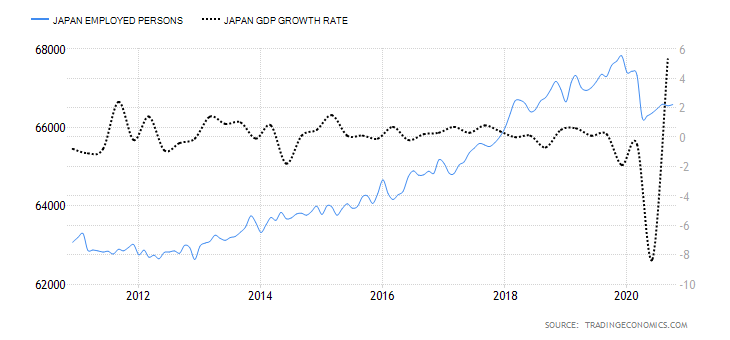
In October 2020, the number of employed persons in Japan increased to 66.58 million from 66.55 million in September. The number of employed persons in Japan is still lower than the 67.4 million recorded in January. We assign a score of -5.
- Japan GDP Deflator
The GDP deflator is used to measure the comprehensive changes in the overall inflation of the Japanese economy. Since it measures the price changes of the entire economic output, it is used as a key predictor of future monetary and fiscal policies. An increase in GDP deflator means that the economy is expanding, which may lead to the appreciation of the JPY.
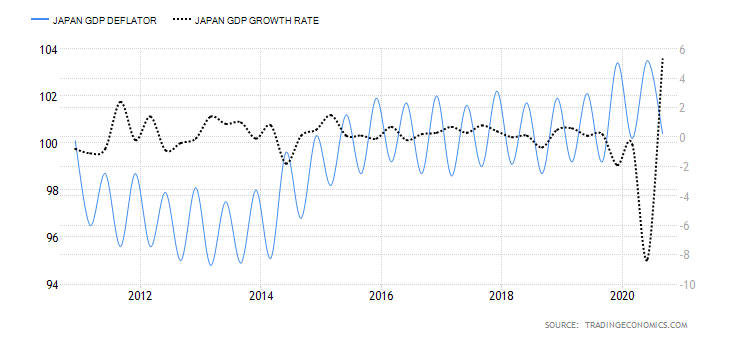
In Q3 of 2020, the Japan GDP deflator dropped to 100.4 from 103.5 in Q2. Up to Q3, the Japan GDP deflator has marginally increased by 0.2 points. We assign a score of 1.
- Japan Industrial Production
This indicator covers the changes in the output value of mining, manufacturing, and utility sectors. The Japanese economy is highly industrialized. The industrial sector contributes approximately 33% of the GDP. That means the GDP growth rate in Japan is sensitive to the changes in industrial production.
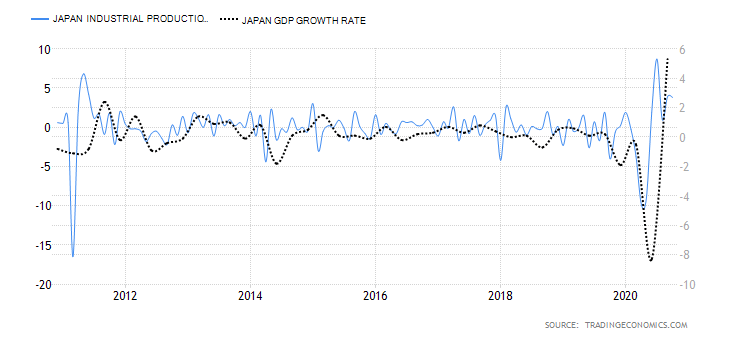
The MoM industrial production in Japan increased by 3.8% in October 2020 while the YoY dropped by 3.2% – the slowest since February 2020. On average, the MoM industrial production in Japan is -0.15%. We assign a score of -5.
- Japan Manufacturing PMI
About 400 large manufacturers are surveyed monthly by The Jibun Bank. These manufacturers are classified according to the sector of operations, their workforce size, and contribution to GDP. The overall manufacturing PMI is an aggregate of employment, new orders, inventory, output, and suppliers’ deliveries. The Japanese manufacturing sector is seen to be expanding when the PMI is above 50 and contracting when below 50.
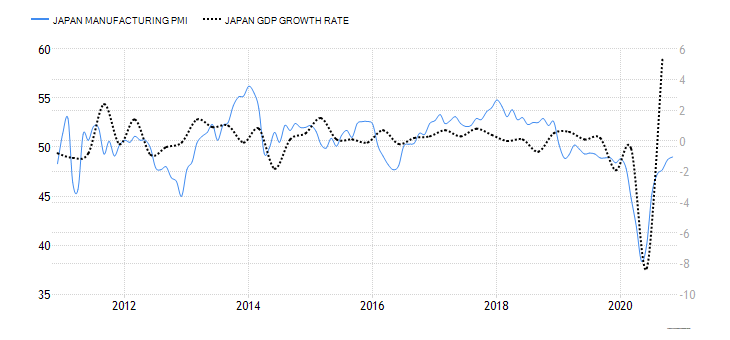
In November 2020, the Japan Manufacturing PMI was 49 compared to 48.7 in October. The November reading is almost at par with the January levels. We assign a score of 1.
- Japan Retail Sales
The retail sales measure the change in the monthly purchase of goods and services by Japanese households. Since it is a leading indicator of consumer demand and expenditure, it is best suited to gauge possible economic contractions and expansions.
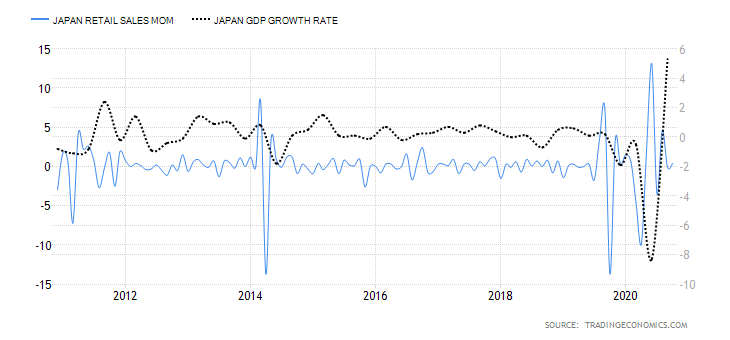
In October 2020, Japan retail sales rose by 0.4% from 0.1% recorded in September. YoY retail sales increased by 6.4%, which marks the first month of increase since February 2020. The growth of retail sales is mainly attributed to an increase in motor vehicle sales, machinery and equipment, and medicine & toiletry. On average, the first ten months of 2020 have had a 0.4% increase in MoM retail sales. Thus, we assign a score of 2.
- Japan Consumer Confidence
This is a monthly survey of about 4700 Japanese households with more than two people. The survey covers the households’ opinion on the overall economic growth, personal income, employment, and purchase of durable goods. An index of above 50 shows that the households are optimistic, while below 50 shows that they are pessimistic.

In November 2020, Japan’s consumer confidence was 33.7 – the highest recorded since March. It is, however, still lower than the pre-pandemic levels of 39.1. We assign a score of -3.
- Japan General Government Gross Debt to GDP
Prospective domestic and international lenders use the government debt to GDP ratio to determine the ability of an economy to sustain more debt. Among the developed nations, Japan has the highest government debt to GDP ratio. However, it has minimal risk of default since most of the debt is domestic and denominated in Japanese Yen, which poses a low risk of inflating the domestic currency in the international market.

In 2019, the general government gross debt to GDP in Japan was 238%, up from 236.6% in 2018. In 2020, it was projected to hit a maximum of 250%. We assign a score of -3.
In our upcoming article, we have performed an Exogenous analysis of the EUR/JPY Forex pair and gave our optimal forecast. Make sure to check that out. Cheers.