The cryptocurrency market had quite a slow day with sideways movements. Bitcoin is currently trading for $9,206, which represents a decrease of 0.59% on the day. Meanwhile, Ethereum lost 0.53% on the day, while XRP lost 0.95%.
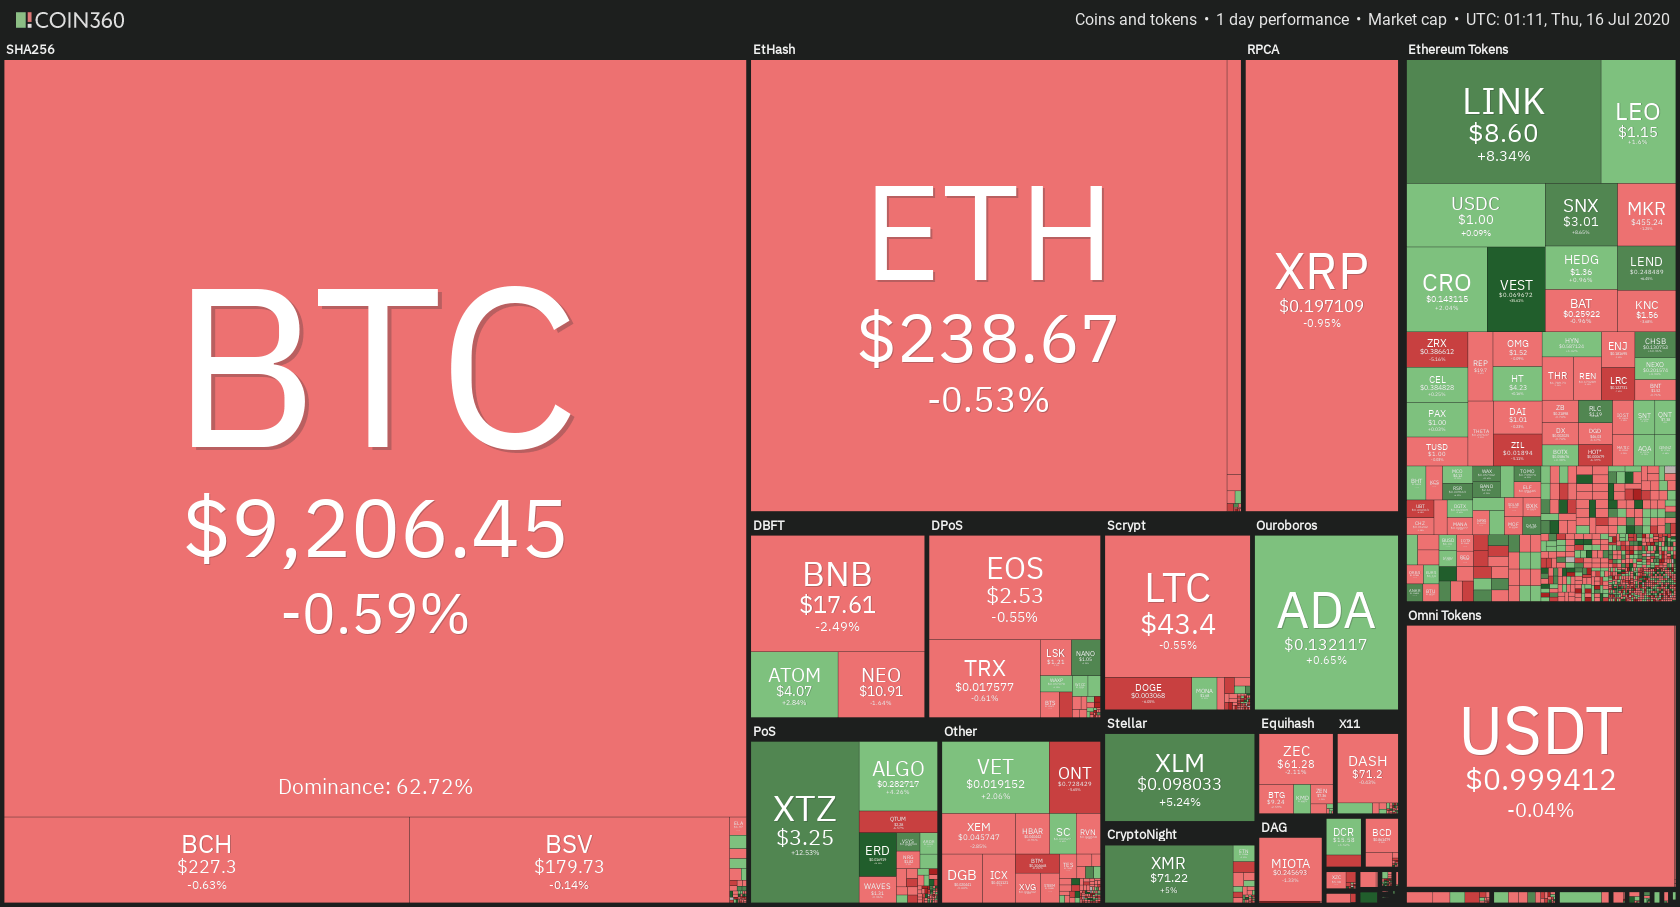

Daily Crypto Sector Heat Map
When talking about top100 cryptocurrencies, Elrond gained 14.90% on the day, making it by far the most prominent daily gainer. Syntherix Network (12.31%) and iExec RLC (11.07%) also did great. On the other hand, Bytom has lost 8.57%, making it the most prominent daily loser. It is followed by Nervos Network’s loss of 8.39% and Divi’ loss of 8.38%.
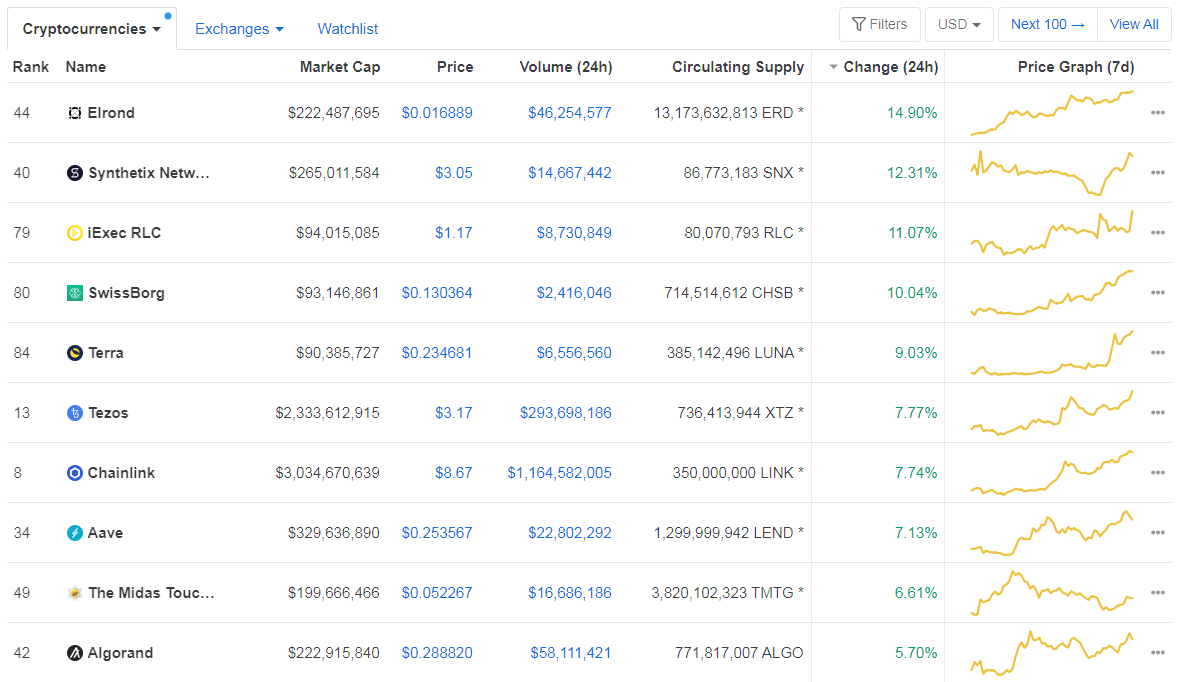
Top 10 24-hour Performers (Click to enlarge)
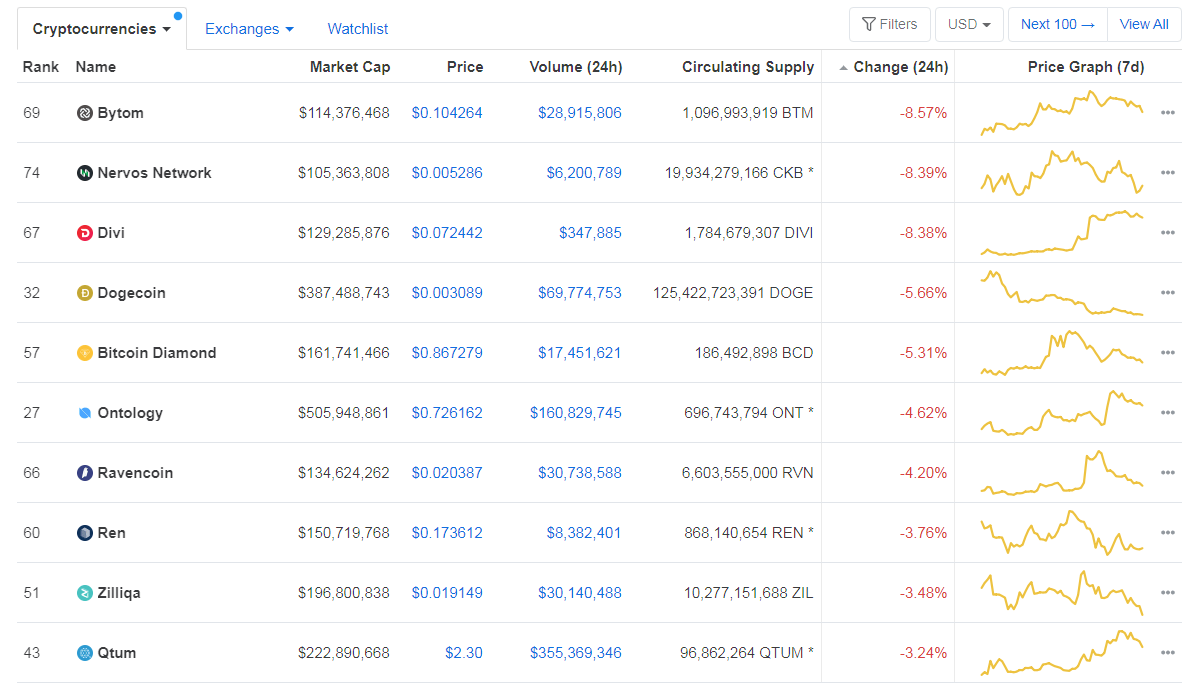
Bottom 10 24-hour Performers (Click to enlarge)
Bitcoin’s dominance level decreased slightly since we last reported, with its value currently at 62.72%. This value represents a 0.28% difference to the downside when compared to yesterday’s value.
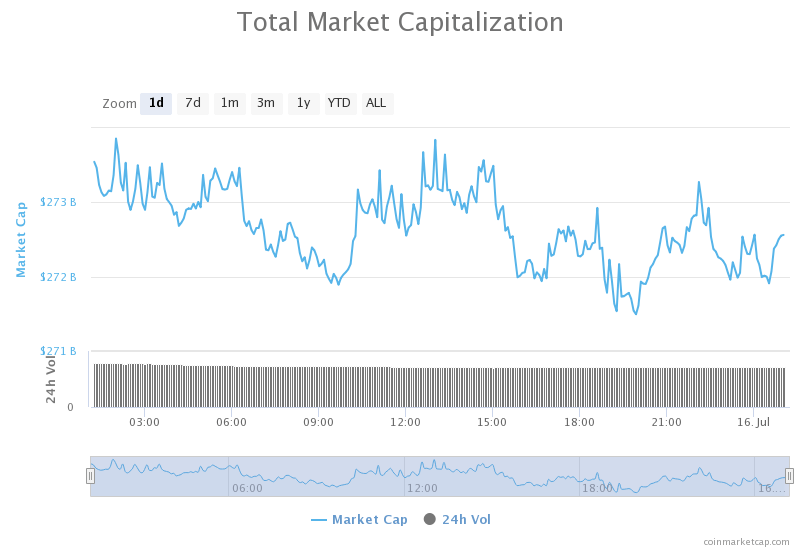
Daily Crypto Market Cap Chart
The cryptocurrency market capitalization didn’t change in valuation when compared to when we last reported, with the market’s current value being $272.53 billion. This value represents a decrease of $0.13 billion when compared to the value it had yesterday.
_______________________________________________________________________
What happened in the past 24 hours?
_______________________________________________________________________
- Unprecedented Twitter Breach: Barack Obama, Jeff Bezos, Joe Biden, Dozens of High-Profile Accounts Compromised in Bitcoin Giveaway Scam (Cryptobriefing)
- PayPal Confirms Cryptocurrency Integration Effort in Letter to E.U. (Cryptobriefing)
- Regulators Will Crush DeFi Unless It Becomes Truly Decentralized (Cryptobriefing)
- Ethereum Is Ready to Go Bullish According to These Indicators (Cryptobriefing)
- The Logbook: Coinbase asset listing and bitcoin dominance (The Block)
- As Alt Season Cranks Up, NEO Network Turns Heads (Cryptobriefing)
- Crucial Technical Index Predicts an Imminent Bitcoin Breakout (Cryptobriefing)
- Hong Kong Citizens Turn to Stablecoins to Resist National Security Law (Coindesk)
- Chinese Energy Supplier Deploys Blockchain Node in State-Run Network (Cointelegraph)
- IOTA Launches Chronicle, a Decentralized Storage Framework (Cryptobriefing)
_______________________________________________________________________
Technical analysis
_______________________________________________________________________
Bitcoin
The largest cryptocurrency by market capitalization had quite a slow day. Its price followed the descending resistance line throughout most of the day until it jumped slightly above it. However, the current move has insufficient strength to pass the $9,251 resistance level. On top of that, the upside is guarded by the 21 as well as 50-period moving averages.
BTC traders should look for a trade opportunity after the largest cryptocurrency passes $9,251, or fails to break it.
BTC/USD 4-hour Chart
Technical factors:
- Price is below its 50-period EMA and its 21-period EMA
- Price right below the middle B.B. (20-period SMA)
- RSI neutral (47.59)
- Average volume
Key levels to the upside Key levels to the downside
1: $9,251 1: $9,120
2: $9,580 2: $8,980
3: $9,735 3: $8,820
Ethereum
Ethereum also had a slow day, with its price dancing between $237.5 (where ETH seems to have found some form of support) and a $240 resistance level. The second-largest cryptocurrency by market capitalization might attempt to break $240 very soon, but such a move would need strong confirmation afterward to be completely valid.
Ethereum traders should look for an opportunity after the fight for $240 ends.
ETH/USD 4-hour Chart
Technical Factors:
- Price below the 50-period EMA and the 21-period EMA
- Price below the middle B.B. (20-period SMA)
- RSI neutral (47.81)
- Average volume
Key levels to the upside Key levels to the downside
1: $240 1: $228
2: $251.4 2: $225.4
3: $260 3: $218
Ripple
The third-largest cryptocurrency by market cap was trading sideways throughout the day, with its price being slightly below $0.2. The resistance level held up quite nicely, which brought XRP’s price down by a bit. However, even though it performed the worst out of the top3 cryptocurrencies in the past 24 hours, XRP’s price moved less than 1% in total.
XRP traders can look for an opportunity to trade when the volume increases, and the trend becomes clear enough, as the low volume and volatility are certainly not ideal for trading at the moment.
XRP/USD 4-hour Chart
Technical factors:
- XRP in a mid-term descending trend (though it broke the trend in the short-term)
- XRP lacks strong support levels below $0.178
- Price above 21-period and below the 50-period EMA
- Price right under the middle B.B. (20-period SMA)
- RSI is neutral (47.11)
- Volume lower than average
Key levels to the upside Key levels to the downside
1: $0.205 1: $0.2
2: $0.214 2: $0.19
3: $0.227 3:$0.178

Related posts