The majority of the cryptocurrencies ended up in the green as the cryptocurrency sector tried to consolidate after Bitcoin’s price discovery in the all-time high territory. Bitcoin is currently trading for $22.912, representing an increase of 3.96% compared to yesterday’s value. Meanwhile, Ethereum’s price has increased by 0.16% on the day, while XRP managed to gain 3.79%.


Daily Crypto Sector Heat Map
MobileGo gained 94.96% in the past 24 hours, making it the most prominent daily crypto gainer by far. It is followed by Puriever’s 85.99% and Tokes’ 85.09% gain. On the other hand, Basis Share lost 49.6%, making it the most prominent daily loser. It is followed by 3x Short Litecoin Token’s loss of 46.73% and Force For Fast’s loss of 42.92%.
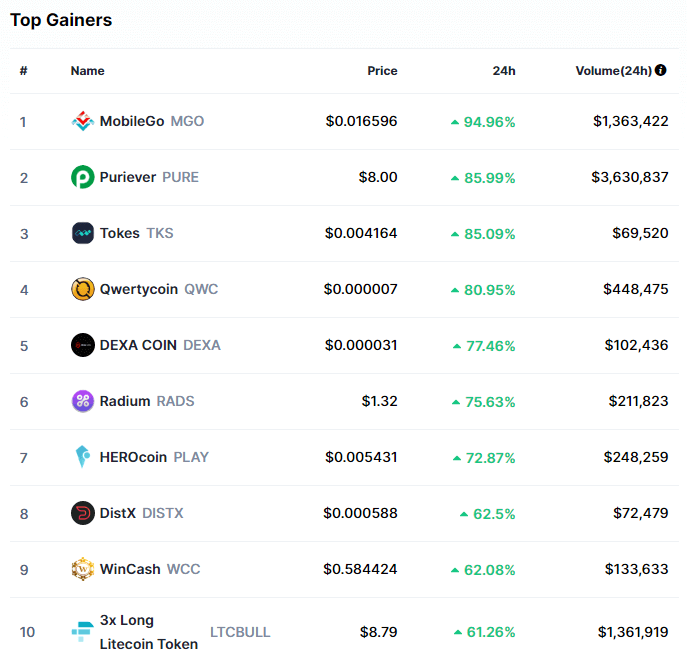
Top 10 24-hour Performers (Click to enlarge)
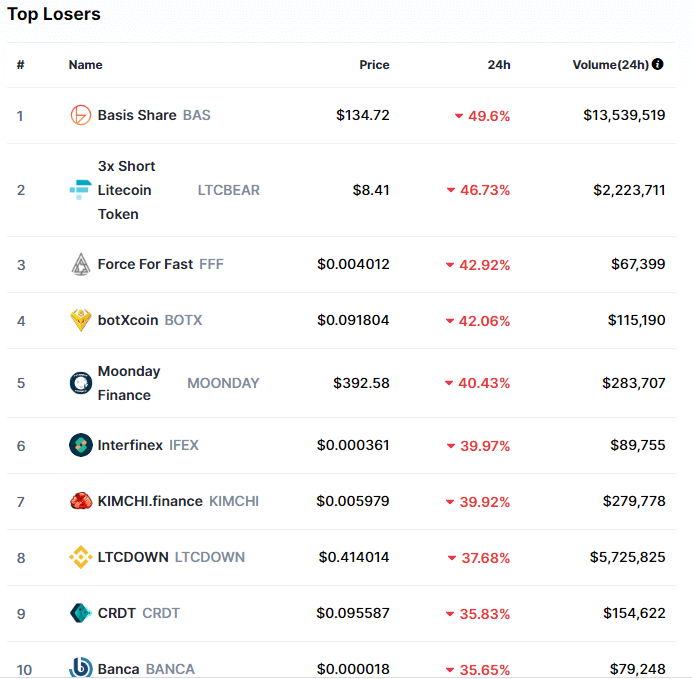
Bottom 10 24-hour Performers (Click to enlarge)
Bitcoin’s market dominance has moved up half a percent since our last report, with its value currently being 65.5%. This value represents a 0.5% difference to the upside than the value it had when we last reported.
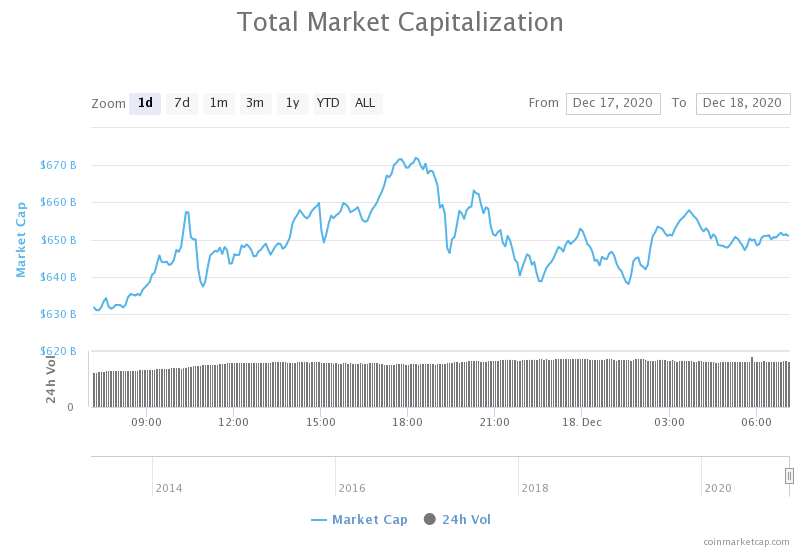
Daily Crypto Market Cap Chart
The cryptocurrency sector capitalization has increased since we last reported, with its current value being $651.01 billion. This represents a $17.07 billion increase when compared to our previous report.
_______________________________________________________________________
What happened in the past 24 hours?
_______________________________________________________________________
- Robinhood to pay $65 million to settle SEC charges (The Block)
- Coinbase files confidential S-1 ahead of potential IPO (The Block)
- Compound releases white paper for new cross-chain protocol (The Block)
- Grayscale CEO States He Is Bullish on Bitcoin (Cryptobriefing)
- XRP Primed for a Correction if its Crucial Support Fails (Cryptobriefing)
- Cardano announces integration with Wolfram Alpha to create a new type of oracle (Cryptoslate)
- Bitcoin is now at $23,000, but legacy funds are calling a move to $400k (Cryptoslate)
- More Than $1B Ether Staked on Ethereum 2.0 (Coindesk)
- Litecoin, Dogecoin and large-cap altcoins rally as Bitcoin price hits $23.8K (Cointelegraph)
- DeFi boom drives 1200% increase in DApp volume in 2020: Report (Cointelegraph)
_______________________________________________________________________
Technical analysis
_______________________________________________________________________
Bitcoin
Bitcoin has stopped its price discovery phase as it bounced off the $24,000 level and began consolidating. The largest cryptocurrency by market cap is currently fighting for the $23,000 level, a minor pivot point within a larger range bound by $24,000 to the upside and $22,050 to the downside.
At the moment, the Fib extension sitting at $22,055 is the most likely strong support level, while Bitcoin’s upside is open to new highs if the cryptocurrency passes $24,000, $23,315, and $24,500.
BTC/USD 2-hour chart
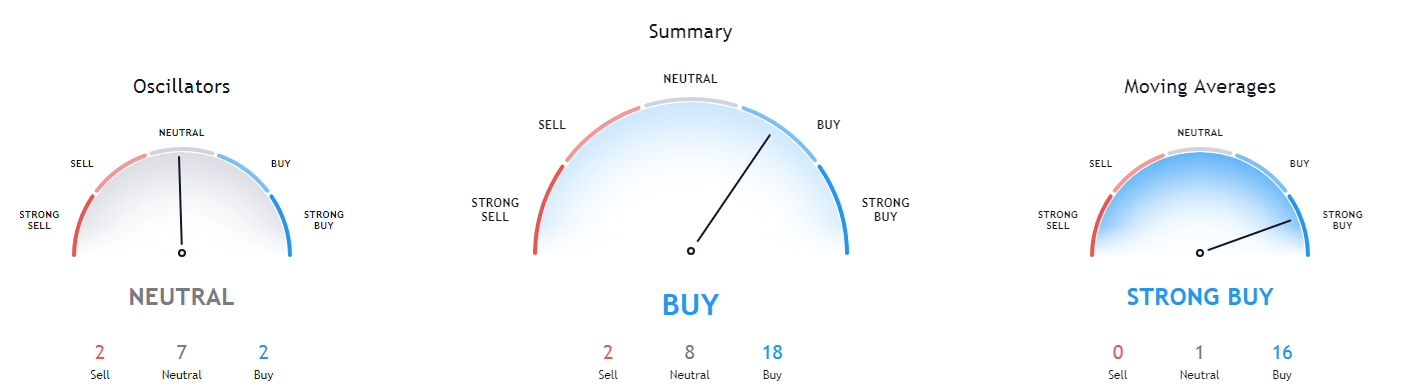
Bitcoin’s 4-hour and weekly overview are fully bullish, while its daily and monthly time-frames show slight neutrality on top of the overall bullishness.
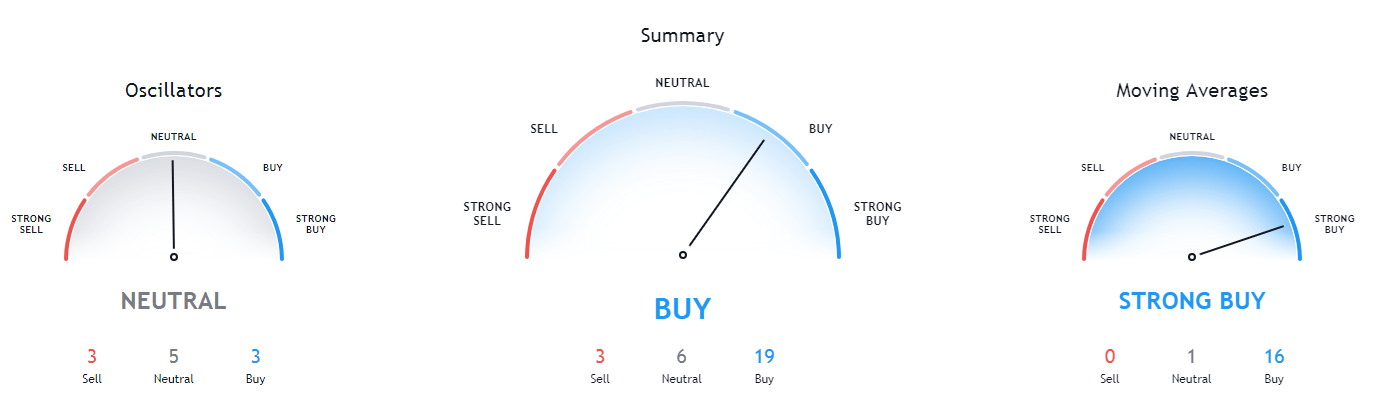
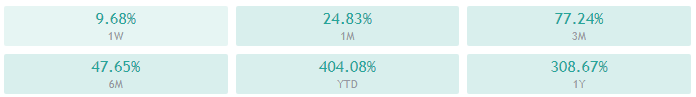
BTC/USD 1-day Technicals
Technical factors (4-hour Chart):
- Price is far above both its 50-period and its 21-period EMA
- Price slightly below its top Bollinger band
- RSI is heavily overbought (80.71)
- Volume is far higher than its average levels
Key levels to the upside Key levels to the downside
1: $24,315 1: $22,054
2: $24,700 2: $21,350
3: $25,511 3: $19,918
Ethereum
Ethereum has, just like Bitcoin, hit a wall in its price ascension, triggering a pullback from the highs of $675. The second-largest cryptocurrency by market cap quickly fell to its immediate support level, which sits at $632. This level held up nicely, and Ethereum is now on a slow rise after confirming the support level.
An important thing to note is that Ethereum is very far from reaching its all-time high. It might be a good value investment simply because of its potential to increase its price faster than Bitcoin.
ETH/USD 2-hour Chart
Ethereum’s 4-hour and monthly overview are fully bullish, while its daily and weekly time-frames show slight neutrality on top of the overall bullishness.
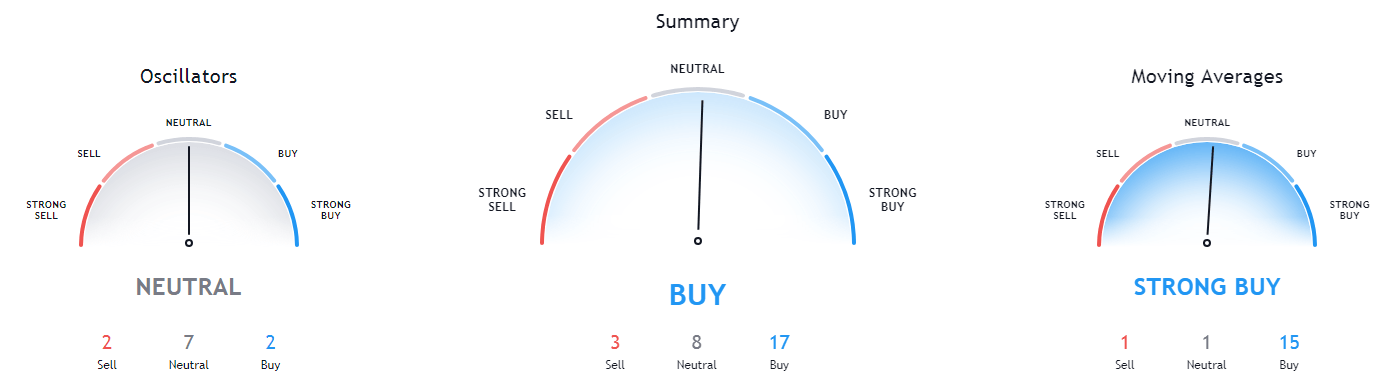
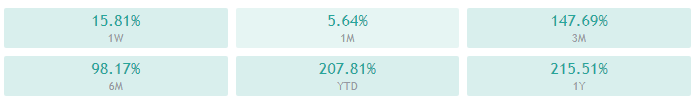
ETH/USD 1-day Technicals
Technical Factors (4-hour Chart):
- Price is far above both its 50-period and its 21-period EMAs
- Price is between its middle and top Bollinger band
- RSI has barely left the overbought territory (67.29)
- Volume is much higher than its weekly average but is descending
Key levels to the upside Key levels to the downside
1: $675 1: $632
2: $738.5 2: $600
3: $817.5 3: $581
Ripple
XRP was the cryptocurrency that experienced the largest gains out of the three cryptocurrencies we cover daily. The fourth-largest cryptocurrency by market cap couldn’t break a high of $0.597 with conviction (though the price briefly went as high as $0.656), which triggered a correction to its $0.57 support level. After confirming this level as strong support, XRP continued its path towards the upside and slowly started increasing in price. It is currently contesting the $0.597 level once again.
XRP/USD 2-hour Chart
XRP’s 4-hour and monthly overview are fully bullish, while its daily and weekly time-frames show slight neutrality on top of the overall bullishness.
XRP/USD 1-day Technicals
Technical factors (4-hour Chart):
- Its price is currently above both its 50-period EMA and its 21-period EMA
- Price slightly below its top Bollinger band
- RSI is nearing the overbought territory (63.71)
- Volume is well above its average level, thought descending
Key levels to the upside Key levels to the downside
1: $0.597 1: $0.57
2: $0.63 2: $0.543
3: $0.66 3: $0.5

Related posts