


The crypto market had a good weekend, with almost every single top cryptocurrency ending up in a net gain. Bitcoin is currently trading for $11,664, which represents an increase of 0.66% on the day. Meanwhile, Ethereum gained 4.42% on the day, while XRP gained 2.19%.
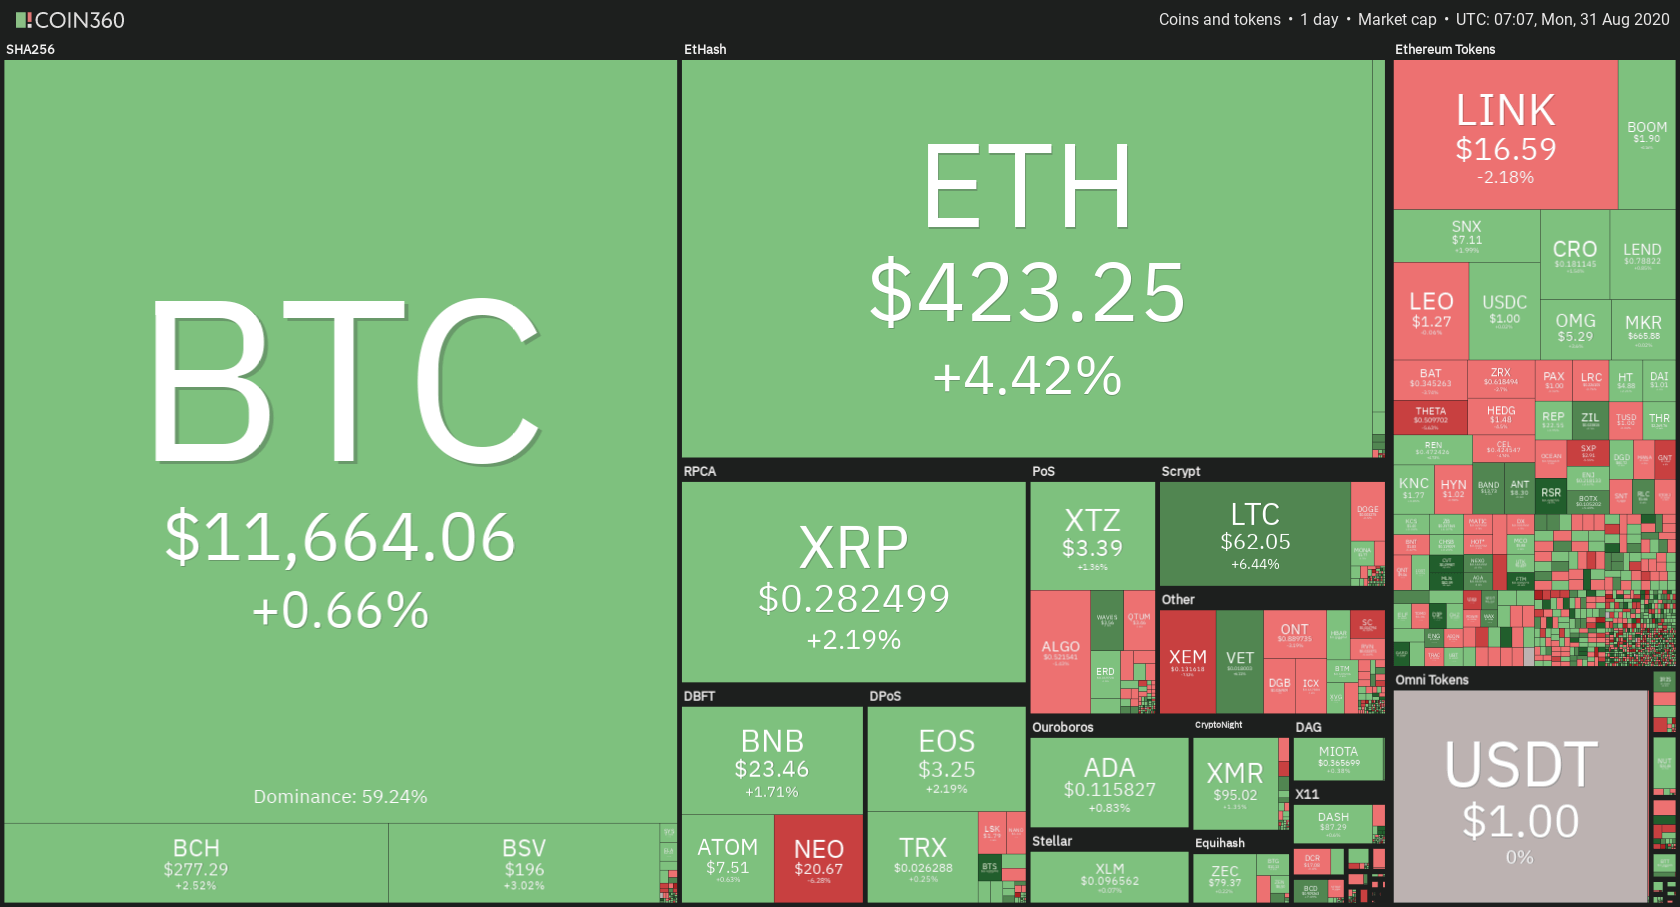

Daily Crypto Sector Heat Map
When taking a look at top100 cryptocurrencies, UMA gained 48.99% on the day, making it the most prominent daily gainer. Flexacoin (27.54%) and bZx Protocol (26.08%) also did great. On the other hand, DFI.Money lost 17.06%, making it the most prominent daily loser. It is followed by Golem’s loss of 10.16% and NEM’s drop of 7.06%.
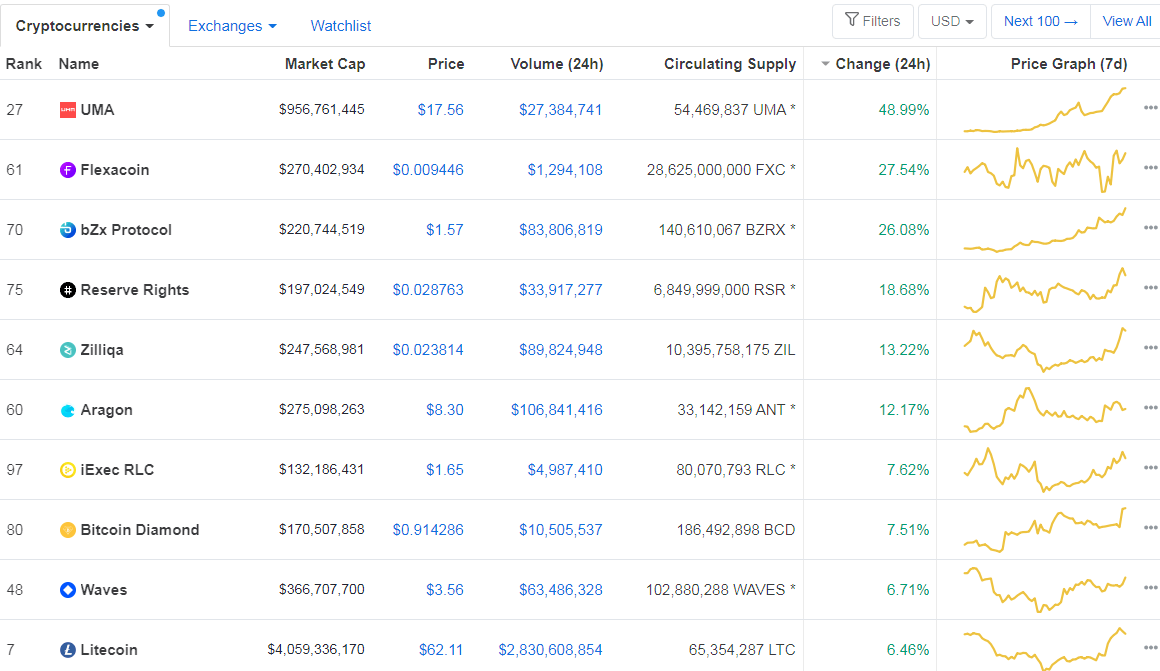
Top 10 24-hour Performers (Click to enlarge)
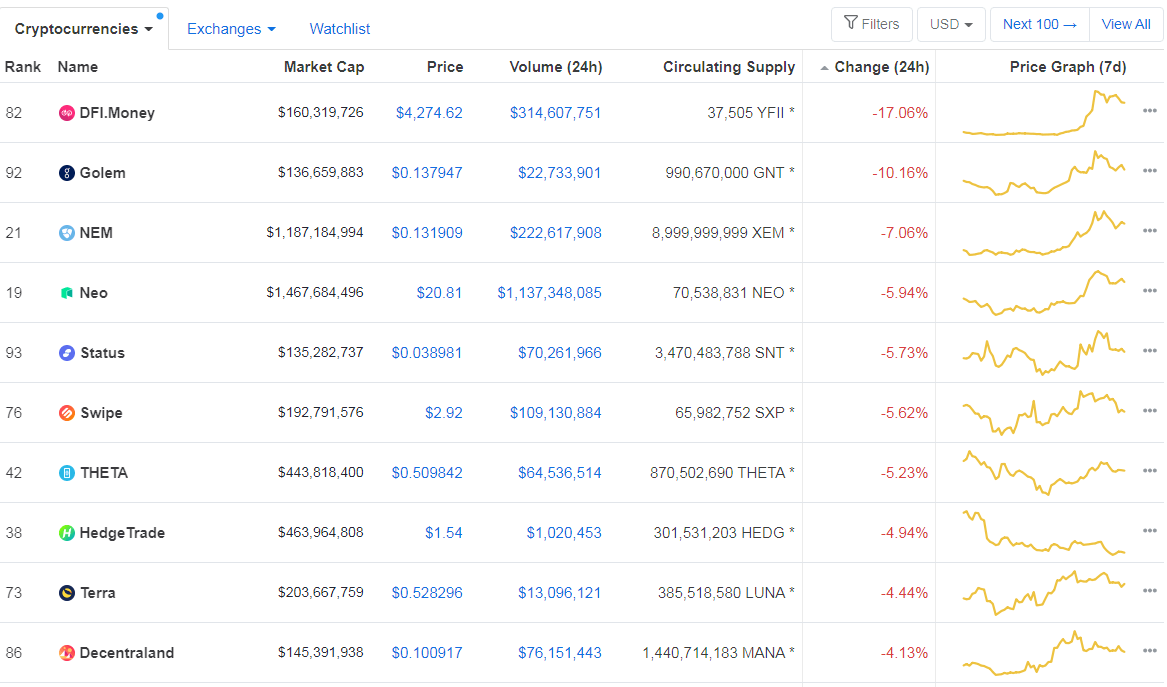
Bottom 10 24-hour Performers (Click to enlarge)
Bitcoin’s dominance level has gone down quite a bit over the weekend and dropped below the 60% mark. Its value is currently at 59.24%, represents a 1.82% difference to the downside when compared to our last report.
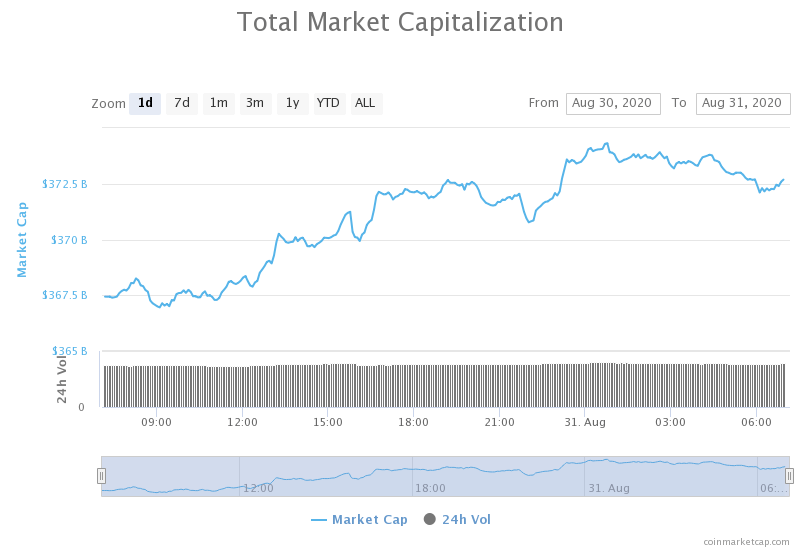
Daily Crypto Market Cap Chart
The crypto market cap has increased significantly over the course of the weekend. Its current value is $372.72 billion, which represents an increase of $19.24 billion when compared to our previous report.
_______________________________________________________________________
What happened in the past 24 hours?
_______________________________________________________________________
- Ethereum Classic Hit by Third 51% Attack in a Month (Coindesk)
- BitMEX CEO Arthur Hayes outlines four risks in Ethereum’s DeFi “proto-banks” (Cryptoslate)
- Crypto community celebrates as CNBC includes Bitcoin in Jerome Powell speech coverage (Cryptoslate)
- Fed’s Inflation Target Is Good for Bitcoin, But Investors Will Have to Wait (Cryptobriefing)
- yEarn Finance Is Turning Every DeFi Trader into a Whale (Cryptobriefing)
- Crypto.com Pay Now Powers CRO Payments From Any ERC-20 Wallet (Cryptobriefing)
- IRS memo: Cryptocurrency earned from a microtasking job is taxable income (The Block)
- FTX’s Serum goes live as DEXs end another record-breaking month for volume (The Block)
- Synthetix (SNX) surpasses $1B TVL as DeFi investor interest grows (Cointelegraph)
- Cloudflare goes down; crypto websites hit (Cointelegraph)
_______________________________________________________________________
Technical analysis
_______________________________________________________________________
Bitcoin
Bitcoin spent the weekend slowly rising in price on low volume. The largest cryptocurrency by market cap rose above $11,460 and $11,630 resistance levels, turning them into support. The $11,630 level is currently being retested, but it looks like Bitcoin will stay above it unless a large spike of sellers suddenly comes to the market.
Traders should take a look at Bitcoin’s confirmation of the $11,630 level. If BTC stays above it, traders can consider Bitcoin to be moving in within a range, bound by $11,630 and $12,000.
BTC/USD 4-hour Chart
Technical factors:
- Price is above its 50-period EMA and 21-period EMA
- Price is slightly above its middle band
- RSI is neutral but leaning towards overbought (57.95)
- Volume is low
Key levels to the upside Key levels to the downside
1: $11,630 1: $11,460
2: $12,015 2: $11,090
3: $12,330 3: $10,855
Ethereum
After passing the descending trend and moving above it, Ethereum had a couple of days of steady gains. The second-largest cryptocurrency by market cap slowly gained ground and passed the $400 as well as $415 resistance levels along the way. The move stopped just above $430, before starting to retrace. There is a big possibility that the $415 level will be tested as a support level.
Ethereum traders should look for ETH’s reaction when the price reaches $415 again.
ETH/USD 4-hour Chart
Technical Factors:
- Price is currently above its 21-period and 50-period EMA
- Price is slightly below the upper band
- RSI is severely overbought (67.64)
- Volume is average
Key levels to the upside Key levels to the downside
1: $415 1: $400
2: $445 2: $360
3: $496 3: $340
Ripple
XRP also had a great weekend, with its price consistently moving towards the upside after briefly breaking the $0.266 support level to the downside, which is where the bullish move on Aug 27 started. While it made some progress towards the upside, XRP did not reach past any significant resistance levels. In fact, it got stopped by the $0.285 level, which it most likely won’t pass.
Due to its RSI being close to overbought, low volume, and price rejection around the $0.285 level, XRP will most likely start a move towards the downside now.
XRP traders should trade it on its way down towards $0.266 or possibly look for a bounce off of the support XRP will find on its way down.
XRP/USD 4-hour Chart
Technical factors:
- The price is above its 21-period and 50-period EMA
- Price is slightly below its upper band
- RSI is nearly overbought but is moving towards neutral (58.17)
- Volume is low and relatively stable
Key levels to the upside Key levels to the downside
1: $0.285 1: $0.266
2: $0.31 2: $0.2454
3: $0.32 3:$0.235

Related posts


One reply on “Daily Crypto Review, August 31 – Cryptos Making Steady Gains Over the Weekend; ETC Hit By Third 51% Attack”
Great to see some positive movement in bitcoin