The Elliott waves reflect the behavior of the masses, which characterizes by repeating itself over time. In this educational article, we will look at the basic concepts of wave analysis.
The Wave Concept
The first step before to start to analyze waves is to understand what a wave is? A wave is a movement that develops a market in terms of price over time. This move has its origin in the imbalance between the buying and selling forces that interact in the market.

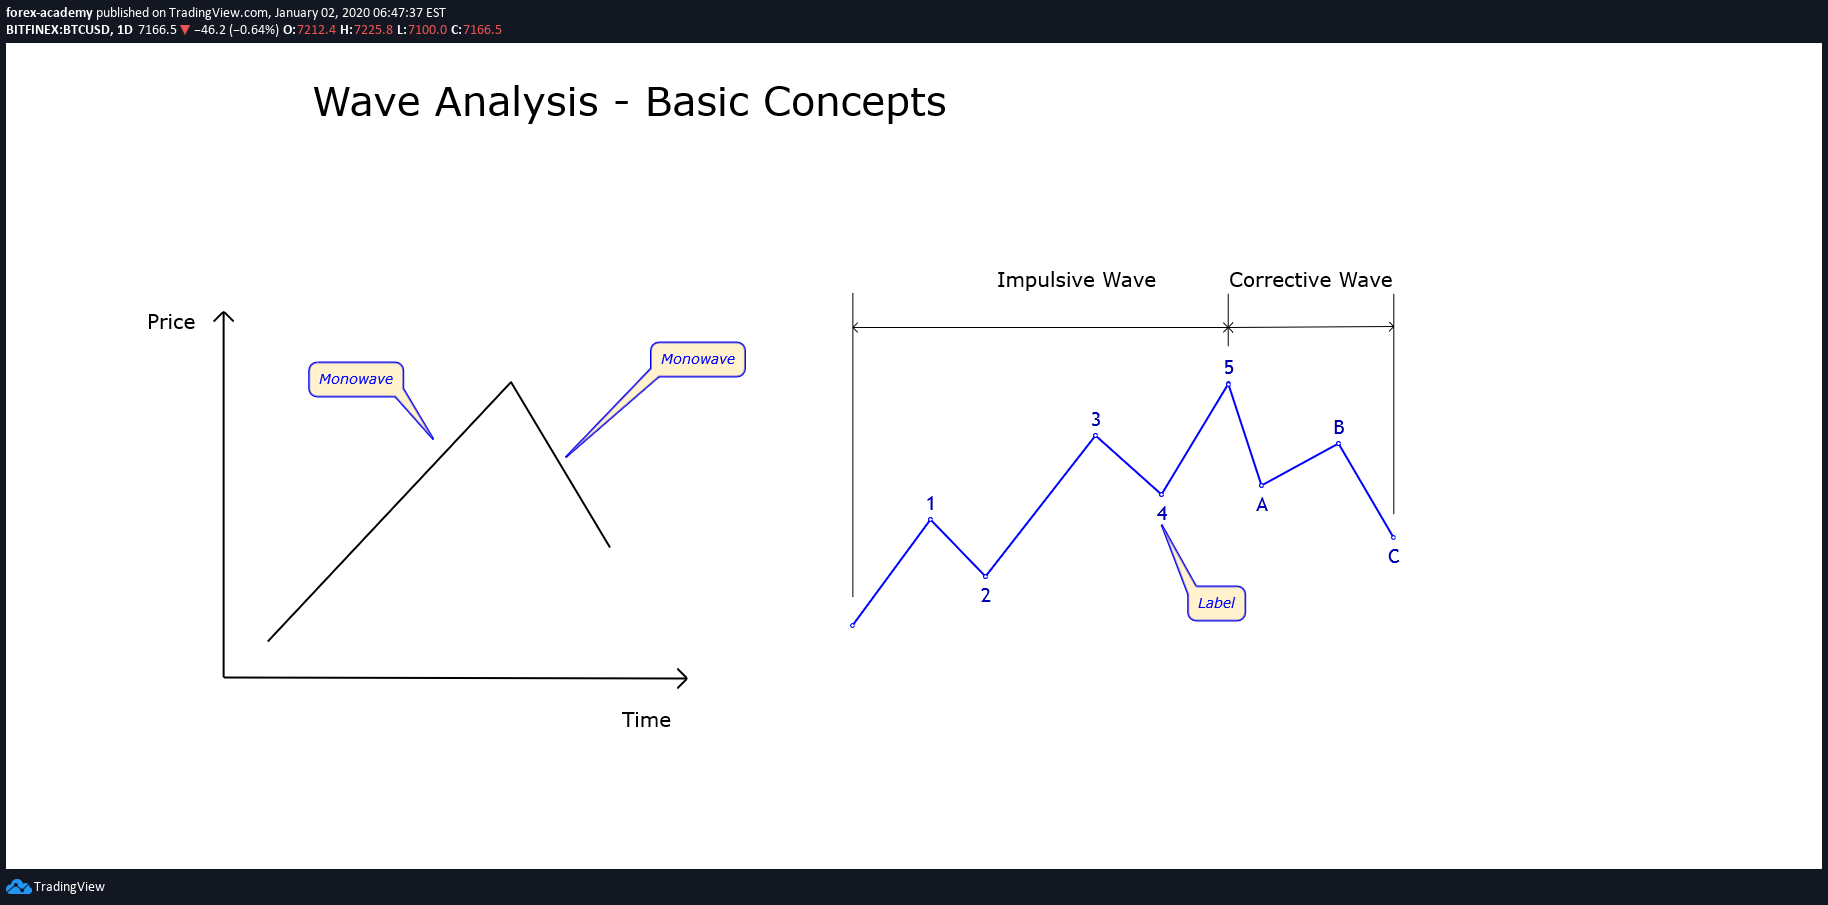
Glenn Neely defines a “monowave” as a movement that begins with a variation in the direction of the price. This move ends when the next price variation occurs.
A monowave can have an ascending or descending diagonal direction. The speed with which it occurs in time can vary, but in no way will this be a vertical line.
The movement that develops the price through time can slow down and then gain momentum again. This variation is part of the same wave.
The Psychology of Participants
When a market moves for a large part of the time in the same direction, the interest of public participation tends to increase.
Different information media starts to pay more attention to the same time that the market movement progresses. In this stage, the general public seeks to participate and benefit from that movement. However, when it occurs, market movers tend to start to close their positioning.
R.N. Elliott, through his study, identified specific patterns that tend to repeat over time in different markets. However, these patterns do not have the same dimension; neither happens in the same way in the markets.
On the other hand, as patterns described by Elliott have specific similar characteristics. Its knowledge and identification allow making forecasts about the next movement with a high level of precision.
Types of Waves
There exist two types of basic wave movements; these are:
- Impulses, that move in a defined direction. Impulsive waves characterize by composed of 5 segments, of which 3 of them move in the same direction of the trend.
- Corrections move in the opposite direction of the motive movement. Generally, it tends to progress in a sideways sequence. These formations are composed of 3 segments.
Waves Identification
The market moves across time, and each movement developed can be grouped in different time ranges, from seconds to years. Elliott defined degrees and labels to ease the study of any market through time.
When a movement is grouped in a specific timeframe, each move should be considered in terms of the relationship between price and duration of itself over time, and not analyze it in absolute terms either price or time.
Once recognized, the wave to study, the next step is its identification. This stage will require the use of labels in each part of the sequence. Labels are a tool that allows distinguishing both the impulse as the correction and the degree to which it belongs each wave.
When the wave analyst carries on the labeling process, these should be used in waves of similar size and complexity. It means that waves should be identified in the same timeframe and kept proportionality between one and another measure. The labeling process will make it easier to ask where the market is going.
Another aspect to take into consideration is the complexity of waves. In other words, complex structures are the result of a combination of the combination of three or five waves; the result of this combination is the creation of a wave of a higher degree or timeframe.
The figure represents the concepts of wave (or monowave used by Glenn Neely), impulsive and corrective wave and label.

Conclusions
The study of Elliott waves lets us understand the path that a market develops. In this way, the study and the identification of patterns described by R. N. Elliott, allows the wave analyst to answer the question of where the price is and where it possibly goes with a considerably high level of precision.
Both, the use of degrees and the labels are tools that permit maintaining a logical order in the wave analysis.
Finally, when identifying wave patterns, there must be a level of proportionality in the structure being analyzed, that is, there must be consistency in terms of price ranges and time.