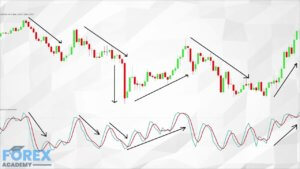
255 Pip Move! Can Trading The USDJPY Be As Easy As ABC
The USDJPY pair have been heavily correlated with the Dow Jones 30 index over the last few months as the US and China trade deal has rattled on.
However, it was only around ten months ago that this pair reached a high point of 112.40 before dropping to the 105.00 level. Big swings in a currency pair like this can catch institutions, investors, and traders completely offside and wondering where future direction might be. In situations such as this, it is obvious that many traders will have been caught out and lost money through stop losses or closing out positions that have gone against them and where they have suffered heavy losses. And when we see big swings like this in price action, it is difficult for traders to know how to value a currency pair’s exchange rate. Because traders at an institutional level tend to buy yen in times of high risk in the market, we can only presume that the yen is losing ground to the dollar-based on the fact that phase one of the US and China trade deal is complete.

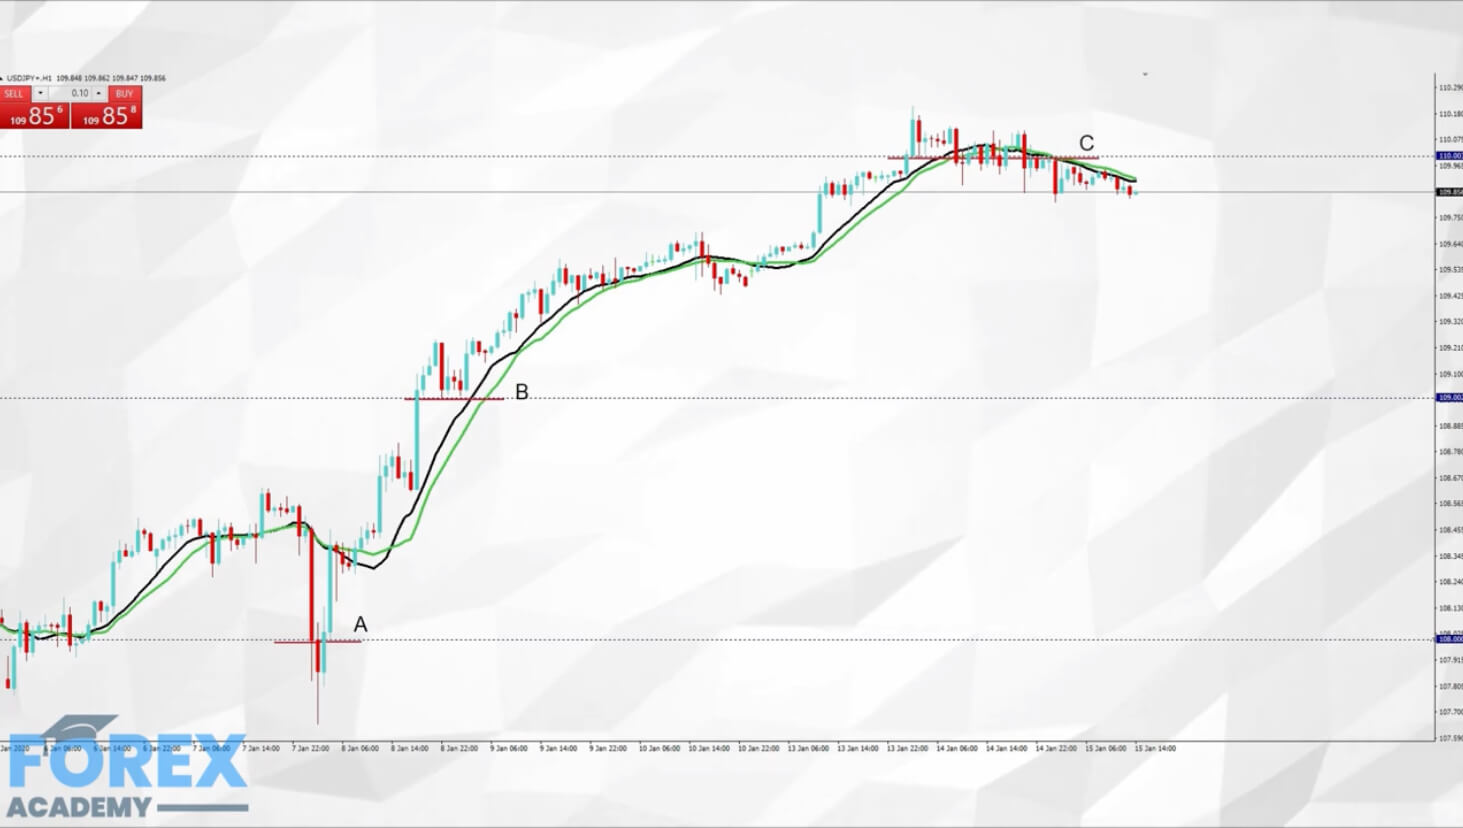

Example A
Let’s turn to example A, which is an hourly chart of the USDJPY pair. We can see that since the 6th of January 2020, price action has been almost glued to two simple moving averages; the black 13 MA and the green 17 MA.
At position A, which is a key 108.00 level, we can see that price action strongly moved lower than the moving averages; however, price action was curtailed, probably because of the previous low at this level. Traders often use previous levels as targets because they are often areas of support and resistance, and especially at key-round-number levels.

Certainly, there was a lot of volatility during these few hours before price action then moves up and becomes almost inseparable from the moving averages to the key 109.00 level, where again we see some volatility at this position before price action again moves while almost sticking to those moving averages, and apart from a small dip the price action, continues all the way up to the key 110.00 area at position C.
Price action then moves underneath the moving averages, again sticking very closely to them, while drifting lower, as traders wonder where the next big move will be on this pair.
In times of uncertainty in the market, please remember that nobody knows where the price action will go to. And if in doubt, it is not unusual for the market to fall back on some very basic trading methodology: if price action is above the moving averages, which have crossed over, and are moving in an upward direction, they buy, and if the moving averages have crossed over and are moving in a downward direction they sell — keeping in mind the importance of those key round number levels.


Related posts