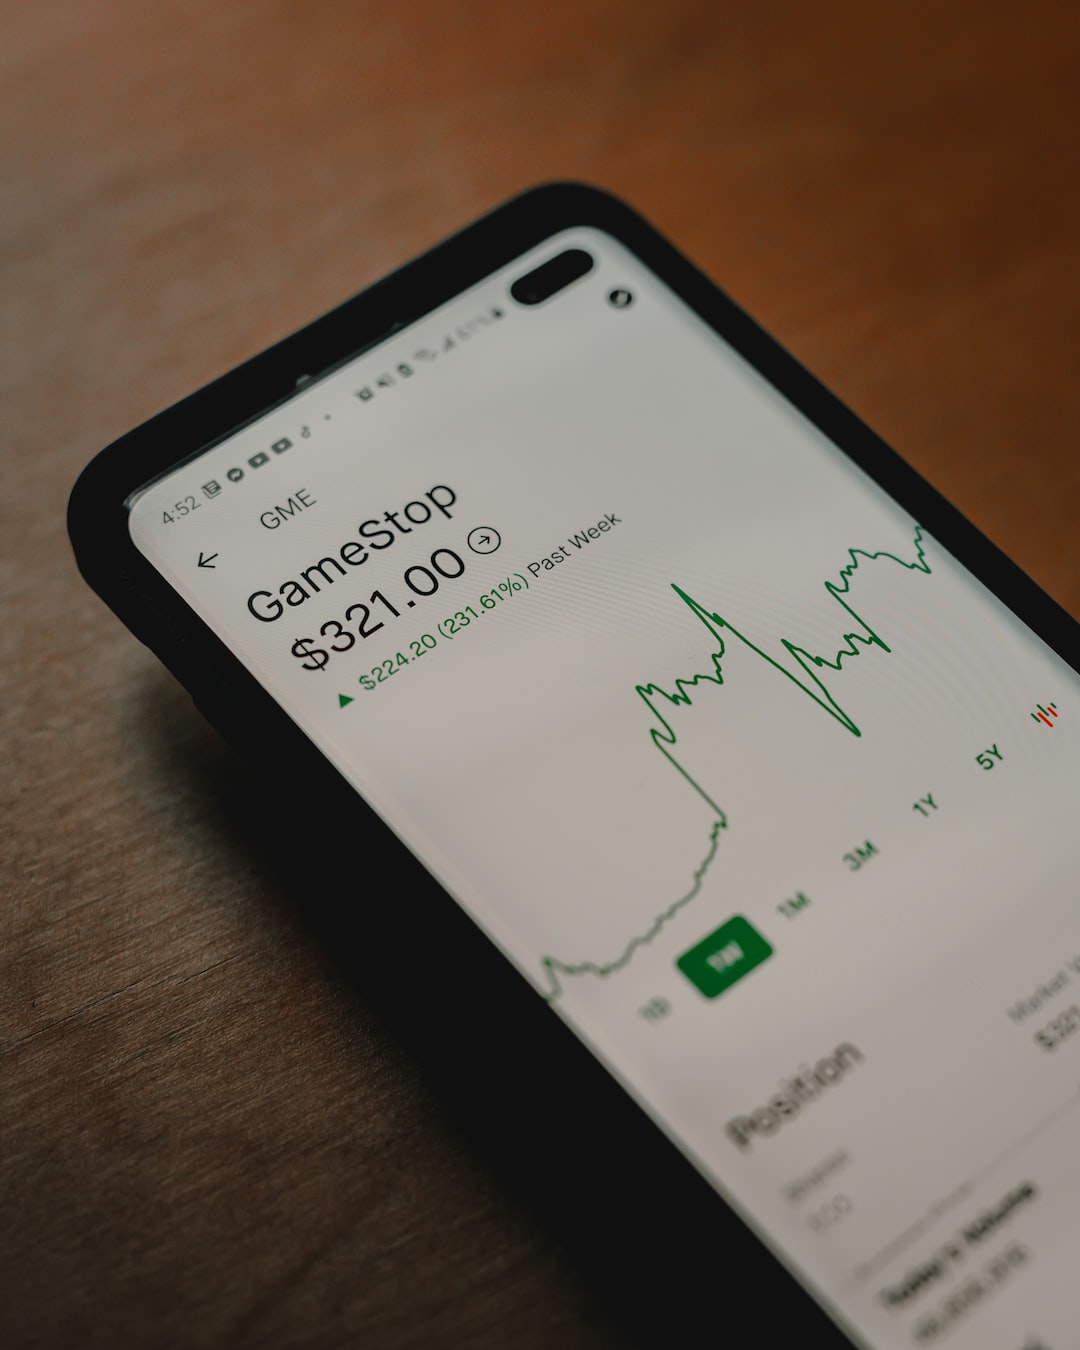
The foreign exchange market or forex is a decentralized market where currencies are traded 24 hours a day, five days a week. Forex traders use various technical analysis tools, including candlestick charts, to analyze price movements and make informed trading decisions. In forex trading, a candlestick is a representation of price movements over a specific time frame. Understanding when a new candlestick starts is crucial for traders to analyze price movements and identify trends accurately.
A candlestick chart is a popular charting tool used by forex traders to analyze market movements. It is composed of a series of candlesticks that represent price movements over a specific time frame. Each candlestick has four components: the opening price, the closing price, the highest price, and the lowest price. The body of the candlestick represents the opening and closing prices, while the wicks or shadows represent the highest and lowest prices.
In forex trading, the time frame used for candlestick charts varies, from one minute to one month, depending on the trader’s preference. However, the most commonly used time frames are the 5-minute, 15-minute, 1-hour, 4-hour, and daily charts. Each time frame has its advantages and disadvantages, and traders must choose the appropriate time frame depending on their trading strategy and risk tolerance.
When a new candlestick starts depends on the time frame used on the chart. For instance, on the 5-minute chart, a new candlestick starts every five minutes, while on the 1-hour chart, a new candlestick starts every hour. On the daily chart, a new candlestick starts at the beginning of each trading day.
Traders use the opening and closing prices of candlesticks to determine price movements and identify trends. When a new candlestick starts, the opening price is the same as the closing price of the previous candlestick. If the opening price is higher than the closing price of the previous candlestick, the candlestick is colored green, indicating a bullish trend. Conversely, if the opening price is lower than the closing price of the previous candlestick, the candlestick is colored red, indicating a bearish trend.
Traders also use the highest and lowest prices of candlesticks to identify support and resistance levels. A support level is a price level where the market is expected to bounce back after a decline, while a resistance level is a price level where the market is expected to reverse after an uptrend. The wicks or shadows of candlesticks represent the highest and lowest prices, and traders use them to identify these levels accurately.
In conclusion, understanding when a new candlestick starts is crucial for forex traders to analyze price movements and identify trends accurately. The time frame used on the chart determines when a new candlestick starts, and traders must choose the appropriate time frame depending on their trading strategy and risk tolerance. The opening and closing prices of candlesticks represent price movements, while the wicks or shadows represent the highest and lowest prices, and traders use them to identify support and resistance levels accurately.


