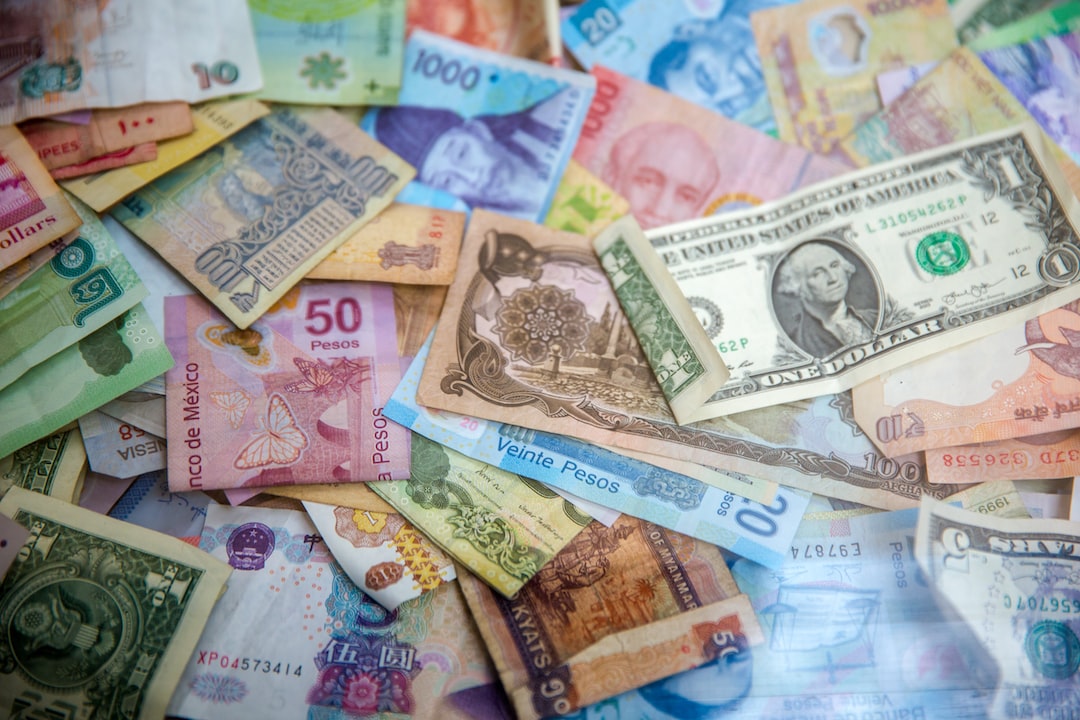
The forex market is a volatile and dynamic arena where traders buy and sell currencies in order to make a profit. One of the most important tools for forex traders is the chart, which displays the price movements of currency pairs over a given period of time. A one-month chart is a popular time frame used by forex traders, as it provides a good balance between long-term trends and short-term fluctuations. In this article, we will explain what to look for on a one-month chart forex.
1. Trend Lines
The first thing to look for on a one-month chart forex is trend lines. A trend line is a straight line that connects two or more price points and is used to identify the direction of the trend. A trend line can be drawn along the highs or lows of the price movement, and it can be used to identify support and resistance levels. A trend line that is sloping upwards indicates an uptrend, while a trend line that is sloping downwards indicates a downtrend.
2. Moving Averages
Moving averages are another important tool to look for on a one-month chart forex. A moving average is a line that is calculated by adding up the prices of the currency pair over a certain period of time and dividing the total by the number of periods. The moving average is used to smooth out the price movements and to identify the direction of the trend. A moving average that is sloping upwards indicates an uptrend, while a moving average that is sloping downwards indicates a downtrend.
3. Support and Resistance Levels
Support and resistance levels are also important to look for on a one-month chart forex. Support levels are price levels where buyers are likely to enter the market, while resistance levels are price levels where sellers are likely to enter the market. These levels can be identified by looking at the highs and lows of the price movement over the past month. A break above a resistance level can indicate a bullish trend, while a break below a support level can indicate a bearish trend.
4. Candlestick Patterns
Candlestick patterns are another important tool to look for on a one-month chart forex. Candlestick patterns are formed by the open, high, low, and close prices of a currency pair during a given time period. These patterns can be used to identify the direction of the trend and to predict future price movements. Some of the most common candlestick patterns include dojis, bullish engulfing patterns, and bearish engulfing patterns.
5. Volume
Volume is the final thing to look for on a one-month chart forex. Volume is the amount of currency that is traded during a given time period. High volume can indicate that there is a lot of interest in the currency pair, while low volume can indicate that there is little interest. Volume can be used to confirm trends and to identify potential reversals.
In conclusion, a one-month chart forex is a valuable tool for traders who want to identify trends and predict future price movements. By looking for trend lines, moving averages, support and resistance levels, candlestick patterns, and volume, traders can gain a better understanding of the market and make more informed trading decisions. It is important to remember that no tool or indicator is foolproof, and that traders should use a combination of tools and strategies to achieve success in the forex market.


