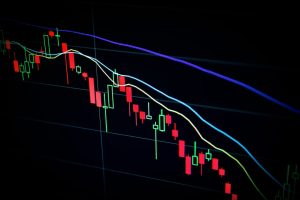
The forex market is dynamic and constantly changing, with prices fluctuating rapidly. To help traders make informed decisions, technical analysis tools such as moving averages are used to identify trends and potential trading opportunities. In this article, we will explore what moving averages are and how they are currently performing in the forex market.
What is a Moving Average?
A moving average is a technical analysis tool that is used to smooth out price fluctuations and identify trends. It is calculated by averaging a specific number of past price points over a given time period. For example, a 50-day moving average (MA) would average the closing prices of the last 50 days of trading.
Moving averages are commonly used to identify the direction of a trend and to determine potential support and resistance levels. When the price is above the moving average, it is generally considered to be in an uptrend, while a price below the moving average is typically considered to be in a downtrend.
There are two main types of moving averages – simple moving averages (SMA) and exponential moving averages (EMA). SMA calculates the average of price points over a specific time period, while EMA gives more weight to recent prices.
Current Forex Moving Averages
The current forex market is showing a mixed picture when it comes to moving averages. Let’s take a closer look at some of the major currency pairs and their moving average performance:
EUR/USD
The EUR/USD pair has been in a long-term downtrend since mid-2018. However, in recent months, the pair has been trading in a range between 1.1700 and 1.2000. The 50-day SMA is currently at 1.1940 and the 200-day SMA is at 1.1870. This suggests that the pair is trading slightly above its long-term average, indicating a potential bullish trend.
GBP/USD
The GBP/USD pair has been in a long-term downtrend since 2014. However, in recent months, the pair has been trading in a range between 1.3600 and 1.4200. The 50-day SMA is currently at 1.3860, while the 200-day SMA is at 1.3710. This suggests that the pair is trading slightly above its long-term average, indicating a potential bullish trend.
USD/JPY
The USD/JPY pair has been in a long-term uptrend since 2012. However, in recent months, the pair has been trading in a range between 108.00 and 111.00. The 50-day SMA is currently at 109.50, while the 200-day SMA is at 107.60. This suggests that the pair is trading slightly above its long-term average, indicating a potential bullish trend.
USD/CAD
The USD/CAD pair has been in a long-term downtrend since 2016. However, in recent months, the pair has been trading in a range between 1.2000 and 1.2700. The 50-day SMA is currently at 1.2340, while the 200-day SMA is at 1.2650. This suggests that the pair is trading below its long-term average, indicating a potential bearish trend.
Conclusion
Moving averages are a popular technical analysis tool used by forex traders to identify trends and potential trading opportunities. The current forex market is showing a mixed picture when it comes to moving averages, with some pairs indicating a potential bullish trend, while others show a bearish trend. It is important to use multiple technical indicators and analyze the market thoroughly before making any trading decisions.


