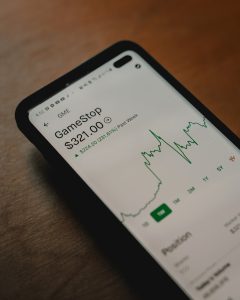
Forex charts are essential tools for traders who want to keep track of market trends and make informed trading decisions. These charts display a wealth of information, such as currency pairs, market trends, and price movements. One crucial feature of forex charts is the times at the bottom of the chart. These times help traders to understand the time frame of the data being displayed on the chart.
In this article, we will explain what the times mean at the bottom of forex charts and how they can help traders to make better-informed trading decisions.
What do the times at the bottom of forex charts mean?
The times at the bottom of forex charts represent the time frame of the data that is being displayed on the chart. The time frame can be in different units, such as minutes, hours, days, weeks, or months. The most common time frames used in forex charts are:
1. Minute charts: These charts display price movements of a currency pair over a one-minute time frame. Minute charts are useful for day traders who want to make quick trading decisions based on short-term price movements.
2. Hourly charts: These charts display price movements of a currency pair over a one-hour time frame. Hourly charts are useful for traders who want to track market trends over a few hours.
3. Daily charts: These charts display price movements of a currency pair over a one-day time frame. Daily charts are useful for traders who want to track long-term market trends and make trading decisions based on a wider view of the market.
4. Weekly charts: These charts display price movements of a currency pair over a one-week time frame. Weekly charts are useful for traders who want to track the overall trend of the market over a longer period.
5. Monthly charts: These charts display price movements of a currency pair over a one-month time frame. Monthly charts are useful for traders who want to track long-term market trends and make informed trading decisions based on a broader view of the market.
Why are the times at the bottom of forex charts important?
The times at the bottom of forex charts are important because they help traders to understand the context of the data being displayed on the chart. Depending on the time frame, traders can get a different perspective on the market and make informed trading decisions.
For example, if a trader is using a minute chart, they will be able to see short-term price movements of a currency pair. This can be useful for day traders who want to take advantage of short-term fluctuations in the market. On the other hand, if a trader is using a monthly chart, they will be able to see long-term trends and make informed trading decisions based on a broader view of the market.
Moreover, the times at the bottom of forex charts help traders to identify support and resistance levels. Support levels are price levels where the market tends to bounce back up, while resistance levels are price levels where the market tends to fall back down. By looking at the times at the bottom of the chart, traders can identify key support and resistance levels and make informed trading decisions.
Conclusion
The times at the bottom of forex charts represent the time frame of the data being displayed on the chart. Traders can choose from different time frames, such as minute charts, hourly charts, daily charts, weekly charts, and monthly charts, depending on their trading strategy and goals. The times at the bottom of forex charts are important because they help traders to understand the context of the data being displayed on the chart and make informed trading decisions. By paying attention to the times at the bottom of forex charts, traders can identify key support and resistance levels and take advantage of market trends.


