Forex trading is a popular investment option for individuals who are interested in trading currencies. However, before you start trading, it’s important to understand the various timeframes that you can use to analyze the market. Timeframes play a crucial role in determining when to enter or exit a trade. In this article, we will discuss the different timeframes in forex trading and how to use them effectively.
What are Timeframes in Forex Trading?
A timeframe is a period of time that traders use to analyze the market. The timeframe can range from seconds to years depending on the trading strategy and the trader’s goals. The most commonly used timeframes in forex trading are:
1. Tick Charts
Tick charts are the smallest timeframe in forex trading. They show the price movement of a currency pair in real-time. Tick charts are useful for scalping, which is a trading strategy that involves making small profits from multiple trades.
2. Minute Charts
Minute charts show the price movement of a currency pair in one-minute intervals. Minute charts are useful for traders who want to make quick trades but do not want to use tick charts.
3. Hourly Charts
Hourly charts show the price movement of a currency pair in one-hour intervals. Hourly charts are useful for traders who want to hold positions for a few hours to a few days.
4. Daily Charts
Daily charts show the price movement of a currency pair in one-day intervals. Daily charts are useful for traders who want to hold positions for a few days to a few weeks.
5. Weekly Charts
Weekly charts show the price movement of a currency pair in one-week intervals. Weekly charts are useful for traders who want to hold positions for a few weeks to a few months.
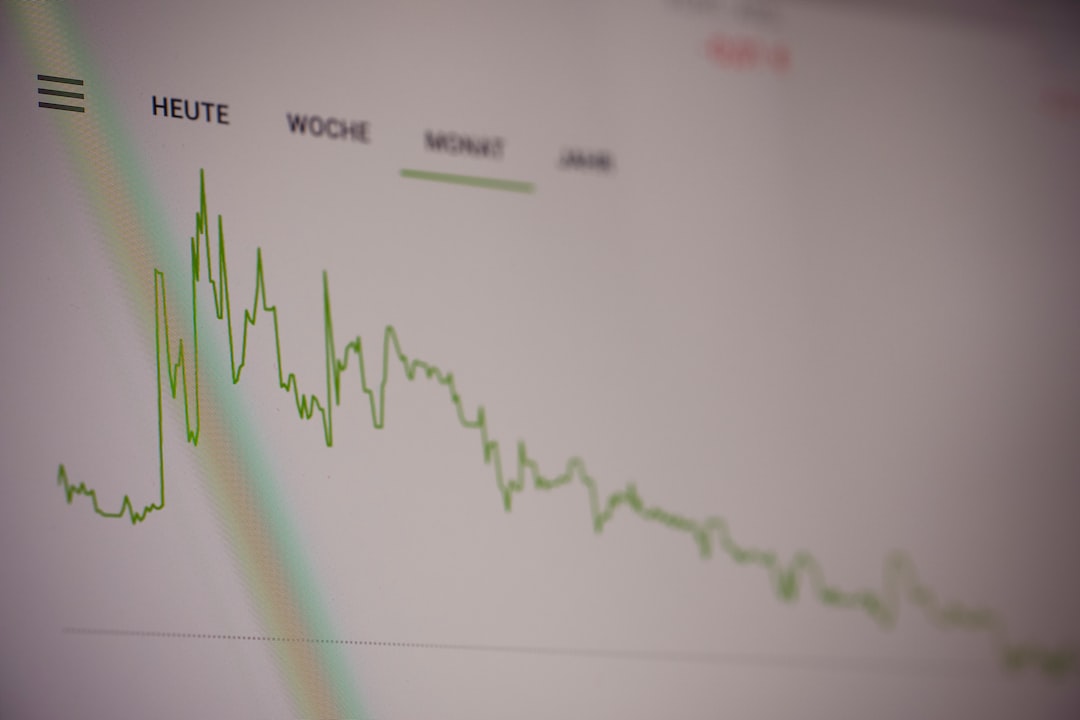
6. Monthly Charts
Monthly charts show the price movement of a currency pair in one-month intervals. Monthly charts are useful for traders who want to hold positions for a few months to a few years.
How to Use Timeframes in Forex Trading
The timeframe you choose to use in forex trading depends on your trading strategy and goals. Some traders prefer to use multiple timeframes to get a better understanding of the market. For example, a trader may use a daily chart to determine the overall trend of a currency pair and a one-hour chart to find an entry point.
Here are some tips on how to use timeframes in forex trading:
1. Identify the Trend
The first step in using timeframes in forex trading is to identify the trend. The trend is the direction in which the price of a currency pair is moving. You can use a higher timeframe, such as a daily or weekly chart, to identify the trend. Once you have identified the trend, you can use a lower timeframe to find an entry point.
2. Find an Entry Point
Once you have identified the trend, you can use a lower timeframe to find an entry point. For example, if the trend is up, you can use a one-hour chart to find a buy signal. You can use technical indicators, such as moving averages or oscillators, to find a buy signal.
3. Set Stop Losses and Take Profits
Once you have entered a trade, it’s important to set stop losses and take profits. Stop losses are used to limit your losses if the trade goes against you. Take profits are used to lock in your profits if the trade goes in your favor. You can use a higher timeframe to set your stop losses and take profits.
Conclusion
In conclusion, timeframes play a crucial role in forex trading. They help traders to identify the trend, find an entry point, and set stop losses and take profits. The timeframe you choose to use in forex trading depends on your trading strategy and goals. It’s important to use multiple timeframes to get a better understanding of the market. By using timeframes effectively, you can increase your chances of making profitable trades in the forex market.