
The big picture of the USDCAD pair shows a bullish divergence suggesting the exhaustion of the current bearish trend that remains active since past March 2020 when the price topped at 1.46674 and began to decline in a complex corrective pattern. Follow with us what’s next for Lonnie.
Technical Overview
The long-term Elliott wave view of the USDCAD pair unfolded in its 2-day chart and log-scale, illustrates a downward movement that began on the second half of March 2020 when the price found fresh sellers at level 1.46674. Once the price topped, the Lonnie started to decline in a complex corrective formation identified as a double-three pattern (3-3-3) of Minor degree labeled in green.

According to the textbook, the double-three pattern characterizes itself by following an internal sequence subdivided into 3-3-3, each “three” a complete corrective formation. In this regard, the previous figure shows the price action moving in the third segment of the double-tree pattern corresponding to its wave Y. Also, the lower degree structural sequence reveals the progress in its wave ((c)) of Minute degree identified in black.
On the other hand, the technical indicators support the bearish bias that dominates the downtrend, persisting since March 2020. Both the trend and the momentum oscillators confirm the downtrend in progress. Nevertheless, the timing oscillator shows a bullish divergence plotted in green. This reading suggests the exhaustion of the bearish trend. In this context, the candlesticks formations observed in the last chart remains weighting declines over rallies.
Technical Outlook
The short-term outlook for USDCAD exposed in the next 8-hour chart reveals the incomplete downward advance corresponding to wave ((c)) of Minute degree identified in black, suggesting a potential new decline.
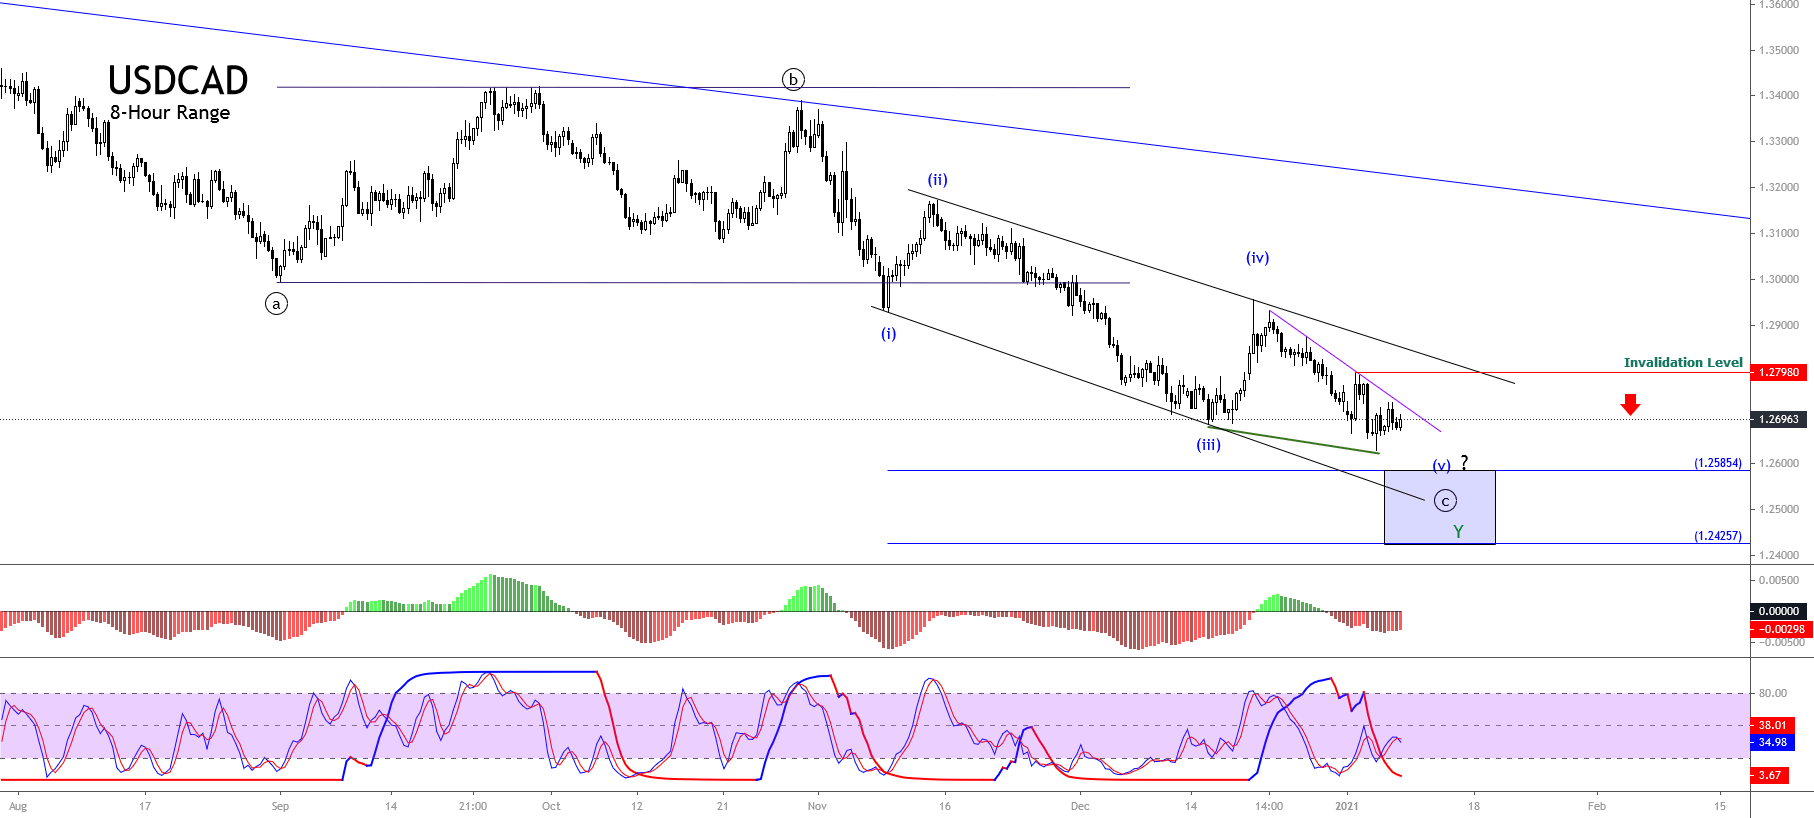
The figure illustrates the downward channel in play that connects the extremes of waves (i)-(iii) and (ii)-(iv) Minuette degree identified in blue. The Elliott Wave theory suggests that the penetration below the base-line between waves (i) and (iii) could reveal the end of wave (v). In this regard, a potential new decline could strike the area bounded between 1.2585 and 1.2425. Likewise, the gap between momentum and timing oscillators supports the likely additional downward move in the USDCAD pair.
In summary, the USDCAD advances in a downward complex corrective sequence identified as a double-three pattern of Minor degree, which looks running in its wave Y. Simultaneously, the internal structure reveals the progress in its wave ((c)) of Minute degree, which could see a new drop to the potential target area between 1.2585 and 1.2425. Finally, the bearish scenario will invalidate if the price soars and closes above 1.27980.


One reply on “USDCAD Bullish Divergence in a Complex Corrective Formation; What’s next?”
thanks, keep going guy