
The USDJPY pair is progressing in an Elliott wave complex correction identified as a triple-three pattern (3-3-3-3-3) of Minute degree, labeled in black. The completion of this downward corrective formation suggests the start of a new rally of the same degree.
Technical Overview
The following daily chart shows the USDJPY pair advancing in a corrective structure of Minor degree labeled in green, which began on last March 09th when the price found support at 101.180, from where the price started an aggressive rally that has found resistance and completed wave A in green at 111.715 on March 24th.
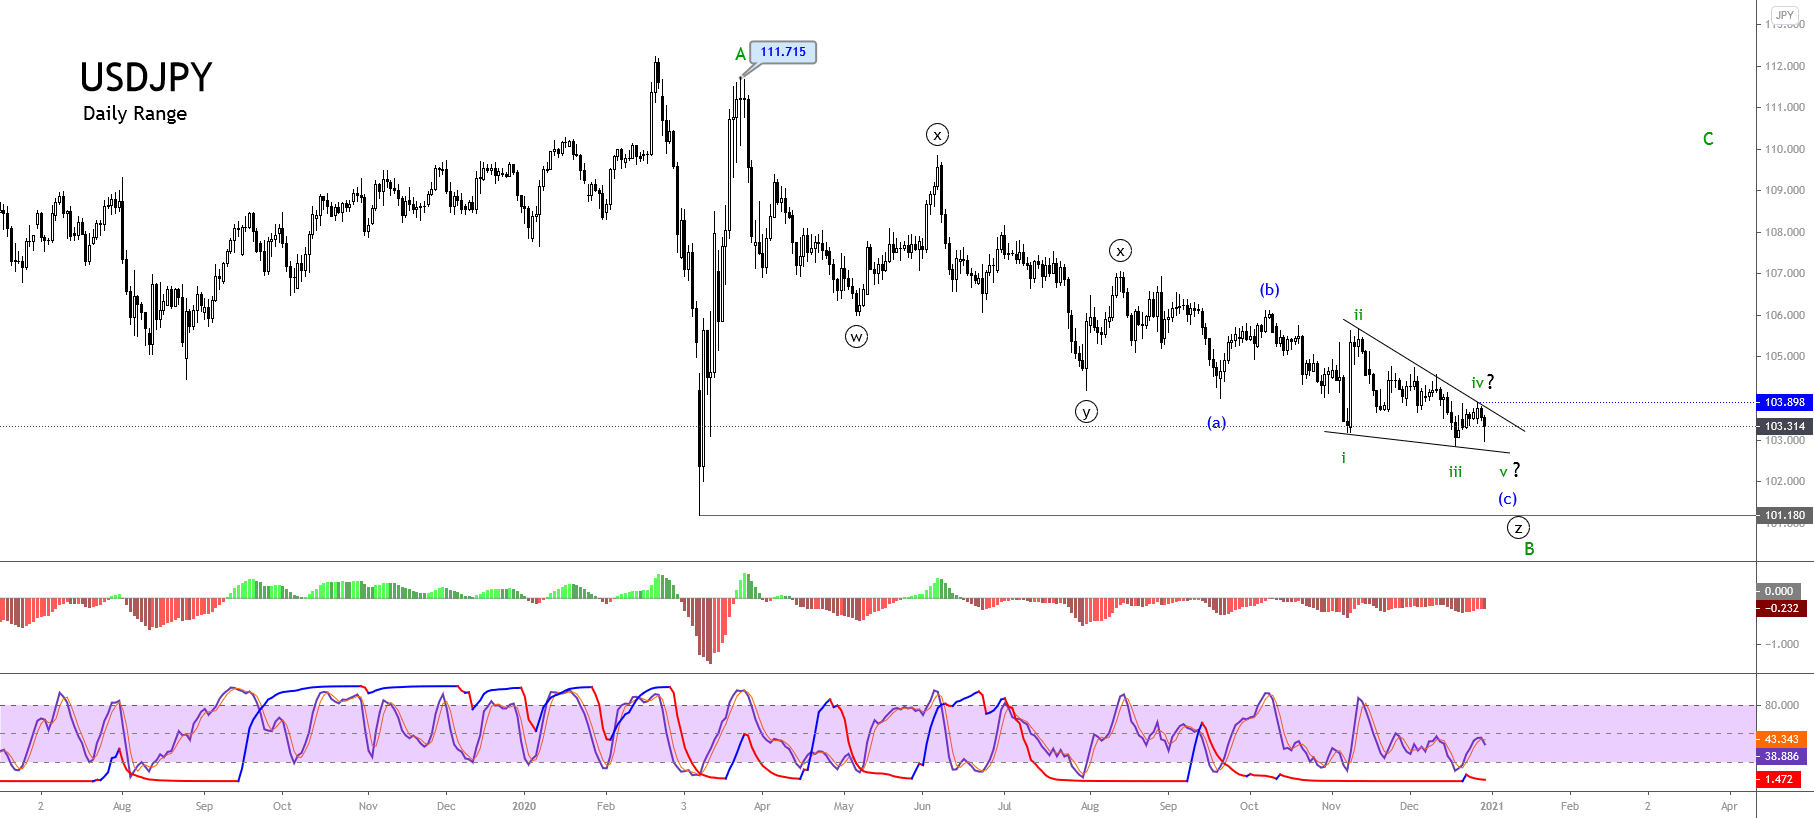
According to the Elliot Wave theory’s alternation principle, if the first move is aggressive, the next path should be a slow move elapsing more time than the previous leg. Likely, the second leg will be a triangle or a complex corrective formation. In this regard, the second leg corresponding to wave B in green shows the progress in a triple-three pattern, which follows an internal sequence subdivided into 3-3-3-3-3, where each three is a simple corrective formation.
On the other hand, the MACD oscillator endorses the downward corrective sequence that remains in progress. Likewise, the momentum and timing oscillator confirms the bearish pressure in play. It suggests the possibility of a new decline completing the ending diagonal pattern in progress corresponding to wave (c) of Minuette degree labeled in blue.
Technical Outlook
The long-term outlook for the USDJPY pair under the Elliott Wave perspective, shown in the following daily chart, foresees a potential limited decline until the demand zone, between 102.357 and 101.180, where the price could find fresh buyers expecting to join in the next rally.
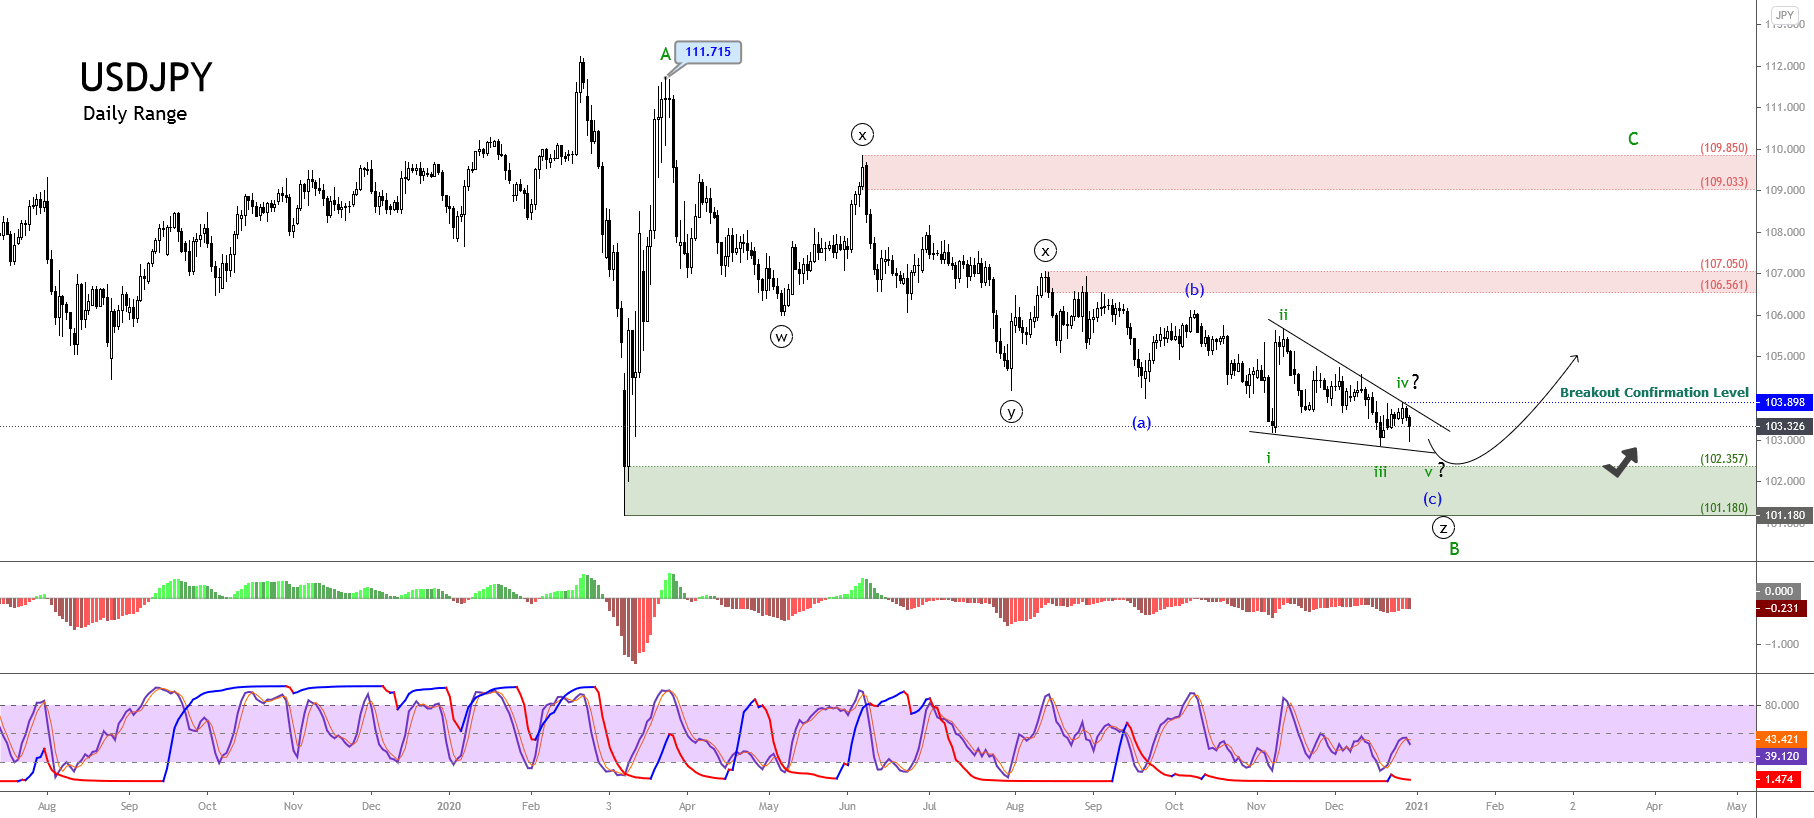
The confirmation of its recovery would occur if the USDJPY breaks and closes above the 103.898 level, which corresponds to the end of wave iv of Subminuette degree labeled in green. This potential next rally corresponding to wave C of Minor degree should follow an internal sequence subdivided into five waves. Likewise, if the price extends its gains, USDJPY could continue rallying toward the next supply zone bounded between 109.033 and 109.850. On the other hand, the invalidation of this bullish scenario occurs if the price extends its drops below 101.180.
In summary, the USDJPY pair advances in an incomplete complex corrective pattern identified as a triple-three formation, which currently moves in its third internal segment of wave ((z)). In this regard, the price could decline toward the next demand zone between 102.357 and 101.180. If the price confirms the bottom and starts the rally, the wave C will be confirmed if the price breaks and closes above 103.898. The first potential target is located between 106.561 and 107.050; the second potential target zone is placed between 109.033 until 109.850. Finally, the bullish scenario’s invalidation level is set at 101.180, which corresponds to the March 09th low.
Related posts
 Daily F.X. Analysis, May 22 – Top Trade Setups In Forex – ECB Monetary Policy Meeting Accounts Ahead!
 Daily F.X. Analysis, May 29 – Top Trade Setups In Forex – Fed Chair Powell Speech in Focus!
 Daily F.X. Analysis, June 01 – Top Trade Setups In Forex – ISM Manufacturing PMI In Highlights
 Daily F.X. Analysis, June 9 – Top Trade Setups In Forex – European GDP in Highlights!
One reply on “USD/JPY Complex Correction, What does that mean for Traders?”
hello, can I have a question?
what indicator below RSI?, thank you