I will first comment on the balance sheet and its risks but I hope I will not go too far, as it is a company with few debts, with very strong financial health, and with quite limited risks in my opinion. After this, we will move on to its valuation by multiples, by discounting cash flows, and its valuation of the sum of the parts.
Balance Sheet
Regarding its financial health, it has a Current Ratio (remember that they are current assets/current liabilities) of 3.37 and a Quick Ratio of 3.35 that is the same but subtracting the inventory from the assets, although as we see this item is practically insignificant. Around 1.5 is usually a good ratio, in this case, we see how the weight of its assets far exceeds liabilities.
Profit and Loss
With respect to its consolidated income statement, in 2018 and 2019 it made profits in excess of $30 billion, although in 2017 it was quite lower, about $12 b. This is largely due to the provisioning of taxes for the sanction it had for monopolistic practices. After seeing the profitability and margins we will look at what are some of the risks of Alphabet.
Profitability and Margins
Except for the exceptional situation of Alphabet in 2017, the ROE is usually around 16%, obtaining more than 18% in the last 2 years. Something similar happens with the ROA, around 13%. While the ROIC tends to be most of the years between 30-40%. In the case of margins, they are not as high as in previous years, but they still have a gross margin of more than 55% and a net margin of more than 21%, which is very good.
Of course, as with any investment, there are always risks, and these are some of the ones that the company itself comments on. If you think they’re missing something, leave it in the comments. 83% of sales come from advertising. If advertisers’ spending is reduced, or limitations appear when displaying ads or personalizing them, the business could suffer a lot.

Competitors
Disruption, interference, or failure of our information technology and communications systems could damage our ability to provide our products and services effectively, which could damage our reputation, financial condition, and operational results. The occurrence of a natural disaster, the closure of a facility, or other unforeseen problems in our data centers.
- Regulatory Risk. Antitrust, privacy, tax laws.
- Privacy and data protection. Any scandal here would affect the company.
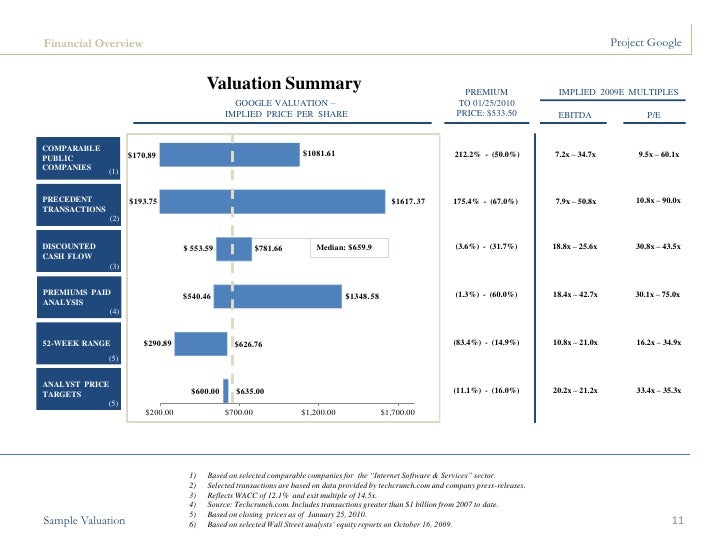
Rating by multiples of Alphabet
As we have already said, for a business of the magnitude and quality of Alphabet it is almost impossible to compare it with other competitors. This is because there is no other Alphabet that competes directly, instead, we have multiple competitors fighting for different business segments. Therefore, it is most likely reasonable to compare with Alphabet’s own historical multiples. Here I will focus only on two multiples that for me would be the most important in this case, such as P/FCF and EV/EBITDA.
Review of Google based on Price to Free Cash Flow (P/FCF)
Number of shares = 688.8 M
Median over the last 15 years 33.45
Price per share = 1206,57€
Market Cap = 831,085 M (price per share*number of shares)
Free Cash Flow (FCF) = 28.457 M
P/current FCF = 29,20 (Market Cap/FCF)

How much is Google worth according to its EV/EBITDA?
If we take the historical median of 15.89 as a reference and expect it to return to that level of EV/EBITDA we would have:
EV/51.506 = 15.89 –> EV = 15.89 * 51.506 = 818.430 M
Estimated EV = 818,430 M
EV per estimated share = €1,188.20
Dividing 818,430 M by the number of shares we would have an estimated EV per share of 1,188.20 €.
And what would be the safety margin in Google?
Safety margin = [ 1 – (Market price / Intrinsic value) ] * 100 [ 1 – (1055,78 / 1.188,20) ] * 100
Safety margin = 11.14 per cent
Valuation by Alphabet Cash Flow Discount:
We have an estimated EV per share of about $1,333 and an estimated price per share of $1,501. This represents a safety margin of 20.80% and 19.62% respectively. In this case, we see how the margin has been increased with respect to the multiple valuation methods, although here only by increasing by 1% up or down the return we demand on this investment (Personal required rate of return) the valuation changes substantially.
Valuation by the sum of the parties:
I will take into account both profit and free cash flow and assign other multiples. In addition, I also include an estimate of the debt since it has historically been very small but in recent years it has experienced a growth that we should take into account. First, we’ll see how much Google is worth based on your cash flow, then we’ll add your cash and Waymo’s rating. Then we will deduct the debt and finally divide it by the number of shares. So we will have the estimated price of Google to 3 years seen.
Why change multiples?
Well, Google has historically quoted around 20-25 times benefits or FCF, but as we’ve seen before we get around 33 times compared to FCF and 28 times benefits.
Considering this, let’s leave it at 25-30 times FCF and 24-28 times benefits.
How much is Google’s 3-year cash flow seen based on its profits?
1) Expected growth rate between 10% and 15% over 3 years
Historically it has traded around 28 times the benefits. We will take a conservative range of between 24 – 28 times.
2) Your benefits in three years will be:
- 34 B current at 10% for 3 years are 45b.
- 34 B current at 15% for 3 years are 51b.
3) How much this will be worth in 3 years by applying multiples of 24 and 28 times:
- 45B x 24 times/# of shares = 1,568 € per share or Market Cap of 1,080,000 M
- 51B x 24 times/# of shares = €1,777 per share or Market Cap of 1,223,998 M
- 45B x 28 times/# of shares = 1,829 € per share or Market Cap of 1,259,815 M
- 51B x 28 times/# of shares = €2,073 per share or Market Cap of 1,427,882 M
How much is Google’s 3-year cash flow seen based on its Free Cash Flow?
1) Expected growth rate between 15% and 20% over 3 years.
Google’s FCF growth has been 17.5% in the last 10 years, 24% in the last 5, and 34% in the last 12 months. We remained in a conservative range of 15% – 20% FCF growth and multiple of 25-30 times.
2) FCF in three years will be:
- 28 B current at 15% for 3 years are 42.5 B.
- 28 B current at 20% for 3 years are 48 B.
3) How much this will be worth in 3 years by applying multiples of 25 and 30 times:
- 42.5B x 25 times/# of shares = 1,542 € per share or Market Cap of 1,062,130 M
- 48B x 25 times/# of shares = €1,760 per share or Market Cap of 1,212,288 M
- 42.5B x 30 times/# of shares = 1,851 € per share or Market Cap of 1,274,969 M
- 48B x 30 times/# of shares = 2,090 € per share or Market Cap of 1,439,592 M
Obviously not, everyone must make their own analysis and we have seen that by varying the valuation method we get different prices. I personally am not buying at this price, as I see it likely to buy at a better price with a higher safety margin.