Categories
Forex Course

99. Pivot Points: What have we learned so far?

Introduction

In the previous six lessons, we discussed pivot points right from understanding what they are, to the strategies one can apply to trade the markets. Now, let’s summarize what we’ve learned so far and move on with another exciting tool for analyzing the markets.

Pivot Point Basics

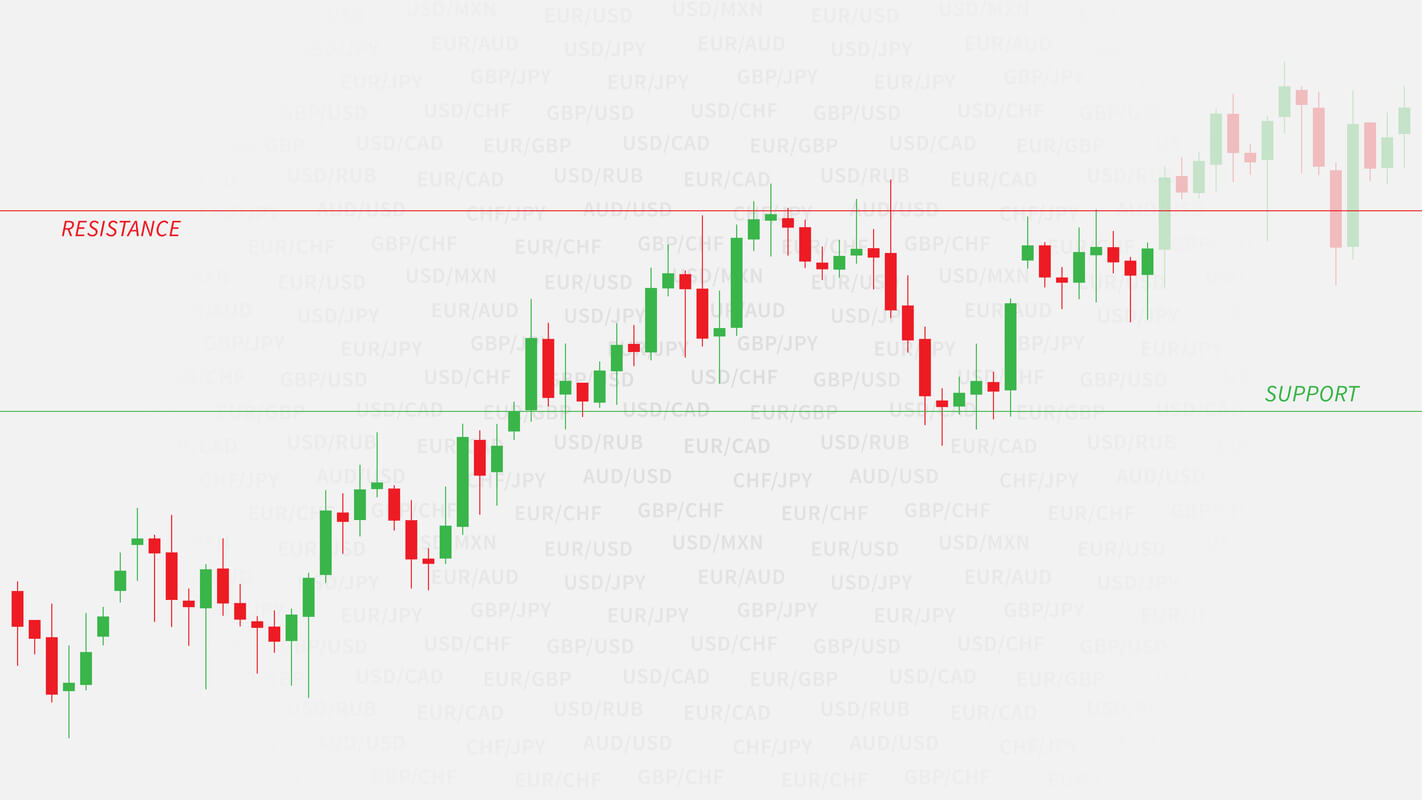
A pivot point is a technical indicator in technical analysis trading, which determines potential support and resistance levels in the market. This indicator is stationary, unlike the other indicators that move with the change in price.

The pivot points are levels that are essentially determined using the previous day’s high, low, and close price. So, every trading day, we can obtain one set of the pivot point.

What is the pivot point made up of?

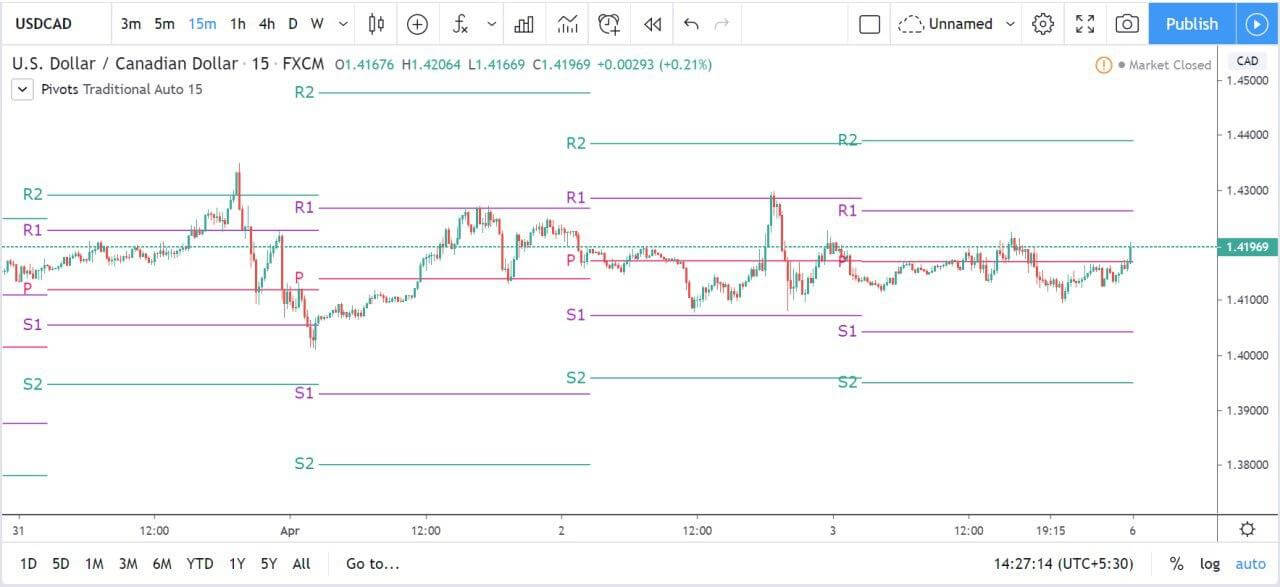
There are up to six levels that make up the pivot point levels. One of the levels is the pivot point level, and the rest are support and resistance levels. The six pivot levels are symbolized as follows:

Pivot Point (PP/P)

First Support (S1), First Resistance (R1)

Second Support (S2), Second Resistance (R2)

Third Support (S3), Third Resistance (R3)

Fourth Support (S4), Fourth Resistance (R4)

Fifth Support (S5), Fifth Resistance (R5)

Note that, most of the time, we stick to the levels until S3/R3 because the price does not usually touch the levels beyond it.

How are the pivot levels calculated?

As mentioned, the pivot points are calculated using the close, high, and low of the prior trading day.

For example, the Pivot Point, First Support, and First Resistance are calculated as follows:

PP = (High + Low + Close) / 3

S1 = (2 x PP) – High

R1 = (2 x PP) – Low

Similarly, one can calculate levels until R5/S5. However, these values need not be calculated practically. There are trading platforms that automatically calculate these values.

Types of Pivot Points

There are four types of pivot points based on how the levels are calculated.

  1. Standard
  2. Woodie
  3. Camarilla
  4. Fibonacci

Most of the time, the standard pivot point levels are used.

Strategies using Pivot Points

There are several ways through which one applies pivot points. In our course, we have listed out three strategies.

Range trading strategy

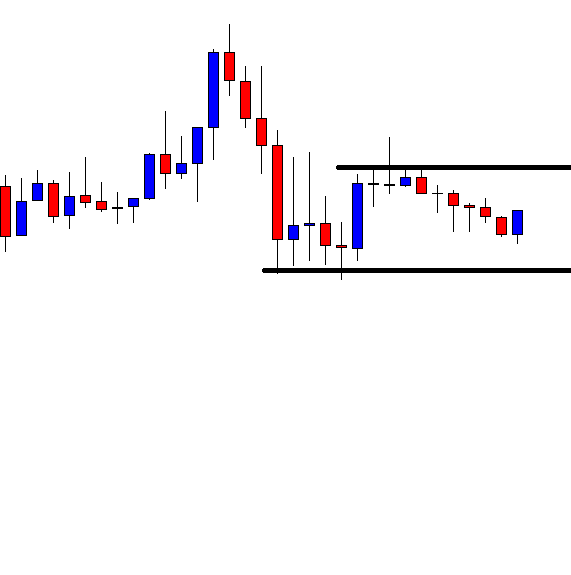
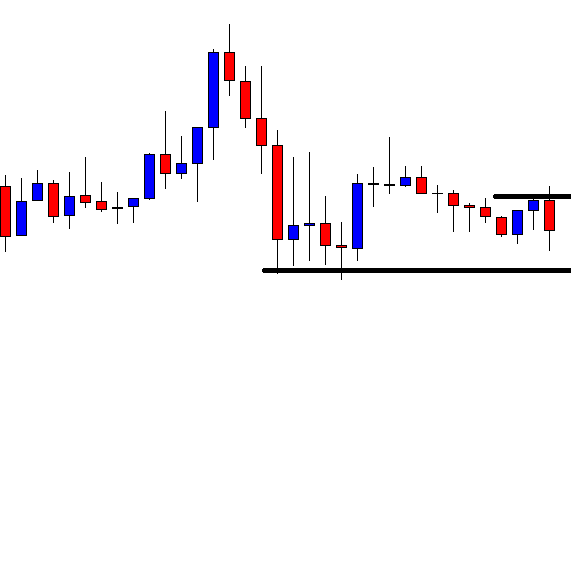
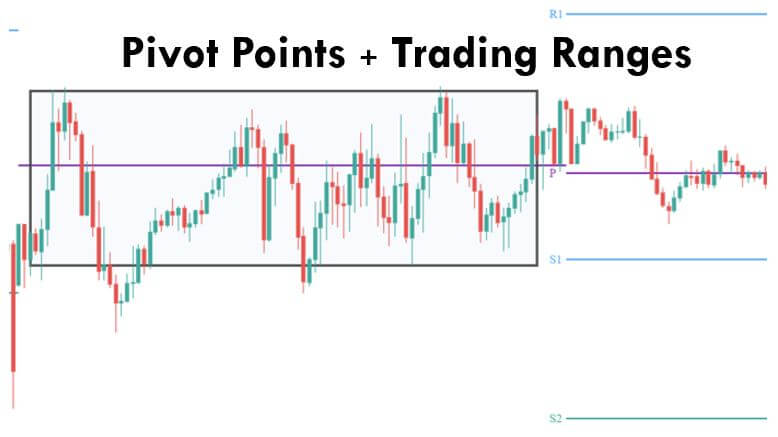
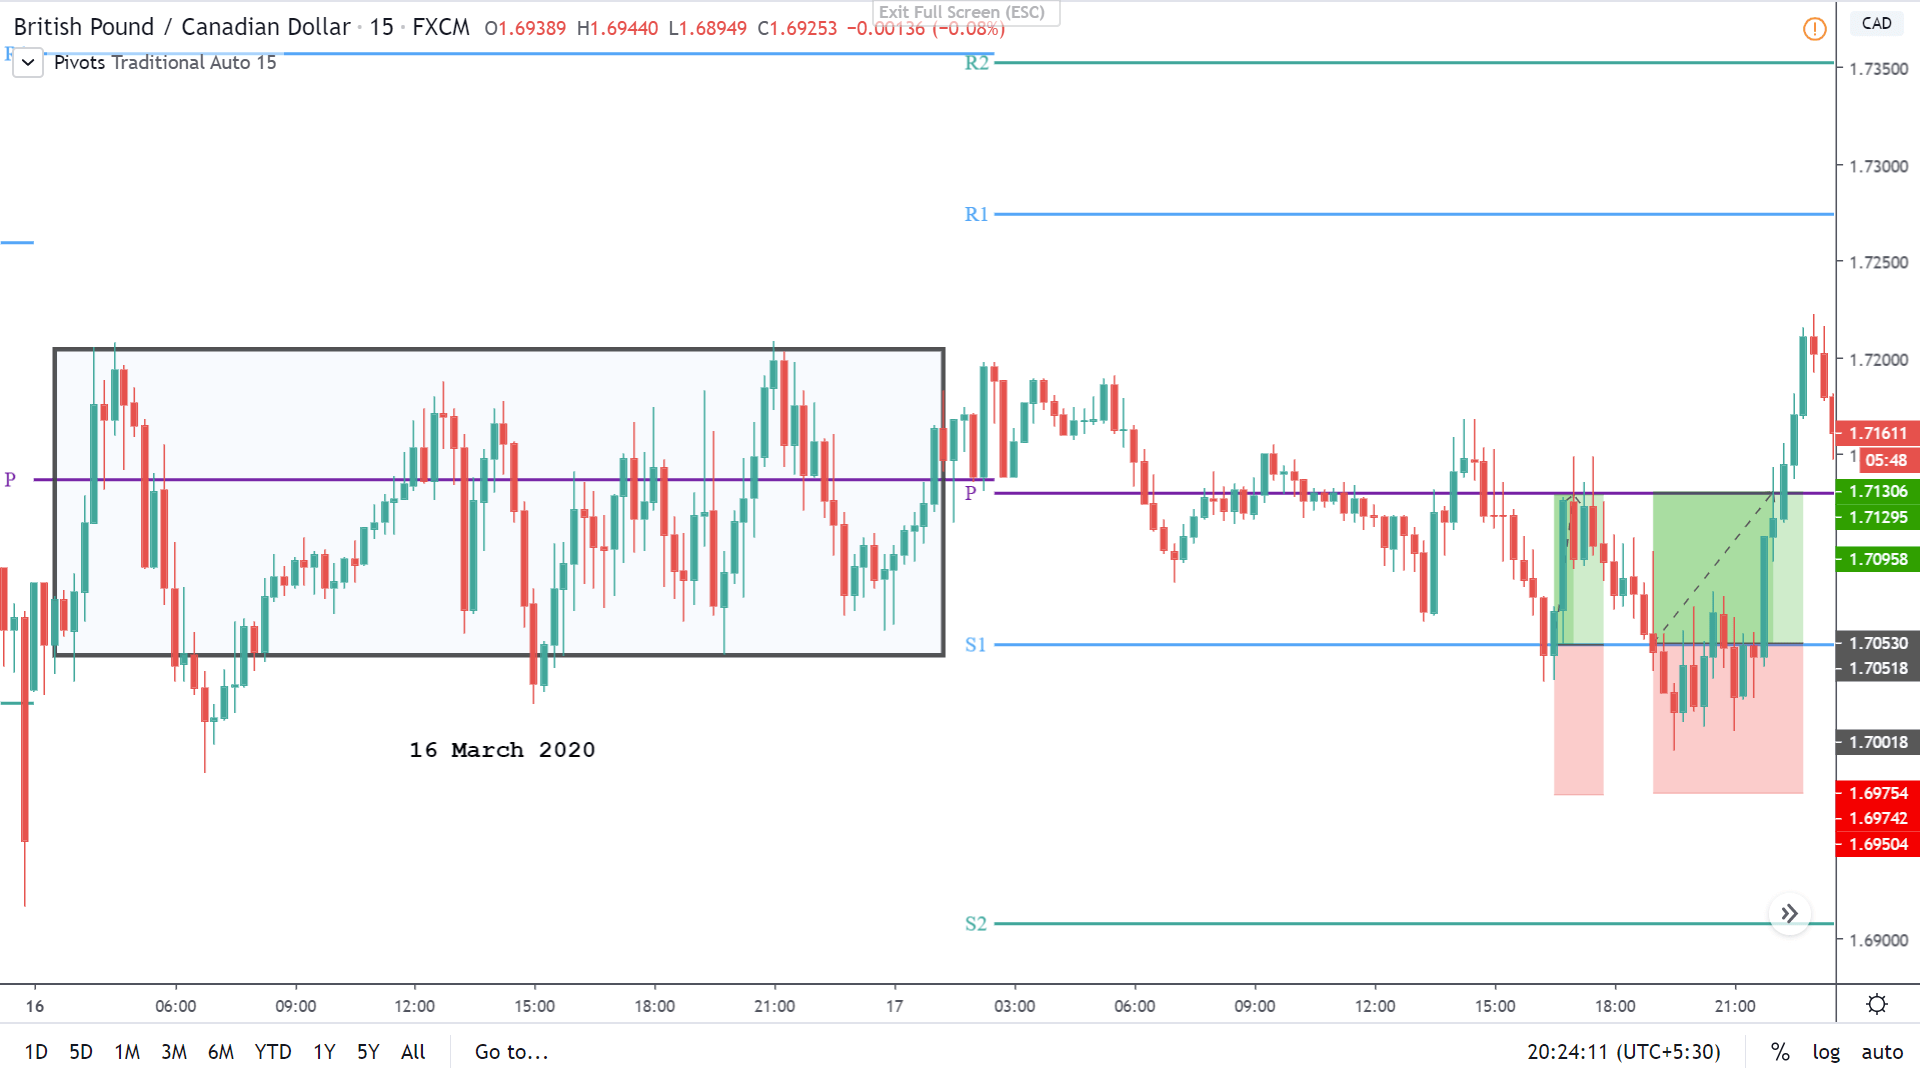
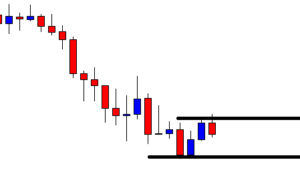
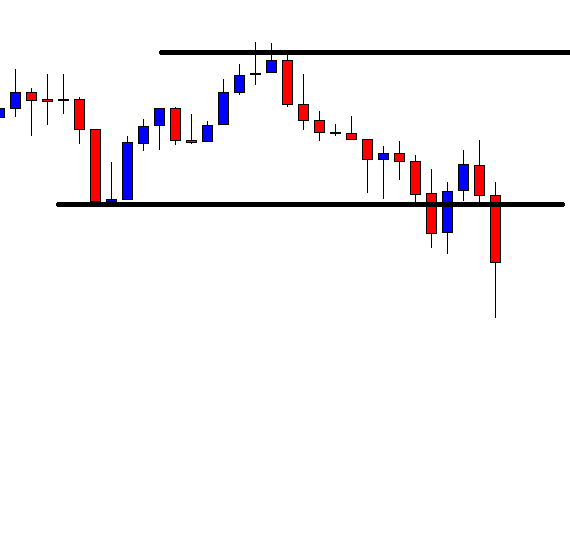
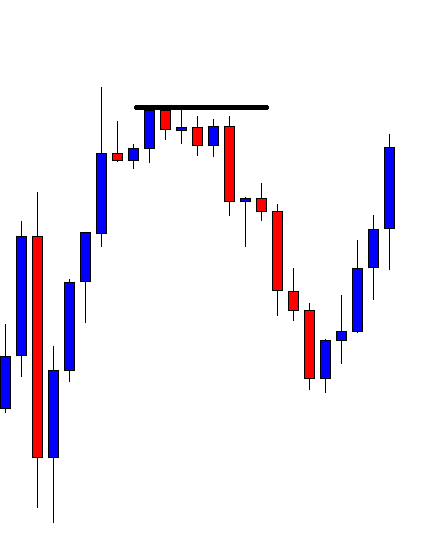
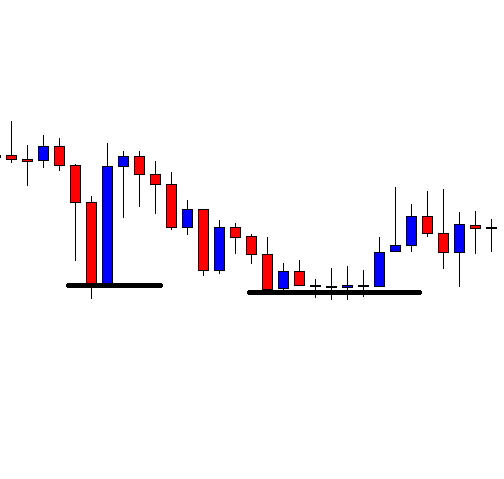
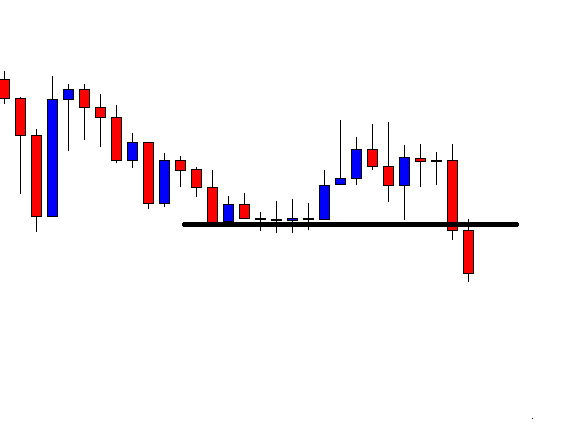
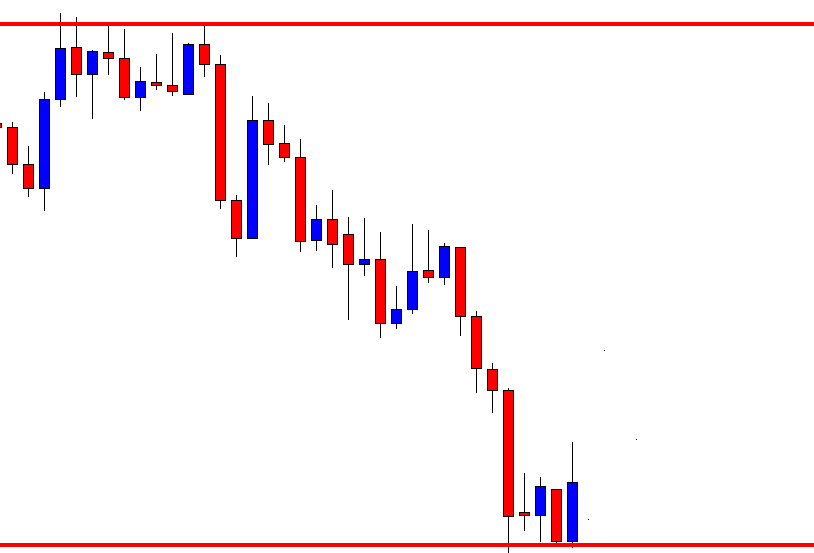
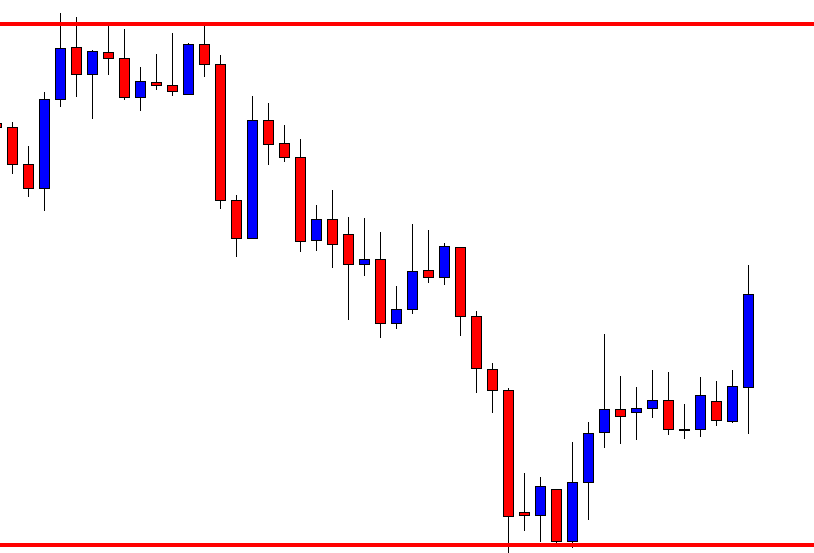
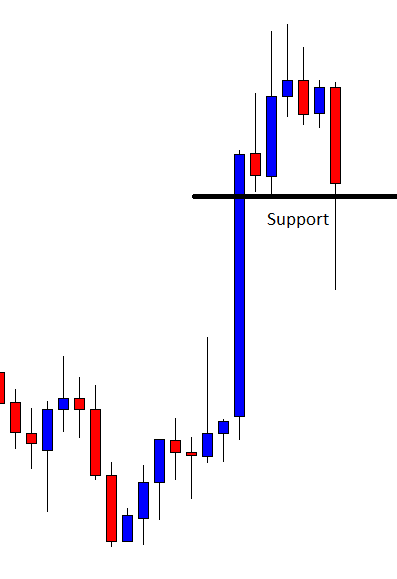
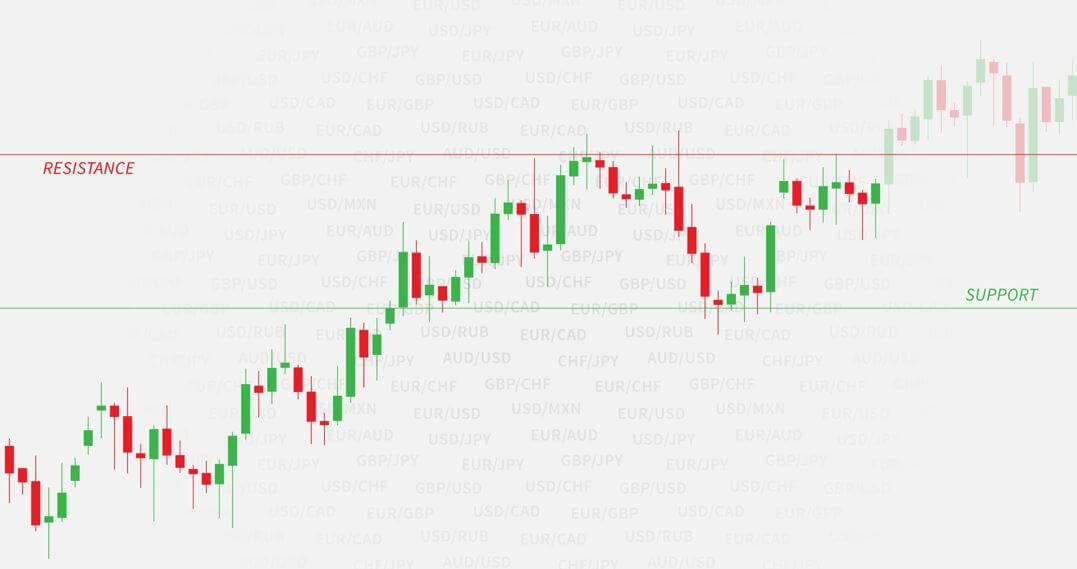
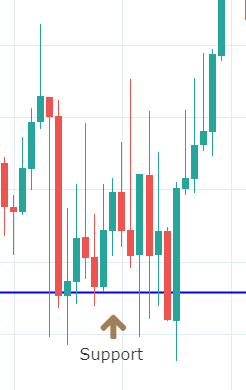
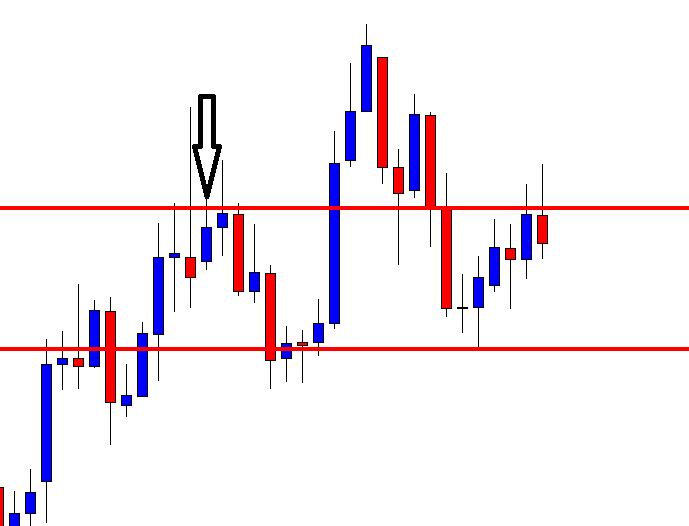
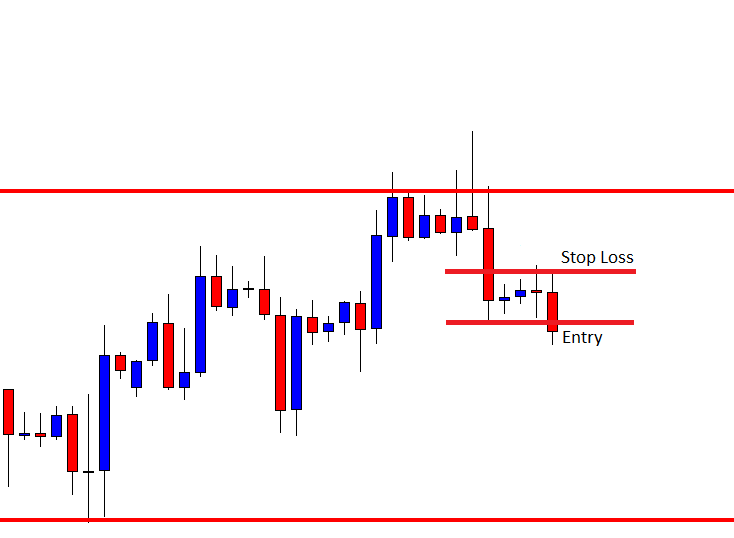
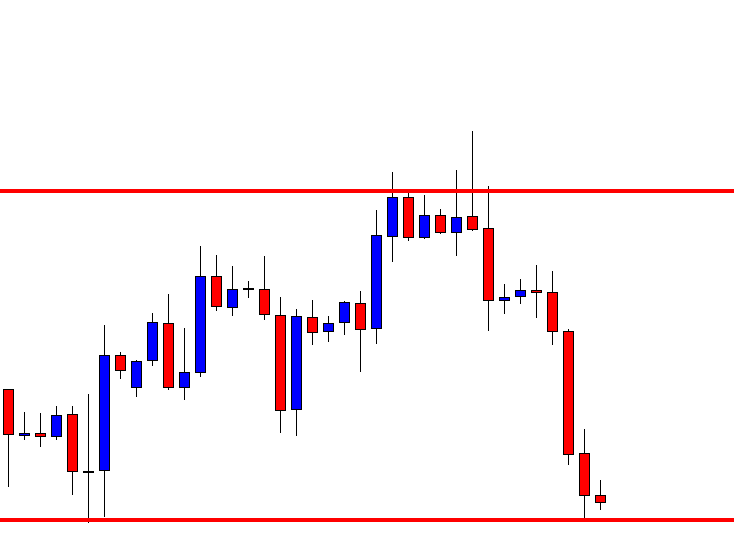
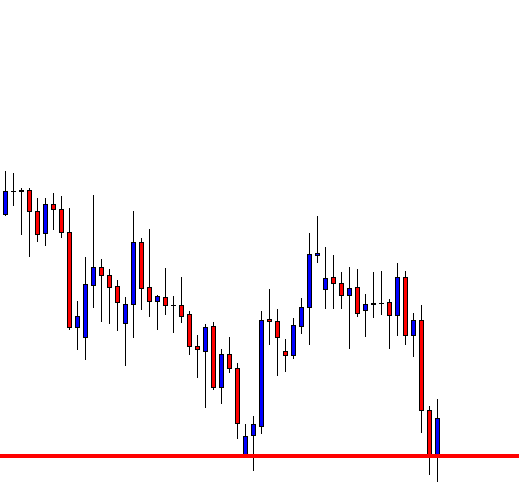
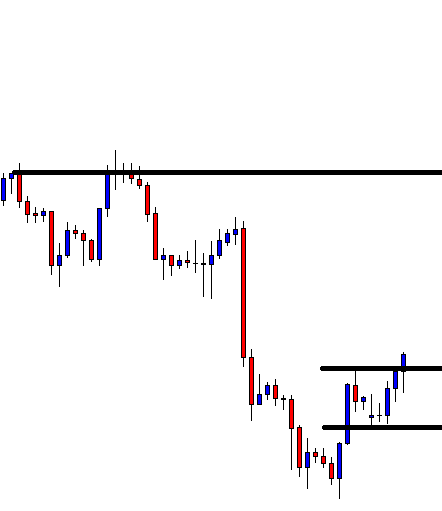
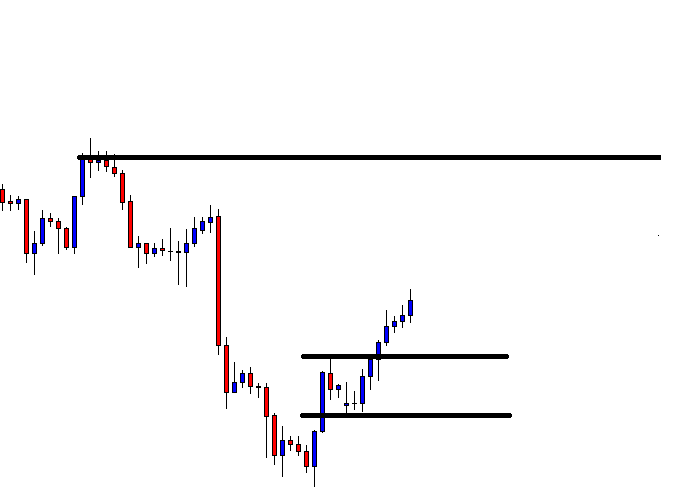
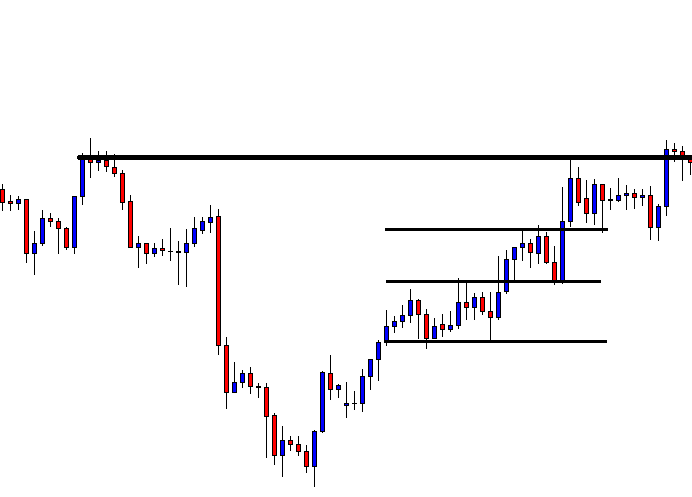
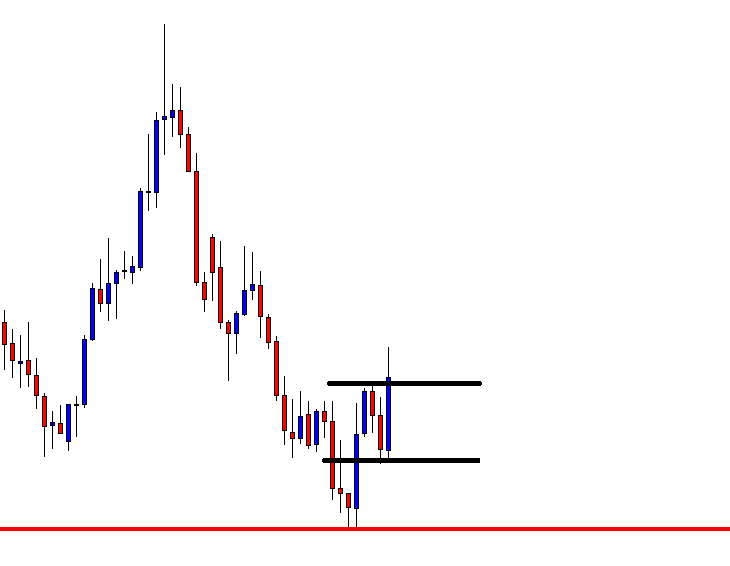
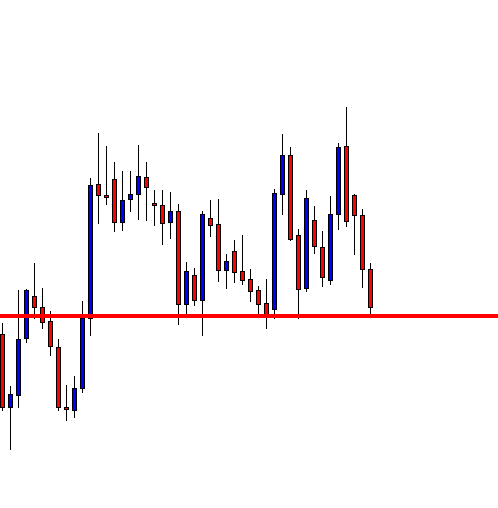
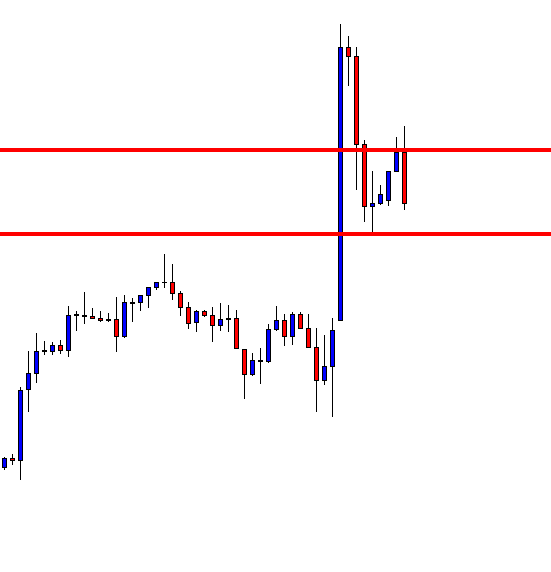
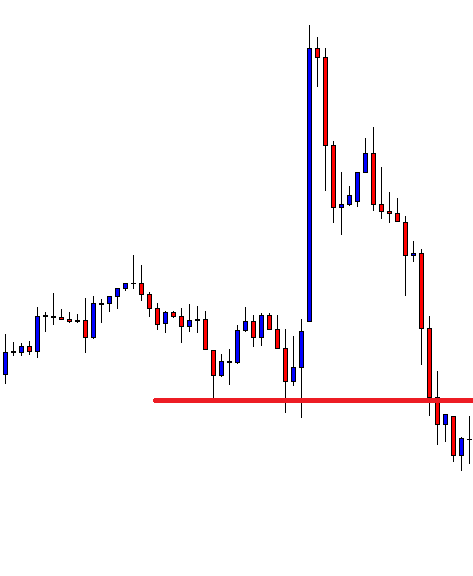
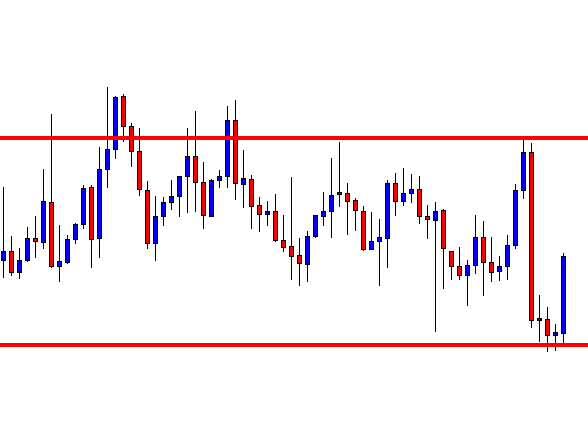
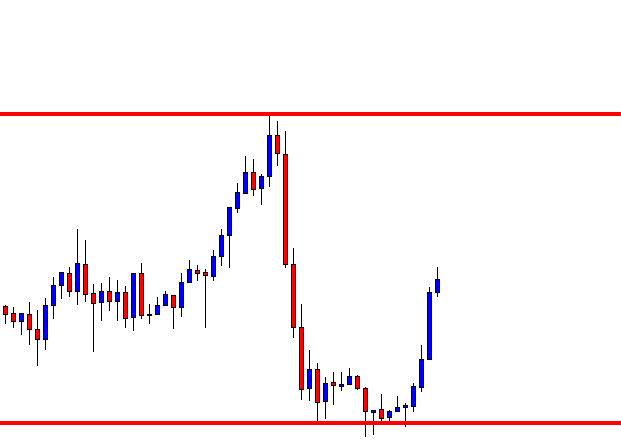
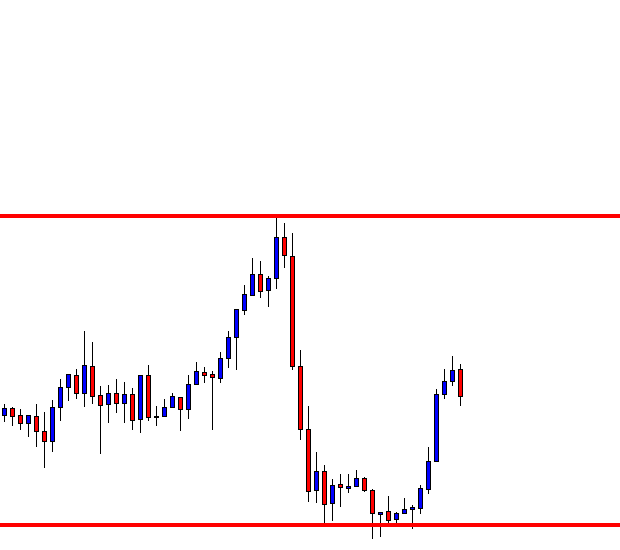
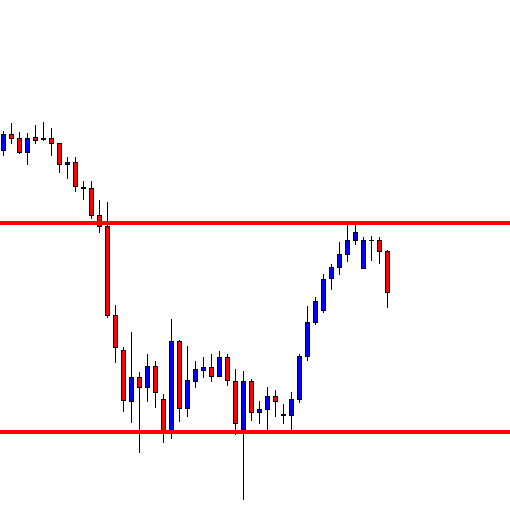
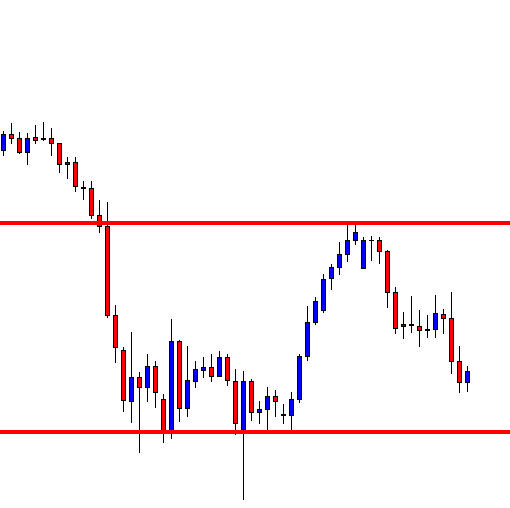
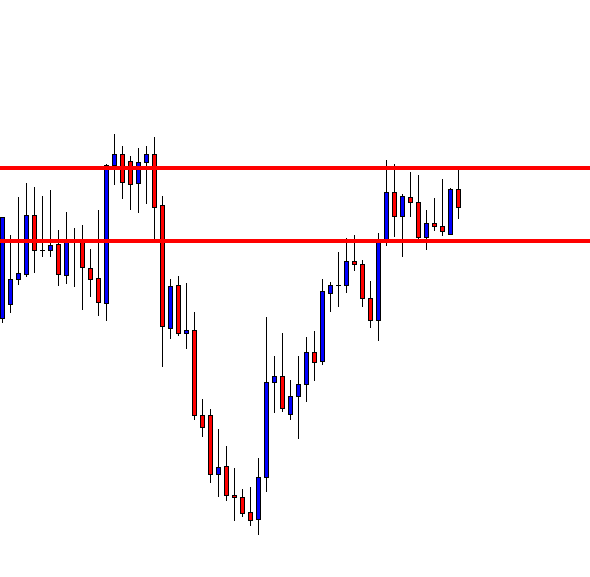
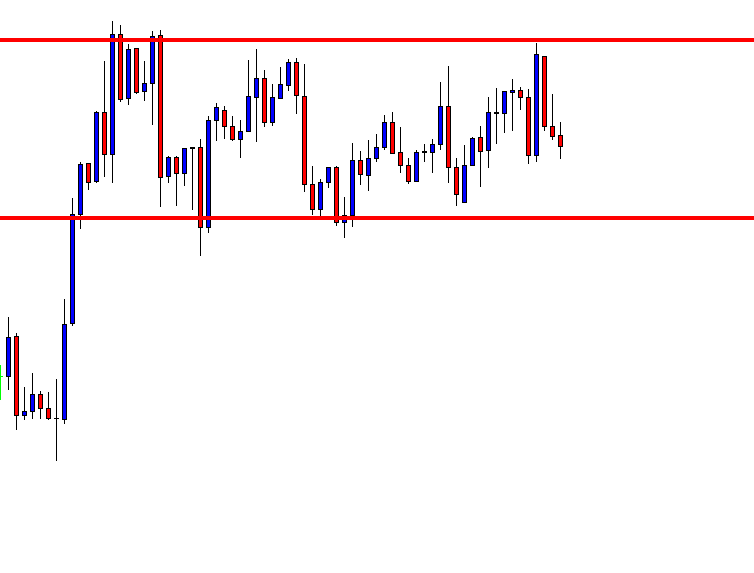
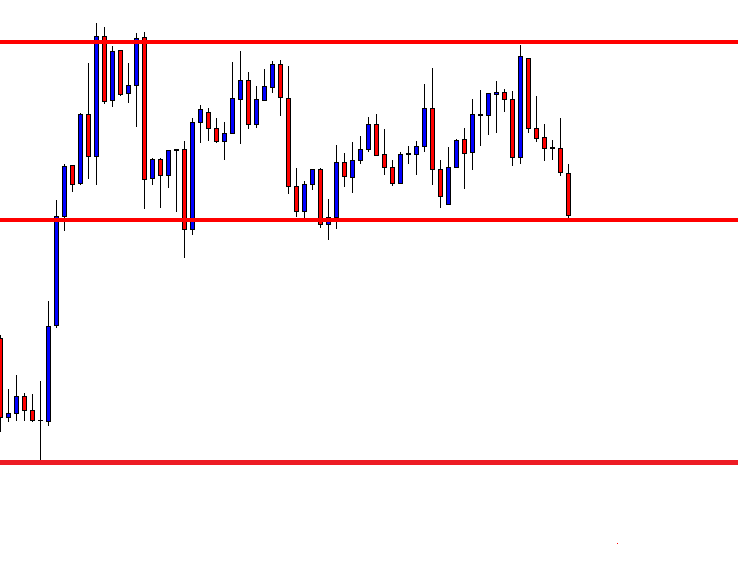
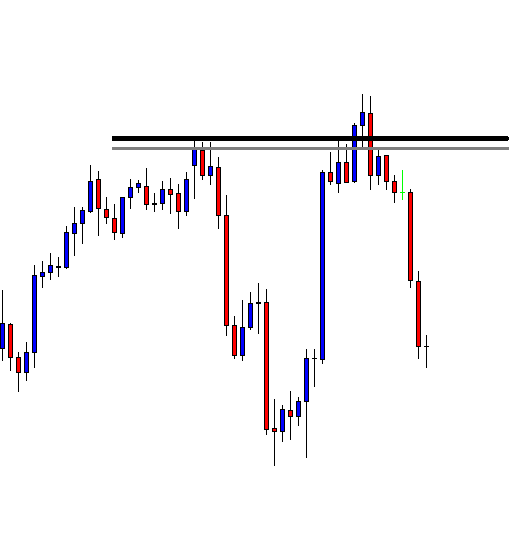
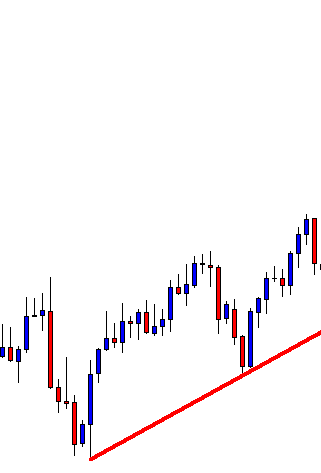
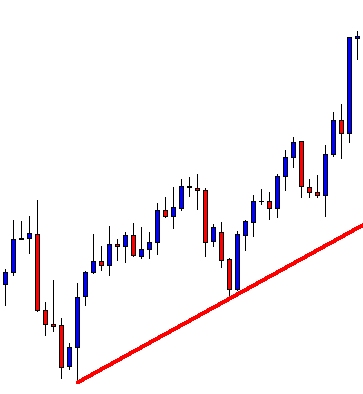
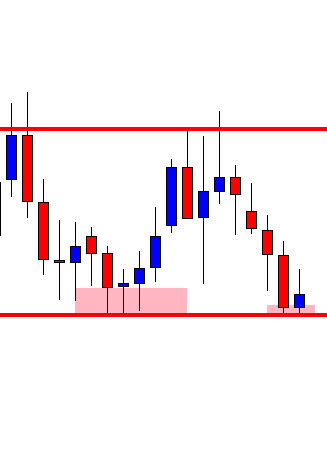
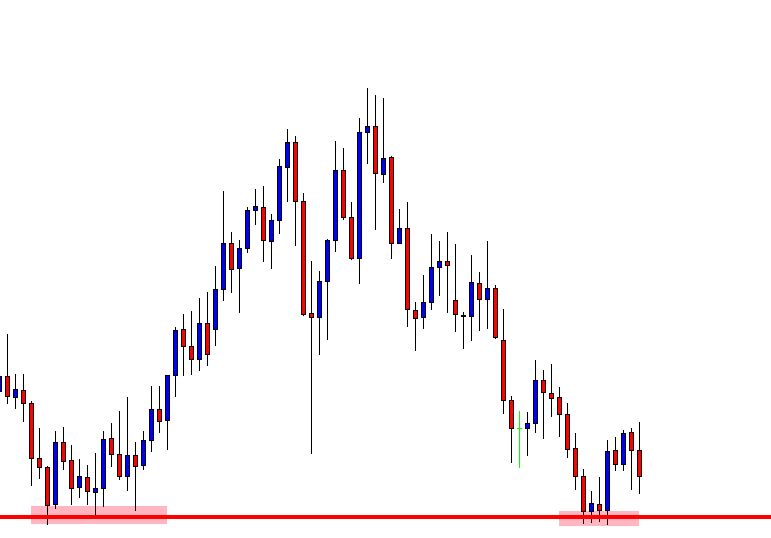
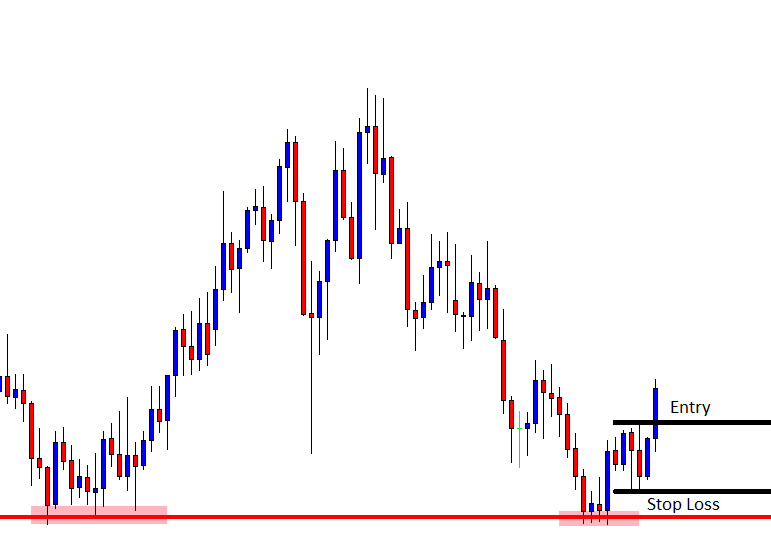
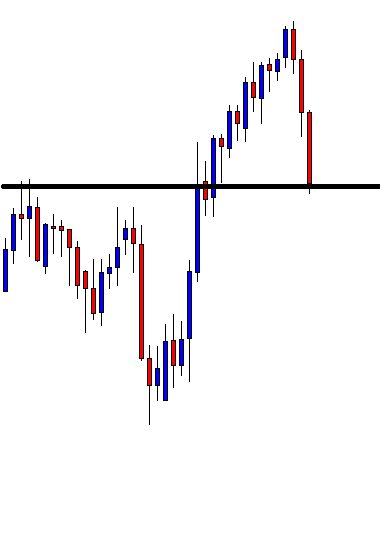
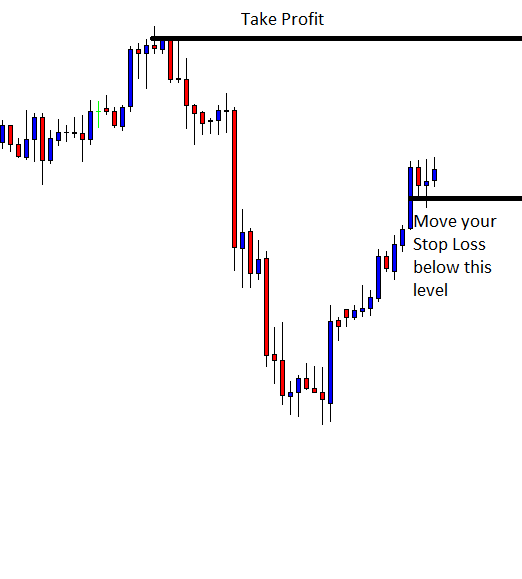
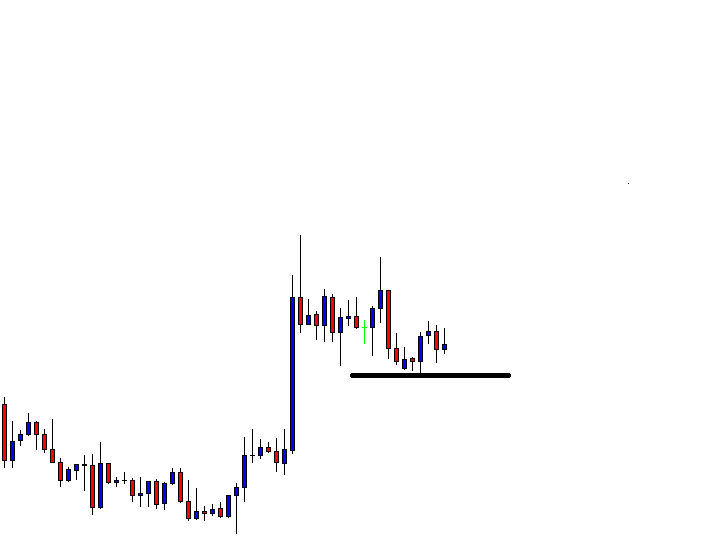
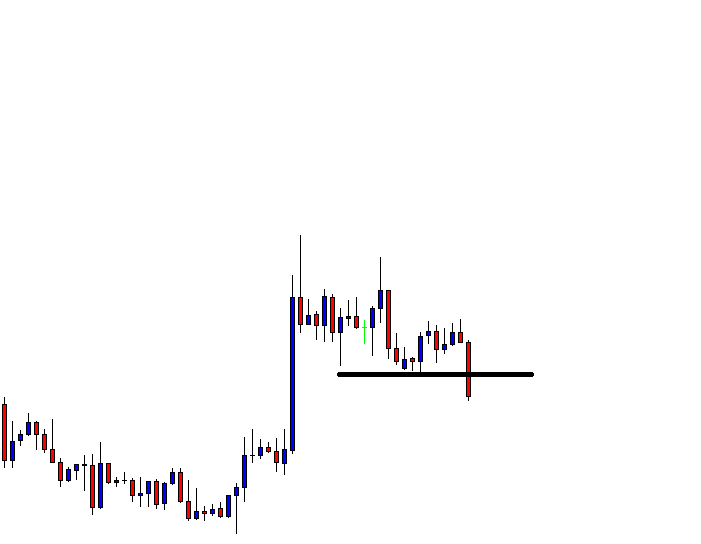
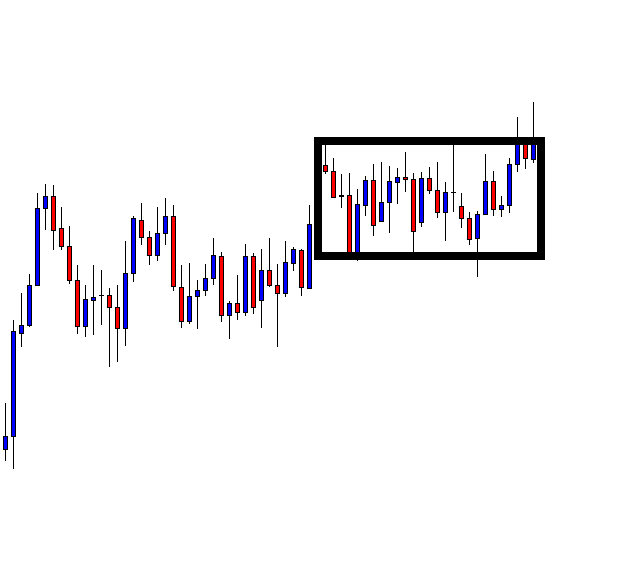
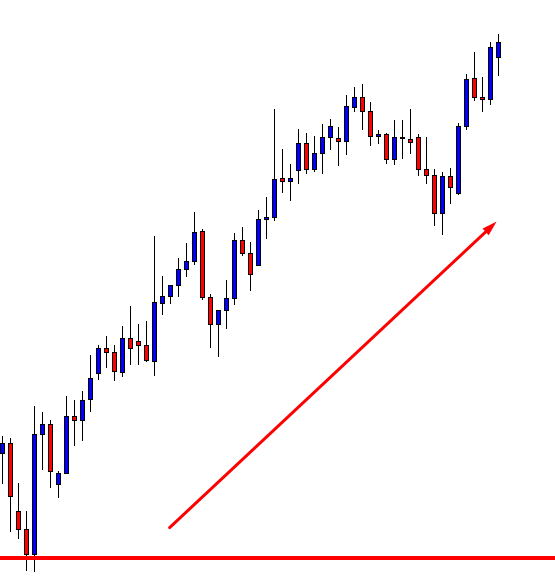
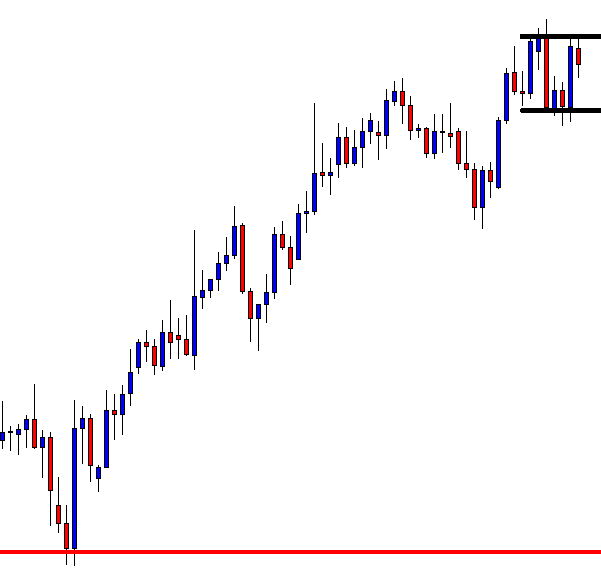
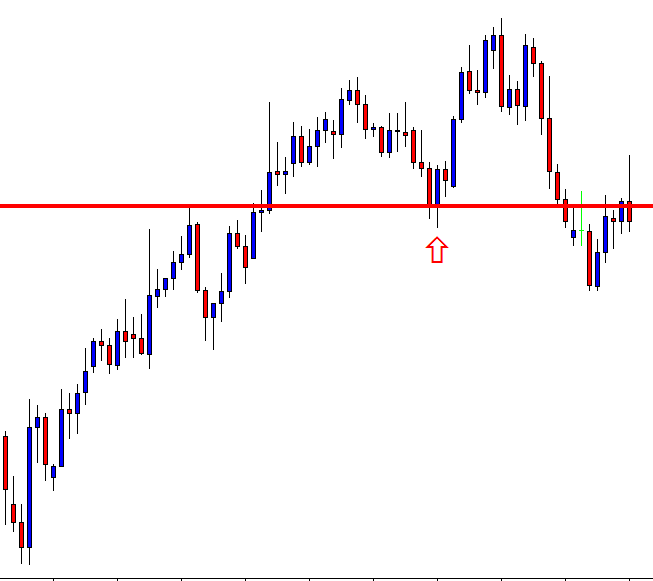
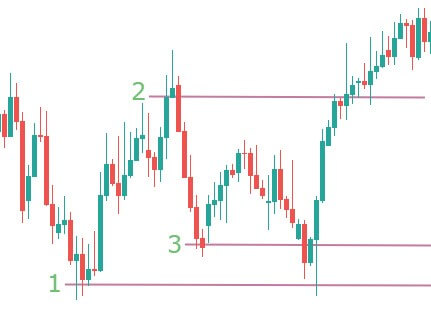
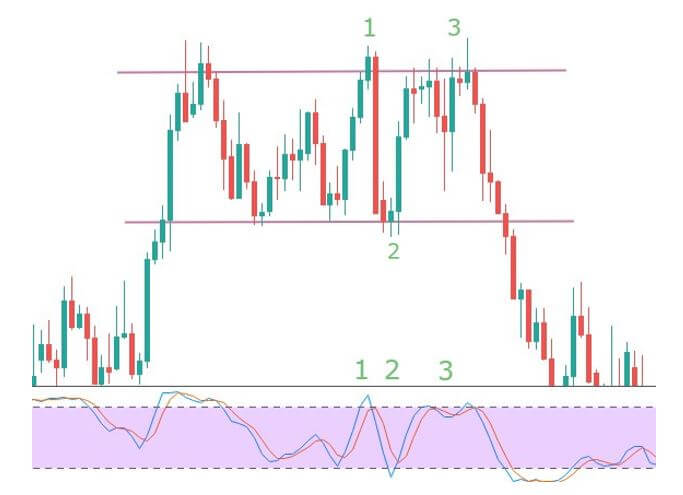
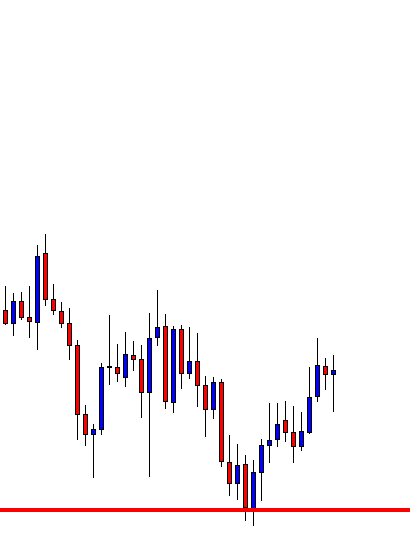
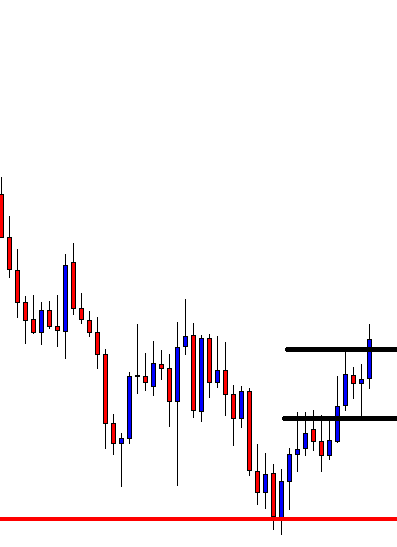
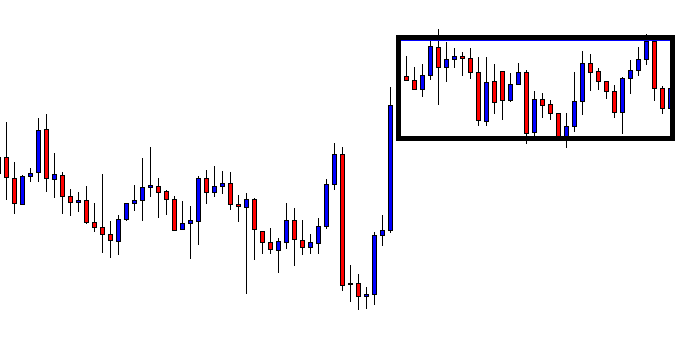
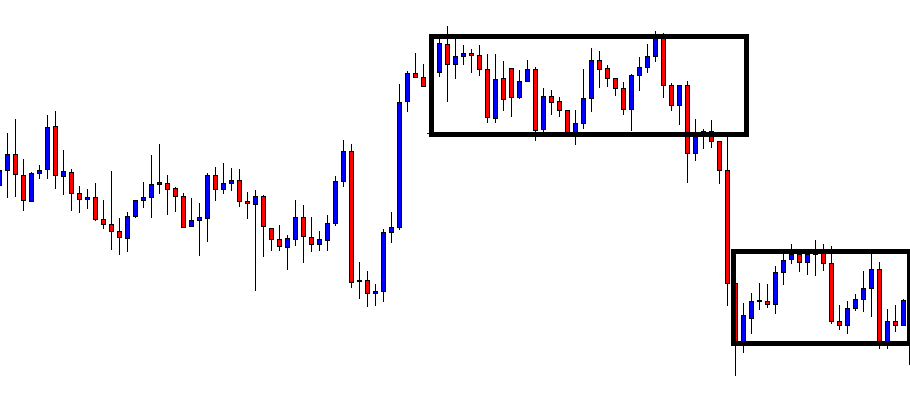
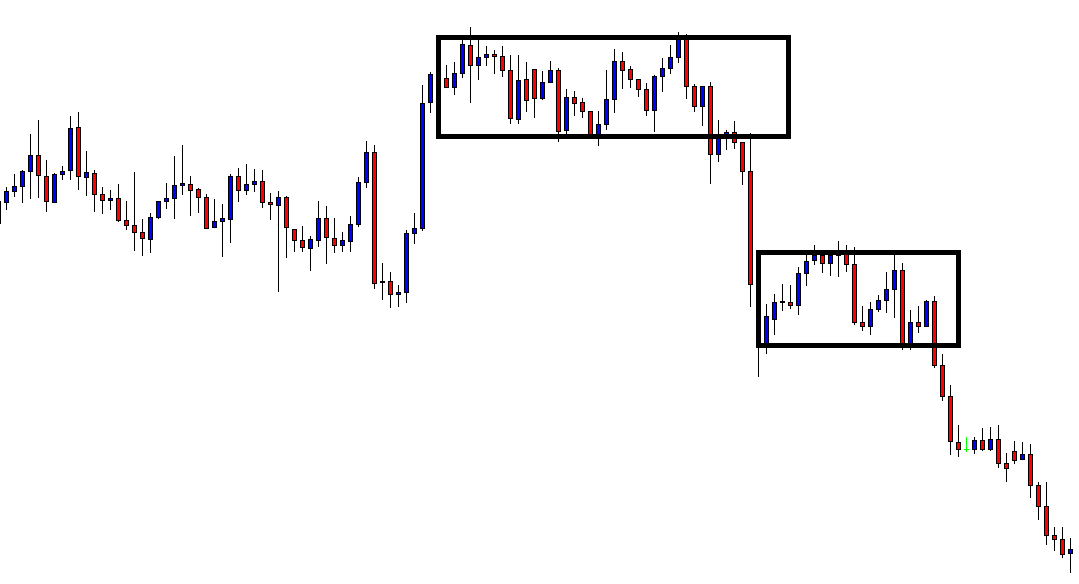
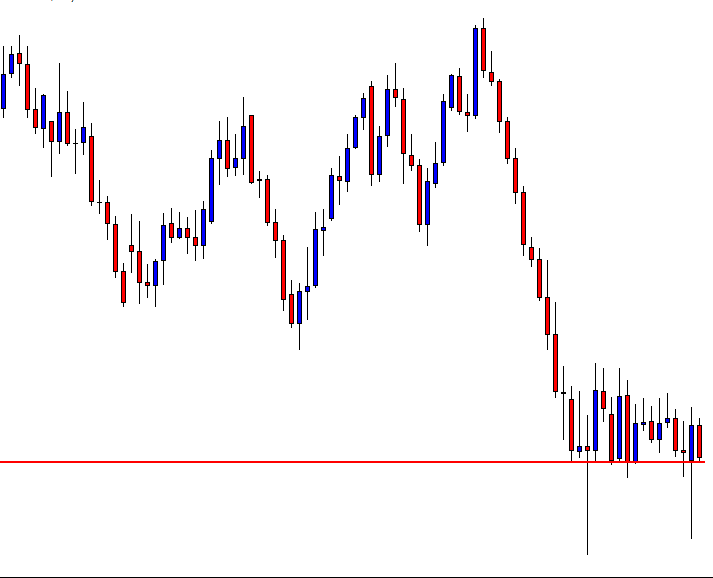
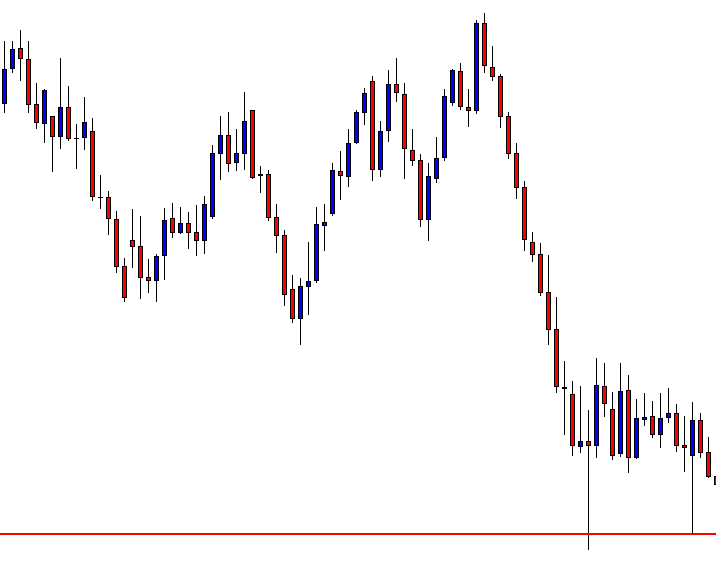
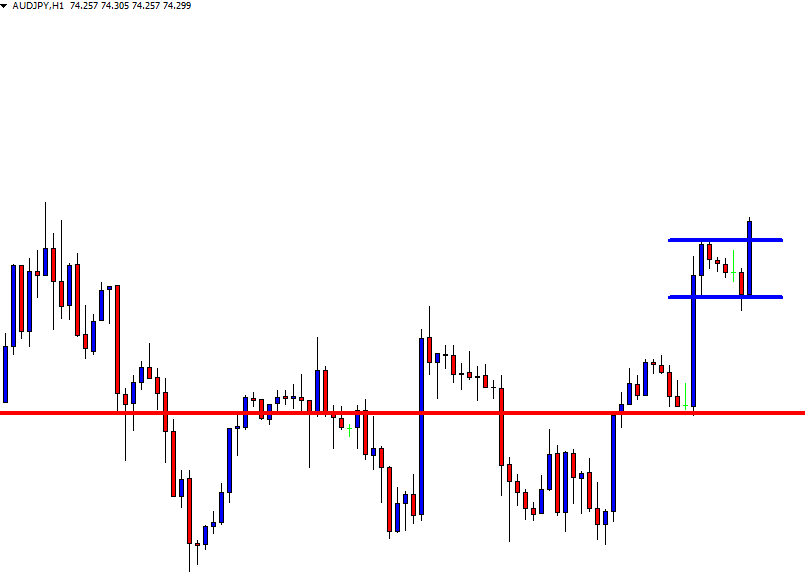
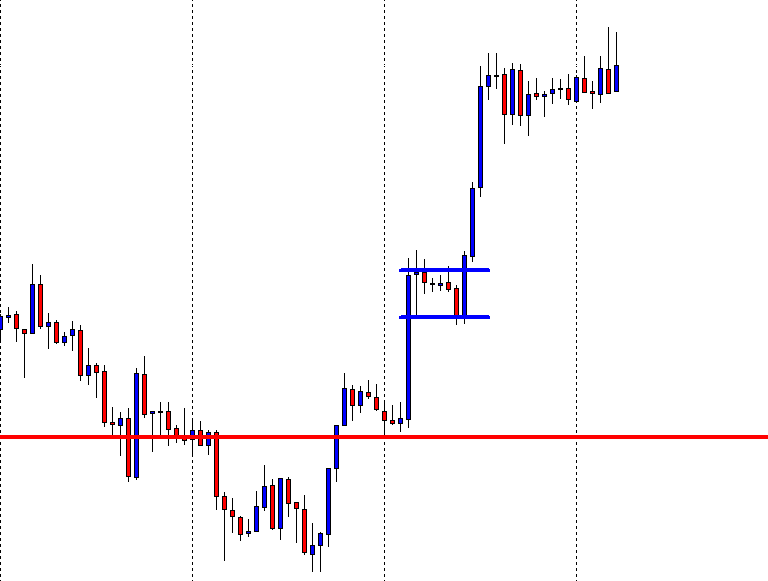
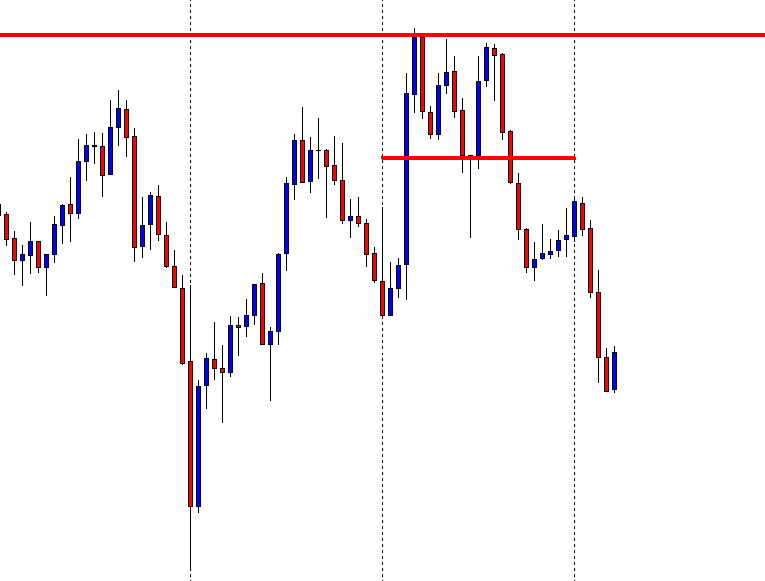
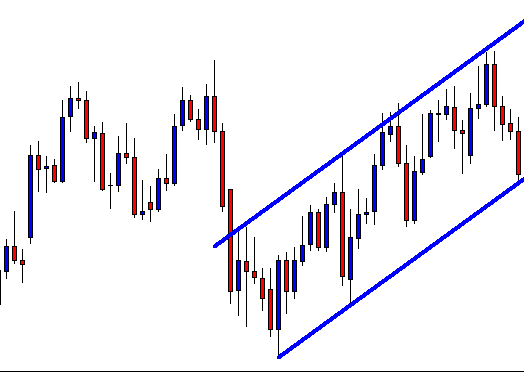
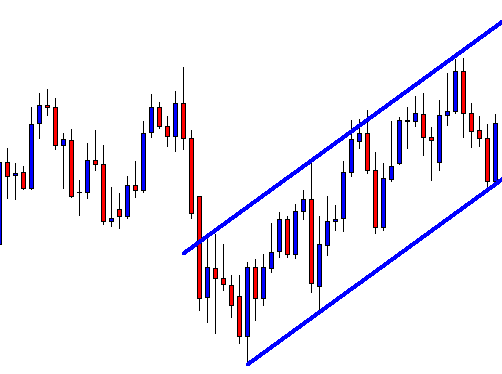
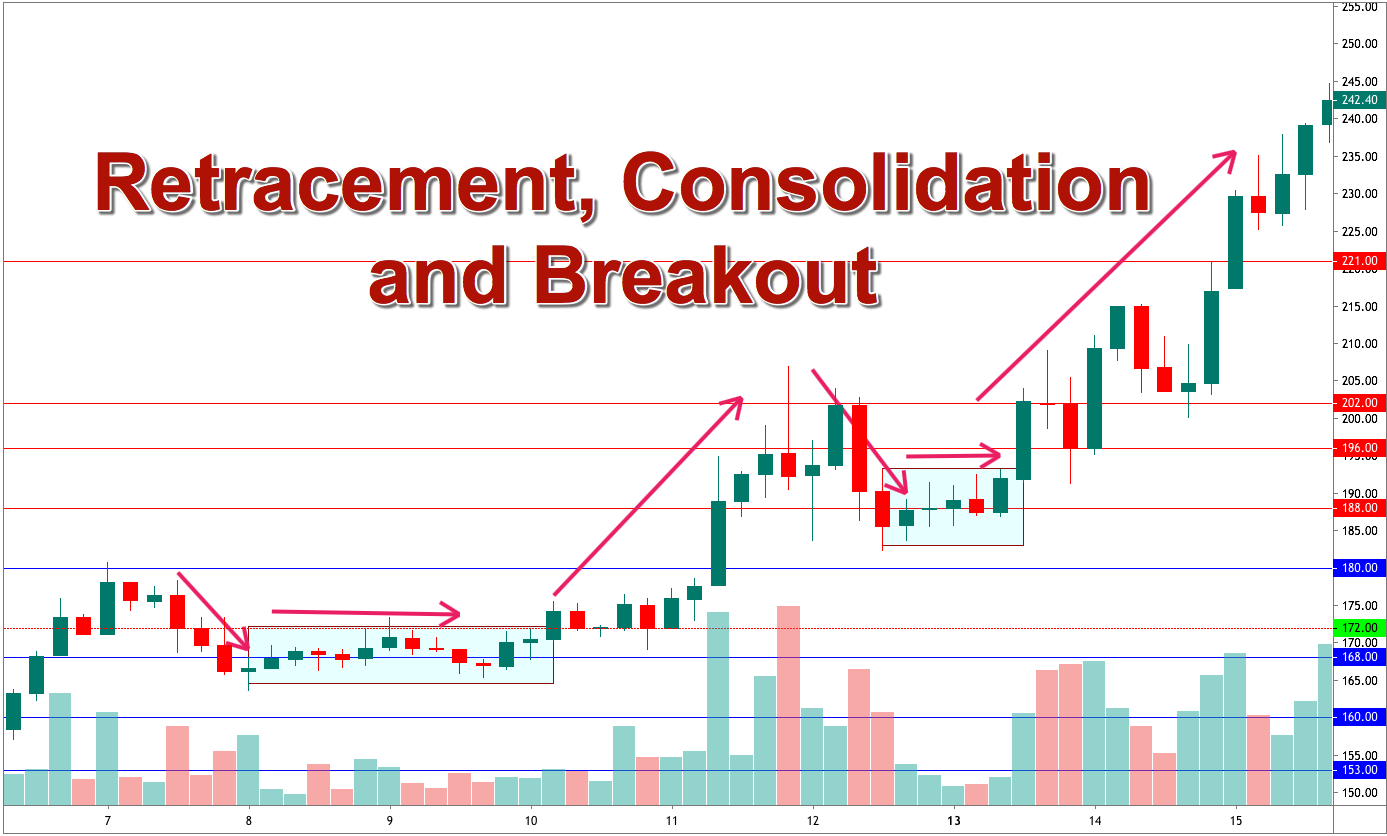
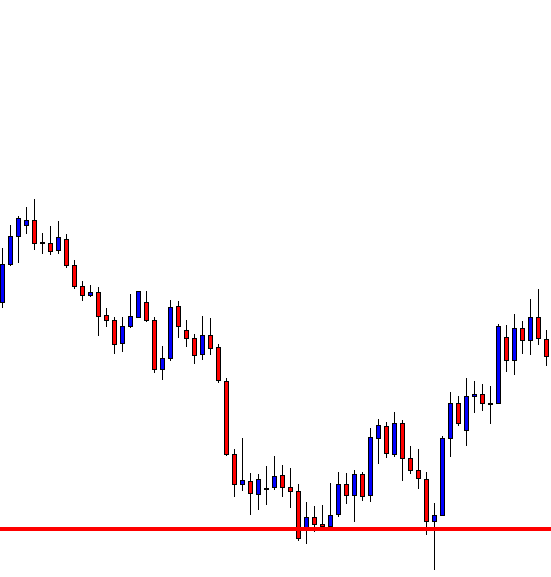
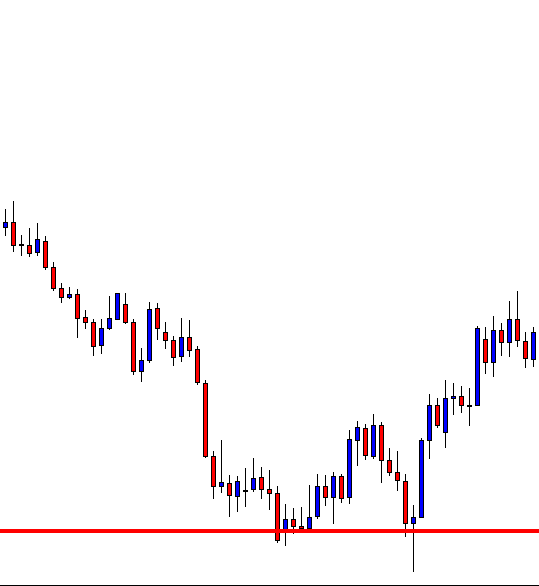
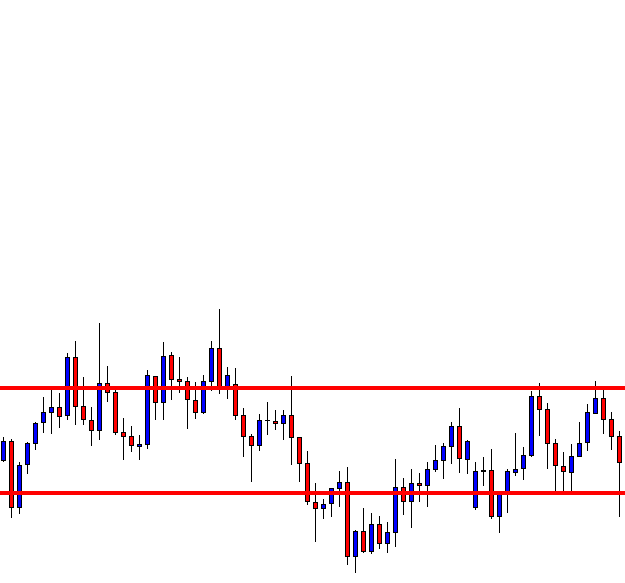
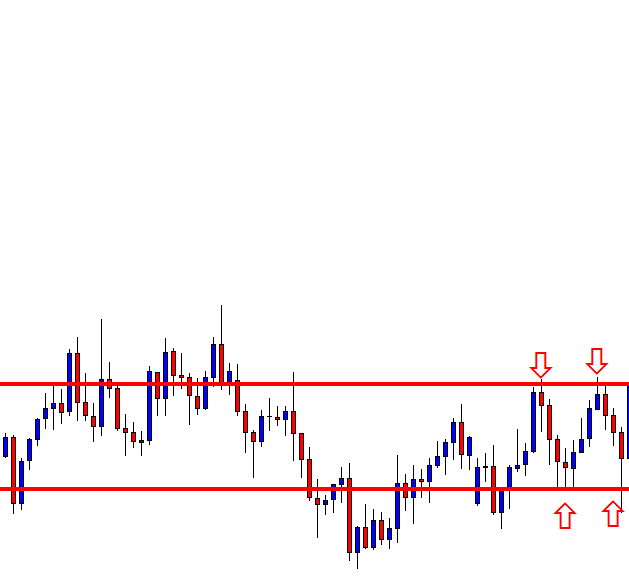
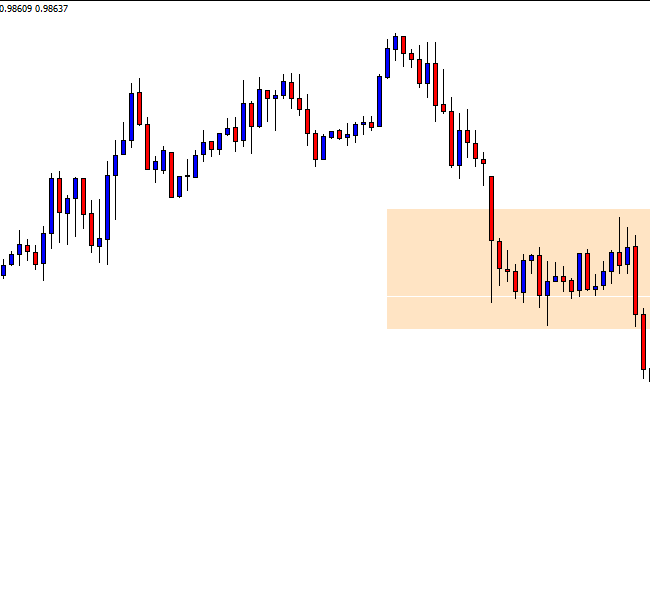
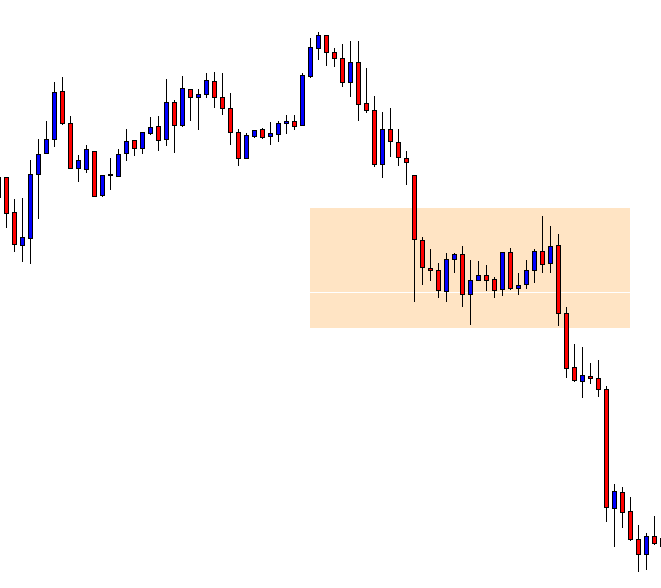
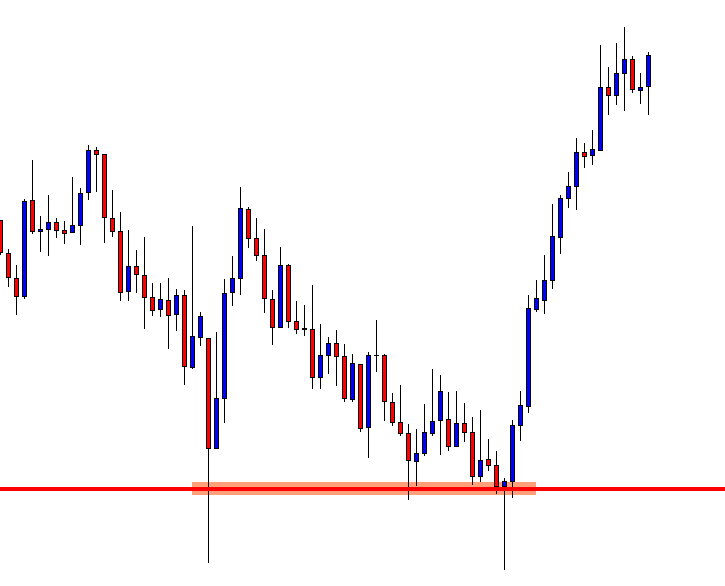
According to this strategy, one can consider buying when the support level of the pivot points coincides with the support level of the range. A similar strategy can be applied for shorting as well.

Breakout Trading Strategy

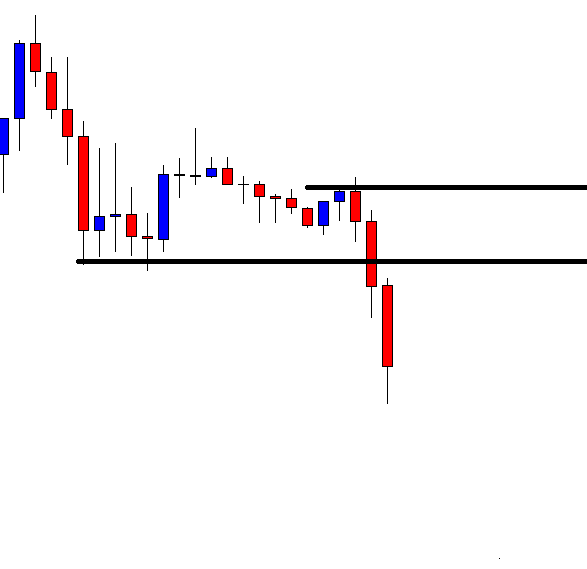
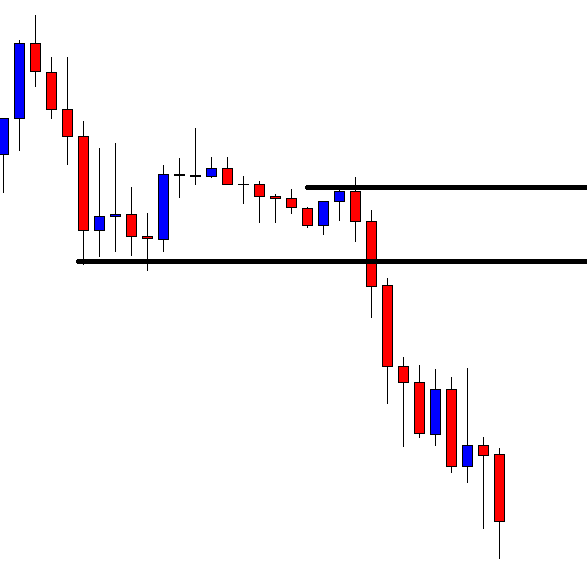
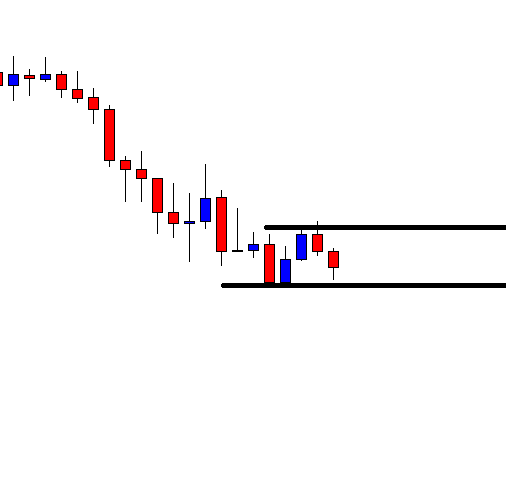
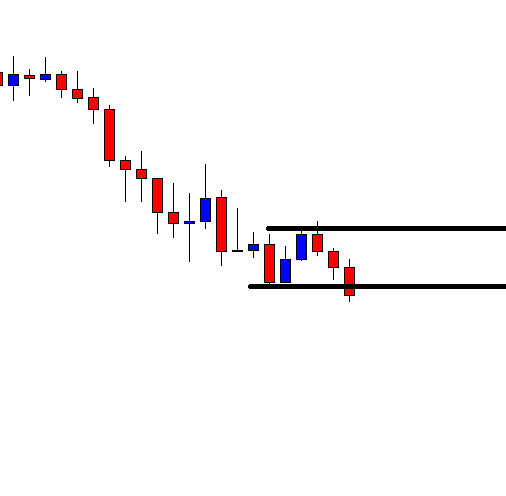
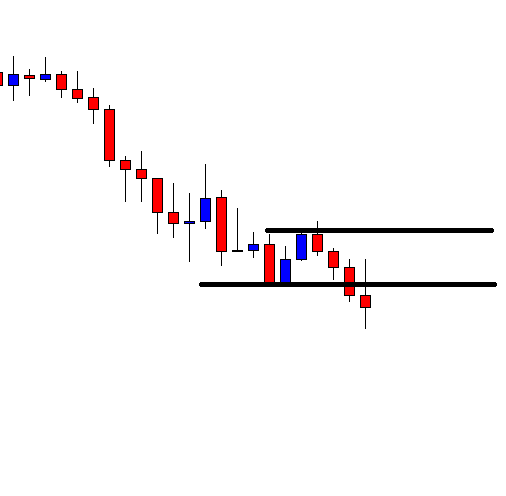
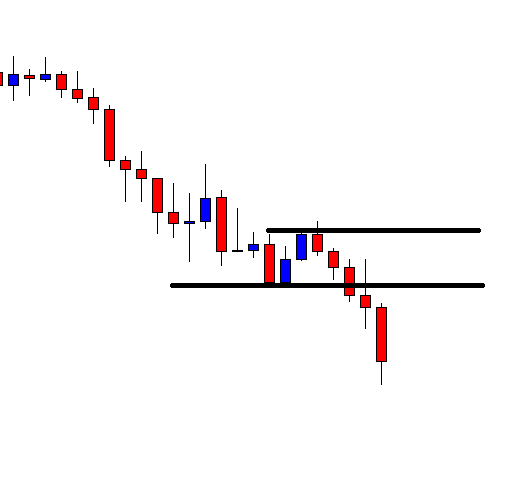
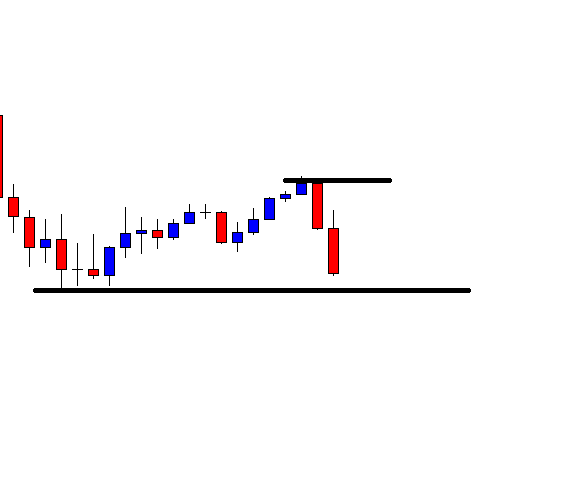
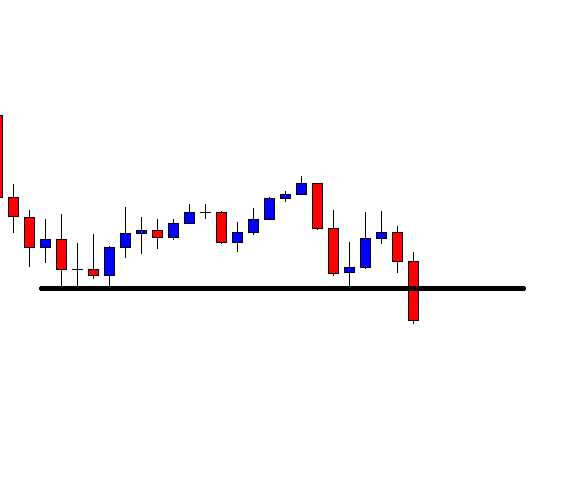
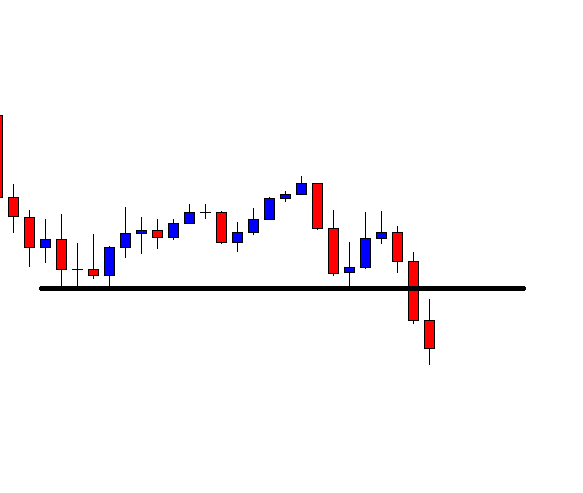
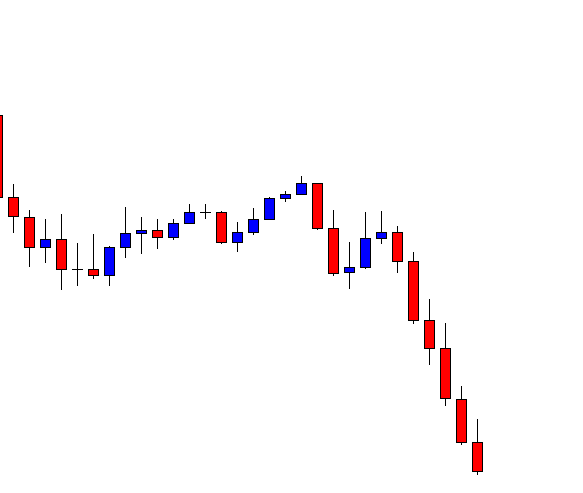
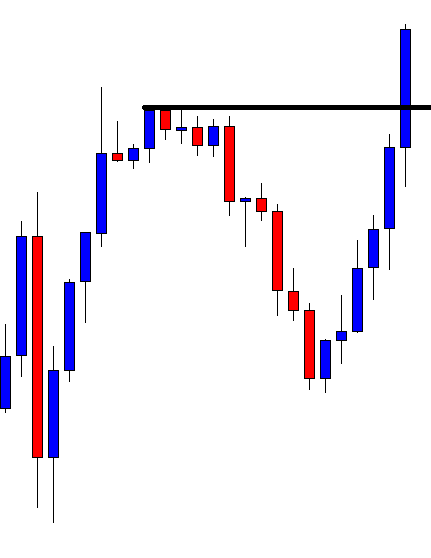
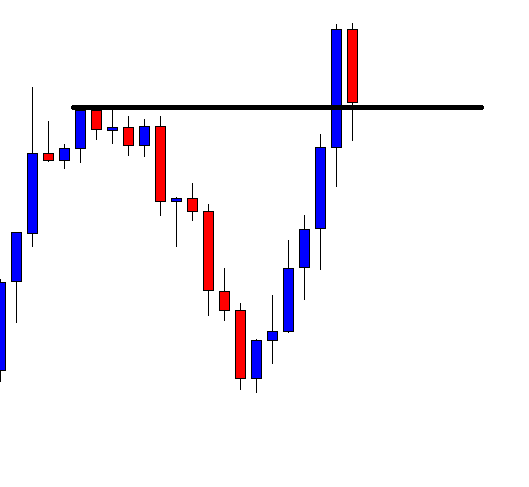
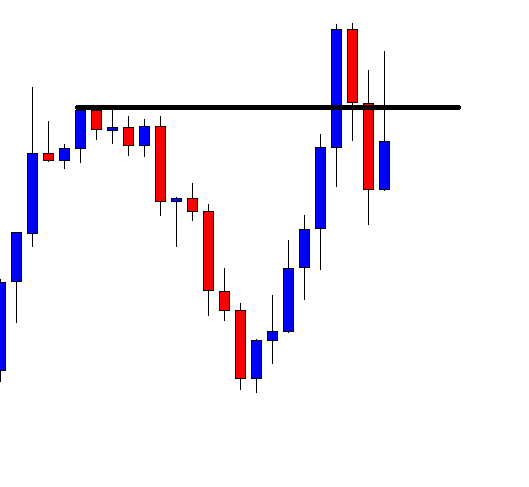
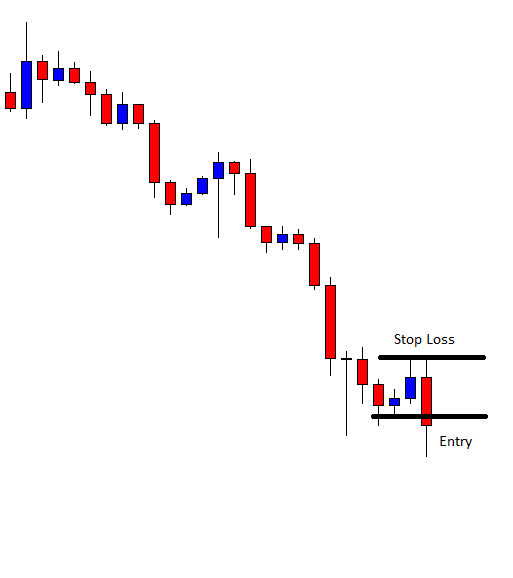
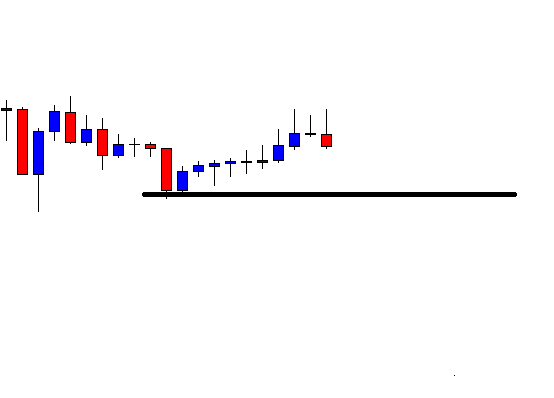
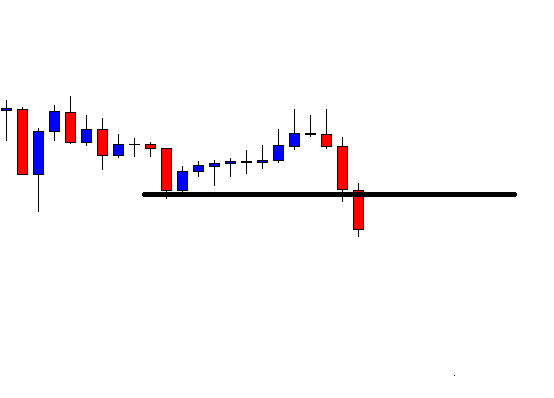
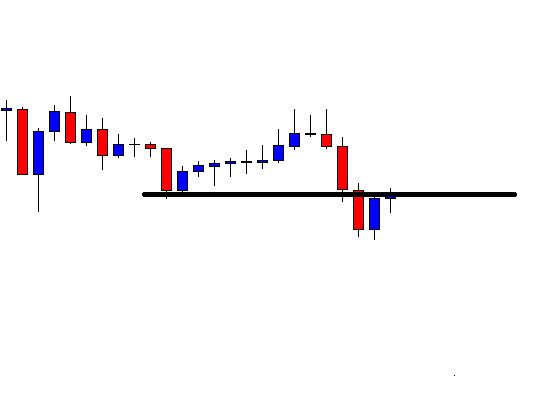
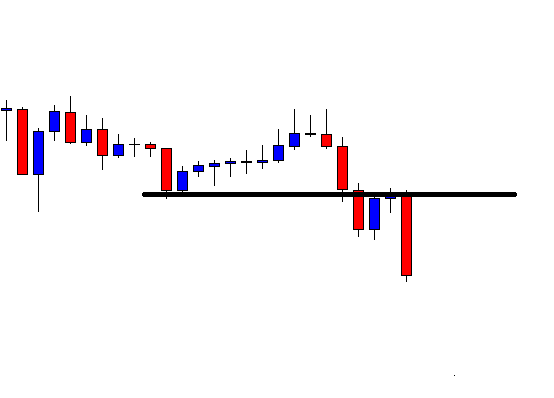
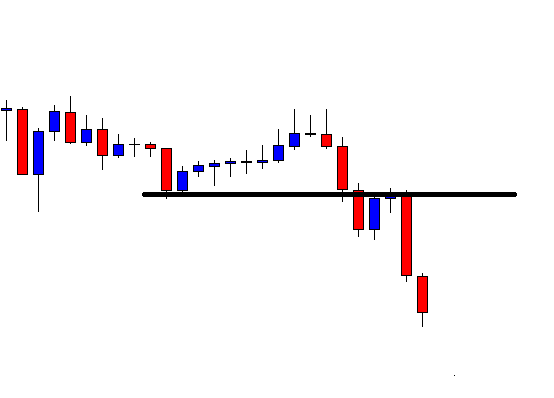
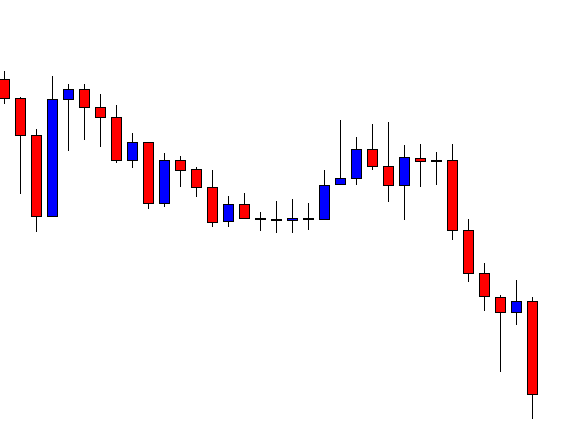
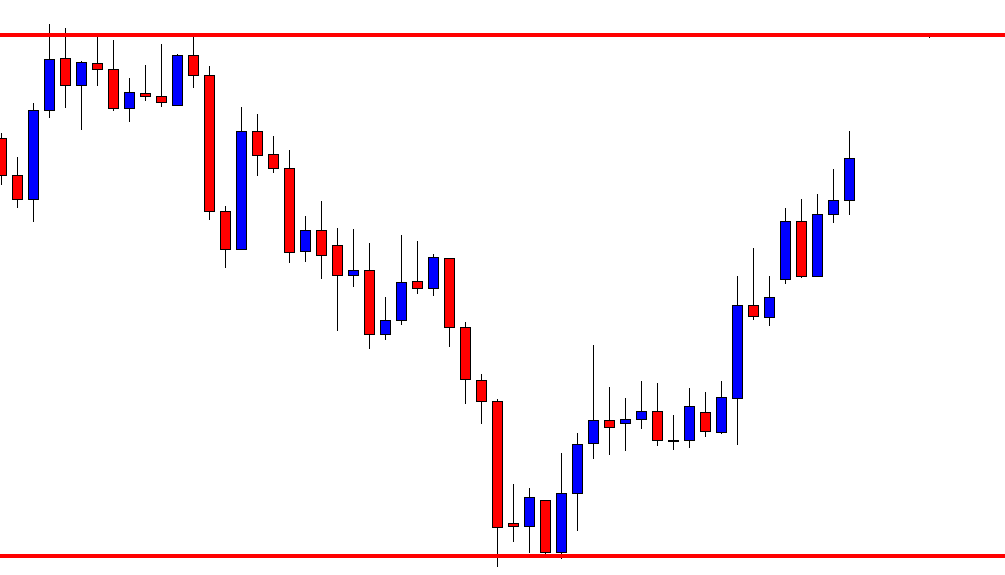
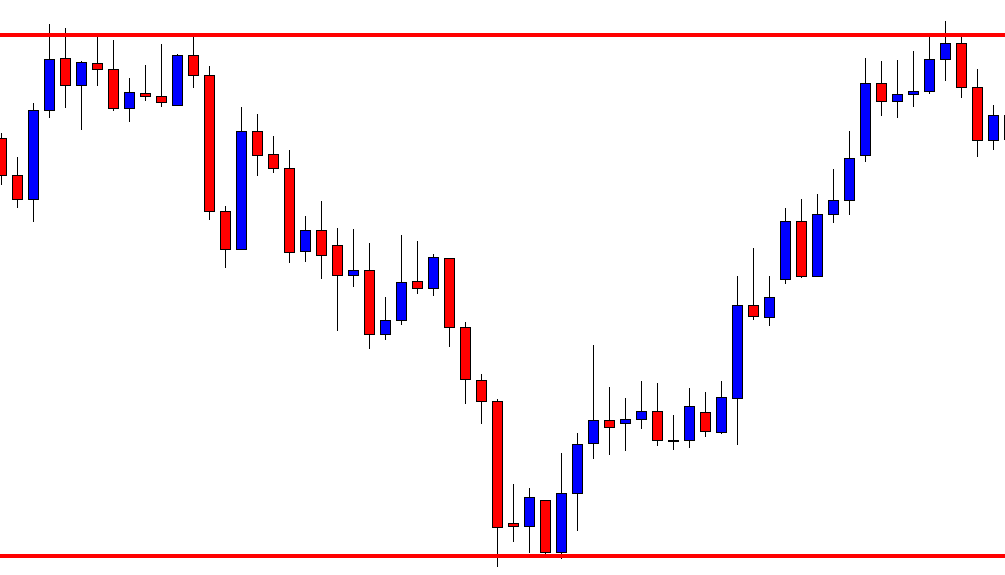
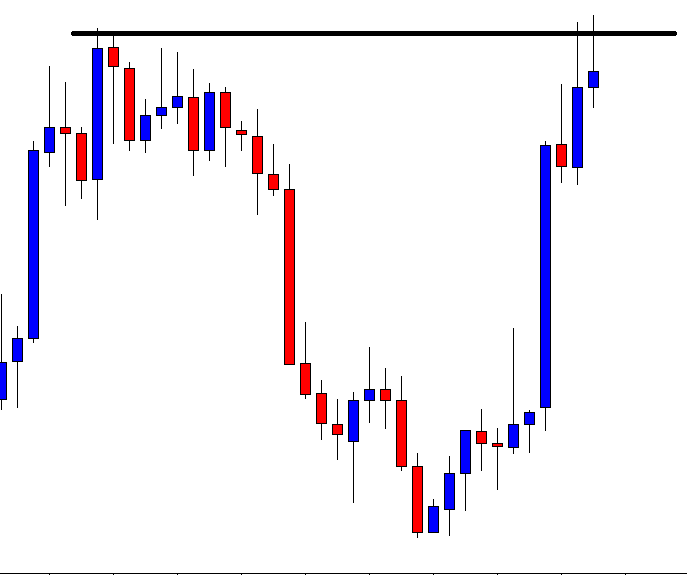
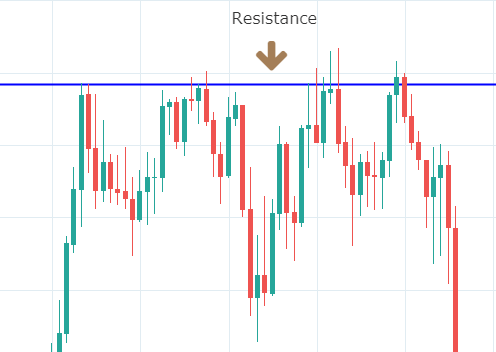
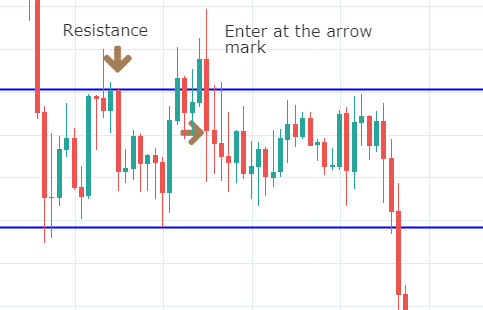
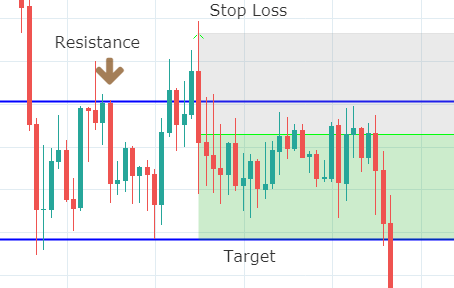
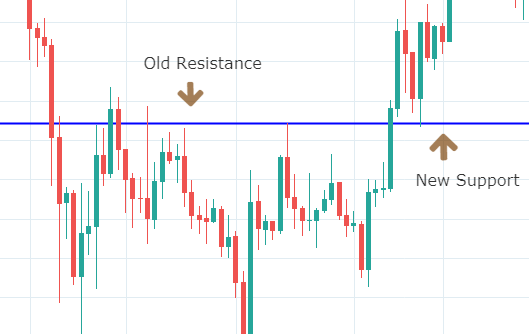
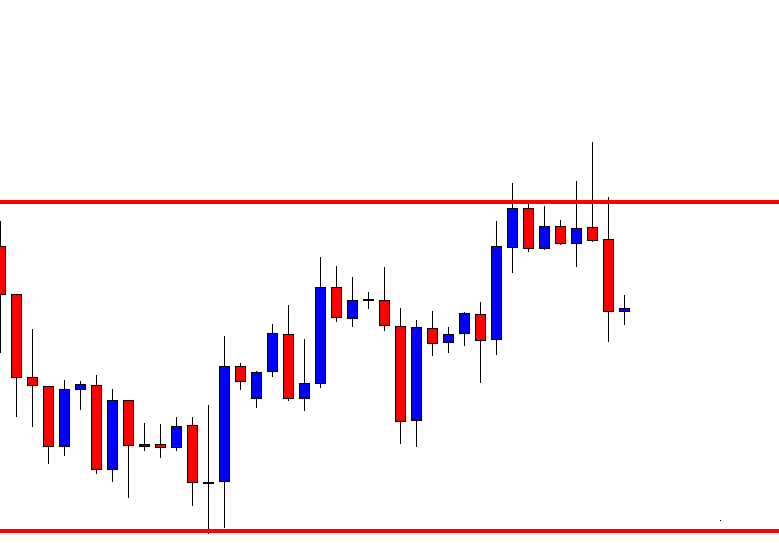
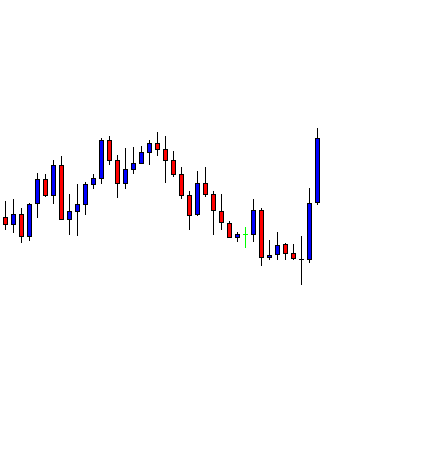
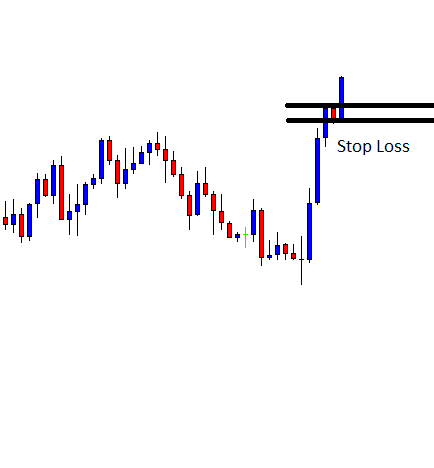
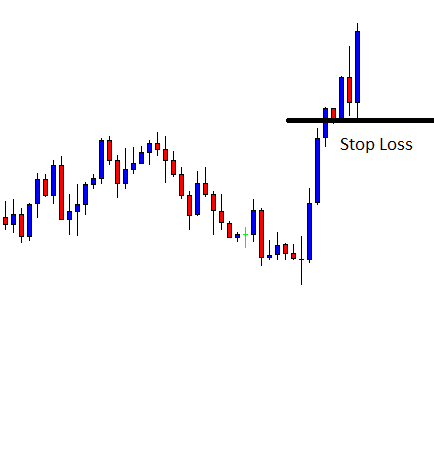
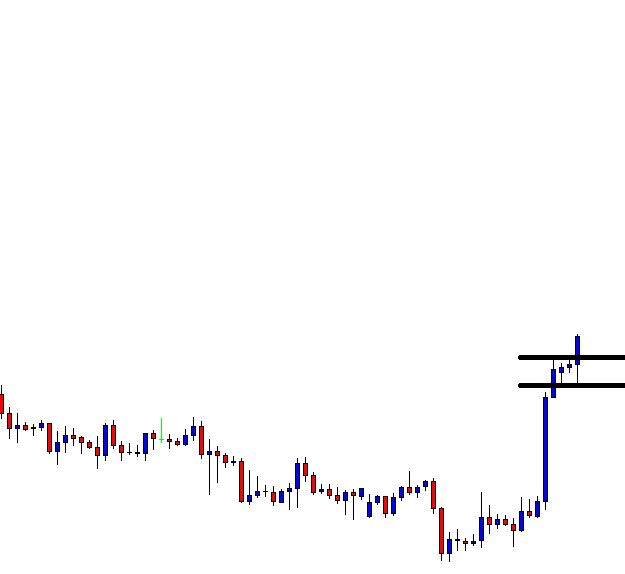
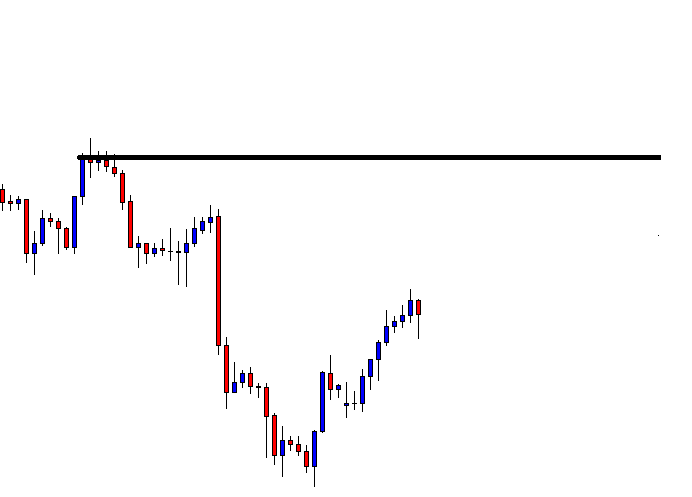
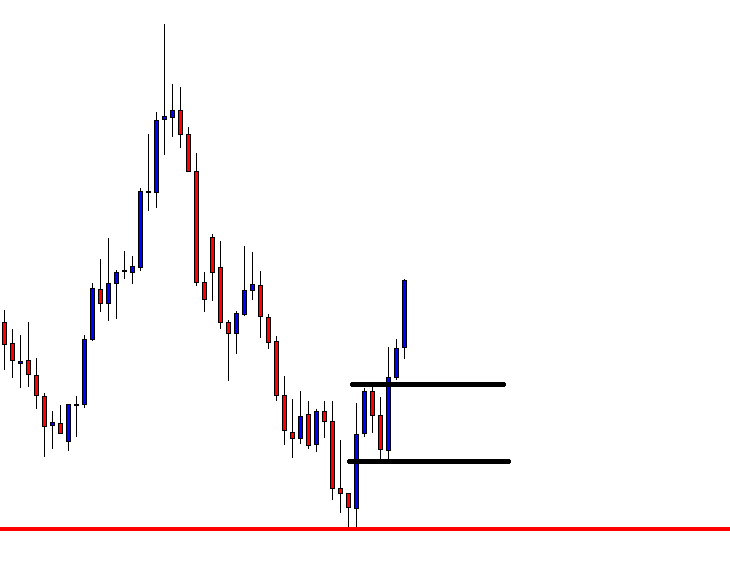
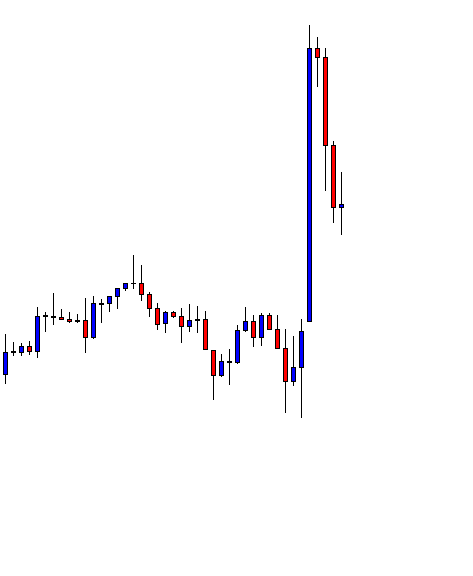
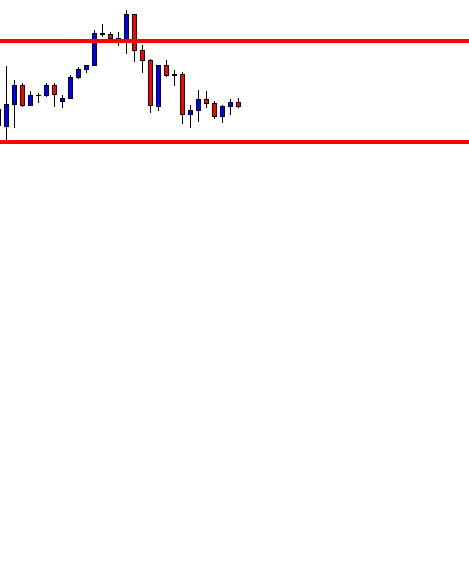
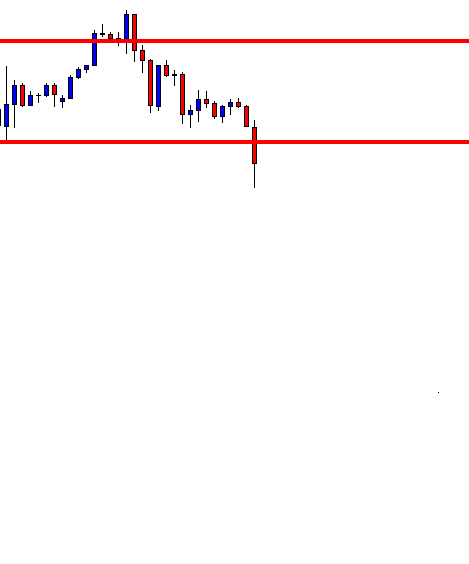
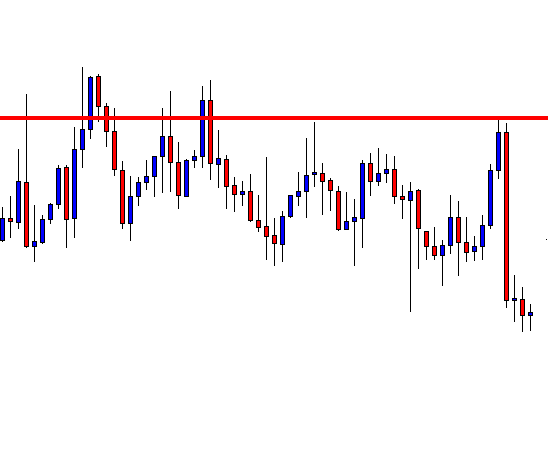
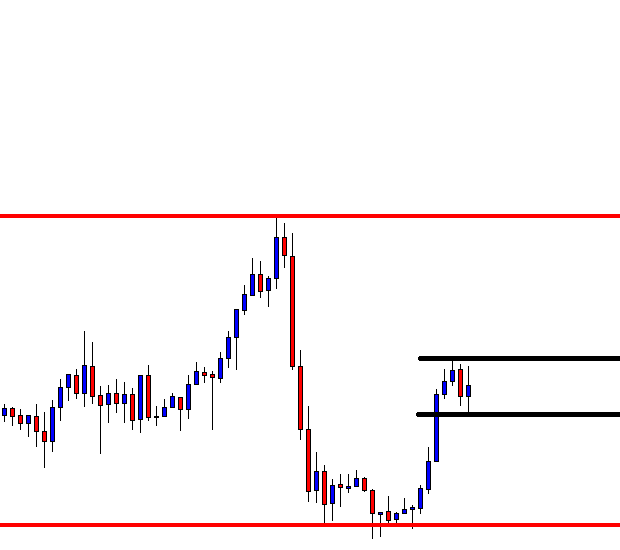
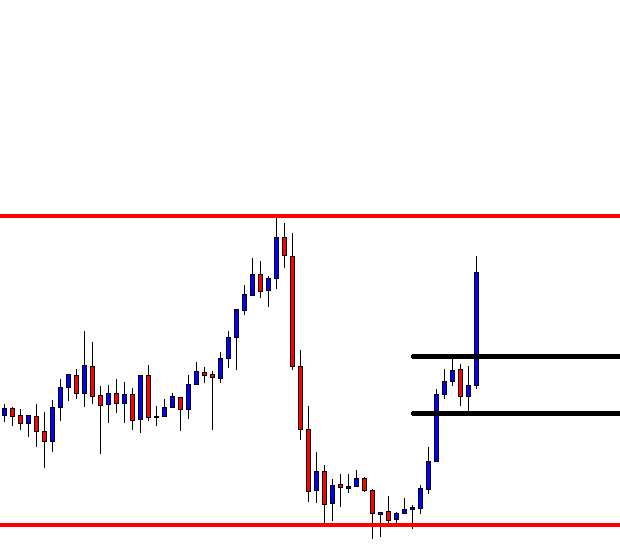
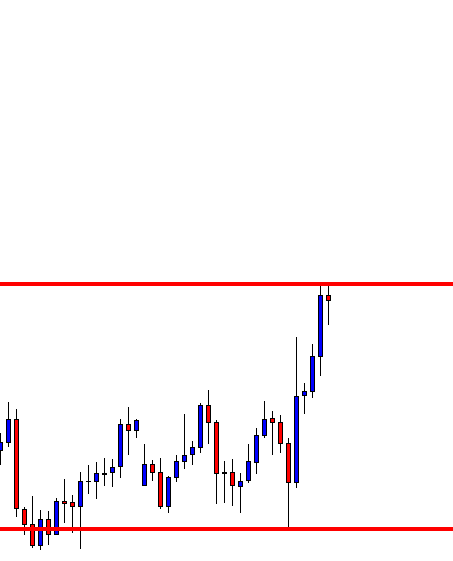
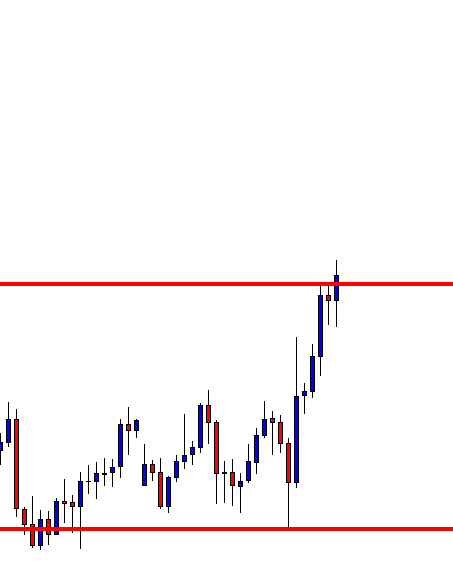
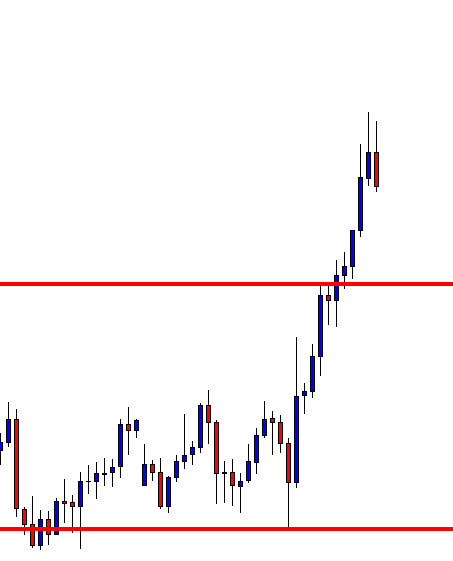
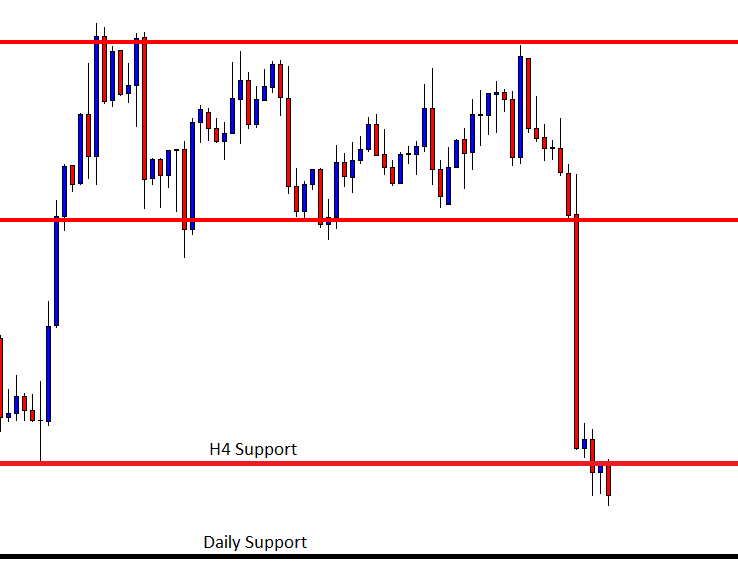
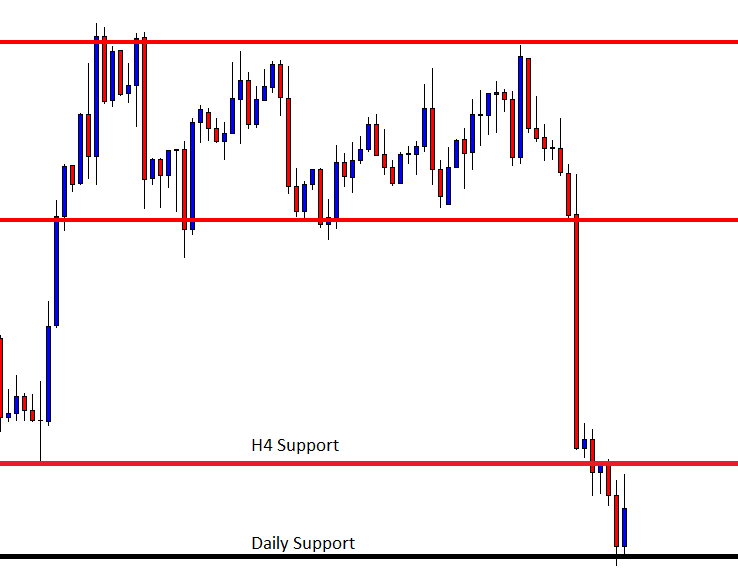
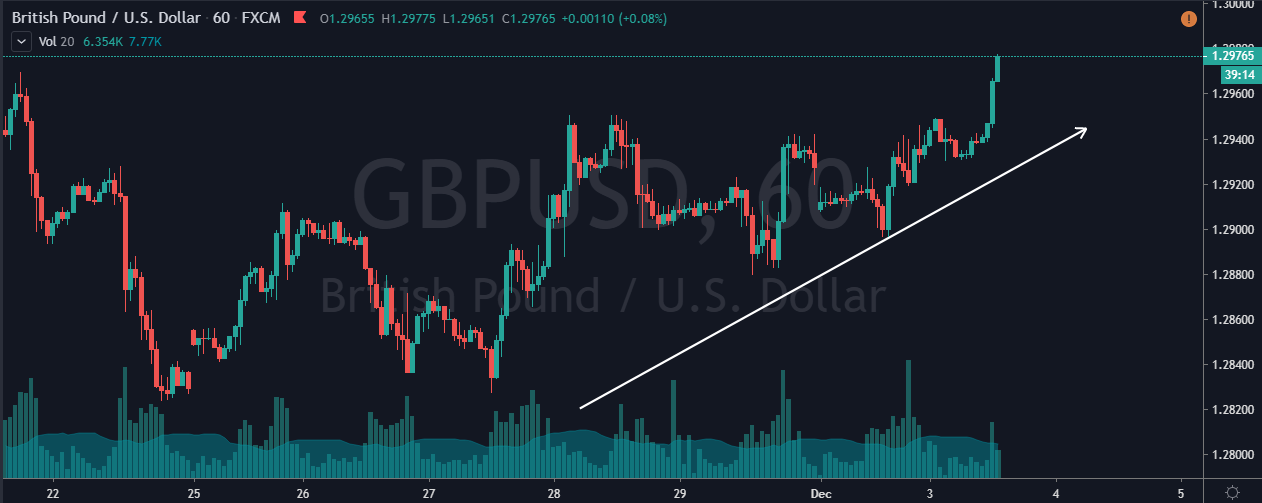
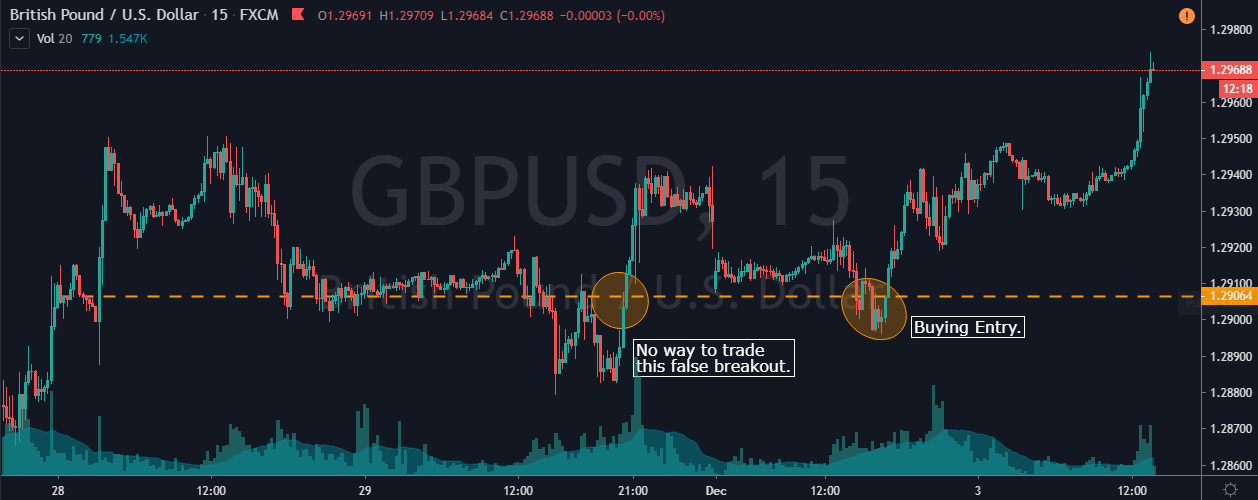
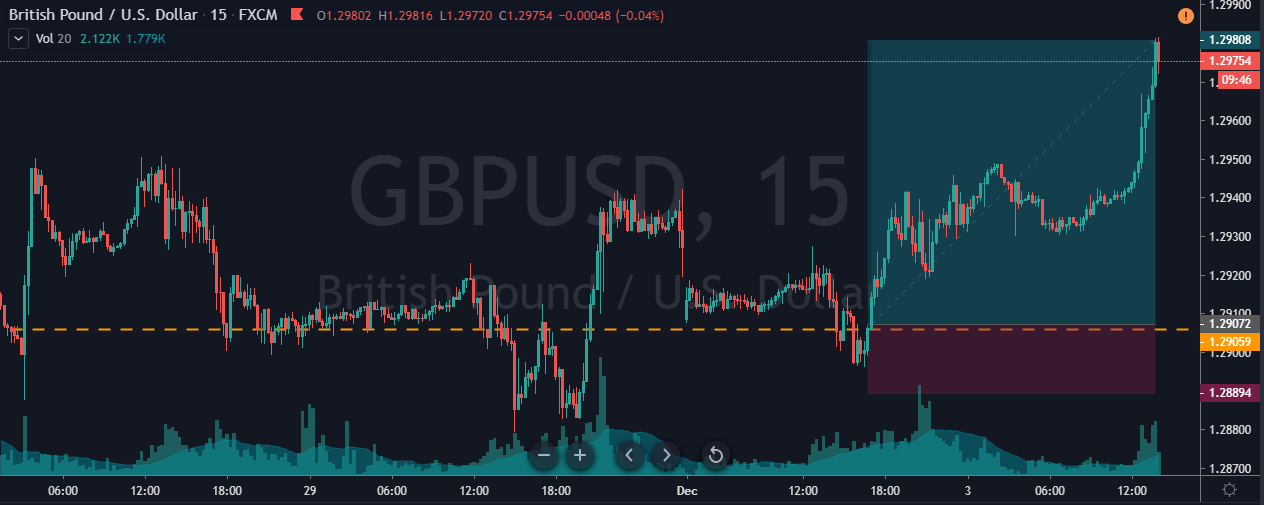
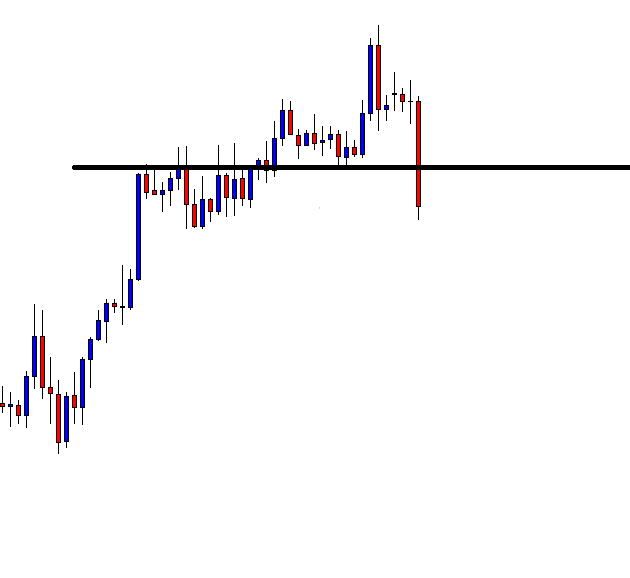
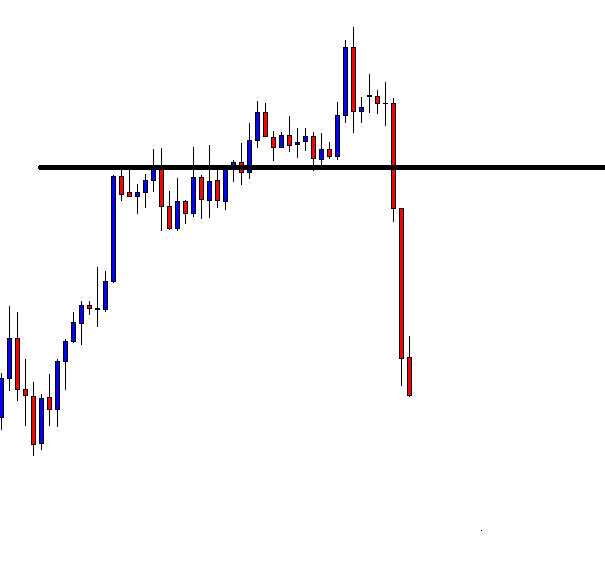
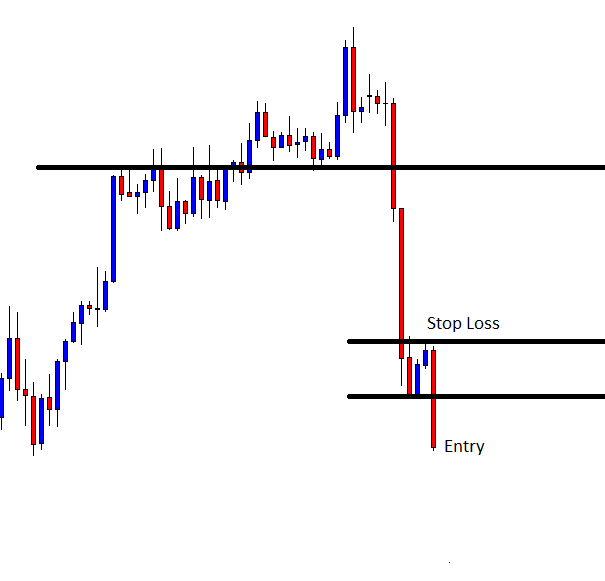
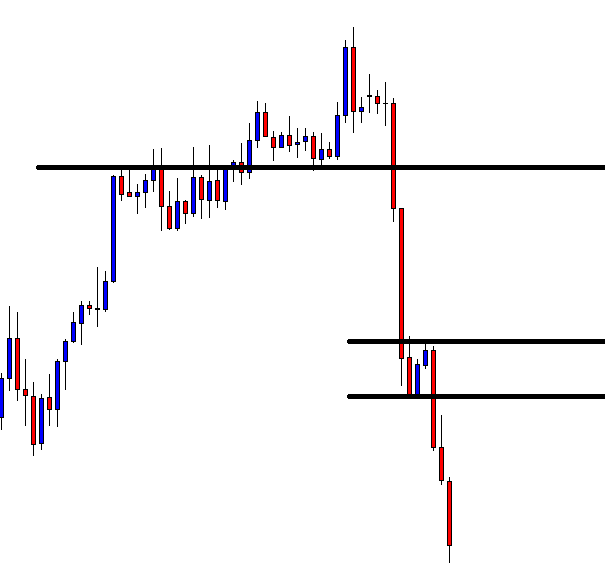
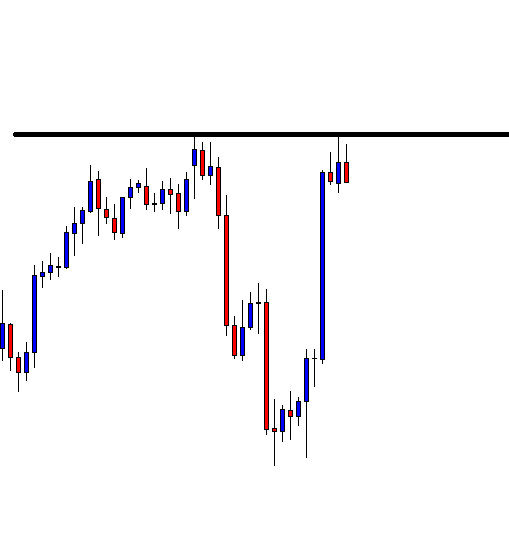
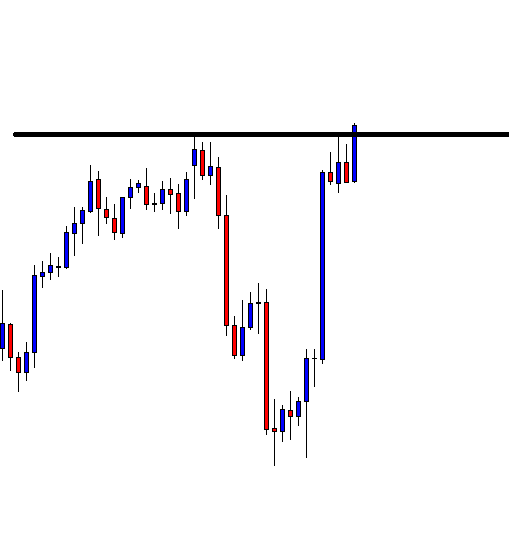
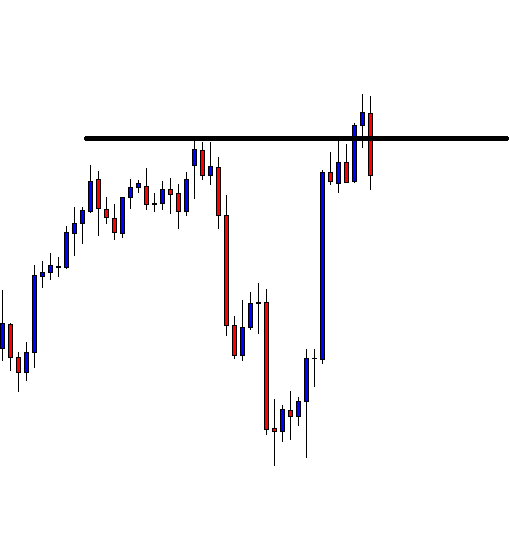
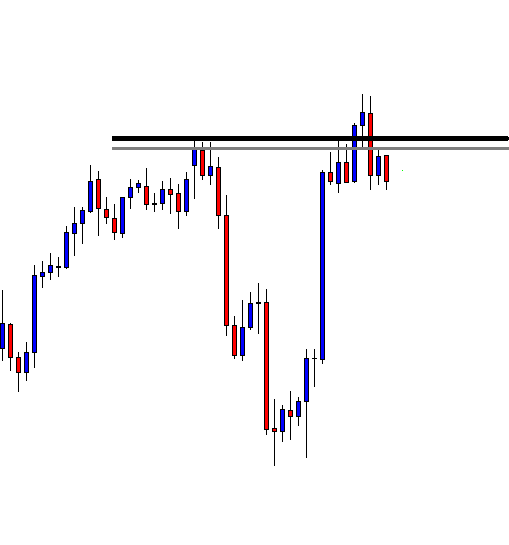
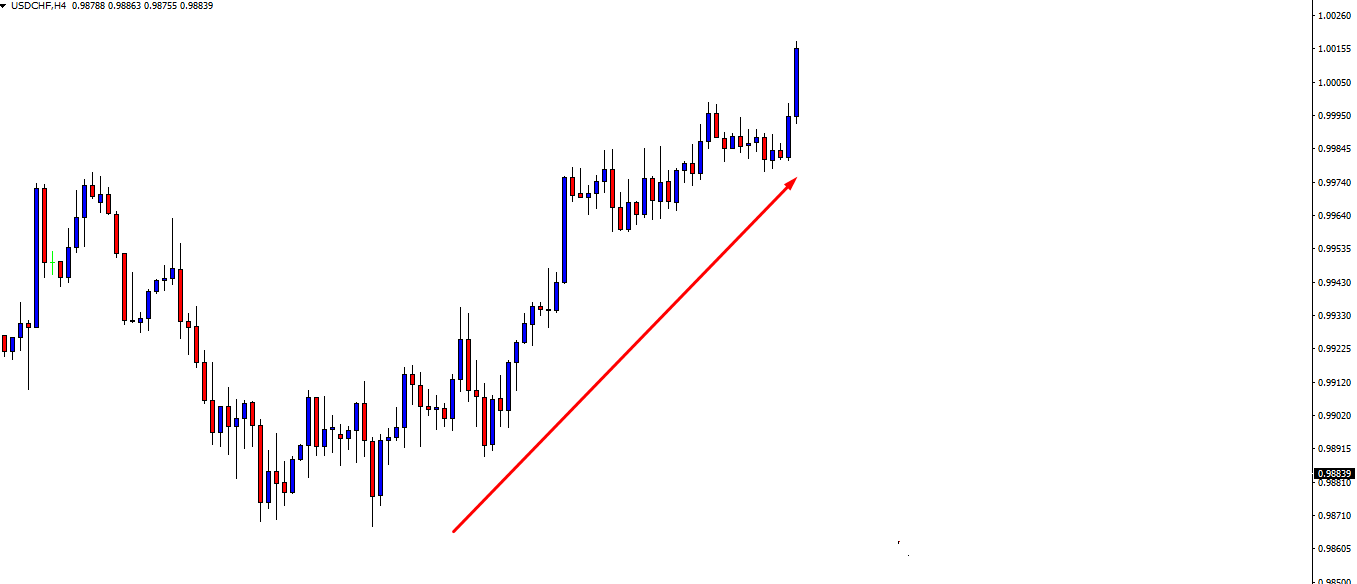
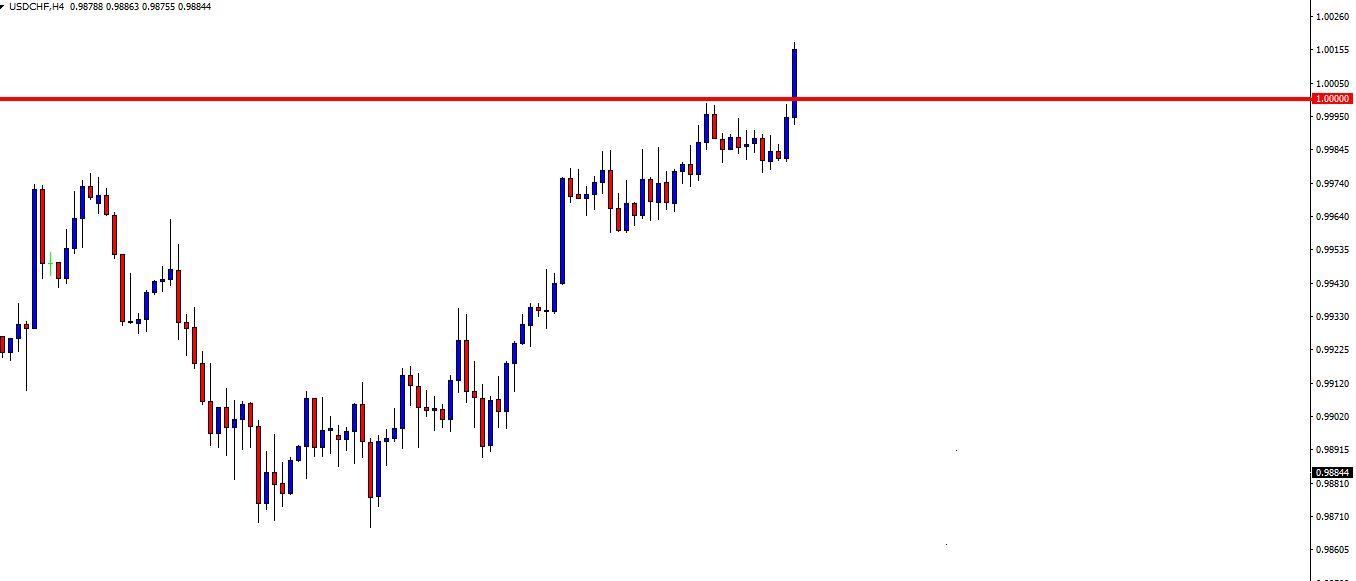
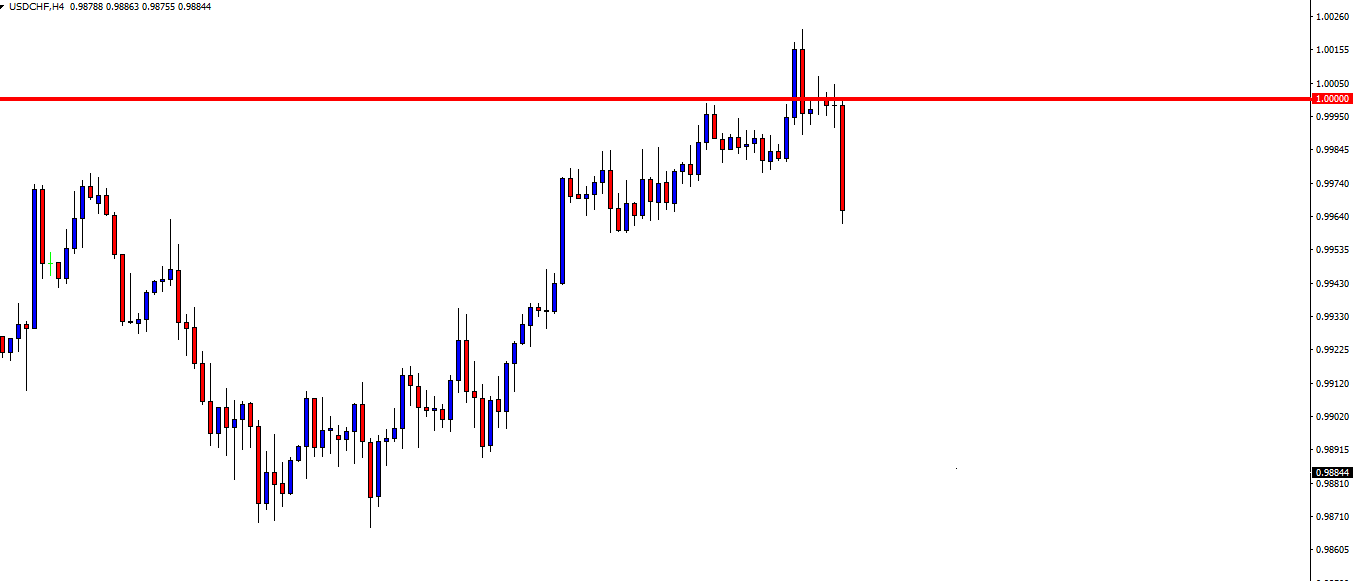
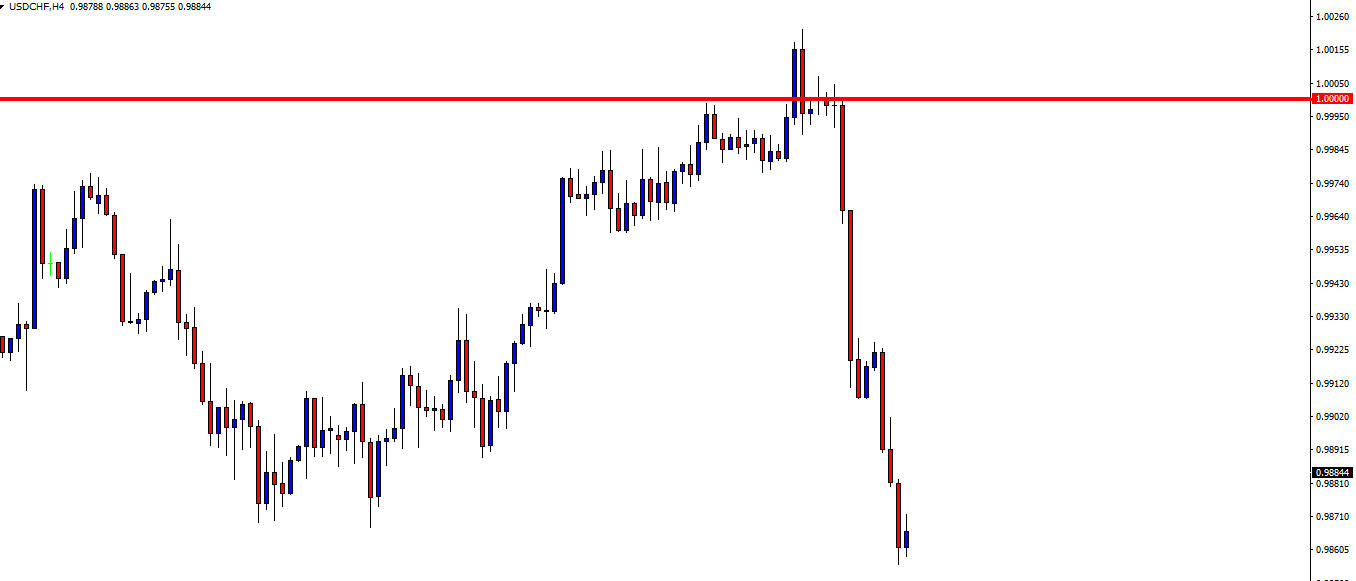
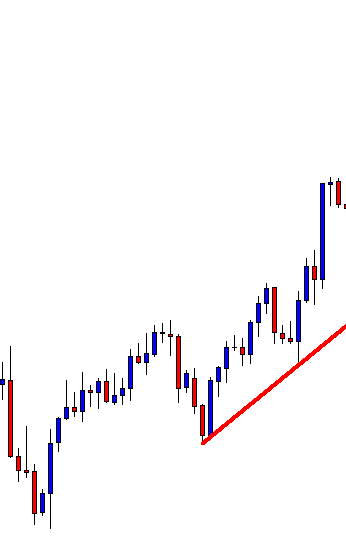
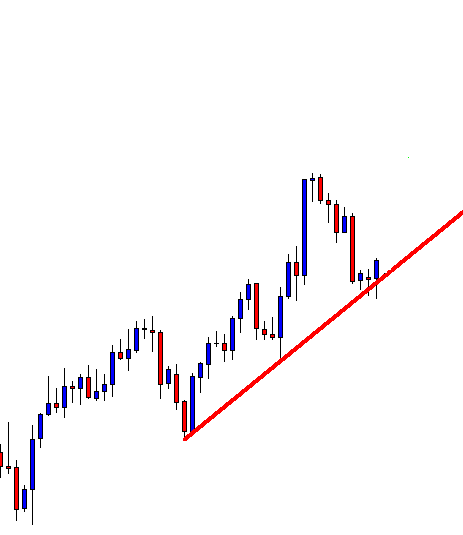
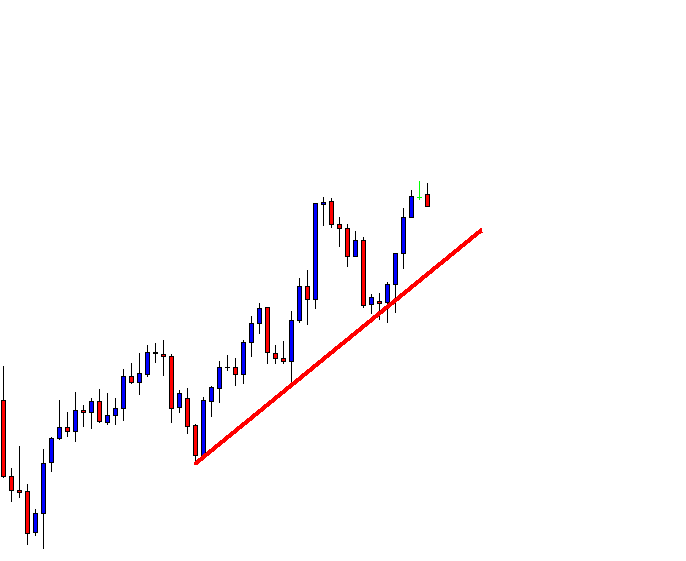
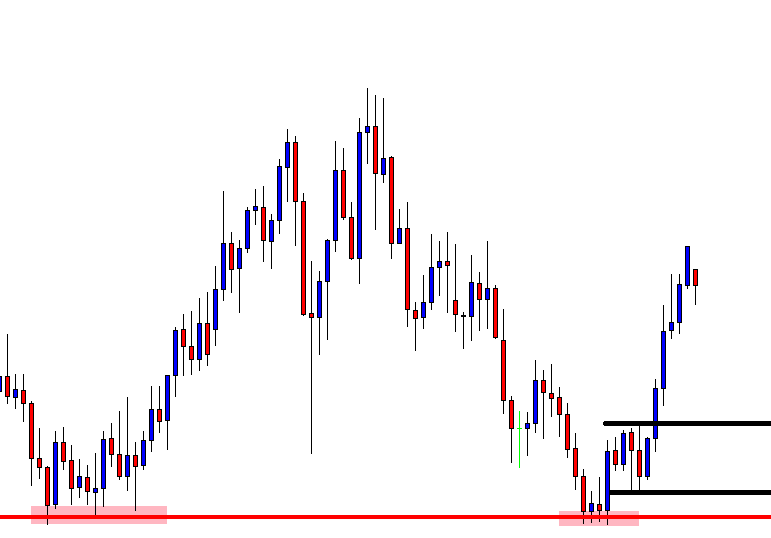
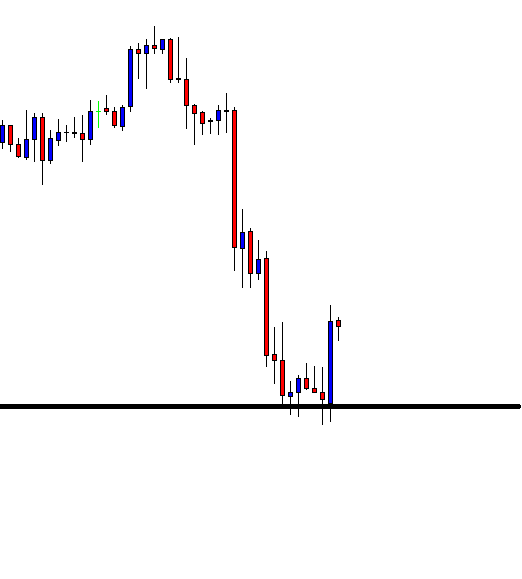
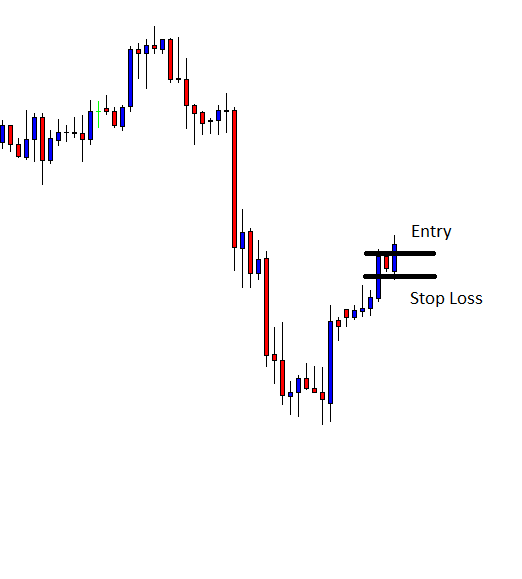
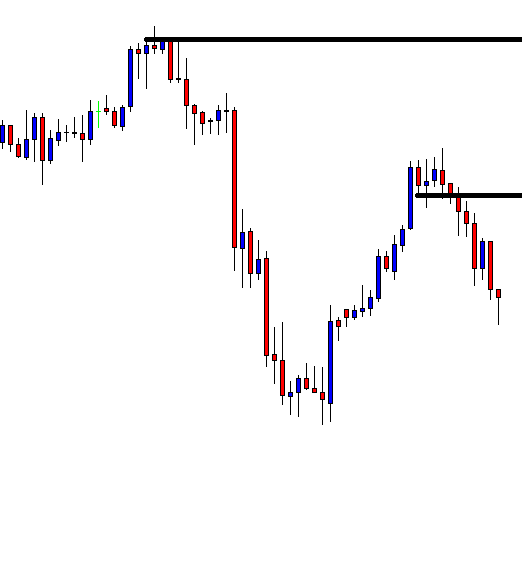
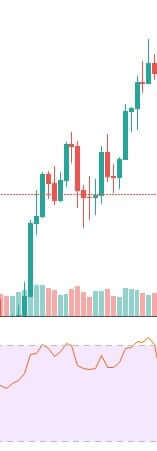
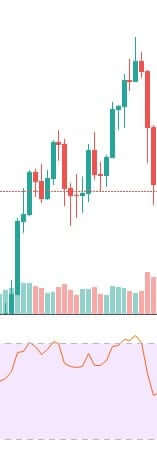
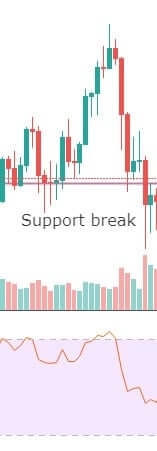
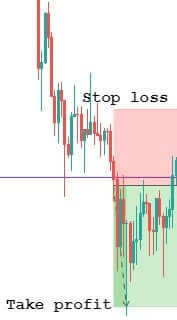
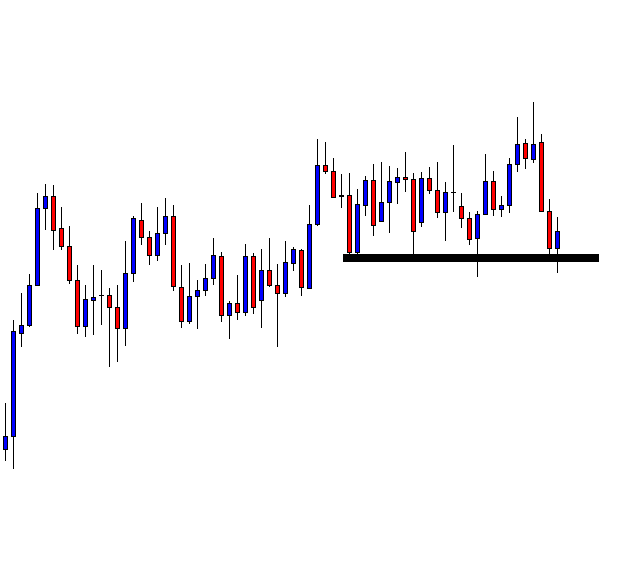
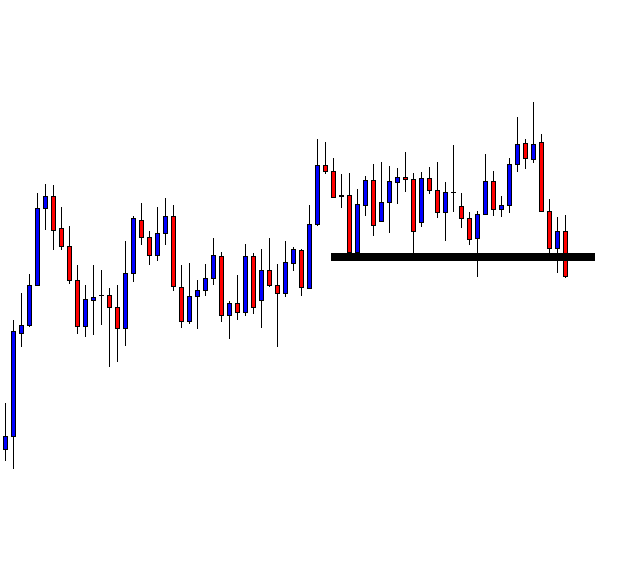
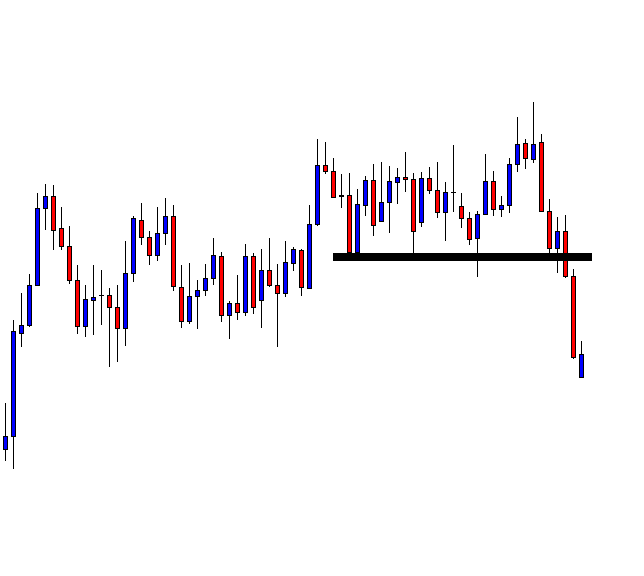
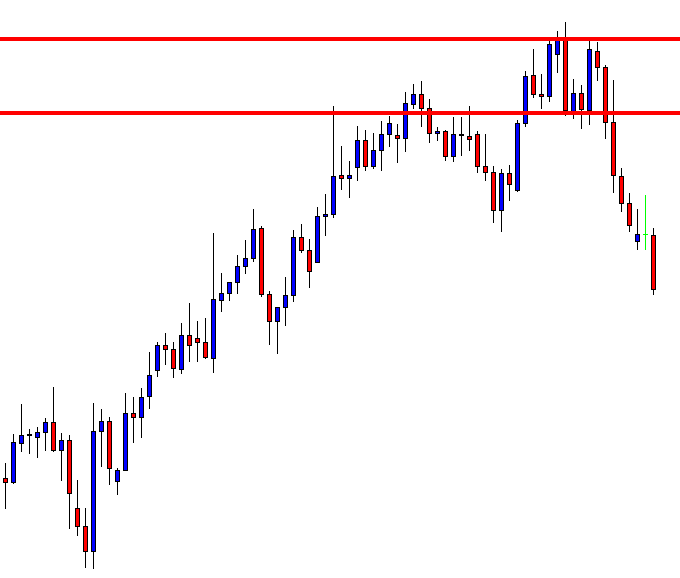
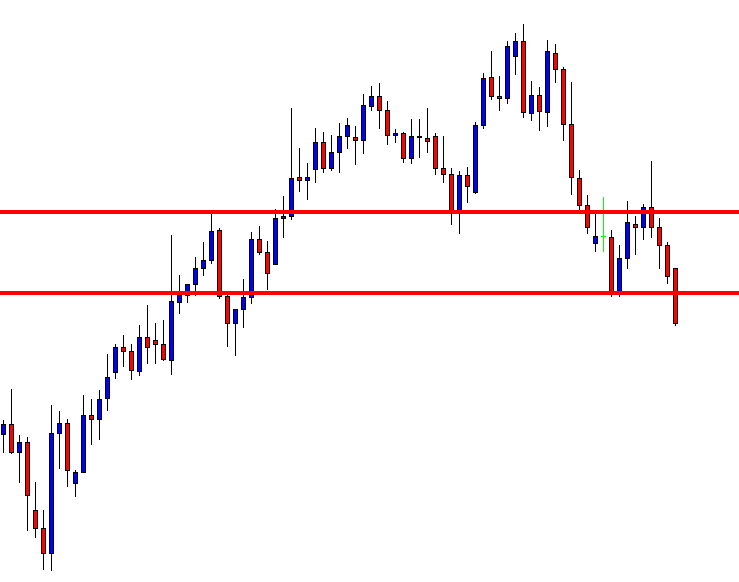
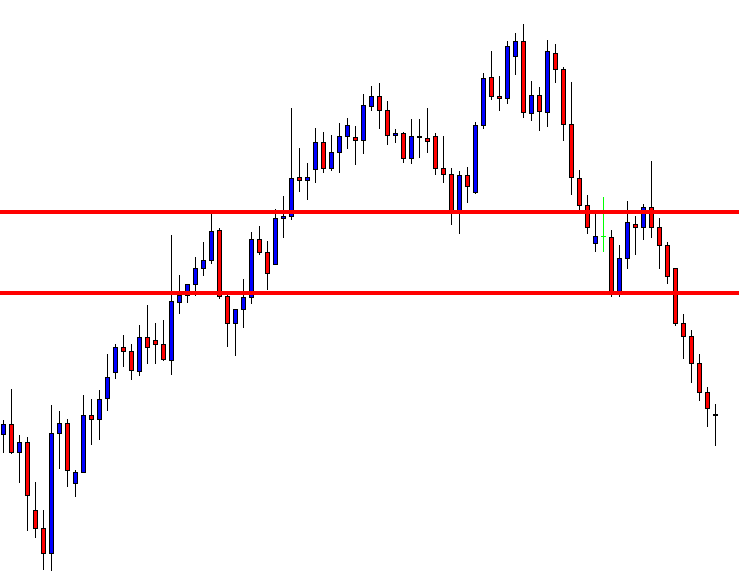
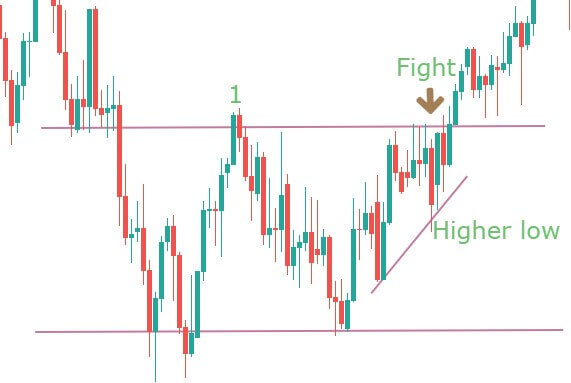
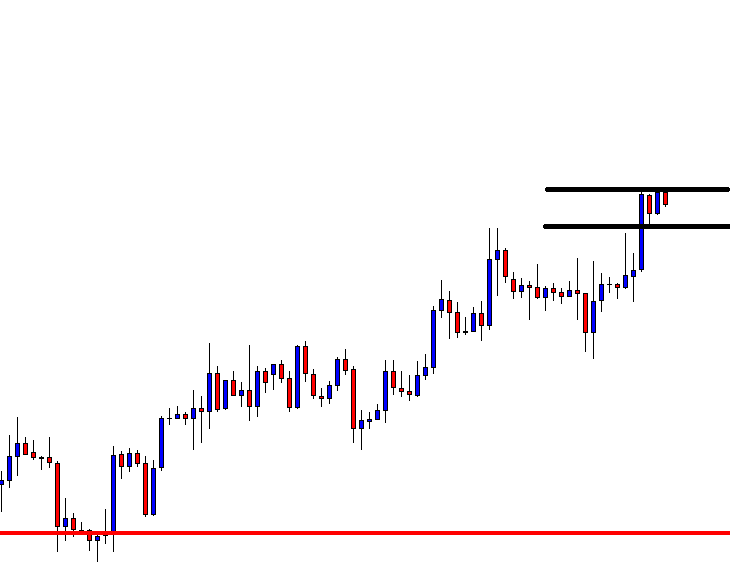
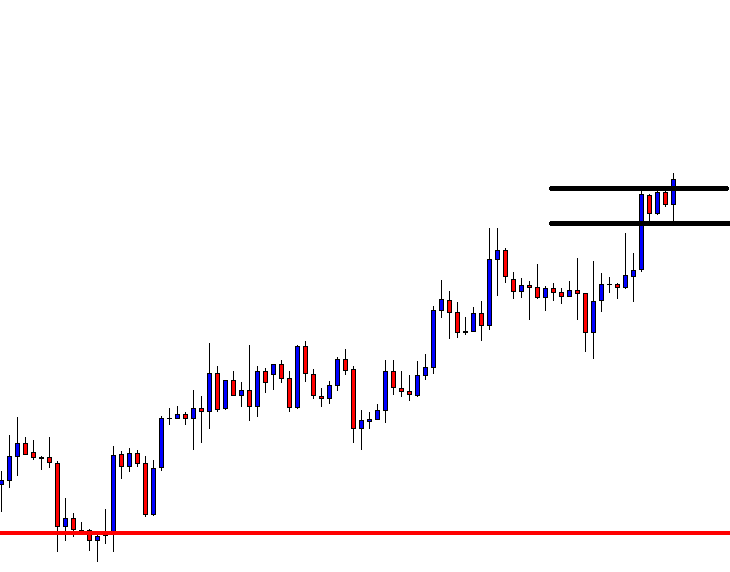
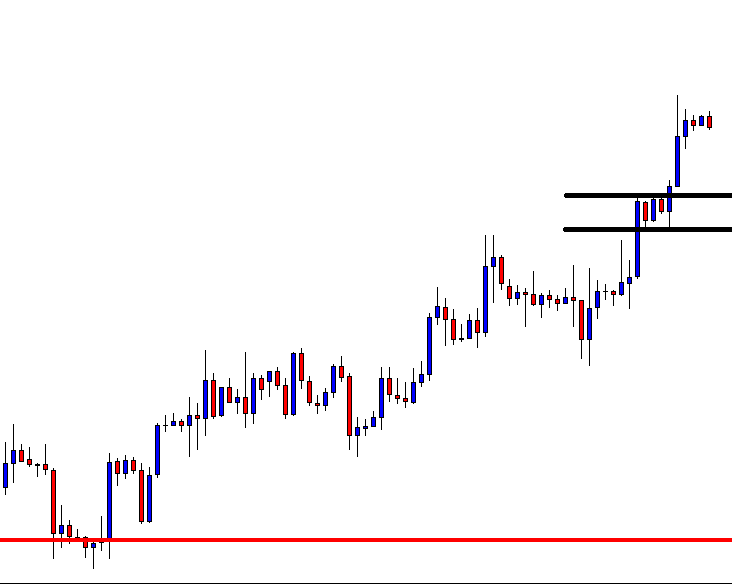
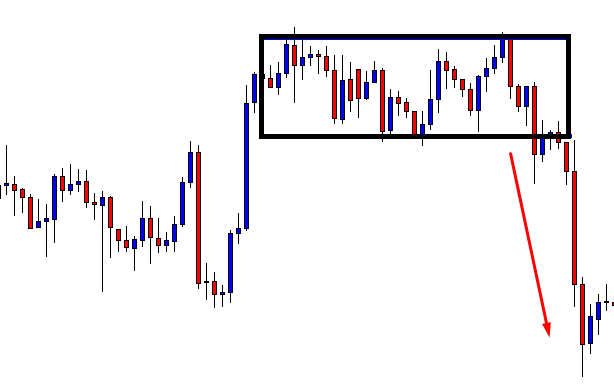
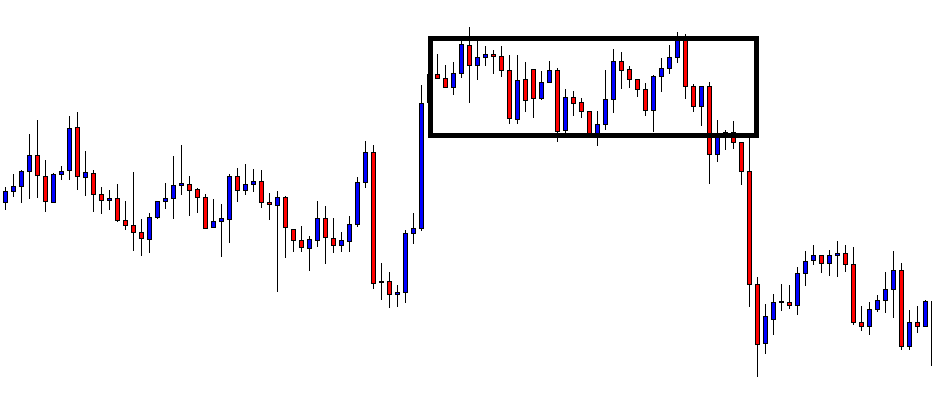
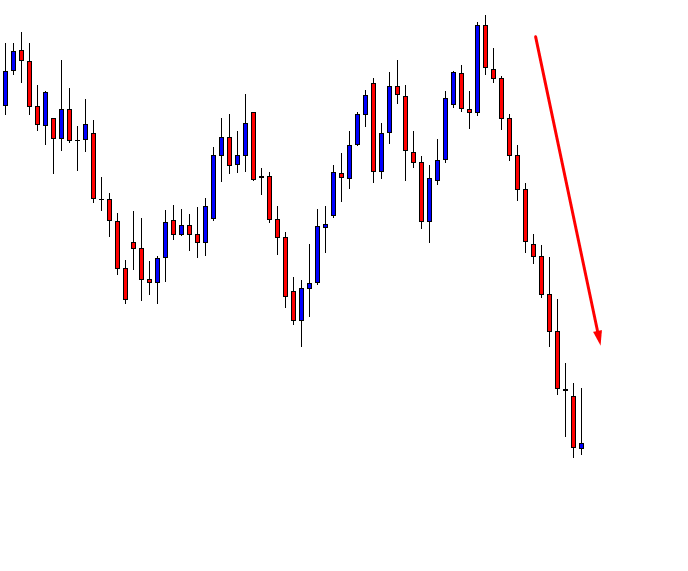
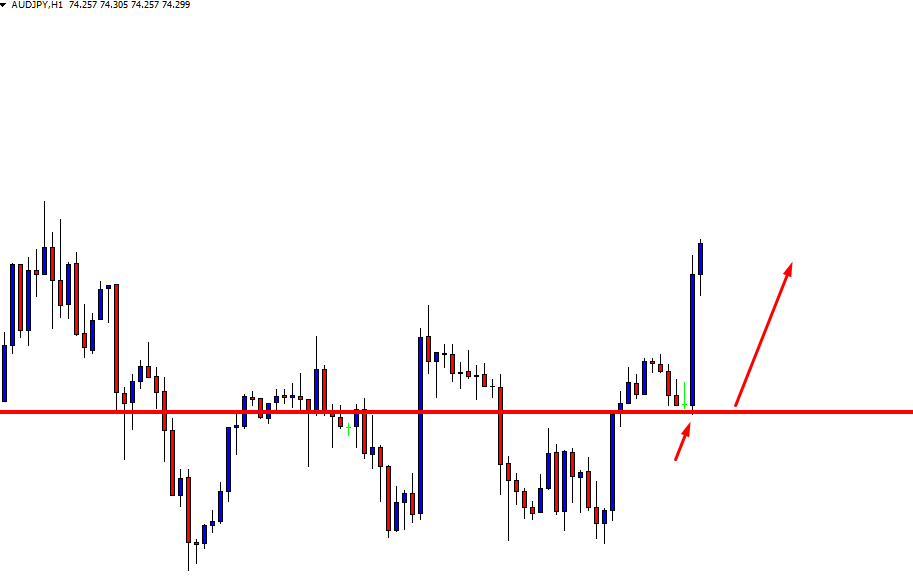
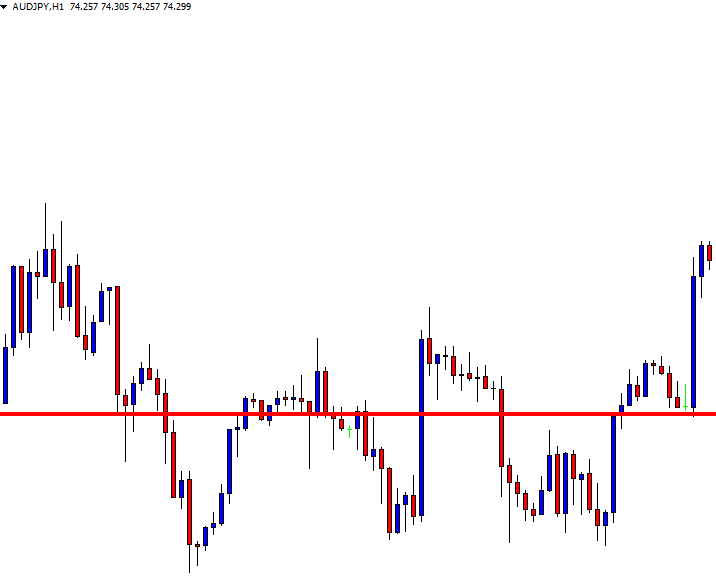
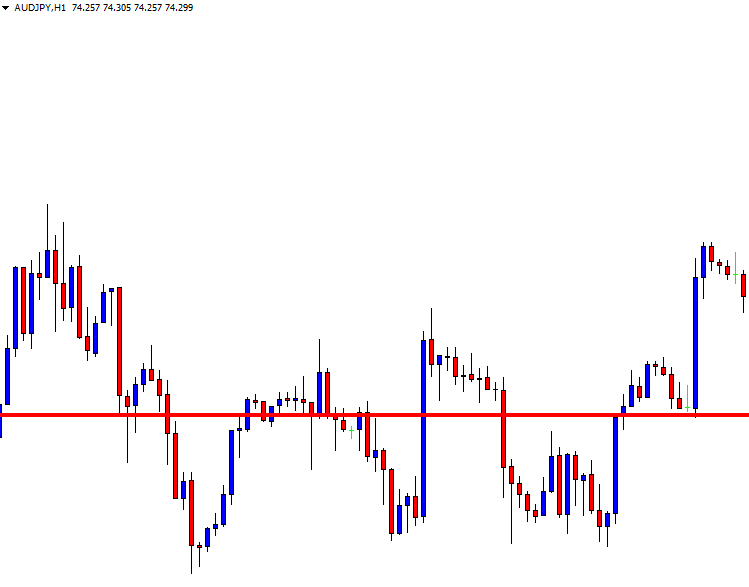
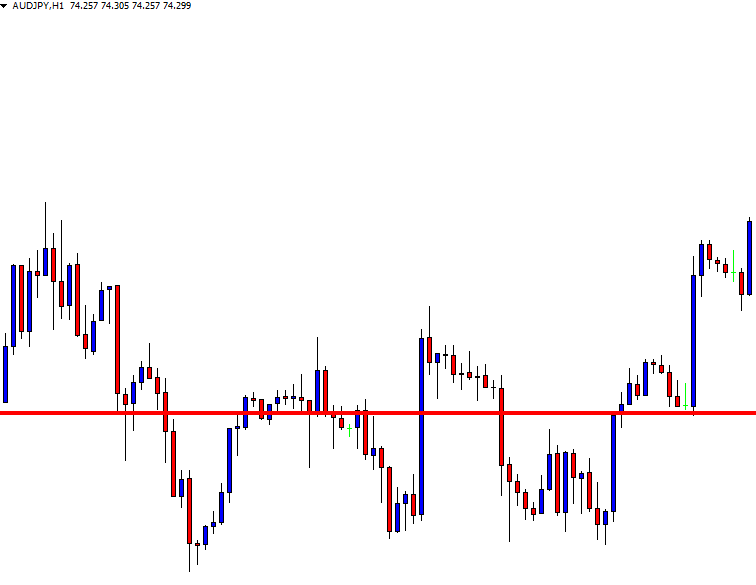
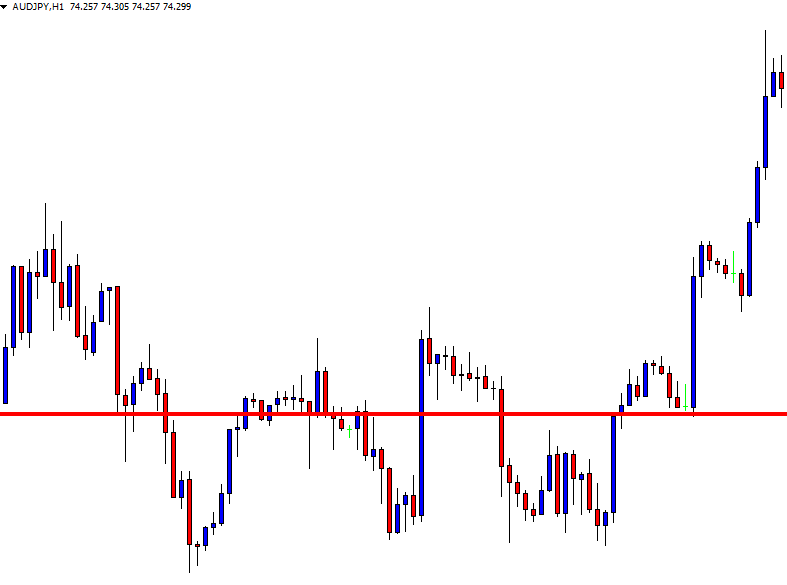
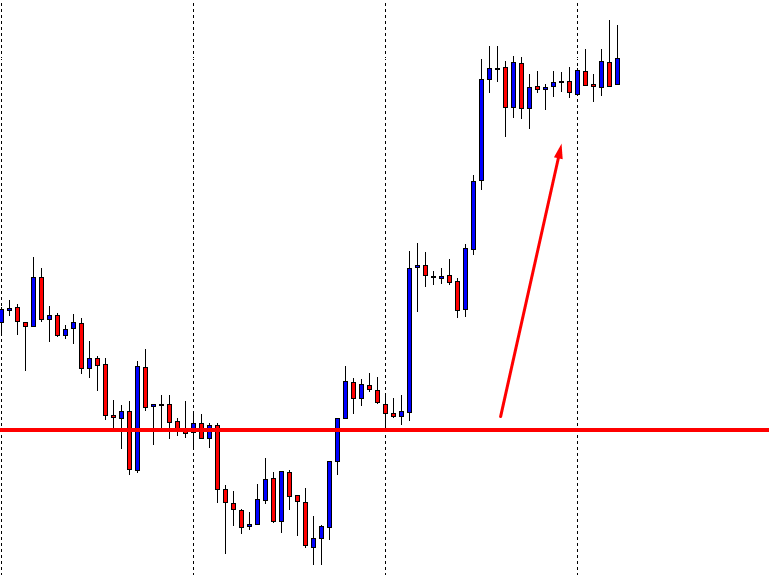
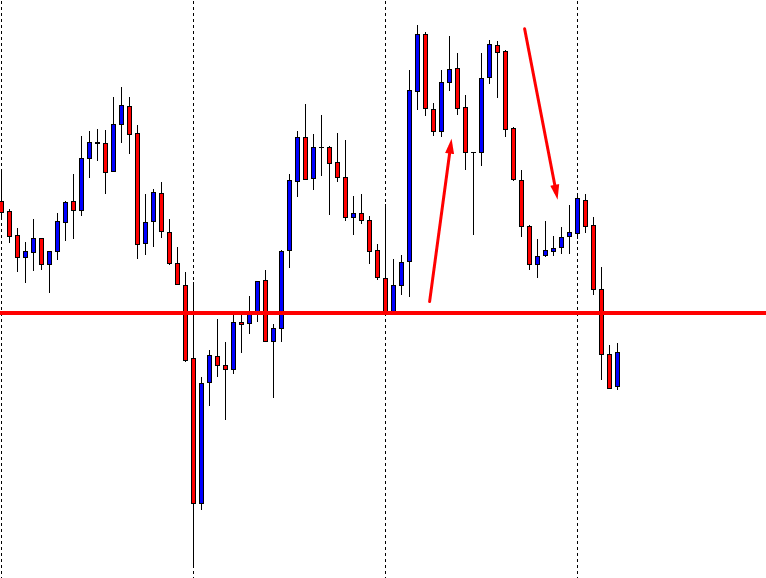
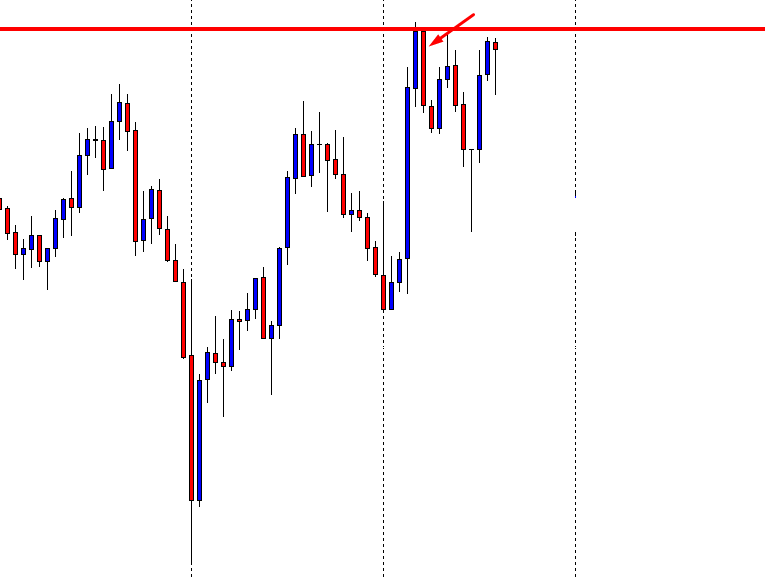
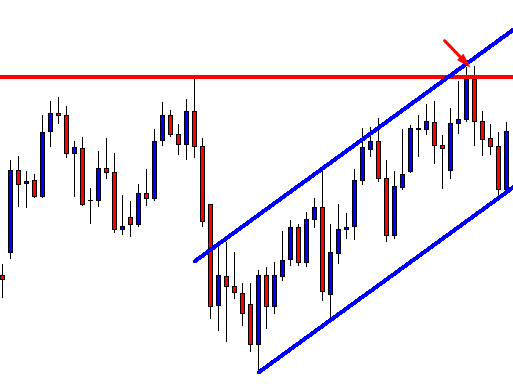
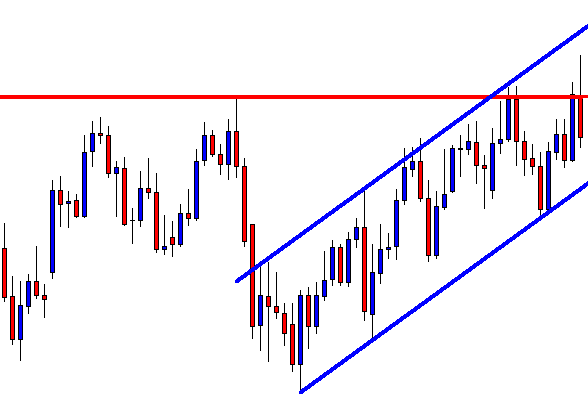
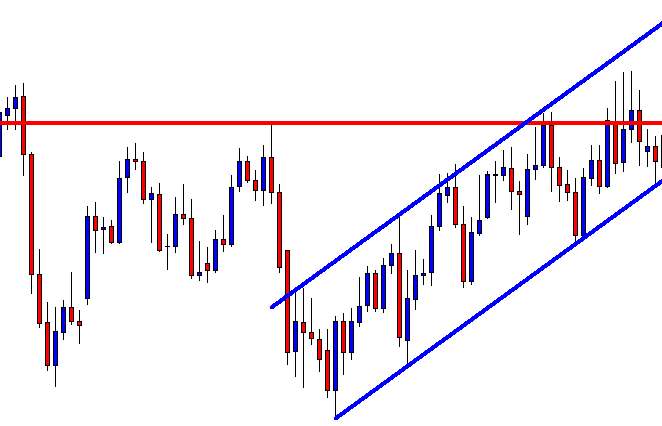
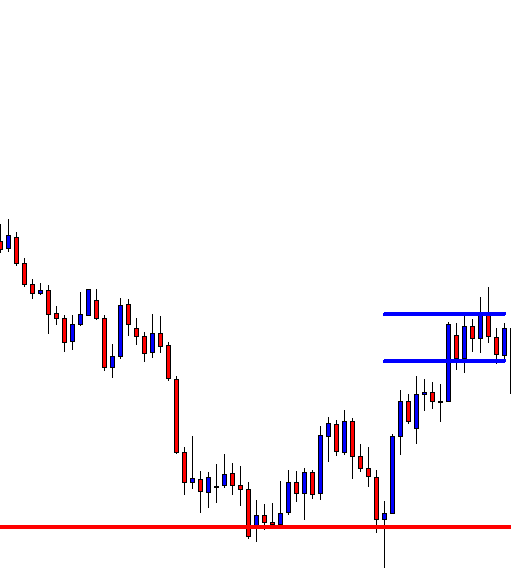
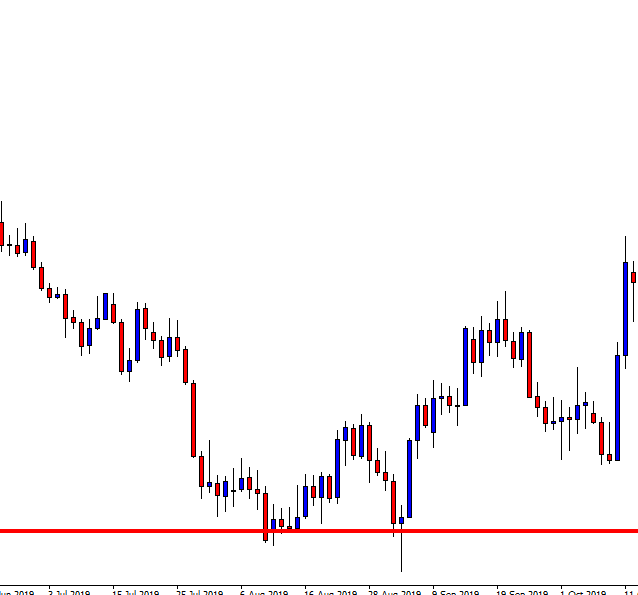
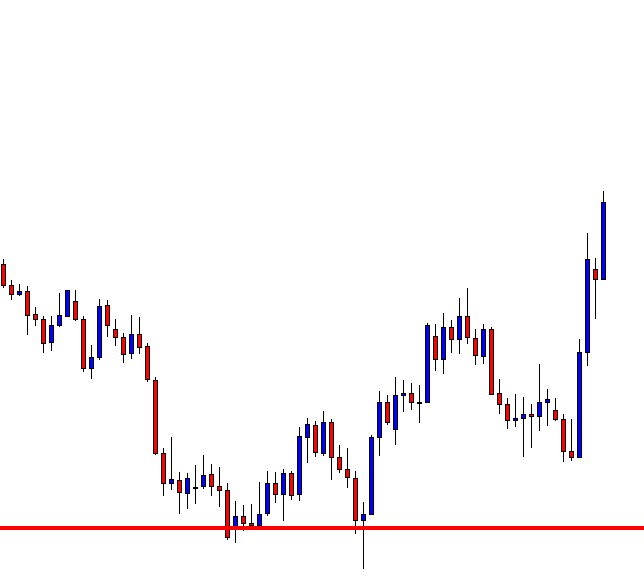
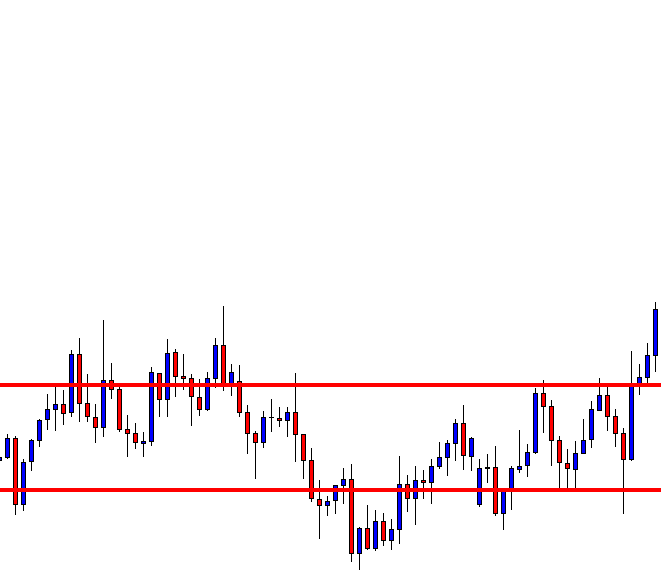
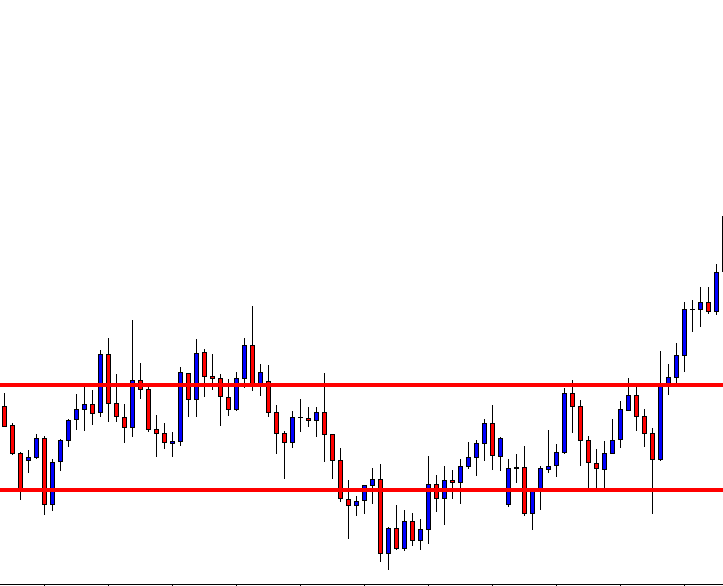
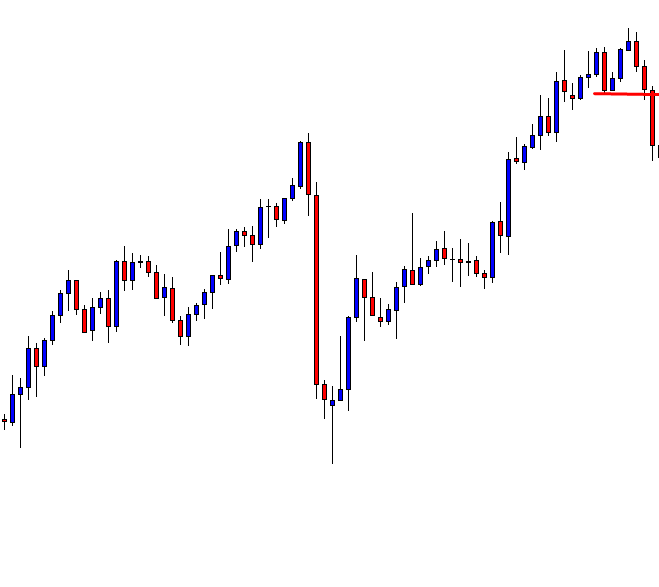
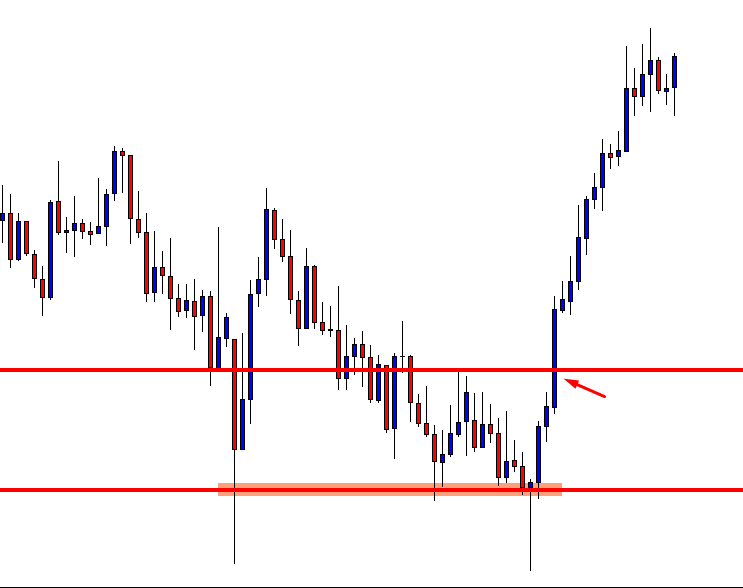
As the name pretty much suggests, traders can consider going long or short when the price breaks above the resistance or below the support level.
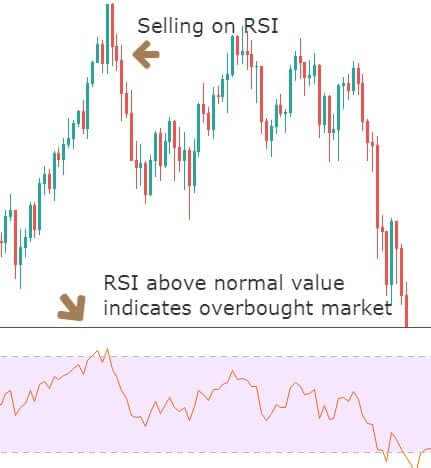
Measuring Sentiment

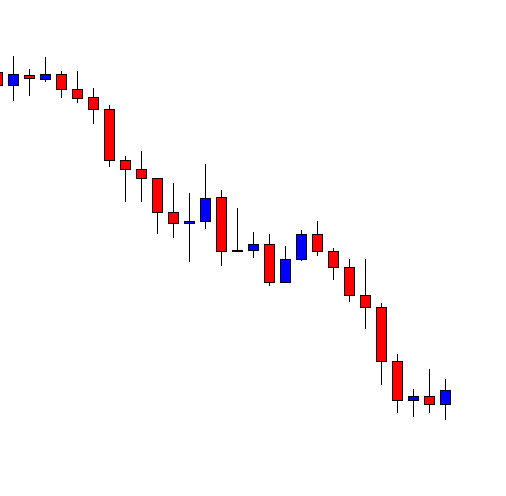
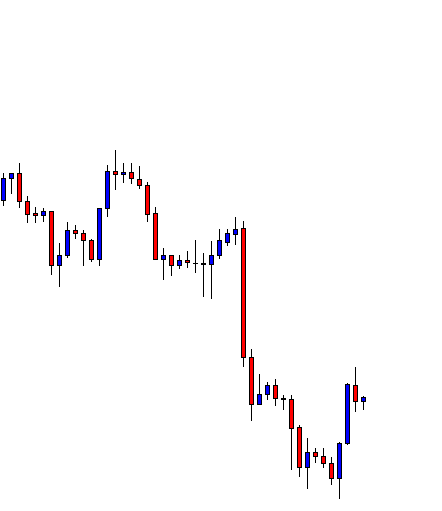
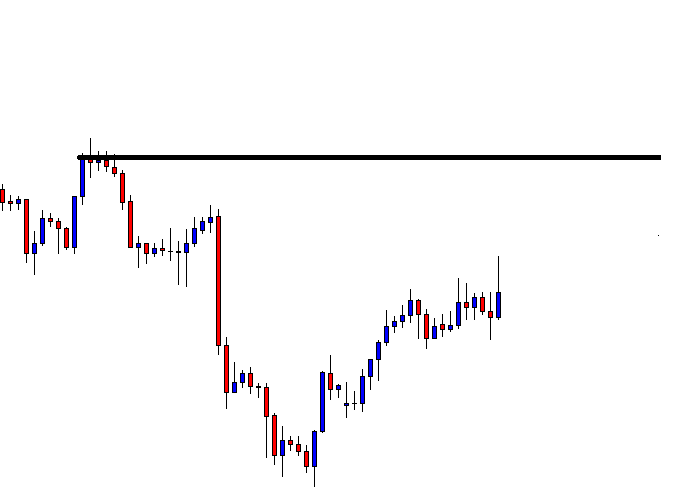
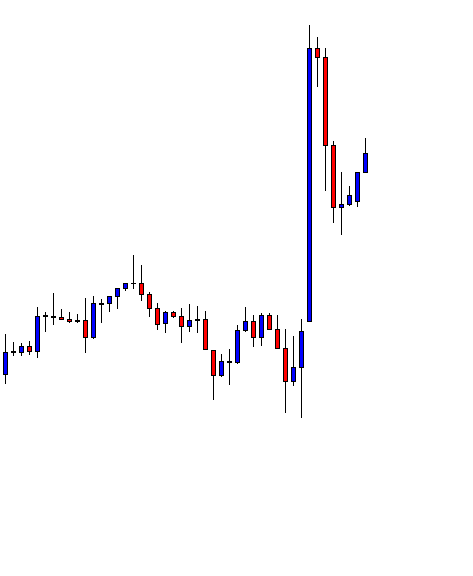
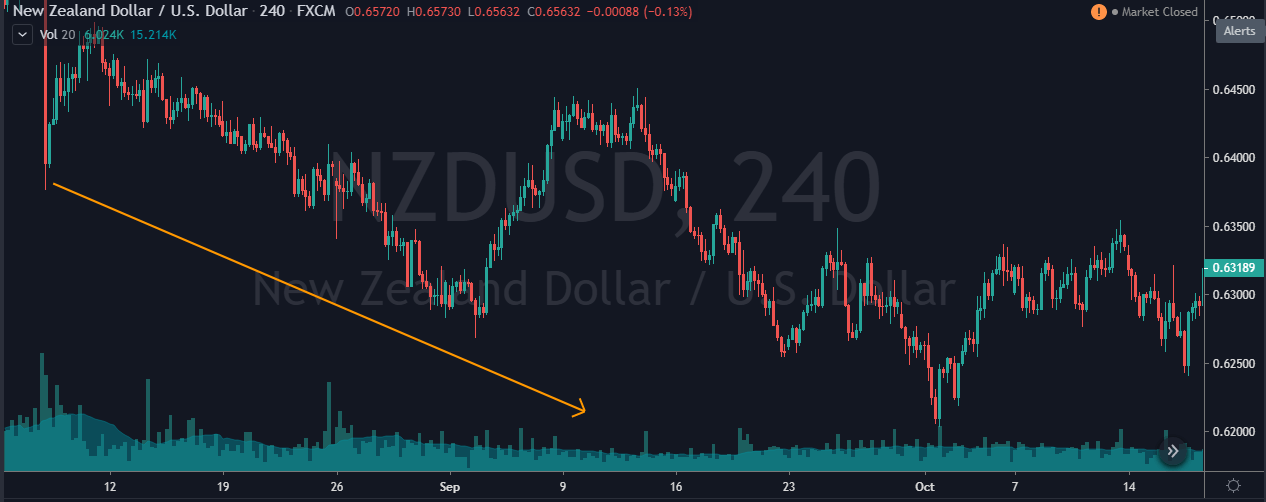
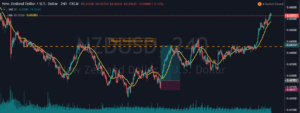
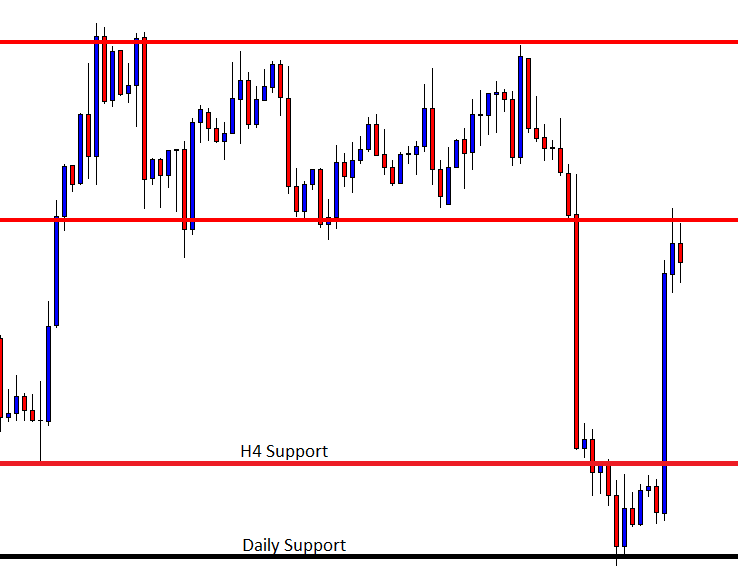
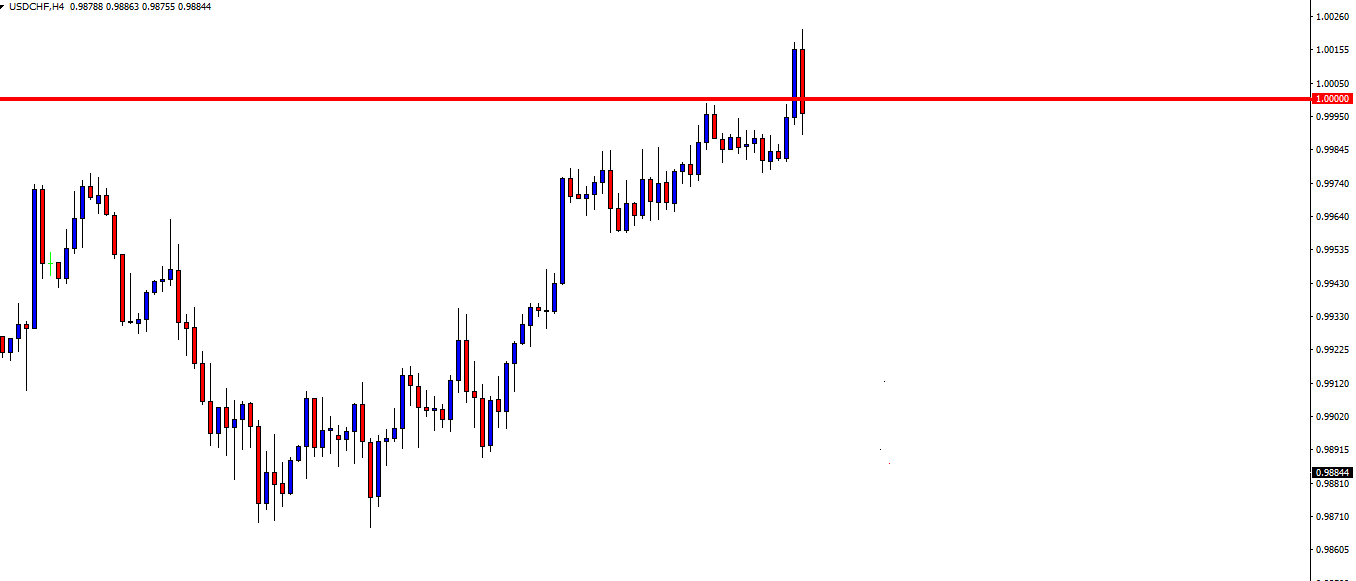
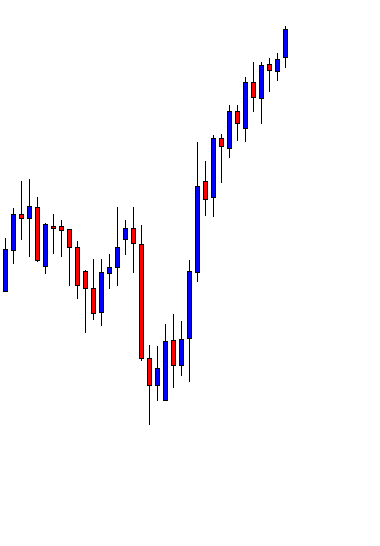
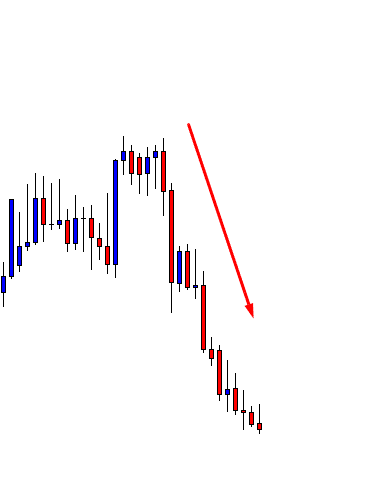
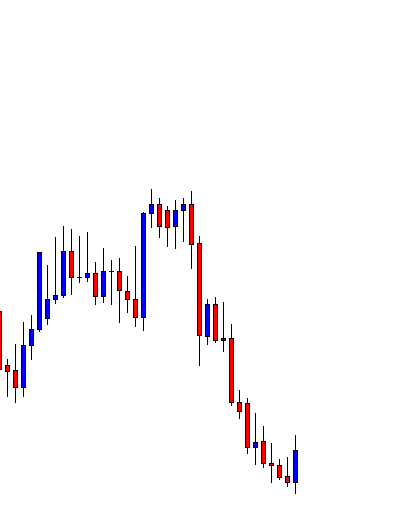
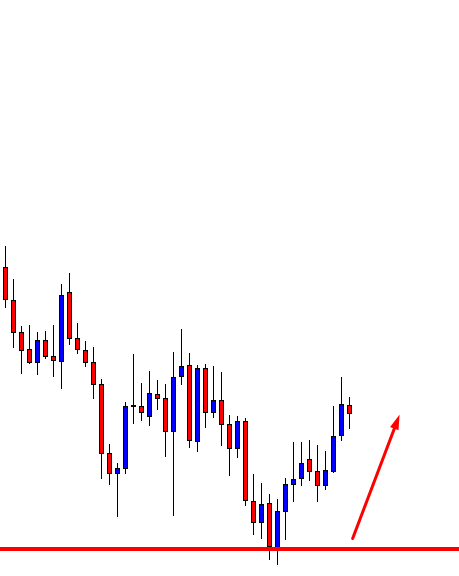
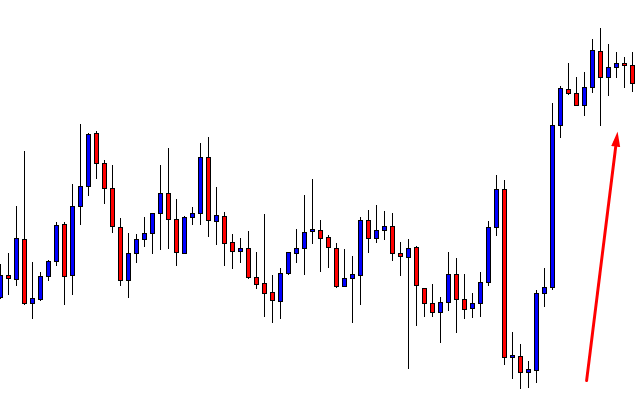
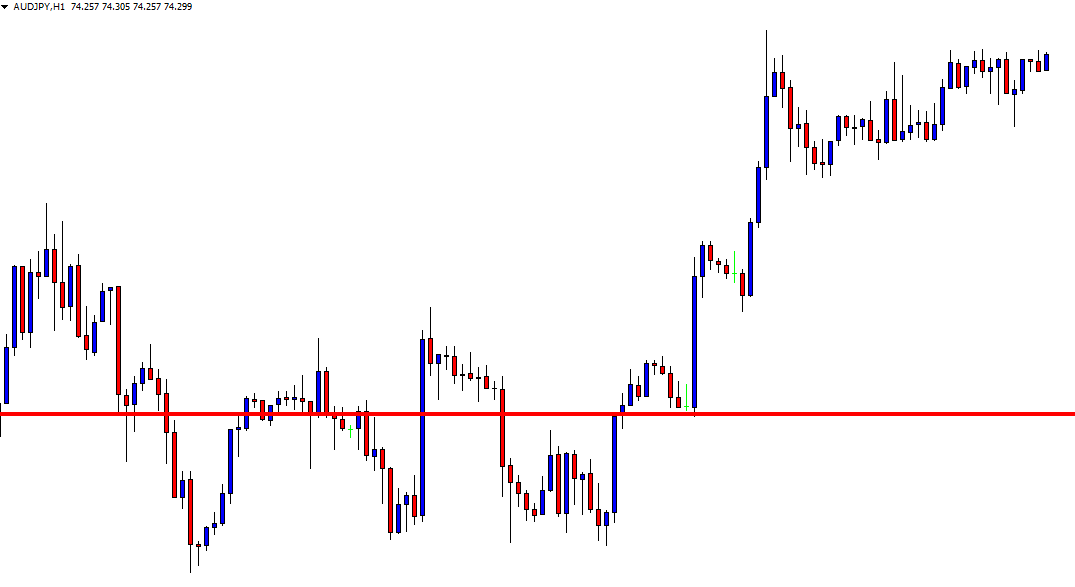
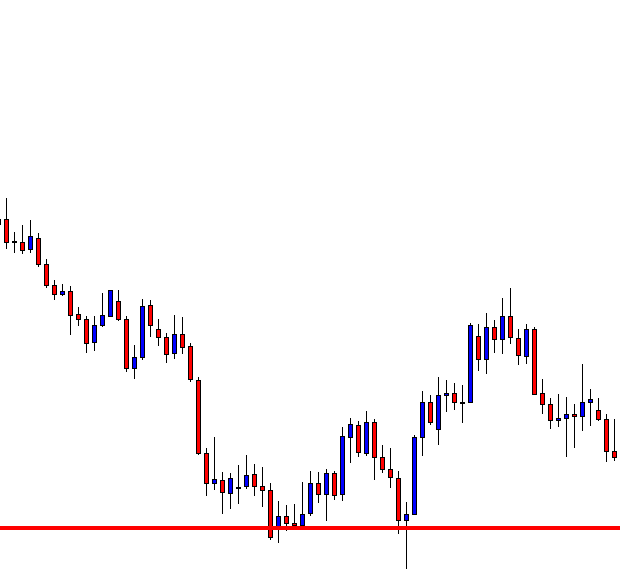
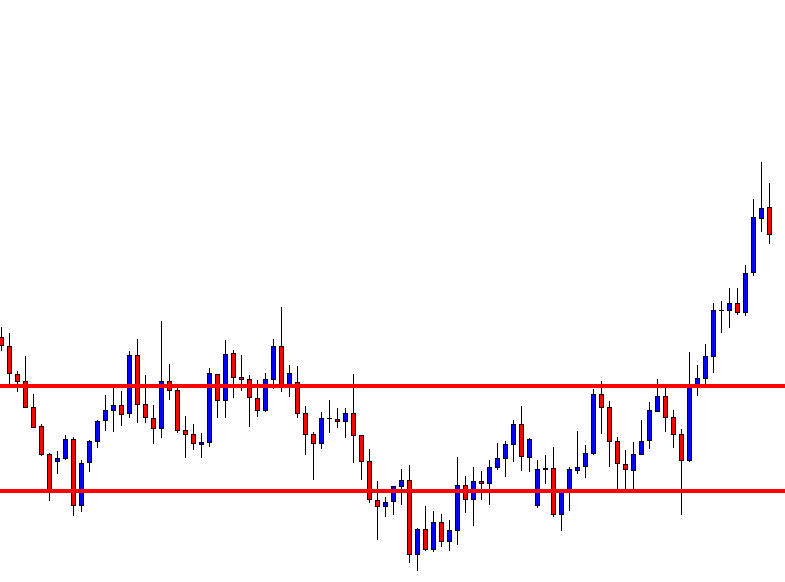
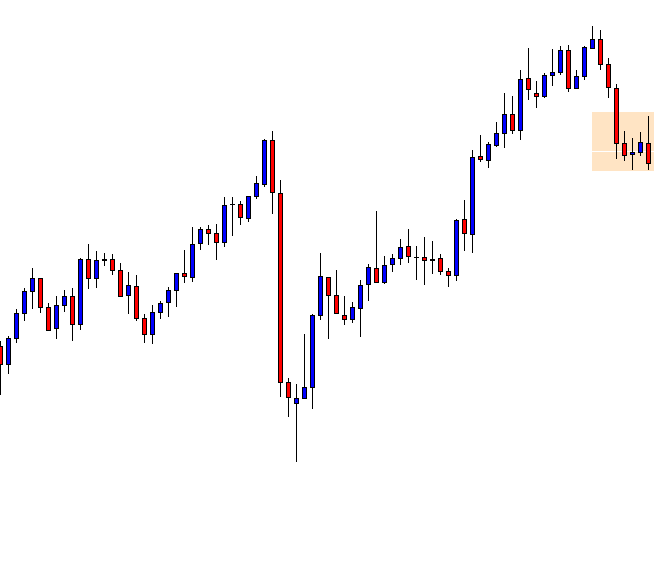
Traders can use the pivot point level (PP) to determine the trend of the market. If the market breaks above the PP, it indicates a buyer’s market and vice versa.

Summing it up

The pivot point is that indicators that can be used every level of traders from beginners, intermediate to the advance trades. However, this indicator is not a standalone indicator. It must always be used in conjunction with other indicators and tools to have higher odds of favoring you. We hope you enjoyed this series on pivot points. Happy trading!

Categories
Forex Price-Action Strategies

When Price Finds New Support/Resistance

Price action traders are to be calculative and watchful. Breakout and breakout confirmation are two things that price action traders keep eyes on. Trend initiating candle is another important factor. We often see that the price upon finding its support/resistance does not make a breakout straightway. It sometimes makes a little correction and then starts trending to make a breakout. This new level of support/resistance plays a significant role in price action breakout trading. In today’s lesson, we are going to demonstrate an example of this.

The chart shows that the price after being bearish makes a bullish correction. It produces a bearish engulfing candle and drives the price towards the downside. However, look at the last candle. It comes out as a bullish engulfing candle. This means the price is to find its resistance again.

It does not take long to find its resistance. The next candle comes out as a bearish engulfing candle. The sellers are to keep their eyes on the pair to get a breakout. It seems that the price may head towards the South and make a breakout this time upon finding its new resistance.

The chart makes the breakout by the next candle. The sellers are to wait for the next candle to close below the breakout candle to trigger a short entry. Do not forget that it makes the breakout upon finding a new resistance.

The next candle comes out as a bearish candle having a long lower shadow. Thus, they should flip over to the 15 M chart to see how the last 15 M candle comes out. Despite having a long lower shadow, the last 15M candle comes out as a bearish candle too. The sellers may trigger a short entry right after the last candle closes. Stop Loss is to be set above the last resistance and Take Profit is to be set with 1R. This is why the new level of support/resistance plays a significant role.

The price heads towards the South but not with strong bearish momentum. It hits 1R though. The distance between new resistance to entry point= Entry point to Take Profit= 1R.

Whenever the price finds its new resistance/breakout, breakout traders must count those to set their stop loss and take profit level. Breakout trading needs the price to make a breakout with good momentum. If it takes any pauses before making a breakout, ignore the last support/resistance. It gives us better risk-reward as well as more chance of winning a trade.

Categories
Forex Course

95. Adding Pivot Points to Your Range Strategy

Introduction

In the previous two lessons, we completely understood the basics of pivot points as well as how to calculate and interpret them. And now, we can move on and start applying this indicator to our charts and find trading opportunities using it.

In this lesson, we shall use the pivots points in our range trading strategy. We will be giving you a complete guide on the trading range with the assistance of pivot points.

Incorporating Pivot Points into Ranges

The Basics

As we already learned, pivot point has S1, R1, S2, R2, etc. which represents Support and Resistance whose working principles are the same as the typical Support and Resistance. According to the definition, support is the area in which the market tends to hold and move up, and resistance is the area where the market holds and typically moves downwards.

Talking about a range, it is the state of the market which moves in a sideways direction and repeatedly bounces off from support and resistance level. So, we shall be testing the pivot points as the place where the market can hold and possibly reverse.

The Thumb Rule

When the market is at any of the upper Resistance levels, we look to go Short on the security. When the price is at any of the lower Support levels, we look to go Long on the security.

Live Chart Example

Below is the chart of GBP/CAD on 15min timeframe. We can see that currently, the market is in a range (as shown in the box). The market was ranging on the 16th of March. With these values of 16th March, we calculate the pivot points for the next day and find trading opportunities.

Now consider the same chart after we’ve determined the P, S1, R1, S2, R2 pivot levels. Following up range, we can see that the S1 level was formed exactly at the bottom of the range. Now, both S1 and the bottom of the range is indicating a Buy a signal. Hence, when the price touches the S1 level, we can go long on this pair.

From the chart, we can clearly see that we found two opportunities to hit the buy at the first Support level S1.

Placements

Having a predetermined take profit and stop loss is vital in trading. In this particular example, the take profit can be placed at the pivot point (P) and stop loss below the S1 such that the trade yields 1:1 Risk Reward. Note that there are times when the take profit can be placed at the R1 level as well. But this requires expertise in technical analysis as well as in pivot points.

The above example is the way for traders to get the hang of how to trade pivot points. To do it more professionally, one must use other technical analysis tools to have a confirmation on the pivot levels. For instance, if there appears a Doji candle at the S1 level and also the stochastic indicator is indicating that the market is in the oversold area, then there are more odds in our favor that the support will work in the direction we predicted.

So, to sum it up, one must use the pivot point levels by clubbing it with other technical tools to find optimum results. We hope you comprehended this lesson to the best of your ability. Cheers!

[wp_quiz id=”69435″]
Categories
Forex Course

94. Calculating and Comprehending Pivot Points

Introduction

In the previous lesson, we understood what pivot points are. However, it is also necessary to understand how these levels are calculated. So, in this lesson, let’s go ahead and figure out how these levels are marked and comprehended.

Before getting right into it, let’s brush up the previous topic real quick.

  • The pivot point is an indicator used to identify Support and Resistance levels.
  • It is a static indicator, unlike the other indicators that move with the price.
  • It helps in determining the overall trend of the market in any given timeframe.
  • It is calculated using high, low, and close values.

Below is an image of how pivot points look when applied on the charts. As already mentioned, S stands for Support, R stands for Resistance, and P(PP) stands for Pivot Point. Now we shall see what exactly is S1, R1, S2, R2, etc.

Calculating Pivot Points

Different levels of Support and Resistance are shown when calculating the Pivot point’s support and resistance levels, and they are represented as S1, R1, S2, R2, etc. Now, let’s calculate each one of them. The Pivot Point P(PP) value is given by the average of the high price, low price, and the close price.

Pivot point P(PP) = (High + Low + Close) / 3

First level Support and Resistance Formula:

First Resistance (R1) = (2 x P) – Low | First Support (S1) = (2 x P) – High

Second level Support and Resistance Formula

Second Resistance (R2) = P + (High – Low) | Second Support (S2) = P – (High – Low)

Third Level Support and Resistance Formula

Third Resistance (R3) = High + 2(P – Low) | Third Support (S3) = Low – 2(High – P)

In the above formulas:

High represents the high price from the previous trading day,

Low represents the low price from the previous trading day, and

Close represents the closing price from the previous trading day.

Note: Since the forex market is open 24 hours, the New York closing time, i.e., 5:00 pm EST, is taken as the previous day data. For example, if you want to calculate the levels for Wednesday, you must consider the values of Tuesday.

Comprehending Pivot Points

In this indicator, we came across three levels, namely, Pivot point level, Support level, and the Resistance level. Let’s now understand what they actually depict.

The pivot point is a level drawn at the price of the average of the High, Low, and the close price of the prior trading day. So, if the market falls below the pivot point level on the subsequent trading day, we say that the market is showing bearish sentiment. And if the price goes above the pivot point, we say that the indicator is indicating bullish sentiment.

When it comes to the Support and Resistance levels, their meaning is the same as that of the actual Support and Resistance that is defined in the industry. The Support level is the price at which the market tends to shoot up, and Resistance is the level where the market tends to fall.

This brings us to the end of this lesson. In the coming lessons, we will understand how to trade the markets applying the Pivot Points indicator.

[wp_quiz id=”69225″]
Categories
Forex Price-Action Strategies

The Benefit of Checking Minor Chart before Taking Entry

In one of our lessons, we have learned that when a breakout confirmation candle comes out with a long upper or lower shadow needs to be checked on the 15-min chart. The last 15 M candle plays a significant role to drive the price towards the breakout direction. A breakout confirmation candle with a long upper or lower shadow does not mean that the last 15M candle comes out as a reversal candle. We are going to demonstrate an example of this in today’s lesson.

The price after being bearish finds its support. The chart produces two bullish candles consecutively. A level of resistance produces a bearish reversal candle. The correction length looks good. Let us proceed to the next chart.

The next candle comes out as a bearish candle as well. However, it closes within the consolidation support. The sellers are to wait for a candle to breach the level closing well below it. It is waiting time for the sellers.

The last candle breaches through the consolidation support. The breakout does not look an explicit breakout. However, it closes below the level. If the next candle closes below the breakout level, that would confirm the breakout. The breakout confirmation candle holds the key for the sellers.

The last candle closes below the breakout candle. This confirms the breakout. However, look at the long lower spike. This looks ominous for the sellers. In naked eyes, it does not look to be a good confirmation candle for the sellers to trigger a short entry. Let us now flip over to the 15 M chart and find out how the last candle comes out.

This is the 15 M chart. The last candle is a strong bearish candle despite having a long lower spike. We do not need to flip over to any minor chart here. This means the pair is having a strong bearish momentum in the 15 M chart, which is a signal for the sellers to trigger a short entry.

As expected, the next candle comes out as a bearish candle. It seems that the price is going to hit 1R in a hurry. Let us proceed to the next chart to find out how the trade goes.

The price heads towards the South with one more candle. It hits the take profit level (1R) with ease. The price may make a more bearish move as well. The trade setup with a less promising breakout confirmation candle works wonderfully well for the traders. Do not forget to check the 15 M chart if the confirmation candle has a long upper/lower shadow. It may help you decide which entry to take and which one not to.

Categories
Forex Price-Action Strategies

If Price finds New Level of Support/Resistance

To measure risk-reward, price action traders must identify the level of support/resistance accordingly. It gets tricky sometimes. In today’s lesson, we are going to demonstrate an example of that.

This is an H1 chart. The chart shows that the price has a bounce at a level. Upon producing a bullish engulfing candle, it heads towards the North. It finds its resistance and produces a bearish engulfing candle followed by another bearish one. If it makes a breakout and confirms the breakout, the sellers may trigger short entry by setting stop-loss above the level of resistance and take profit with 1R.

The price does not make a breakout, but it heads towards the North. The sellers must wait to find out what happens next. It may go back to the level of resistance, have a rejection at double top, and make a breakout.

It may even make a breakout from here. Let us find out from the next chart what happens.

The price finds its resistance at a new level. It produces a bearish engulfing candle again. If it makes a breakout at the level of support and confirms it, it would be a short signal.

The chart produces a bearish candle, which breaches the level of support. If the next candle closes below the last candle, the sellers may trigger a short entry.

The next candle confirms the breakout. The sellers may trigger a short entry right after the candle closes. Question is where do they set their stop loss and take profit? Do they use the new level of resistance to set stop loss and take profit or use the old one? We find out the answer in a minute.

The price heads towards the South with good bearish momentum. Trade setup works as well as it usually does in breakout trading strategy. The price keeps making lower lows, and it seems it may go further down. However, since the price makes an upward correction before making the breakout, we may consider the second level to set our stop loss. We may set our take profit with 1R by measuring the same number of pips from the entry point to stop loss as well. This provides fewer pips as a reward, but to be safe with an entry like this, we may do this. The price often makes a consolidation, or it makes a correction (once it hits 1 R from the new resistance/support) after such breakout. A correction/consolidation sometimes leads towards a trend reversal as well. Thus, there is no point in taking a loss for hunting some extra pips. Always remember ‘safety first.’

Categories
Forex Basic Strategies Forex Daily Topic

Significance of Breakout Confirmation or Reversal at Pullback

Breakout trading is one of the most widely used trading strategies in the Forex market. Breakout confirmation is equally important. Without breakout confirmation, a breakout may not work in favor of the traders in many cases. Thus, if we want to have a tremendous rate of winning, we may wait for breakout confirmation or reversal at pullback before taking entry. In today’s lesson, we are going to demonstrate an example of this.

The price after being rejected at a resistance level heads towards the South. It produces a bullish inside bar and heads towards the North again. The momentum suggests that the price may make a breakout at the level of resistance. Breakout traders are to keep an eye on the pair to get a breakout followed by breakout confirmation or reversal candle at the pullback to go long on the pair.

The last candle breaches through the level of resistance. Candle’s attributes suggest that this is an ideal breakout candle. The candle barley has the upper shadow. The breakout traders are to wait for either for the next candle to close above the breakout candle or the price to come back at the breakout level to consolidate and produce a bullish reversal candle to offer them a long entry.

The price does not head towards the North. It comes back at the breakout level closing within the breakout level. The breakout is still valid. However, the buyers must wait to get a bullish engulfing candle to close above consolidation resistance to trigger a long entry by setting stop loss below the breakout level. Let us proceed to the next chart to find out what happens next.

The price breaches the level of support and closes well below the breakout level. The sellers may take control soon in the pair. Traders taking a long entry right after the breakout candle closing are to have a loss here. If they set stop loss below the lowest low, the risk-reward would not be lucrative. When the price breaches a breakout level, it usually generates more momentum and changes its trend. Let us see what happens here.

The price goes back to the breakout level. This time it makes a bullish correction. The equation changes completely another way round. If the chart produces a bearish engulfing candle closing below consolidation support, the sellers may go short and drive the price towards the lowest low.

The chart produces a bearish engulfing candle followed by another strong bearish candle. It looks like a different ball game completely now. It is now the sellers’ territory.

In the bullish market, the chart does not produce a bullish reversal candle; thus, the price gets bearish. In the bearish market, it produces a bearish reversal candle (engulfing) and offers entry to the sellers. By taking entry upon breakout confirmation, we may not find as many entries as we would like, but it gets us more consistency in winning trades.

Categories
Forex Basics

Some Spikes are Not to Be Ignored

Forex traders often struggle with spikes on their trading charts. The Line chart does not show spikes, but Candlestick Chart does. Price action traders usually use candlestick charts as one of their weapons to trade effectively. Thus, they face this problem every now and then. There is no sure method confirming which spikes are to be ignored, and which are not to be ignored. We have to be sensible about that. In today’s lesson, we find out a kind of spikes that are not to be ignored. Let us get started.

The price heads towards the South with good bearish momentum. It finds its support and produces a bullish reversal candle. The last candle comes out as a bullish candle as well. The sellers are to wait for a bearish reversal candle to go short in this chart.

Here comes the bearish reversal candle that the sellers wait in such price action. We have not drawn any resistance line. If we closely observe, we find that the last two candles’ bodies suggest a line of resistance. Candles’ bodies play a significant role in determining the support/resistance line. Let us draw a line of resistance here.

Here it is. The combination of the last two candles and their bodies suggests that we may draw a line right above their bodies. In most cases, we are to do this. However, the last two spikes have something more to think about. If we closely look, we find that the last two spikes are lined up. They have had their rejection at the same level. This means that the line is significant, which must not be ignored. Thus, if we want to take entry here, we may count the line above as the level of resistance. Let us have a look at the chart below with more drawn lines.

Look at the Stop Loss level. To be safe, we may not ignore such levels, where the price gets rejected multiple times. The candles may end up having spikes, but these spikes shall be counted to determine our stop loss, take profit, and breakout level. Let us not proceed to find out how the entry goes.

The trade setup works well for the traders. The price heads towards the South with more bearish pressure. It gets 1R to the sellers in a hurry. Now many of us may say the price never goes back to the level. In 80% of cases, the price does not go back near to the resistance. In the rest of the 20% cases, it may go. That is when we are to take an unnecessary loss. As they say, it is better to be safe than sorry. Let us be safe with spikes like these.

Categories
Forex Basic Strategies Forex Daily Topic

An Old Theory about Support/Resistance

In price action trading, traders rely on support/resistance a lot. Beginners often ask a question of whether they are predetermined. In answer to this, they are predetermined to some extent. A trader can guess level/levels that may work as support/resistance. The idea is simple. Support becomes resistance, and resistance becomes support. In today’s lesson, we are going to demonstrate an example of this.

The price has a bounce at the drawn level and heads towards the North. The last candle comes out as a bearish engulfing candle. The price may head towards the South. If that happens, the sellers are to wait for a breakout at the drawn level. Let us proceed to find out what happens next.

The next candle comes out as a bearish candle as well. However, it does not make a breakout. This is an interesting chart for both the buyers and the sellers. The buyers may wait to get a bullish reversal. Since this is the level where the price has bounce earlier, this may become double bottom support. On the contrary, if the price makes a bearish breakout at the drawn level, the sellers dominate in the pair.

The bear wins. The last candle closes well below the drawn level. This is an explicit breakout. The sellers are to wait for the breakout confirmation. If the chart produces another bearish candle closing below the last candle, the price may find its next resistance at another significant level. In most cases, the price usually goes back and finds its resistance at the breakout level, which was the level of support earlier.

Look at the chart. The price goes back to the breakout level and creates a doji candle. Do you notice the doji candle is produced right at the drawn level? This means the level may drive the price towards the South by being the level of resistance.

The level produces a bearish engulfing candle closing below consolidation support (This may become resistance later as well). The last candle suggests that the price may head towards the South with good bearish momentum. The sellers have found the new resistance.

As expected, the price heads towards the South for one more candle. It usually happens when support/resistance produces an engulfing candle as a reversal candle. In the end, a level of support flips and becomes a level of resistance. If we closely observe, we find this is what happens almost every time. Support becomes resistance, and vice versa. By obeying the theory, experienced traders spot out the levels of support/resistance well ahead.

Categories
Forex Daily Topic Forex Price-Action Strategies

Price Action Trading: An Important Thing to be Remembered

To draw Support/Resistance, price action traders are to be sensible. They often need to be adjusted. In today’s lesson, we are going to demonstrate an example of this. To spot out support/resistance, traders are to aim the zones. Then, in the end, they are to draw levels to have the confirmation of a breakout. Let us learn more about this from the examples below.

This is an H1 chart. The chart shows that the price has been choppy for quite a while. It has been roaming within a descending triangle. The price may make a breakout to either side. Let us work with horizontal support and spot out point/points where the price bounces twice.

We may spot out two points here. These two levels are nearby to each other. Without any doubt, this is a strong support zone. If we consider levels, we may get confused since we get two levels. In such a situation, we may closely observe what the price does around the last swing low. Let us proceed to the next chart.

The chart shows that the last candle breaches the level of support (the last swing low). This is not an explicit breakout. We must wait for the next candle to have the breakout confirmation.

The next candle comes out as a bearish candle as well as closing well below the breakout candle. If we consider the price action for the last two candles, it is clear that the sellers have taken the control. The level of support at the last swing low holds the key as far as the last two candles’ price action is concerned. The H1 breakout strategy sellers may trigger a short entry right after the candle closes. Let us proceed to the next chart what the price does after triggering the entry.

The price heads towards the South with good bearish momentum. The sellers achieve their 1R with ease. The last candle’s attributes suggest that the price may go towards the South further. In a word, this has been a prolific trade setup for the sellers.

If we consider the first swing low on this chart, we may get confused about the breakout. Considering the price action and the last swing low, it is a basic thing to understand that the price makes a breakout at the last swing low. The last swing low matters most as far as the breakout strategy is concerned. If the price consolidates after a breakout, then other levels (previous levels of support/resistance) may work as flipped support or resistance. This is one important thing to be remembered by the price action traders.

Categories
Forex Course

75. Using Moving Average Crossovers To Take Trades

Introduction

In the previous article, we learned how to use the moving average for determining the direction trend. The Moving Average lines not only helps us in identifying the direction of the market but also tells us when a trend is about to end and potentially reverse. In today’s lesson, we will see how the moving averages can be used to enter trades at the reversal of a trend.

The principle of the strategy is to discover the crossover of the two moving averages on the chart. When the moving averages crossover, it is a sign of market reversal halting the existing trend. So at this point, we need to find a suitable ‘entry.’

Moving Average Crossover Strategy

Let us consider an example to explain the above-discussed strategy. Below, we have a daily chart of USD/CHF on which we have plotted the two moving averages (10-Period & 20-period). We can see the market being in a strong downtrend, and it is also confirmed by the two moving averages, where the ‘faster’ MA is below the ‘slower’ MA.

The next step is to find the overlap of ‘faster’ MA with the ‘slower’ MA from above, which is also known as the crossover of MAs. Once the crossover happens, there is a higher chance of the trend reversing. The below chart shows precisely how the crossover takes place, which means the trend can potentially reverse anytime now.

But, we shouldn’t be directly going long soon after the crossover. We need to confirm the trend reversal. A ‘higher low’ after the crossover validates the trend reversal, and this could be the perfect setup for going ‘long’ in this currency pair.

The below chart shows the ‘higher low,’ which is formed exactly after the crossover. Therefore, we now have confirmation from the market, so we can take some risk-free positions.

As we can see, in the below chart, the trade goes in our favor and hits our initial target. However, aggressive traders can aim for a higher ‘take-profit‘ as the new uptrend can reverse the entire downtrend, which is seen on the left-hand side. The reversal is also confirmed by moving averages where the ‘faster’ MA is above the ‘slower’ MA. The stop-loss for this trade is placed below the identified ‘higher low’ with a take-profit at a new high or significant S&R area.

Conclusion

The crossover strategy works beautifully in both volatile and trending markets, but they do not work that well in ranging markets. This is because the crossover takes place multiple times in the ranging market, and this leads to confusion about the market direction. To find high probability trades, one can also combine the strategy with other technical indicators to get additional confirmation of the trend reversal. In the next article, we shall see how moving averages can act as key support and resistance levels.

[wp_quiz id=”65842″]
Categories
Forex Basic Strategies Forex Daily Topic Forex Price Action

Support, Resistance and Trade Management

-Support and Resistance are the two most important concepts in the financial market. Forex traders strongly rely on support and resistance, as well. Price action traders’ main weapon is support and resistance. In today’s article, we are going to demonstrate an example of how the price reacts to a major level of support and resistance. Let us get started.

Look at the chart. The price consolidates around the red-marked level, it finds its resistance there and makes a bearish move. After having a correction, it makes the new lowest low. This is now the sellers’ territory. Let us assume that there is no significant level, which may hold the price as support. Thus, we are not able to mark any level as support. The sellers are to wait for the price to consolidate and produce a bearish reversal candle to offer them short entry in this chart.

The price makes new lowest lows and heads towards the South with good bearish momentum. However, it seems that it may have found its support. It consolidates for a while around the red-marked level and produces a bullish engulfing candle. The buyers on the minor chart may get them engaged to keep an eye on the chart to go long above the highest high of the last candle. Let us find out what happens next.

The price heads towards the North. It consolidates and produces another bullish engulfing candle. It means the chart is now the buyers’ territory. This is where the game of support and resistance begins. You may have noticed that we have red-marked the level. This is the most significant level in this chart for the buyers. The price may consolidate and find its resistance in this chart before it reaches the red-marked level. However, this is where traders may make a decision concerning their long position. They may either close their whole trade or take partial profit.

The price keeps heading towards the North. It buyers are having a party here. They must not forget the red-marked level, though. Let us proceed to the next chart.

Look at the chart carefully. Do you notice that the price consolidates around the red-marked level, which is the swing high in this chart? It produces a bearish engulfing candle followed by another bearish one. The last candle on this chart comes out as a bullish inside bar. If the next candle comes out as a bearish engulfing candle, the sellers may drive the price towards the South. I am sure now you know where the sellers are to be careful with their trade management. Yes, they must take the red-marked support (swing low in this chart) into account to manage their short entries.

Categories
Forex Price Action

Never Know What is around the Corner

In today’s lesson, we are going to demonstrate an example of trend riding along with the H4 breakout trading strategy. We often see that the market is in a strong direction, but it does not offer many entries. It is frustrating, but we must take it easy. We must not be impatient but keep our eyes on the chart. We never know what is around the corner.

This is an H4 chart. The chart shows that the price has been heading towards the South with strong bearish momentum. However, it has not offered any A+ entry yet. It produces some strong bearish engulfing candle breaching through consolidation support. However, consolidations have been shallow. Thus, the sellers on this chart have not been able to make the most of it. Look at the last candle. It comes out as a strong bearish candle as well. It suggests that the bearish trend is strong enough, and it may drive the price towards the South further. Let us proceed to the next chart.

The chart produces a bullish inside bar. This time it looks better since the inside bar candle is a long one. This means if the chart produces a bearish engulfing candle again, it would be after a deep consolidation. The deeper consolidation, the better it is as far as reward is concerned.

The chart produces two more bullish candles. It looks like it has been searching for its support. Deeper consolidation/correction is good, but if it goes too far by making a bullish breakout, equation changes. Let us proceed to the next chart.

Here it comes. An A+ bearish engulfing signal candle this is. The sellers may trigger a short entry right after the candle closes by setting stop-loss above the candle’s high. Take profit may be set with 1:1 risk-reward.

The chart produces another bullish corrective candle after such a nice-looking bearish reversal candle. However, it heads towards the South and hits the target. We learn two lessons here.

  1. A chart may not offer as many entries as we anticipate, even it is on a strong trend.
  2. We never know what is around the corner in the Forex market.

At one point, it seems that the chart may not offer any short entry for the H4 sellers. The price keeps heading towards the North. Deep consolidation is about to get into too deep. At last, the signal candle comes and offers an excellent short entry. While trading, we are always to be on our toes since we do not know what is around the corner in the Forex market.


Categories
Forex Course

63. Reasons Why We Should Never Completely Depend On Fib levels?

Introduction

In the previous article, we learnt how exactly to trade using the Fibonacci levels. There are many other ways through which Fib levels can be traded. Some of them include trading these levels using S&R, Trendlines, and even candlestick patterns. Before learning all of these ways, we must know that these levels are not guaranteed and cannot be traded stand-alone. So in this article, let’s discuss why one should be very careful while trading Fibonacci retracements.

Fibonacci Levels Will Not Be Respected Always

Every technical level ultimately breaks at a certain point in time, and that is the case with Fibonacci levels as well. In the previous article, we had learnt that Fibonacci levels also act as potential support and resistance areas. So these levels do break just as how S&R levels break. Therefore we must keep in mind that these levels are not foolproof.

Let’s understand this with the help of an example. But before that, make sure to read our article on ‘How to trade Fib retracements’ to understand this better. You can find that lesson here.

In the price chart below, we can see an initial big move to the downside. So basically, here we must wait for the retracement, and that retracement must touch the Fibo levels. Let’s see what happens in the next step.

We saw the retracement (below chart) of the downward move, and we have placed the Fib levels from swing high to swing low since it is a downtrend.

Then we can see the retracement reaching the 50% Fib level and holding there. Ideally, at this point, the retracement must stop, and the market’s original downtrend should continue. Also, we should be placing our ‘sell’ trades as the Red confirmation candle can clearly be seen.

But, to our surprise, we observe that the price did not respect our strategy, and the market shot up to the north, violating all the Fibonacci levels, as shown in the below chart.

While Fibonacci retracement levels give us a high probability of the trade working in our favor, like any other technical analysis tool, they don’t always work. One can never be entirely certain that the price will respect the 50% or 38.2% or any Fibonacci level for that matter.

If you are an experienced technical trader, you wouldn’t have placed a sell trade in the above scenario. It was clear that the sellers are losing momentum. The formation of a bearish Doji candle at the bottom (below chart) is another confirmation of a trend reversal.

So we should be looking at the bigger picture, or we should take the help of any other technical tools to confirm the signals generated by the Fibonacci levels. Never completely depend on them.

Conclusion

Apart from the things that we discussed above, there is another issue while using these Fib ratios, which is determining the appropriate swing low and swing high. Everyone looks at charts differently. They trade at different time frames and have their own fundamental reason for buying or selling the currency pair.

Swing high for one trader might likely be different than swing high for another. And when the Fib ratios are placed incorrectly, of course, the trading signals generated won’t be accurate. Also, the prerequisite for Fibonacci trading is trending markets. When the market is in a consolidation or moving sideways, it is obviously not possible to trade with these ratios.

We hope you understood this lesson well. If you find this complicated or if you have any questions, please let us know in the comments below. Cheers.

[wp_quiz id=”64257″]
Categories
Forex Daily Topic Forex Price-Action Strategies

Never Forget to Calculate Risk-Reward

Risk-Reward is an extremely important factor in Forex trading. The price often makes a reversal at a significant level of swing high/swing low. Thus, price action traders must emphasize those levels before taking any entry. By calculating risk-reward, they should only take entry once a trade setup is found lucrative as far as the risk-reward ratio is concerned. In today’s article, we are going to demonstrate an example of a trade setup, which looks good with candlestick patterns and price action. However, things do not go as it usually goes. We try to find out the reason behind it.

After being bearish for quite a while, the chart heads towards the North by producing a bullish inside bar. The chart presents a strong bullish candle followed by a corrective candle. This is what price action traders wait for. Ideally, they are to wait for a bullish engulfing candle closing above the consolidation resistance to go long on the pair. Do not miss the drawn level, which is the last significant swing high.

Here it comes. The chart produces a bullish engulfing candle closing well above the consolidation resistance. Some traders may think that they shall trigger a long entry right after the last candle closes. We must not forget that it is not only about candlestick and breakout. There is another factor, which is risk-reward. The reward does not look good comparing to the risk.

The next candle does not disappoint the buyers (if there are some). However, it gives a strong message that the level of resistance has gone stronger. The price may make a reversal. Let us find out what the price does next.

The next candle comes out as a bearish engulfing candle. This is one of the strongest bearish reversal candles. Since a significant level of resistance produces the candle, the sellers are getting ready to go short on the pair upon a bearish breakout. Those who took a long entry earlier, their trade is in great danger.

The next candle comes out as a bearish candle having a strong bounce at the level of last support. It must have swept away buyers’ stop loss. The last candle does not make a bearish breakout and has a long lower shadow, which is not a good sign for the sellers as well.  However, the buyers have not been able to take advantage of such nice bullish price action. The Forex market could take any direction since there are technical as well as fundamental aspects. Nevertheless, if we are to find one valid reason for the bearish reversal, it most probably is risk-reward.

Categories
Forex Course

59. Trading The Candlestick Charts Using Support and Resistance Levels

Introduction

In the previous few lessons, we have discussed many candlestick patterns and how to trade them. Those basics are very important for us to master Technical Analysis. Before leaving the Candlestick topics, let’s discuss THE most important concept in technical trading i.e., Support & Resistance. We shall first understand what Support and Resistance are, and will learn how to trade them on the Candlestick charts.

What Is Support?

Support is the level at which the price finds it difficult to fall below. Eventually, the price will bounce back up at this particular level. The support level acts as a floor that restricts price action to go down further. Some technical traders describe ‘Support’ as an area where demand overcomes supply. Because at this level, the demand for any currency will be more, hence the selling stops, and buying continues. The price reaction of any given asset would look something like the image below at the Support level. We can clearly see the price bouncing back up once it reaches the support level. (Blue Line = Support Level)

What Is Resistance?

Resistance is just the opposite of the support level. It is the level where price finds it difficult to break through to rise above until it is pushed back down. It acts as a ceiling restricting the price action to go up further. Basically, it is an area where supply overcomes demand. The price reaction of any underlying currency at a resistance looks something like the image below. We can see the price reaching the resistance line many times but unable to break through it. We must remember that at any point, Support can turn into Resistance and Resistance can turn into support. Hene, it is called S&R.

Pairing candlesticks with S&R

The fundamental method of technical trading is to buy at Support and Sell at Resistance. But this does not always work as there is no sure shot assurance that the Support and Resistance levels will hold for long. Hence traders need to look at other important factors while trading at Support and Resistance.

When buying near Support, we must wait for the consolidation at that area and only buy when the price breaks above that small consolidation. In that way, we can be sure that the price is respecting that level and is starting to move higher. The same concept applies when selling at resistance. Wait for consolidation and then enter a short trade when the price drops below the low of the small consolidation.

Below is an example of a short trade.

After entering the trade, make sure to place the stop-loss just below the low and above the high of Support & Resistance, respectively.

According to technical analysis principles, if a Support level or Resistance level is broken, their role is reversed, i.e., Support becomes Resistance and Resistance becomes Support. The psychology behind this phenomenon is that, when price breaches a key area, some will get out, and some hold on to their trades to see what happens. When price retraces back to the key area, people who have held it, go out and making the price bounce at the previous Support and Resistance.

Conclusion 

Traders always suspect a reversal at the key Support and Resistance as there is a high probability that price will reverse at these key levels. Some traders who had open positions exit at these price levels and others initiate new positions at these levels, depending on which side the price are they. Support and resistance levels are psychological levels at which many traders place orders to buy (support) or sell (resistance) making them supply or demand levels. That is why it is crucial to learn about Support and Resistance.  Also, support and resistance levels can be identified more easily using candlesticks, as a candle is very graphical, displaying wicks when the price bounces back from bottoms or tops. Identifying these significant levels forms the basis for Technical Analysis. Cheers!

[wp_quiz id=”61918″]
Categories
Forex Price-Action Strategies

Does the ABC Pattern Give Any Clue about the C Point?

We have learned about the ABC pattern in some of our previous lessons. The C point is the most crucial factor to trade on the ABC pattern. Traders use Fibonacci retracement, flipped support/resistance to spot out the C point. Fibonacci retracement works like magic, which we will learn soon. In today’s article, we will demonstrate an example of an ABC pattern and try to find out whether it gives us any clue about the level before it produces the C point.

This is a daily chart. The price after being very bearish makes a bullish move. The price produces a bearish reversal candle. It is an inside bar not being a strong bearish reversal candle. However, we must notice where it is produced. Let us have a look at the same chart with some horizontal lines.

Look at the chart now. The price reacted at the level earlier. The level worked as a strong level of resistance and drove the price towards the downside. This time, the level produces a bearish reversal candle. The ABC pattern traders usually wait for such price action around such levels. To take an entry, the daily-H4 chart combination traders are to flip over to the H4 chart.

The price produces a reversal candle. It may consolidate now. The sellers are to get a bearish reversal candle and to find out a level of resistance to set their Stop Loss above it. A breakout at the level of support is the signal to trigger a short entry.

The price consolidates. Upon getting its resistance, it makes a breakout. A short entry may be triggered right after the last candle closes. The price may find its next support at the red-marked level (point B). Let us find out how the trade goes.

The trade goes well. The price heads towards the Take Profit with extreme bearish pressure. Since this is an ABC pattern’s daily-H4 chart combination, the price may travel towards the South further. The sellers may consider taking partial profit here. Taking Partial Profit usually increases our chance of getting more pips. When we can find out an ABC pattern, and we are trading on the C point, it often gets us more profit in the end. To be able to spot out the C point, we must practice a lot with Fibonacci retracement, eyeing on flipped levels, and previous levels of support/resistance.

Categories
Forex Price-Action Strategies

It is Better to be Safe than Sorry.

Using Stop Loss is an essential component of trade management. The Forex market gets volatile from time to time. Taking an entry without using Stop Loss may make an account empty. Thus, under no circumstances, we shall take any entry without using Stop Loss. We need to make sure that we set our Stop Loss accordingly, which is neither too tight nor too saggy. In today’s lesson, we are going to demonstrate an example of that.

The above chart is a daily chart. We see that the price finds its support and produces a bullish engulfing candle. The candle closes within the last swing high. The daily-H4 combination traders are to flip over to the H4 chart to take a long entry upon consolidation and bullish breakout. Let us have a look at the H4 chart.

The H4 chart looks extremely bullish. The chart produces a morning star right at the support zone and heads towards the North for one more candle. Traders are to keep an eye on the chart for the price consolidation.

The chart produces one more bullish candle. It then consolidates and creates a bullish engulfing candle breaching the last highest high on the chart. This is an ideal price action opportunity to trigger a long entry right after the last candle closes. Traders shall set the stop loss below the level of support, where the engulfing candle bounces.

The next candle comes out as a bearish candle approaching the Stop Loss level. However, if we set the Stop Loss below the support level, we would be safe here. Things do not look as good as we expected. Let us proceed to the next chart.

The next candle comes out as a bullish engulfing candle. Things look much better now. However, we must not miss the fact that the bullish engulfing candle has a bounce right at the Stop Loss level. If we set too tight Stop Loss, we would have to encounter a losing trade here. Instead of making the profit, we would lose money.

It is a debatable issue how far we shall set our Stop Loss. It is not recommended that we should set our Stop Loss too far. However, we shall set our Stop Loss below the level of support/resistance and add some extra pips. For intraday trading on the 5M, 15M, 30M, H1, and H4 chart, to measure the number of extra pips, we may use the spread of that particular pair. Let us assume we are taking a long entry on EURUSD. If the spread is three pips, we may add three extra pips to set our Stop Loss. We must do a lot of back-testing with our favorite pairs to find out the perfect measure for this to be safe with our entries. As they say, “it is better to be safe than sorry.”


Categories
Forex Daily Topic Forex Price-Action Strategies

An Entry Derived From an Unusual Consolidation

Price action traders love to see the price consolidates and makes a breakout towards the trend direction. Consolidation offers better risk-reward as well as a better chance of winning a trade. In today’s lesson, we are going to demonstrate an example of a consolidation, which is rather unusual. Let us proceed.

This is a daily chart. The chart shows that the price produces a bullish engulfing candle at a flipped level of support. The daily-H4 chart combination traders may flip over to the H4 chart for the price to consolidate and a bullish breakout to go long on the pair. Let us flip over to the H4 chart.

The H4 chart shows that the price heads towards the North by producing bullish candles consecutively. The buyers shall wait for the price to find its support, consolidates, and makes a bullish breakout. Let us proceed to the next chart.

The chart produces another candle, which has a bullish body. In naked eyes, it is a bullish candle, but it is not. It is an Inside bar, which closes within the level of resistance. Let us have a look at the next chart.

The next candle has a little bullish body as well. Many traders may think that the price is still with the bull. Do not get trapped here. The candle closes within the level of resistance again. The price has not found its support yet. However, it has been on a tricky consolidation.

Look at the last candle, which closes above the level of resistance. The price bounces at the level where the first candle (Inside Bar) bounced. Since a bullish engulfing candle breaks the level of resistance, technically traders may trigger a long entry right after the candle closes. Let us proceed to the next chart to find out how the trade goes.

The price keeps heading towards the North for two more candles. As it seems, it may go towards the North further. An unusual consolidation and an explicit breakout seem to work wonderfully well for the buyers here. We usually see that price consolidates by producing bearish candles on a bullish market and vice versa. In this example, we have seen that the price may consolidate by producing inside bars as well. An Inside bar/s may confuse us. It may make us think the price is not on consolidation. Now we know consolidation sometimes may look different. However, it works as well as usual consolidation.

Categories
Forex Daily Topic Forex Price-Action Strategies

Need the patience to Manage Trade by Taking Partial Profit

Partial profit taking is a handy feature that Forex traders often use. Since the Forex market is very volatile, traders take out a portion of profit and let the rest of the trade run to get them more pips. Traders need to have patience, though, if they want to manage the trade by taking a partial profit. In today’s lesson, we are going to demonstrate an example of partial profit-taking and find out the importance of having patience.

This is a daily chart. The price produces a bullish harami right at the level where it bounces earlier. The daily-H4 combination traders are to flip over to the H4 chart to find out long opportunities. Let us flip over to the H4 chart.

The H4 chart looks fantastic for the buyers. The first candle comes out as a bullish engulfing candle followed by another bullish one. The price consolidates and produces a bullish reversal candle as well. The buyers are to wait for an H4 breakout at the resistance to trigger a long entry.

The price comes down to find its support and heads towards the North to make the breakout. Look at the breakout candle, which is a good-looking bullish candle with long lower shadow. The buyers have been waiting for this. It is time to trigger a long entry.

The price keeps heading towards the North after triggering the entry. The last candle comes out as a strong bullish candle, so the buyers let their trade to go along. Let us proceed to the next chart.

The chart produces a bearish reversal candle. The price may go up to the black marked level. It means that the price has enough space to travel and offer a handful of pips. The price may make a bearish move from here as well. What do the buyers do here? They may take out a portion of the profit. They may take out a 50% profit and leave the stop loss where it is. It will allow them grabbing more pips if it keeps going towards the North. If it does not, they will not lose a dime.

The price gets caught within a bullish rectangle. Do not forget that it has been a long time that the buyers were sticking with their trade. They have been very patient. The price still does not make an upside breakout. It might go either way. Let us proceed to the next chart.

At last, it makes a breakout at the first rectangle. It consolidates again with several candles and makes another bullish breakout. Eventually, it hits the level. Traders have grabbed more pips by taking a partial profit. However, we must not miss the part that they are to be extremely patient. Taking a partial profit may help us be more consistent in making a profit, but we now know what we have to put in to do it accordingly.


Categories
Forex Daily Topic Forex Price-Action Strategies

Do not Mix up, Stick with the Rules

In today’s lesson, we are going to demonstrate an example of an H4 chart offering an entry. The daily-H4 chart combination traders are to keep an eye on the daily chart first. Once the daily chart produces a daily reversal candle from the support/resistance zone, they are to flip over to the H4 chart to take an entry. Today, we are going to do it in another way for a reason. We are going to start monitoring from the H4 chart. Let us start. Soon you will know why I am doing it so.

This is the H4 chart, and the red-marked level is daily support. It shows that the price is at the level of support. The last candle comes out as a bearish candle with a long lower shadow. It suggests that the level may produce a bullish reversal soon.

As expected, the chart produces a bullish engulfing candle right at the level of support. A bullish engulfing candle at a support zone has a strong message to send to the buyers that it is their territory.

The price goes towards the North for one more candle. It then has a correction and produces another bullish engulfing candle closing above the resistance. This is an ideal sequence for the price action traders to take a long entry. Let us assume that we do not trigger an entry here and have a look at the next chart.

The price keeps heading towards the North. It means that we have missed an opportunity to make some green pips here. Everything seems perfect, but why we skip taking the entry. Is it a mistake? Is not it? No, it is not a mistake. We shall not take the entry as far as the daily-H4 chart combination chart is concerned. We have started monitoring the chart from the H4 chart today. The daily-H4 chart combination traders are to monitor from the daily chart. Let us have a look at the Daily chart how it looks before flipping over to the first H4 chart here.

You see that the last daily candle comes out as a bearish one. It closes within a level, which has the potential to hold the price as a level of support. However, it has not produced a bullish reversal candle yet. Thus, they shall not flip over to the H4 chart. This is the reason that the daily-H4 chart combination traders may not take the above entry. The H4-H1 chart combination traders may not get an entry here as well since the level of support is not H4 support. The price does not react to the level on the H4 chart in recent times.  It moves towards the North by obeying other trading methods but not according to the price action chart combination trading.

We must be disciplined and must not mix up one strategy with others but stick with the rules. Sticking with the rules is one of the most important factors to be consistent in trading.

Categories
Forex Daily Topic Forex Price-Action Strategies

Consolidation and Breakout: The Two Key Movements in Price Action Trading

Price action trading mainly relies on consolidation, trend, and breakout. Reversal candle is another feature that traders keep an eye at. Typically, double top/bottom, morning star/evening star, and engulfing candle are considered the strongest reversal signal. However, even an inside bar may create an excellent bullish/bearish momentum if the price consolidates and makes a perfect breakout. In today’s lesson, we are going to demonstrate an example of this.

We are looking at an H4 chart. It shows that the price heads towards the North with extreme bullish momentum. A bearish inside bar followed by another bearish candle makes a reversal. The price after being bearish may have found its support. The buyers are to wait for the price to make a bullish breakout at the level of resistance. The sellers are to wait for consolidation and a bearish breakout at the level of support.

The price starts having a correction. If it keeps going towards the North further, it may get choppy. If it finds its resistance nearby, the sellers may find an opportunity to go short on the pair.

The chart produces a bearish engulfing candle. It means the price finds its resistance. If it makes an H1 breakout at the level of support, the sellers may want to trigger a short entry. Let us now have a look at the same chart with those two levels.

The equation gets much simpler with those two levels. Since this is an H4 chart, the sellers are to flip over to the H1 chart to get a breakout and trigger a short entry. The reversal candle looks strong enough to make the sellers keep an eye on the pair to take a short entry upon a breakout.

This is how the H1 chart looks. The price seems to have found two levels of support here. However, the H4 chart looks very bearish, which may keep driving the price to make a breakout at the level of red marked support.

Here comes the breakout. The candle closes well below the level of support. It has a long lower shadow, but it has a thick bearish body as well. The sellers may trigger a short entry right after the candle closes by setting stop loss above the resistance. Take profit may be set at the last swing low on the H4 chart. Let us proceed to the next chart to find out how the entry goes.

The price heads towards the South with good bearish momentum. It makes another bearish breakout at the last swing low as well. Concisely, the sellers grab some green pips from the entry.

If we concentrate on the first candle of the trend, we see that the candle is a bearish inside bar. An inside bar is considered the weakest reversal signal. However, it produces an excellent short signal here because of perfect consolidation and the breakout. The above example signifies the importance of consolidation and breakout in price action trading.

Categories
Forex Basic Strategies Forex Trading Strategies

How To Trade The Engulfing Candlestick Pattern Using Support/Resistance

Introduction

Engulfing is one of those candlestick patterns in the forex market that provides a useful way for traders to anticipate a possible reversal in the trend. There are two types of engulfing patterns – Bullish Engulfing and Bearish Engulfing. The engulfing candle’s bearish or bullishness is wholly based on its position in relation to the existing trend of an underlying asset.

Understanding The Types

A bullish engulfing pattern can appear anywhere in the trend. But it holds more significance if it appears in a downtrend. This pattern indicates the surge in buying pressure as it shows that more buyers are entering the market, driving the price action further up. This pattern consists of a bearish red candle and the second bullish candle completely engulfs the body of the previous red candle.

Interpretation – Always look for the bullish engulfing pattern in a clear downtrend. For entering a trade, traders must combine this pattern with support resistance levels or with any reliable technical indicator for additional confirmation of the trend reversal.

Bearish engulfing pattern is just the opposite of the bullish engulfing pattern. Instead of appearing at the bottom of the trend, this pattern appears at the top of the trend. We can say that more accurate and reliable signals can be generated when this pattern appears at the top of an uptrend. The bearish engulfing pattern consists of two candles. The first one being the green candle. This one is, next, engulfed by the subsequent red candle. The pattern triggers a reversal in an existing trend. It indicates the buyers are no longer able to push the price higher, and the bears took control of the market.

Interpretation – Always look for the bearish engulfing pattern in a clear uptrend. The second red candle must engulf the green candle ultimately, showing that bears are piling into the market aggressively. For entering a trade, traders must look for additional confirmation, such as support resistance levels or by using any reliable technical indicator.

Pairing the Engulfing pattern with Support/Resistance

Every trader has a unique way of trading the market. Some traders like to go with the trend while some traders only trade counter-trend moves. In this strategy, we have paired the engulfing pattern with support & resistance to show you how to trade the reversals correctly.

Confirm the downtrend first on your trading timeframe 

The first step of this trading strategy is to confirm the trend of any underlying asset. Let’s trade the bullish engulfing pattern. So as discussed, we should be finding the downtrend on the price chart. As you can see in the below NZD/USD currency pair was in an overall downtrend.

Find out the Bullish Engulfing pattern on your trading timeframe

The key to successful trading is to follow all the rules of the trading strategy. The engulfing pattern can be seen all over the price chart, but obviously, we can’t trade all of these patterns. We should be trading only those engulfing patterns that appear in the major support area.

In the below image, the NZD/USD was in an overall downtrend, and price action respects the major support area. Market prints the engulfing pattern at the support zone, which indicates that the buyers are more likely to lead the price.

Entry, Take Profit & Stop loss

Enter the trade right after you see the bullish engulfing pattern at the S&R area. Take-profit targets depend on your trading style. If you are a swing trader or full-time trader, hold your positions for more extended targets. If you are an intraday trader, close your position at the nearest resistance area.

You can also book partial profits at a significant resistance area and close your full position when the market prints the bearish engulfing pattern. In this strategy, we took the buy at a significant support zone, so it’s a healthy practice to put stop loss just below the support area.

Look at the below image; you can see that price action goes above the significant resistance area. But we made sure to close our positions at the resistance area as we don’t want our money to be blocked in a single trade for a long time. Overall it was good 4R trade.

Bottom Line

There are so many different ways to take trades to use the engulfing pattern. Statistically, the engulfing pattern works better when traded at the bottom or top of the trend. So make sure to check their location before placing the trades. One other possible way to trade am Engulfing Pattern is when it is combined with Moving Averages. But even that way, make sure to trade the engulfing pattern at the significant support and resistance areas. Some traders use reliable indicators like MACD to confirm the trend reversals by using the overbought and oversold levels. That’s about the Engulfing pattern strategy. Make sure to find these patterns and trade them in your upcoming trading activities. Let us know if you have any questions in the comments below. Cheers!

Categories
Forex Price-Action Strategies

H4-H1 Combination – An Opportunity Missed Just for an Inch

The H4-H1 is an action-packed combination. By drawing support/resistance on the and upon getting a reversal candle on the H4 chart, an entry is triggered considering H1 price action. However, things do not always go according to our expectations. In today’s lesson, we are going to demonstrate an example of an H4-H1 combination and find out whether it offers us entry or not. Let us get started.

This is the H4 chart. The chart shows that the price after having a rejection at a strong resistance zone heads towards the downside with extreme bearish pressure. The support zone is strong too. The last three candles are bearish, but they suggest that selling pressure may have decreased off a little. The last candle is a Spinning Top.

The combination of the last three candles ends up producing a Morning Star. This is one of the strongest bullish reversal candle combinations. The buyers are to flip over to the H1 chart for consolidation and H1 breakout candle to go long on the pair. Let us flip over to the H1 chart.

This is how the H1 chart looks. The chart produces several bullish candles consecutively, which suggests that it is the buyers’ territory. The resistance level is far enough to offer a lucrative risk-reward to the buyers as well.

Here it comes. The first candle for consolidation comes out as a bearish engulfing candle. Let us find out whether the price finds its support nearby or it heads towards the downside further.

It seems that the price may have found its support. It produces a Spinning Top again. If a bullish engulfing candle breaches the level of resistance, it will be an A+ buying signal. If another bullish candle breaches the level from where the last candle closes, it will be a good buying signal as well but may have relatively less buying pressure than the engulfing one. In both cases, the buyers are to calculate that the signal candle does not go too far up. Let us find out what happens next.

A very good-looking bullish Marubozu candle breaches the resistance. The buyers may want to trigger a long entry right after the candle closes. Would you trigger a long entry here? I let you think for a minute.

If yes, then you might have missed the line “In both cases, the buyers are to calculate that the signal candle does not go too far up.” It does, and it leaves only a little space for the price to travel towards the resistance. The risk-reward is not lucrative here at all.

An entry where almost everything looks perfect, we may still skip taking that for not fulfilling just one condition. It may frustrate us to some extent, but we have to deal with it professionally.

Categories
Forex Price-Action Strategies

It’s Not Only the Levels, but It’s also about Zones

We keep talking about support, resistance, and their levels. Sometimes we forget that it is not only about the levels. A lot depends on their zones. No doubt, in the end, we are to calculate their levels at the time of taking an entry. However, we are to keep an eye at the zones where the price may create a new trend. In this article, we are going to demonstrate an example of that.

This is a daily chart. The chart shows that the price upon finding very strong support heads towards the upside. It may have found its resistance as well, which pushes the price towards the downside. Take note that the level of support is extremely strong, which creates a secure buying zone.

The price tried to find its support at the last swing high. However, it breaches the level and comes further down. It produces an Inside Bar. It looks good for the sellers so far. Let us proceed to the next chart to find out what the price does.

The price consolidates with several candles. Look at the last candle. This is an engulfing candle which states that buyers on the minor time frames are confident enough to push the price towards the North. The resistance is far enough. Thus the daily-H4 chart traders are to flip over to the H4 chart to find out a long opportunity.

This is the H4 chart. The chart produces a Spinning Top. A bullish reversal candle, along with a breakout at the resistance, will be the signal to go long. Let us find out from the next chart whether it consolidates more or produces the bullish reversal candle.

It produces an H4 bullish engulfing candle as the reversal candle. It has an upper wick, but the body looks good enough to attract the buyers. A long entry may be triggered right here. Let us find out how the price heads with the bull. Do not forget it may go another way around, as well.

It goes towards the buyers’ desired direction. The buying pressure has been good as well. However, the last candle comes out as a bearish engulfing candle. It may be time for the buyers to close their entry.

The Bottom Line

We have demonstrated an example that the price creates a new trend, not right from the last level of support. It instead creates it from a support zone. Traders are to keep an eye on the price action around the support/resistance zone to be able to find out more entries.

Categories
Forex Price-Action Strategies

Risk-Reward and Its Impact on the Price Behavior

Risk-reward is an essential factor in price action trading. When the price makes a breakout and produces a signal, the first thing traders are to calculate is risk-reward. It does not matter how the price heads towards a direction, significant higher high and lower low are to be calculated. These are what determine risk-reward. In today’s lesson, we are going to demonstrate an example of how risk-reward may have an impact on the market.

The above chart is a daily chart, in which the price action produces a Double Top along with an Inside Bar, and its neckline is not too far. The sellers are to wait for a breakout at the neckline and go short on the pair. Let us flip over to the H4 chart.

The H4 chart produces an Inside Bar as well as the reversal candle. However, the price heads towards the neckline with good bearish momentum. If the price makes an H4 breakout, the sellers may go short up to the last swing low on the H4 chart. The daily support, however, lies a bit further down.

The price is right at the neckline level. It is at a critical level since the last candle closes right at the neckline level. It could go either way from here. Let us see which way it heads.

A massive breakout takes place here. However, look at the last swing low. The price is adjacent to it. This means risk-reward is not lucrative at all. Traders must not sell from here on this chart.

It makes a breakout, which is fantastic. However, the black marked level is daily support. The sellers may take a short entry from here, but that is on the H4-H1 chart combination.

As expected, the price heads towards the daily support, and it produces a bullish reversal candle. It made such a strong bearish move, but the daily-H4 chart combination traders have not found any entry because of the risk-reward issue. If the daily-H4 combination chart traders found an entry, the bearish move would have been more consistent. Let us find out what happened next.

The price heads towards the level sellers were waiting for the price to make a breakout at first. This one is another inconsistent move on this chart. That means an inconsistent move may bring another inconsistent one. To sum up, we could conclude by saying that the risk-reward factor may make the price inconsistent to some extent.

Categories
Forex Basic Strategies Forex Trading Strategies

Trading False Breakouts Like a Professional Forex Trader

Introduction

Often there are times in the market when the price breaks a certain significant level, and most of the novice traders immediately jump into the market. But, suddenly, the price reverts quickly, stopping out these traders or putting them in a losing position. Most of the experienced traders would have exited their positions when they realized they are trapped by the big whales like industry or institutional traders.

But beginner traders often become the victims of these false breakouts, and it affects their psychology as well. They will start doubting their trading strategies, and the fear element will surpass their confidence. Instead of falling into the negative state of mind, traders should learn how to use these false breakouts to their advantage so that they can profit from it. In this article, let’s discuss how to trade the false breakouts properly.

Most of the traders often consider false breakouts as a negative thing in the market. The general perception is that, by trading the false breakouts, they are taking the unnecessary risk, or it is not the correct way to trade. Some traders also believe that simple breakouts are more comfortable to trade. It is true, but simple breakouts won’t provide a great risk-reward, and also, it is not a consistent way to trade the market. On the other hand, successful & experienced traders see the false breakout logically and consider it as an opportunity to make some quick profits.

There are a lot of ways to trade false breakouts. Some traders trade them in conjunction with indicators, and some use it with trend lines and support resistance. In this strategy, we will show you the most appropriate way of trading false breakouts.

Trading the false breakout by using the major S&R levels

False breakouts occur in all types of markets, such as Forex, Stocks, Futures, and Options. They also occur in all kinds of market conditions. But the critical thing to remember is that every false break out is not worthy enough to trade. Always consider trading the false breakouts by following the trend of the market. That is, if the trend is up, look for the buy-side false breakout and in a downtrend, look for sell-side false breakouts.

Step 1 – Find the trend of the higher timeframe

This step is simple yet crucial because we need to confirm the trend of the market. Keep in mind that most of the lower timeframes always follow the direction of the higher timeframe. To explain this strategy, we are examining the uptrend of the GBP/USD forex pair.

Step 2 – Look for the significant S&R in the lower timeframe

Most of the false breakouts occur near the support and resistance level. The reason brokers and market movers use these levels is to manipulate the market as is these areas act as a significant supply-demand zone. This makes it easier for the bigger players to fill more orders.

Step 3 – Look for the false breakouts at the S&R level

As we know by now, most of the false breakouts happen at major support resistance area. A trader can set the alarm on the price chart to see when the price action is at a major level. When the price breaks these levels, wait for the false breakout to trade the market.

In the below image, GBP/USD was in an uptrend. On 15 Min chart during the pullback phase, prices started holding at the support area. On 29th Nov, look at the first circle where the price action prints the false breakout. But there is no way to trade that breakout. Because after that, the price action dipped below the support area, which is a sign of a false breakout. So it is an indication to go long on the GBP/USD forex pair.

Step 4 – Entry, Stop loss and Take profit

A trader should be entering the market when the price action holds at the significant support resistance area as it confirms that the levels are active to hold the prices. \

Take profit placement depends on your trading style. If you are an intraday trader, we suggest you close your position at a recent high. If you are a swing trader, look for another false breakout to load more positions. You can also use the recent high or any support resistance area of the higher timeframe to close all of your positions.

Most of the false breakouts are sure shot trades in the market. Place the stop loss just below the recent low, or at the closing of the most recent candle. If you are a conservative trader, then put stop loss bit spacious to your entry point.

In the below image, we have placed the stop loss just below the closing of the recent candle, and we have captured the 4R trade in the market.

Bottom line

It is essential to learn the logic and psychology behind any false breakout. Most of the time, the risk is small in these types of trades, and it is important not to be greedy while placing more extended targets. If there is no momentum in the market, close your positions, and if the trend is healthy to go for longer moves. You can still trade the regular breakouts, but throw relatively less money when compared to the false breakout trades. Also, make sure to practice trading false breakouts in a demo account until you master it. We hope you liked this article. Cheers!

Categories
Forex Price-Action Strategies

Never give Up: Chase it All the Way

Trading is a game of probability, which requires patience and amazing mental strength. A trader has to have ‘never give up’ mindset. In today’s trading lesson, we are going to demonstrate an example of the importance of having ‘never give up’ attitude.

The price heads towards the North by making new higher highs. The last candle comes out as a bearish candle. However, the overall trend is still biased with the bull. Thus, traders shall look for long opportunities here until it makes a breakout at the last swing low.

The last candle makes a breakout at the last swing low. The bear seems to have taken control. Traders are to go short on this chart upon upside correction. The last candle closes within the level, where the price reacted heavily earlier. Thus, the price may consolidate hard here.

It does not. It rather makes a breakout straightway. Moreover, it produces another bearish candle and approaches towards a significant level of support. Usually, after making such big movements without having consolidation, the price gets tired and choppy.

It is not tired on this occasion though. It consolidates and produces a bearish engulfing candle closing below the last support. A short entry may be triggered right after the candle closes by setting Stop Loss above the consolidation resistance.

Off she goes. The price heads towards the downside with extreme bearish pressure. Two consecutive bearish candles and there is still no sign of a reversal. The sellers may keep holding their position to make more pips. The movement justifies the statement that the market can be very tricky from time to time. It can do things (market move) that we may not even imagine on that particular occasion.

After making the first breakout, the price makes an abrupt move. Usually, in most cases, the price does not continue its journey towards the trend. Either it consolidates for a long time or it makes a reversal. Many price action traders may not want to keep their eyes on the chart. They may think it is a waste of time. However, the above example shows us that it is not waste. Experienced price action traders must have made full use of that bearish move. If a trader wants to survive in this market, he is to be patient, perseverant, and hard working. With these three qualities, he must have ‘never give up’ mind setup.

Categories
Forex Daily Topic Forex Price-Action Strategies

An Old Theory about Support/Resistance

Support and Resistance are the two extremely important components in financial trading. Price action traders rely on them as a critical component of their trading strategies.

Ideally, 90% of the indicators are able to reveal support and resistance levels. An ancient theory of support and resistance says that support becomes resistance and vice versa and interesting point is the theory still works nowadays as well as it did in the past. In today’s lesson, we are going to demonstrate an example of this long-used theory.

In the above figure, the price heads towards the North with good bullish momentum. It pauses at a level of resistance, where the price had a rejection earlier. The equation is simple here. If the price produces a bearish momentum and makes a breakout at the last swing low, the sellers are going to look for short opportunities. In case of an upside breakout, it remains buyers’ territory.

A bullish engulfing candle breaches the resistance. If the price confirms the breakout, the buyers keep dominating here. It seems that the sellers do not have any reasons to be optimistic soon.

The breakout level holds the next candle, as well. This move is a confirmed breakout. However, the buyers are to wait for price consolidation, which gives them a level of support to set stop loss and an upside breakout to trigger an entry.

Oh! No, a bearish Marubozu candle comes back in. All of a sudden, things look a bit different here. The buyers and the sellers both have chances. Let us find out what the price does next.

The price confirms the bearish breakout with an Inside Bar. Look at the last candle on the chart – a bearish engulfing candle forms at the resistance zone. The sellers may flip over to the H1 chart to take a short entry since it is an H4 chart.

The price takes some time to get bearish. It may have been consolidating on the H1 chart for several hours. However, it does get bearish in the end — the price heads towards the South with extreme bearish momentum. The last candle comes out as a Doji candle, which may make some sellers think about taking an exit. However, the way it has been heading towards the downside, most likely it may go towards the last swing low.

The Bottom Line

There are so many strategies, indicators, EAs in the market. It would be tough to suggest if you ask me which one works best. Then again, if I am asked to choose just one strategy, my choice would be “Sell at flipped over resistance; buy at flipped support.”

Categories
Forex Chart Basics Forex Daily Topic

Caution! A Big Round Number Ahead

In today’s lesson, we are going to demonstrate an event to find out what the price may do around the big round number. A big round number plays a significant role as far as traders’ psychology is concerned. The price usually gets volatile around a big round number. It may get tough for the traders to find out entries around the big round number. Let us now dig into USDCHF recent activities around the big round number 1.00000.

The price is heading towards the North with good bullish momentum. Look at the last candle. This is one good bullish candle, which states that the buyers are dominating the pair. Do you notice anything unusual here?

Here it is. The candle breaches through the level of 1.00000. As a trader, you must not miss such a big round number. Now that the price makes a breakout, you are to wait for the breakout confirmation and a strong bullish reversal candle to go long on the pair. This might be one of the best trades in your trading life if things go accordingly.

The price comes back in. However, it still looks all right for the buyers since if we consider the spikes at the last swing high. A bullish engulfing candle closing above the last bearish candle would be the buying signal. On the other hand, if it keeps going towards the downside, the sellers may take over the baton.

The price does not produce any bullish momentum. For the last four H4 candles, it could go either way. Traders are to wait patiently since this is the game around a massive round number.

Here it comes. It has now become sellers’ territory. The candle forms right at the level of 1.00000. The level could have been a level of support. It is now a level of resistance. The sellers on the minor charts keep going short; on this chart, they are to wait for consolidation and downside breakout to ride on the next bearish wave.

It consolidates and produces a sell signal after four H4 candles. The last H4 candle suggests it may be time for the price to consolidate again. An explicit bullish breakout at the level of 1.00000, did not work for the buyers. It could happen at any level, but when we deal with a massive round number, we happen to see it more often.

The Bottom Line

The market runs on many aspects, and traders’ psychology is one of them. Many traders set their Stop Loss and Take Profit at round numbers. Thus, the price may get extra volatility around a big round number. We may get breakout even on the H4 chart, which may turn out to be a fake breakout. We must remember this every time we see a big round number.


Categories
Forex Basic Strategies

Is Drawing One Trendline Enough?

The Trendline is an excellent trading tool that the price action traders love using on their charts. Drawing trendline as accurate as it can get and adjustment with spikes are two factors that traders are to look after before using trendline. Another factor trendline traders often need to do is drawing multiple trendlines on the same chart. In this lesson, we are going to demonstrate an example of that.

The chart shows that the price after finding its support at the trendline heads towards the North and makes a new highest high. Thus, this is a valid trendline. Ideally, the buyers are to wait for the price to come back to the trendline again and to produce a bullish reversal candle to go long on the pair. Let us proceed to find out what happens next.

The price does not come at the trendline. It finds its support well above the trendline and heads towards the North again. This is annoying, is not it? Do not get annoyed. Concentrate on the chart. Do you see anything interesting? Have a look at the next chart.

We can draw another trendline on the same chart since the price has a bounce and makes a new highest high. Traders are to wait again for the price to come back at the trendline and to produce a bullish reversal candle to offer them a long entry.

Wow, this time, the price comes at the trendline and produces a bullish reversal candle. Traders have been waiting for such price action. By flipping over to the next chart and an upside breakout, traders may grab some green pips.

The chart shows that the price comes back near the trendline’s support again, then heads towards the North. It consolidates hard on the minor charts, as it seems. The point here is that the price does not come at the first drawn trendline or produces a bullish reversal candle. It comes at the second drawn line, and this time, it creates the bullish reversal candle right at the trendline’s support. It heads towards the North and may have offered entry as well.

The Bottom Line

In most cases, the price does not come at the first drawn trendline. It has the tendency to come at the second drawn trendline more. It is often seen that the price obeys the third drawn trendline as well. Thus, if we are to trade on the trendline, we may keep an eye on the chart to draw a trendline as many times as we need to.

Categories
Forex Chart Basics

An Inverted Hammer at a Double Bottom

The Double Bottom is a pattern, where the buyers eagerly wait to get a bullish reversal candle at. Typically, a Bullish Engulfing Candle, a Bullish Pin Bar,  a Bullish Truck Rail are considered the strongest bullish reversal candle pattern. Usually, a Bullish Inside Bar and an Inverted Hammer are the weakest reversal pattern. In today’s lesson, we demonstrate an example of how a Daily Inverted Hammer candle offers a long entry.

This is the daily chart. It shows that the price has been roaming around within two horizontal levels. It is at the support and produces an Inverted Hammer. An Inverted Hammer is a bullish reversal candle but not a very strong one. Look at the upper shadow. It suggests that the price has a strong rejection at a level of resistance.

To some extent, it signifies intraday buyers’ less confidence. However, it is the daily chart, and the bullish reversal candle forms right at a double bottom’s support. Thus, let us flip over to the H4 chart to find out whether it offers us an entry.

The H4 chart shows that the price is on consolidation. The last candle looks ominous for the buyers. Nevertheless, traders on this chart combination are to look for long opportunities as long as the support holds the price. Let us go to the next chart to find out what happens.

The price finds its support and produces two consecutive bullish candles. One of them breaches the resistance and closes well above the resistance. A long entry may be triggered here by setting the Stop Loss below the consolidation support.

The price heads towards the North with good bullish momentum after triggering the breakout. The last candle on this chart comes out as a bearish candle with some gap. The buyers may consider closing the entry and come out with the total profit. On the other hand, some traders may want to take partial profit and ride on the wave up to the resistance. Have a look at the chart below.

The price may go up to the marked resistance level since this is the last swing high. If we consider the risk-reward, it is an amazing trade. The reward is about five times the risk. Do you remember how it started, though? It began with a Daily Inverted Hammer Candle (relatively weaker bullish reversal) at a Double Bottom’s support. Yes, this is what support of Double Bottom can do.

Categories
Forex Basics Forex Daily Topic

Using Trailing Stop: An Art to Be Learned by Traders

Using a trailing stop is a way to lock a profit in trading, at least with some profit. A floating profit trade may not always hit its Take-Profit level. Thus, traders use Trailing Stop to lock-in some profits and let it run to hit the target. Otherwise, some trades may result in a loss instead.

In today’s lesson, we are going to demonstrate an example of that.

The price heads towards the North with good bullish momentum. The buyers are to wait for price correction and bullish reversal candle to go long on the pair. Let us proceed to the next chart to find more about the correction.

The correction looks very bearish. However, a flipped support level holds the price. Thus, it is going to be an interesting battle between the bull and the bear. Let us find out who wins. Does it make a downside breakout or a bullish reversal candle?

The chart produces a bullish reversal candle. We can see that this is an Inside Bar, which is the weakest reversal candle. A flipped support creates a bullish reversal candle but does not make any breakout. The buyers are to flip over to the trigger chart to get consolidation and breakout to go long on this. This is the daily chart. Let us flip over to the H4 chart.

The H4 chart looks suitable for the buyers. The level of support produces a bullish engulfing candle. It has started the price correction. An upside breakout from a good level of support is the signal to trigger a long entry.

The price goes upward and consolidates. Upon finding support, the last candle breaches the level of resistance. Setting Stop Loss below the level of support, an entry may be triggered right after the last candle closes. The Take Profit shall be placed at the highest high of the previous bearish wave.

The price continues to go towards the upside for a while. It has started having consolidation. The price has found its support. An upside breakout is to push the price towards the North further. On the other hand, a downside breakout may push the price towards the South and even change the whole equation. Thus, the buyers are to move their Stop Loss. Have a look at the chart below.

The buyers shall move their Stop Loss below the level of support and hope it makes another upside breakout to hit the Take Profit. Let us find out what happens next.

This is what Forex trading is all about. You never know what exactly happens next. The price comes down. It would hit the Stop-Loss, where it was set at the very outset. By using Trailing Stop, the buyers have made some profit. Otherwise, they would have to encounter some loss.

The Bottom Line

Using Trailing Stop is an art. It needs a lot of practice to be master at it. Without knowing how to use it properly, it may hurt a trader instead. Since it is an important trading feature to save us from encountering a loss with a profit trade, a trader must study/work hard on this.

Categories
Forex Basics

Importance of Timing in Trading

Timing is an essential factor in trading. Price action traders take entry on signal candle’s/bar’s attributes and support/resistance breakout. Many traders ignore the timing factor. However, it is an important factor when the signal candle is produced. In this article, we are going to demonstrate an example of the importance of timing in trading.

This is a daily chart. The price keeps going towards the South. Traders shall only look for selling opportunities in this chart on upward price correction/consolidation. Let us go to the next chart and find out what happens next.

The chart produces an engulfing bullish candle. It is a sign that the price may go towards the North. Intraday buyers such as 5M, 15M, H1 traders may look for long opportunities in this chart. The daily chart traders must wait for the correction/consolidation to get over upon a daily bearish reversal candle.

The price heads towards the North with good bullish momentum. The intraday buyers have made full use of the engulfing candle here. However, upper shadow and an Inside Bar suggest that a bearish reversal may come soon.

Here it is. A bearish engulfing candle suggests that it is time to look for short opportunities. It is a daily chart, so we shall flip over to the H4 chart to look for short opportunities.

The H4 chart shows that the price consolidates and makes a bearish move. However, support is still intact. The sellers must wait for a breakout at the support to go short on this chart. Let us draw the support line on the chart.

With an upward adjustment, the support lies at the black marked level. One of the H4 bearish candles is to breach the level for the sellers to get engaged in selling. Let us proceed to the next chart.

Concentrate on the chart. The chart has produced six candles since we have flipped over to the H4 chart. Six H4 candles mean a trading day is passed. Does it have any message to give us? We dig into the message later. Let us proceed to the next chart.

Wow! We have a breakout. Some traders may want to trigger an entry right after the candle closes. Let us find out what happens next.

The price starts heading towards the North. The price hits the Stop Loss. It even breaches the highest high of the wave. This is a different ball game now. If it were a technically right entry, we would not have talked about it. The thing is this one was a wrong entry, as the signal candle forms at the wrong time.

The signal candle does not form within the next trading day. It takes nine H4 candles to make the breakout. If the signal came within the first six candles, it would have been a valid trade. Since it comes at the ninth candle, it means the support has become daily support. Thus, an H4 breakout is not enough to drive the price towards the South. It goes towards the upside instead. The lesson we have learned here is, “A breakout is not a breakout if it does not take place at the right time.”

Categories
Forex Basic Strategies

Learning The Art Of Fading In Trading

What is Fading?

Fading involves placing trades against the trend to profit from a reversal. Using the concept of fading, a trader will short sell, expecting the momentum to fade when the market is in an uptrend. Likewise, he/she will buy a currency pair with the expectation that the move will fade away and reverse when the market is in a downtrend.

The fading strategy involves three assumptions:

  • The price is either at the overbought or oversold condition.
  • Early buyers or sellers are getting ready to take profits.
  • Current position holders might be at risk.

Overbought and oversold conditions can be identified using technical indicators such as the Relative Strength Index (RSI). Momentum shows the signs of shifting of forces from bulls to bears or vice-versa. And as these signs develop, current holders of the asset start to rethink their positions.

These conditions get exaggerated after an earnings announcement or news release. This may lead to a knee-jerk reaction on the part of other traders to sell the currency pair. As a result, this reaction gets overextended, and a mean-reversion takes place.

Now let us see how does the strategy work and what are the necessary steps you need to take to profit from the strategy:

The Fading strategy

Step 1 – Identify market extremes from the daily time frame 

The first step is identifying overbought and oversold zones using technical indicators or chart patterns.

The popular indicators used for identifying the zones include:

The overbought and oversold conditions are indicated by reading above or below a certain level. For example, the market is said to be in an overbought condition if the RSI is above 70, and it is said to be in oversold condition if the RSI is below 30. This can help traders in identifying fading opportunities.

In the above chart, we can see how the RSI indicator was crossing the normal range when the market gets into the overbought zone. One can find trading opportunities just using the RSI indicator stand-alone. But to trade like how professionals trade, we need to use a lot more tools.

Traders may also use familiar chart patterns or analysis based on price action and watching the price continuously.

Step 2 – Look for signs of capitulation

The second step in the strategy is to look for early signs of capitulation or change in the short-term trend using momentum. This can be mostly done by using candlestick patterns or price action with a volume indicator. We suggest looking for price action signals.

Some other signs to watch for include:

  • When technical indicators start to fade or move away from their extreme overbought or oversold levels.
  • The volume of the significant trend starts decreasing, or the volume of the opposite trend starts increasing.
  • Bearish candlestick patterns appear (in case of an uptrend), or critical support and resistance are broken.

It’s essential to identify these signs early to maximize profit and avoid mistakes.

The signs mentioned above can be explained better with the help of some figures.

Image 1

In the above image, we clearly see that the market is in an uptrend and has been trending from a few days (as it is a daily chart). The volume of the significant trend is also high with the decreasing volume of the sellers, which is a good sign for bulls. But in the end, the volume starts to decrease. The RSI declines sharply after entering the overbought zone for a while.

Image 2

Immediately we see an increase in the volume of sellers with a drastic drop in the RSI indicator (Image 2). The signs are getting stronger for a reversal, and this trend can continue. All the traders who are holding the currency pair start exiting the market. This could be one of the most reliable signs for us to take appropriate action.

Image 3

Finally, we see a break in the ‘support’ by the bears with high volume. Now we have combined all the tools, and each of them is indicating a reversal. Hence, we should take a position in the opposite direction. This is precisely the kind of setup that you need to be looking for every time.

Image 4

In order to find the exact entry, we need to magnify the chart. For this, you need to go on a lower time frame to analyze and set your stop-loss or target based on that time frame. This is mandatory for getting precise entries. The above figure is the lower time frame chart of the explained example.

Note: Images 1, 2 & 3 belong to the daily timeframe, whereas Image 4 belongs to the 4H timeframe.

Step 3 – Enter the trade with a stop-loss and take-profit

The last step is to enter the market with a compulsory stop-loss and take profit to ensure risk management is in place. In this strategy, a stop-loss order can be placed above the price where the RSI enters the overbought/oversold zone. Avoid putting small stop-loss as you can prematurely get stopped out from the trade.

Profit can be booked when the volume of your trend starts to decrease. Now, the stop-loss and target would be placed, as shown in the above chart. This trade would result in a risk-to-reward ratio of a minimum of 1:5. Traders can also use a moving average or any other indicator to set a profit-taking price level. Limit orders are almost used by all traders to avoid any slippage or other issues, particularly in less liquid assets.

Bottom line

Fading strategies can be considered as risky as you are going against the trend. It is always a good idea to take a trade if the risk to reward ratio is favorable. These strategies are commonly used by short to medium term traders to capitalize on short term reversals. Even though it seems risky, it can be extremely profitable if appropriately used. This is because the market has reached a saturation state, and there has to be some balancing force. This is why fading strategies are also known as contrarian strategies. Because they work on the assumption that prices deviating far from the trend, tend to reverse and revert back. That’s about Art Of Fading. If you have any queries, let us know in the comments below. Cheers.

Categories
Forex Basic Strategies

Even a Choppy Price Action Offers Entries

The market moves in three ways upward, downward, and sideways. In today’s lesson, we are going to demonstrate an example of a Rectangle breakout and an entry from a choppy price action. Let us have a look at the chart below.

The price action is choppy in this chart. Typically, traders avoid this kind of price movement. However, if we want to take trading as a full-time business, we are to widen our eyes. An entry can be found even in this market. Concentrate on the rectangle drawn here. After all these bounces, rejections the price finds its support and resistance within the rectangle.

The chart produces a bearish engulfing candle right at the resistance of the rectangle. This is a sign that something may happen. Let us assume a bearish move may occur. The first candle of the bearish trend looks good. A downside breakout with good momentum is the second thing that the sellers may wait to get.

The next candle comes out as a bearish candle followed by an Inside Bar. Things are getting better for the sellers. A bearish engulfing candle closing below the support would be the signal to go short for the sellers.

Here it is. The breakout candle is a bearish Marubozu candle. We may trigger a short entry right after the candle closes. Let us find out where we will set our Stop Loss.

Many traders may suggest setting the Stop Loss above the resistance of the rectangle and setting the Take Profit with the same distance. This is a good idea. However, we may set our stop-loss just above the resistance of the last consolidation. The reason is the price consolidates before making the breakout at the support. If the price made a breakout without the consolidation, we would have set our Stop Loss differently. By setting Stop Loss above the last consolidation’s resistance, we are to keep an eye with our Take Profit level.

We may set our Take Profit all the way down at the last swing low. The price may have kept going towards the major support. Look at the chart above. What do you think? The price is still very bearish but it produces a bullish reversal. That is too with a gap. The price action traders do not like price gaps. Considering the fact that we have set our Stop Loss as close as it can get, thus it may be the time to close our trade and come out with the profit.

The Bottom Line

Even a choppy market ends up producing an excellent trading signal. Our first choice shall be trending markets to look for entries. However, if we can spot out some entries from the choppy market, it would surely make us be more profitable.

Categories
Forex Price-Action Strategies

A Breakout and the Confirmation

Support and Resistance, also known as Supply and Demand, have long been used in the financial markets. The most characteristic feature of support/resistance is a level of support becomes resistance, and a level of resistance becomes support. The price after making a breakout comes back to the level and makes a move towards the established trend. The price does not always confirm all the breakout levels, though. Traders do not know which broken level is going to produce a trading signal. In reality, they do not even have to know or guess. They have to make decisions according to the price movement or Price Action. Let us have a demonstration of this.

The price is up trending. Traders shall look for long opportunities. To be honest, the last candle on the chart is a buy signal. It was a week ending candle, which must have held the buyers back. Let us wait for a while to get more clues.

The last candle came out as a bearish engulfing candle. Such price action usually makes a pair choppy. The buyers may want to wait for an upside breakout to go long. However, a bearish engulfing candle may not let that happen.

A strong bullish candle closes within the resistance. It seems that the chart may produce a Double Top. Thus, the bear may come and dominate. Let us draw the Neck Line and resistance of the Double Top.

The equation is very simple here. A breakout at the neckline attracts the sellers, which is more likely. On the other hand, an upside breakout attracts buyers. Let us find out which way the price heads to.

The price makes a breakout at the Neckline. However, it does not consolidate around the Neckline after the breakout. Unfortunately, the sellers do not get an opportunity to go short here. It often happens with the traders. Traders’ life is never easy!

Here is a question. Do you see anything interesting? Has the price made another breakout?

It has made a breakout at the red-marked level. It goes back to the level to confirm the breakout, as well. Moreover, it has produced a bearish engulfing candle with a long upper shadow. Things look good for the sellers. A breakout at the lowest low would be the signal to go short.

Here comes the breakout. A bearish Marubozu candle breached the lowest low. The sellers may want to trigger a short entry right after the last candle closes. Let us find out how far down it goes before producing any bullish reversal candle.

Here comes the breakout. A bearish Marubozu candle breached the lowest low. The sellers may want to trigger a short entry right after the last candle closes. Let us find out how far down it goes before producing any bullish reversal candle.

The price heads toward the downside with good bearish momentum. It produces a Doji Candle. It may be time to come out with a profit.

The Bottom Line

The price does not confirm all the breakouts. That does not mean we should start pulling our hair. Concentrate hard and calculate well. The next opportunity is just around the corner.

Categories
Forex Basic Strategies Forex Trading Strategies

What Should Know About Trading Ranges Using Support & Resistance?

What is Range trading?

It is said that the market only trends for 30% of the time. So it becomes necessary to have a range trading strategy to take advantage of the other 70% of the time. Range trading is not difficult, but it requires discipline and determination to make most out of it. When a market is trending, it forms a pattern of higher highs and higher lows, in case of an uptrend. The move, in this case, is really strong and is known as an impulsive move. The other type of movement is known as the corrective move, which comes in the form of a pullback. Impulsive moves are stronger than corrective moves.

When the market is making any such moves, it finds itself stuck between a high or low and continues to oscillate between these two points. It means buyers and sellers are equally strong, and this creates a very choppy environment.

Traders now trade these extremes and continue to trade until price breaks out on either of the sides. These two points act as potential support and resistance points, used by traders to place their orders.

In the above chart, we have drawn a few lines from where the market bounced off. The price action in those areas creates many trading opportunities. The instrument in the chart first trends down and then puts up a low (marked by line 1). Initially, you might think it as a downtrend and expect the pattern of lower lows and lower highs to continue.

Then you see the market rally to line 2, from where the market falls back to line 3 but does not fall till line 1. This highlights the fact that the market is no more trending. The market instead could be stuck in a range between line 1 and line 2. These are not ‘defined’ prices. Always consider them as zones with a margin of error both outside and inside the range. A trader will look to position himself/herself at these zones of support and resistance that forms the range.

Why support and resistance?

The price that is stuck between these two extremes has a lot of significance. This is because, at this point, the price can either Stop, Reverse, or Breakout. When you have the right knowledge, it will stop you from simply pushing the buttons and will make you trade with a defined strategy.

Range = Consolidation

A range is nothing but a price consolidation of the overall trend move. It could either end the current trend or cause a reversal. The different price behavior pattern in the range creates many trading opportunities, which can be traded by all types of traders, depending on their risk appetite. Now let’s discuss some important trading strategies using support and resistance of ranges.

Strategy Using Technical Indicators

Using technical indicators to trade can aid your trading strategy. Especially while trading ranges, many indicators can be a part of your trading plan. Here, we have used the Stochastic Indicator as a tool to trade the ranges.

In the above image, the two lines represent the support and resistance of the range formed. When the price reaches the resistance at point 1, the Stochastic enters the overbought area, and the slowdown in momentum is the confirmation signal for a sell. The resistance pushes the price back to support (point 2), but this time the momentum is very strong, hence no entry. The stochastic also does not enter the oversold area clearly. Next time the price goes to resistance with greater momentum, and the Stochastic too does not give an entry signal as it is not in the overbought area. This means one shouldn’t be going short at this point.

Overall, there is only one risk-free trade available in the above chart, and that is at point 1 (short).

Strategy Recap

Firstly, we should be able to see the price at one of the extremes. When that happens, the indicator should show either be at overbought or oversold conditions. The momentum of the price should be an important factor that determines our entry. If we see reversal patterns, this could be the best entry with a good risk to reward ratio. Do not forget to place protective stops much below or above the support and resistance levels, respectively. This will always protect your trades from a false breakout.

When not to buy at support and sell at resistance in ranges

You must have probably heard traders saying that more time a level is tested, the stronger it becomes. This is not true in the case of our range break-out strategy. You need to start paying attention to the price patterns at these ends. If the price has made multiple touches, it could be getting ready for a breakout in the direction of the higher time frame.

The above chart is an example of such a scenario. It shows a range, and at point 1, you can see the strength in the candle as price pushes towards the resistance area. The next push makes the price to consolidate at the extreme. It appears to be a battle between the bulls and bears. It is also making higher lows as a part of the uptrend. Hence a breakout after this point is not surprising.

You don’t want to see the higher lows at the resistance extreme and lower highs at the support extreme.

The resistance could still work, and a reversal could happen, but this type of price action does not give much confidence for shorts. Only aggressive traders may find some entry in that consolidation, for a potential long. They can put a protective stop below the higher low that was formed before the accumulation.

We hope you find this strategy informative. Let us know if you have any questions in the comments below. Cheers!

Categories
Forex Price-Action Strategies

Using Multiple Time Frames to Get Multiple Entries

We know using multiple time frames is an essential aspect of trading. Traders use the bigger time frame to find out the trend, breakout, vital support/resistance levels, and relatively smaller time frames to trigger an entry. In this lesson, we are going to learn how the trigger chart can be used as the analyzing chart to find out more entries.

This is a Daily chart, which is being used as the trigger chart. The weekly chart is used as the analyzing chart. It is a combination of Weekly-Daily. The price heads towards the North. Traders are to wait for the price to produce a bullish reversal candle.

A Spinning Top daily candle at a flipped support, the buyers have a lot to be optimistic here. One of the daily candles is to breach the daily resistance to go long on the pair. Let us draw the support and resistance on the chart to get a clearer picture.

This is how the chart looks like with support and resistance levels. If one of the daily candles breaches the resistance with good buying momentum, the daily traders are to trigger a long entry.

The next daily candle breaches the resistance. The buyer may take a long entry right after the breakout candle closes. An entry on the daily chart means that the trader shall leave the trade/chart for three to four trading days by setting Stop Loss and Take Profit.

However, if a trader uses the same daily chart as the trend-detecting chart and flips over to the H4 chart to find another entry, it surely would be more rewarding.

Let us flip over to the H4 chart.

Previously, the daily chart shows an upside breakout. Thus, the trend is bullish. The H4 chart shows that the price starts having consolidation. If the breakout level holds the H4 candles and makes an upside breakout, the H4 buyers are going to go long on the pair as well.

This is the H4 chart with the support and resistance of consolidation. The buyers must wait for an upside H4 breakout to go long on the pair. Let us proceed to the next chart.

Here it comes. An H4 bullish engulfing candle breaches the resistance. The H4 traders may want to trigger a long entry right after the candle closes.

The H4 chart shows the price may have consolidation again. The H4 buyers may want to cash in their profit. However, the entry, which is taken on the daily chart, traders are still to hold their positions until they get a bearish daily reversal candle.

At the end of the day, price action trading works very similarly on the Weekly, Daily, H4, and H1 chart. Today’s examples show that a Weekly-Daily combination offers an entry. After the daily breakout, the Daily-H4 combination offers an entry, as well. With a lot of practice, dedication, and hard work, a trader can trade both of them. This will surely beget more profit.

Categories
Forex Price-Action Strategies

What Is Rectangle and How to Trade on It

The price after making a strong bullish or bearish move, it makes correction/ consolidation. The price consolidates within two horizontal lines. In the financial market, this is called Rectangle. In today’s lesson, we are going to demonstrate some examples of the bullish and bearish rectangle.

Let us start with a bullish rectangle.

The price heads towards the upside with good bullish momentum. At the top, the price seems to start having consolidation. A buyer may want to keep an eye for an upside breakout to go long from here. However, the price continues to consolidate.

The price consolidates within two horizontal lines. We can draw a rectangle here since the price produces the rectangle after a bullish move, so it is called ‘Bullish Rectangle.’ Traders are to wait for a breakout to take an entry. A downside breakout offers a short entry, and an upside breakout offers a long entry. Let us find out which way the next breakout takes place and the price heads to.

The price makes a downside breakout and heads towards the South. At rectangle breakout, the price usually travels at least the same distance of the consolidation length. It seems the price travels 1.5X distance of the consolidation length here. Let us concentrate on the next chart below.

The price consolidates getting trapped within horizontal support and resistance. Do you find anything interesting here? Yes, we find another rectangle. This time it is a bearish rectangle. Let us draw those two lines here.

Again, traders must wait for a breakout to find out its next direction. The price has several bounces and rejections within those two horizontal lines. It is a bearish rectangle, but we know a breakout can take place either way. There is no point in guessing. Let us wait and find out.

The price makes a downside breakout and heads toward the South with good enough selling momentum.

We have demonstrated two examples here. The first one is a bullish rectangle where the price makes a downside breakout. The second one is a bearish rectangle, on which the price makes a downside breakout as well. Breakout direction does not depend on the bullish or bearish rectangle. Trader’s job is to wait for the breakout and breakout confirmation. Entry is to be taken only when the breakout is confirmed. We can spot rectangles almost in all the time frames. However, it is often seen on the H1, H4, and Daily charts. Have some practice on the demo account or do some backtesting to get well acquainted with the pattern to make green pips.

Categories
Forex Price Action

Price Action, Market Psychology, and Adjustment

Price action traders are to get clues from what the price has been doing. Horizontal Support/ Resistance, Trend Line Support/Resistance, Fibonacci Levels, Equidistant Channel along with Candlestick Pattern are price action trader’s main weapons. A trader must know how to use these tools as far as price action trading is concerned. Moreover, traders often need to adjust to marking levels, which are to be integrated with price action and market psychology. In today’s lesson, we are going to show an example of that.

The price has been heading towards the downside with strong bearish momentum. Ideally, traders are to look for short opportunities at upside pullback. See the first reversal candle. The candle closes within the support of the last bearish candle. Thus, the traders must wait to go short since the support holds the price. Let us see what happens next.

At the last candle, the price goes towards the downside but comes back within the support again. Equations are different now. Long lower shadow and proven support suggest that the traders may have to wait longer than they thought.

As expected, the price consolidates on choppy price action, which makes traders wait. Traders find horizontal support. Let us draw it.

The price obeys the support level several times. However, do not forget that the price had a strong rejection. This is where traders may need to make an adjustment.


The price has been heading towards the adjusted support. Risk-Reward does not look right here. It is better to wait for either a downside breakout or a bullish reversal to go long. Let us see what happens next.


We have a bullish reversal here. A bullish engulfing candle right at the support level suggests that the traders may have to look for long opportunities here. The question is, shall we take an entry right after the last candle closes or not. The answer is ‘No”. We have to wait for an upside breakout. Can you guess where the breakout level is? Think for a minute, and then proceed to the chart below.

The price has been obeying a down-trending Trend line producing a Descending Triangle. Thus, the breakout at the Trend line resistance is a signal to go long here. All the buyers need here a breakout by a bullish Marubozu candle.

Here comes the breakout that the price action traders shall wait for. The buyers may trigger a long entry right after the breakout candle closes. Stop Loss is to be set below the horizontal support. Let us find out how it proceeds.

The price heads towards the North and provides 1:1 Risk-Reward. So far here, it seems that it is having consolidation. Some traders may want to come out with their profit. Some may shift their Stop Loss at the breakeven and take some profit out targeting to go all the way towards the swing high. This depends on how a trader wants to manage his trade. With these above charts and examples, we have realized the importance of adjustment in marking support/resistance.


Categories
Forex Price-Action Strategies

Breakout by a Single Candle Generate More Impetus

Breakout is one of the most important factors in trading. Attributes of a breakout give clues with what traders can manage their opened position to make more profit. Price action traders, in particular, love to compute the attributes of a breakout to determine their take profit level.

In this section, we are going to demonstrate an example of a single candle breakout and its impact afterwards. Have a look at the chart below.

The price finds support at the red market level and heads towards the North. The price action suggests that the buyers are going to control the pair. A downward correction/consolidation followed by a bullish reversal candle at a value zone is what they need to wait for. Let us find out what happens next.

The price seems to have started having a pullback. The first corrective candle comes out as an Inside Bar, which is a good sign for the buyers. The buyers wait for the price to come back at a level of support with a reasonable distance from the resistance. Let us see how far it comes up to.

The price has crossed a good distance from resistance. The buyers are to wait for a bullish reversal candle. Ideally, a bullish engulfing candle is the first choice for the buyers. Other candles such as Inside bar, Spinning Top do the job as well, but an engulfing candle’s signal attracts more traders, and it brings more liquidity. Let us see what happens next.

Price action traders dream of such a reversal candle. This is not only a bullish engulfing candle but also an engulfing candle, which breaches the highest high of the last wave. Let us draw the consolidation zone on the chart.

The reversal candle makes the breakout with good momentum. A trader shall trigger a buy entry shall right after the candle closes. When a reversal candle itself makes a breakout, it makes the fore coming move go towards the trend’s direction with good momentum. Look at the chart below.

Look at the pace of the bullish move after the breakout. Here is another very important factor that traders must remember. A single candle breakout usually offers a 1:2 risk-reward ratio. This means traders shall add some extra pips with their profit target when they get such price action. The drama remains. Have a look at the chart below.

The price makes a correction and seems to have found support again. It suggests that the buyers are still in control. Smart buyers take their Partial profit and let the rest of the trade run to earn more pips.

As mentioned, breakout attributes give clues about the trend’s strength. Eventually, this helps traders manage their trade nicely and make more money out of trading.

Categories
Forex Price-Action Strategies

Trade What You See on the Chart

Price Action traders are to look at a chart and make a trading decision according to that. They have to understand the language of it, which reflects the psychology of the market. In today’s lesson, we are going to demonstrate the importance of trading according to the chart’s price movement.

On 17.10.2019, the AUD did well against its counterparts in almost all the pairs. However, in AUDNZD, the AUD did not do well. It rather had a bad day against the NZD. On the day, the AUD was strong against other currencies, but why did it underperform against the NZD?

To start with, let us have a look at the H1-AUDUSD chart.

After finding the support at the red-marked line, the price heads towards the upside. It consolidates and continues the move towards the trend. The daily candle closes with a strong bullish tone, barely having an upper shadow. Let us have a closer look at the consolidation.

The first reversal candle is bearish. However, it closes within the wick of the last candle, which is a Spinning Top. The price finds support, and after producing an engulfing bullish candle breaching the resistance, it continues its bullish journey.

As mentioned earlier, the AUD was weak against the NZD. Let us now have a look at the H1-AUDNZD chart.

Look at the chart, the price heads towards the North (up arrowed) and comes down. You can assume how the daily candle would look like for that day. In the end, it makes a breakout at the support level and makes a new lower low. Things are completely different here with the AUD. Do you spot out the difference? Let us investigate on the chart.

The price heads towards the North as it does in other pairs. However, look at the first reversal candle (arrowed). This is a bearish engulfing candle. When the consolidation starts with such a candle, the minor time frames’ sellers shall keep their eyes to go short. This often makes a chart look choppy. Even after producing a good bullish reversal candle, the price does not make a breakout at the resistance. It rather comes down and gets choppy. After some hours, this is what happens.

A Double Top and breakout at the neckline drive the price towards the South. The consolidation followed by the breakout at the support makes the price bearish on the following day. We now understand the reason, despite having a good day, the AUD did not do well against the NZD.

To sum up, traders must understand the chart, price action, candlestick formation, and trade according to those to be consistent in making a profit.

Categories
Forex Price Action

Equidistant Channel Trading: What Else to Consider?

Equidistant Channel is a very reliable trading tool for the price action traders. In an ascending Equidistant Channel, the buyers wait for the price to come at the support level and to get a bullish reversal candle to go long. It is vice versa, in the case of a descending channel. However, some other equations are to be taken care of by the traders when trading with an Equidistant Channel. In today’s lesson, this is what we are going to demonstrate. Let us get started.

The chart above shows that the price is caught within an ascending Equidistant Channel. Look at the last bearish wave. After a rejection, the price heads towards the support. As a trader, we shall wait for a bullish reversal candle to go long here. Let us proceed to find out what happens next.

Wow! The price action traders always dream of this. This is one good bullish reversal candle. A bullish engulfing candle right at the channel’s support, the buyers, shall jump into the pair to start buying. However, we must set stop loss, take profit. Stop Loss level looks very evident here, which will be below the signal candle (Bullish Engulfing Candle here). What is about the Take Profit level? Where shall we set it? Typically, we set it at the upper band of the channel since the price usually goes towards the resistance of the channel after having a bounce at the support level.

Look at the chart. At the last wave, the price produced a bearish engulfing candle right at a strong horizontal resistance (arrowed). It had a rejection at this level earlier, as well. Thus, this is a level, which must be counted at the time of setting Take Profit level.

Despite having an engulfing daily candle, the price does not head towards the North with a good buying pressure. Anyway, it heads towards the upside. Look at the rejection. This means setting our take profit at the horizontal resistance would give us 1:1 risk and reward ratio here. This is not bad. However, if we make a target to go all the way towards the upper band, it may get us a loss instead.

Let us see how the price action acts afterward.

We would not make a loss here, but see how the price action has been. It gets choppy. It may still offer more long entries since the support is held by the price. However, we know what else is to look for, a breakout at a significant level of horizontal resistance.

Key Points to Remember in Equidistant Channel trading:

  1. A significant level of horizontal support/resistance is to be broken.
  2. If there is no horizontal support/resistance, an anti-trend line is to be broken.
  3. The signal candle is to be a strong trend reversal candle.
  4. In the case of having horizontal support/resistance in the middle of a channel, at least the Risk-Reward ratio is to be 1:1.
Categories
Forex Price Action

Retracement, Consolidation, Breakout, and Price-Action Trading

In the financial market, there is a saying, “Trend is your friend.” When the price makes a strong move towards a direction breaching a significant level of support/resistance, traders start looking for opportunities to take entries. The word ‘opportunity’ signifies a lot. After making a strong move, the price usually makes a correction/consolidation. At the correction/consolidation, the price finds a level of support/resistance. This is what gives a good risk-reward ratio to traders. In the end, it brings more winning trades, as well. In this lesson, we are going to demonstrate how a retracement gives us an entry.

The price produces a Double Bottom and breaches the neckline level. The buyers are to look for opportunities to go long on the chart. Look at the last two bearish candles. The price seems to have started having a correction. The last candle closes within the support. We might as well get a buying opportunity here. A bullish reversal candle at this level shall attract the buyers to go long. Let us see what happens next.

A bullish engulfing candle is produced here, which is considered the most powerful reversal candle. We have been eyeing to buy. Make a decision. What shall you do? Are you going to click the “Buy” button? Hang on. You must consider an equation before going long here. Look at the chart below.

The bullish reversal candle is produced at a level of support where the price had its last bounce. This is consolidation where the price is caught in a range. Thus, until the price makes a breakout at the resistance, we must not buy. Let us look at the chart below to find out what happens next.

The price comes out from the consolidation zone by making a downside breakout. It seems that the price is going to have a long retracement. Honestly, it appears that the buyers may not get the opportunities to go long. The price has been heading towards the South by making an ABC pattern, and the bullish trend is about to collapse. A down-trending Trend Line works as a resistance as well. Then, this is what happens.

We have a massive bullish engulfing candle at the level where the price has had several bounces. This is the candle, you may click the “Buy” button, right after it closes. A question shall be raised here that we do not take the long entry at the first bullish engulfing candle, but we do it now. What is the reason behind that? Before answering the question, look at the chart below.

The signal candle this time makes a breakout at the down-trending Trend line. This means along with a strong bullish reversal candle, we get a breakout as well. This is what makes the price action traders click the “Buy’ button this time. Let us have a look at the chart how it looks after clicking the “Buy” button.

It looks good. The price heads towards the North with good buying pressure. This is what we love to see. However, this does not come as easy as it sounds. The first bullish engulfing candle does not offer us entry, but this one does. The reason is it makes a breakout. We need to have a lot of practice, study, and research to be well acquainted with consolidation, correction, reversal, and breakout. Stay tuned to get more lessons on these topics.


Categories
Forex Price Action

An Entry Derived from a Double Bottom

The Double Bottom is one of the strongest bullish reversal patterns that price action traders wait for once they see the price may have found a support zone. On a strong downtrend, the first bounce does not attract the buyers to go long. On the second bounce, however, it attracts the buyers to start looking for long opportunities. In today’s lesson, we are going to demonstrate an example of how a Double Bottom offered us an entry.

What do you think about the price action here? A choppy price action where the price gets caught within a horizontal range. It is best to avoid taking entries when the price action is like this. You may have noticed that the price has several bounces on the support and rejections on the resistance. To get a clearer picture, look at the chart below.

The price has a rejection of the resistance and a bounce on the support. The price goes up again; it had a rejection and a bounce on the same level. This means we may get a Double Top or a Double Bottom here. The chances are the same. Thus, we must wait for the price to make the decision.


Here it goes. An upside breakout takes place here. A Double Bottom and  Breached Neckline, a perfect buying meadow. Do we start buying from here? No, we must wait for a confirmation. A pullback and another bullish move are needed to go long. See what happens next.

It seems like we may not get an opportunity to trigger an entry here. The price continues to go towards the North. Do not get into a trap. Never jump into a running train. Keep patience. See what happens next.

Here it goes. Finally, the price starts having a correction. Look at the last H4 bearish candle closing obeying the level where the price on minor time frames has bounces. It is time to wait for a bullish reversal candle. Is it going to be the very next candle or do we have to wait longer?

It is the very next candle that signals us that it is the time to trigger a long entry. The candle closes above the consolidation resistance having a tiny upper shadow. A perfect signal candle that the buyers have been waiting for.

The price heads towards the North with good buying pressure. 1:1 Risk and reward is easily achieved here. Such a nice price action this is! I have a question to you though. Do you see any other potential buying opportunity here? If you do, write on the comment box what the price action would be like if it is to offer another long entry. I am looking forward to getting your comments.

Categories
Forex Price Action

Support and Resistance

Support and Resistance

One of the fundamentals of Technical Analysis is the theory and methodology of support and resistance. In a odd turn of events, some of the most advanced methods of identifying support and resistance are not only relatively unknown, but they are some of the original Technical Analysis theories. Some of those methods include identifying support and resistance according to naturally squared numbers, numbers related to an angular nature in Gann’s tools, harmonic ratios, pivots, Fibonacci levels, and other more esoteric methods. For this article, though, the focus is on identifying support and resistance based on prior traded price levels and ranges**.


What are Support and Resistance?

When you hear the word’s support and resistance, the definitions of those words may be the first thing that comes to your mind. Support indicates that something will assist or strengthen while resistance indicates rejection. In Technical Analysis, support means a level that is below the price, and resistance is above price.

The image above shows resistance as a red band and support as a green band. It’s important to understand that support and resistance on a candlestick chart should never be viewed as a static and exact price level. With a chart style that has such dynamic time and price levels, like Japanese candlesticks, support and resistance are an area or range of value. Determining the support and resistance levels requires a ‘zoomed’ out view of the chart. When you get a broader view of the past price action, you can see price levels where price has moved lower and then reversed higher (support) as well as price levels where price move higher and then reversed lower (resistance). The most important levels are those that show past resistance becoming support and vice-a-versa.

Prior Support turned into Future Resistance


Use another chart style to find support and resistance

Renko Chart

While it may seem simple to find support and resistance on a candlestick chart, there are some alternatives. The length of the wicks and body of candlesticks can vary and can add to the confusion. Using a Renko (above) chart simplifies the process of finding support and resistance by reducing the noise on the chart and providing less ambiguity when looking for highs and lows. Take note of how these resistance and support levels are drawn on a price-action-only chart. With a price action only chart, I don’t draw a value area like I would on a candlestick chart. But if you are not comfortable using a price-action-only chart and want to stick to a candlestick chart, then another trick that might help is to remove the wicks from the candlesticks. Look at the side by side comparison below.

Wicks VS No Wicks

Both charts display a weekly chart of the CADCHF pair. On the left, we have a regular candlestick chart with wicks – wicks that are all over the place. The chart on the right is the same as on the left, but with no wicks displayed. You can see how much more clear the tops and bottoms are on the right. This can make it a little easier to spot support and resistance levels.


** It is the view of this author that past support and resistance levels are inefficient for today’s markets. However, the method discussed in this article is part of a foundation of learning that can be applied to future price level analysis.

Categories
Forex Chart Basics

Ideas that can be Blended with Candlestick to Trigger Entries-Part 3

In Part 2, we learned how important a breakout is for taking an entry. Even the strongest reversal candle itself is not enough to create a new trend. In this article, we are going to learn other steps that we need to maintain for taking an entry in case of engulfing candlestick.

Let us have a look at the chart below.

After producing the engulfing candle,

  1. The price breached through a support level.
  2. The breakout candle looks very strong.

First two equations have been met. Shall we take the entry right now? The answer is “NO”. We must wait for an upward correction/consolidation. A correction/consolidation gives us another level of support/resistance (in this case resistance). It offers a better risk and reward ratio as well as a better winning percentage. Thus, correction/consolidation is considered one of the most vital components of trading.

Let us have a look at how consolidation took place here.

Pay attention to those candles after the breakout. The pair produced one more bearish candle. Many traders may think an opportunity missed here. Look at the very next candle. That came as a Doji Candle followed by a bullish one. Be very careful. The market often keeps having a correction and changes the trend even by making new higher highs. Thus, a bearish reversal candle we must wait for.

We got one and luckily, it was a bearish engulfing candle. Candle Stick Pattern is being used here again to show us selling sign. What do we have to do now?

We have to wait for another breakout. This time we have to flip over to our Trigger Chart. This is an H4 chart. Thus, our trigger chart is H1 Chart. Let us flip over to the H1 Chart.

The price came out with the last candle from the consolidation zone. A Marubozu Bearish Candle made the breakout. A less low spike indicates that the sellers are very confident. Look, Candle Stick Pattern is being used here again. Here we go. This is the point where we trigger out short (sell) entry.

Let us have a look at the chart below how our trade would play.

Wow, it played well. Though it had consolidation on the minor time frames later, however, this should not be our concern. We followed our trading chart’s trend, breakout, consolidation (H4) and the H1 breakout. By setting our Stop Loss and Take Profit, we shall forget the entry. This is another thing of trading called “Set and Forget” that need to be integrated.

In this article, we learned these are the things to be integrated as well.

  1. Consolidation/ Correction on the trading chart.
  2. Reversal candle to be formed on the trading chart.
  3. Flipping over to the trigger chart and waiting for a breakout.

In the next article, we are going to demonstrate an example of how a Morning Star offered us entry with the integration of consolidation, breakout, and breakout candle with a Morning Star. Stay tuned.

Categories
Forex Candlesticks

Ideas that can be Blended with Candlestick to Trigger Entries-Part 1

Candlesticks are considered one of the strongest components to take an entry. However, this is not the only thing that a trader shall consider before taking an entry. An Engulfing Candle or a Pin Bar is a strong reversal candle. If the price is down-trending and we get a bullish engulfing candle, we may want to go long on the pair. No doubt, a bullish engulfing candle is a strong reversal candle, but there are other factors we must consider before taking an entry.

Let us find more about it from the charts below.

I have chosen a chart which was down-trending and produced a Bullish Pin Bar. The price then changed its direction and headed toward the North. Let us have a look at the chart.

The arrowed candle is one good-looking bullish Pin Bar. A Pin Bar like this attracts the buyers to go long. We see the consequence; the price headed towards the North with good buying pressure. Does this mean whenever we see a Bullish Pin Bar, we go long or vice versa? The answer is no. We must consider other factors such as Support/Resistance zone, Double Top/Bottom, Neckline Breakout, Trend Line breakout, Breakout Candle.

Let us have a look at the chart again.

See where the Pin Bar was formed. It was formed right at a zone where the price had several bounces. Ideally, this is a level where the sellers want to come out with their profit. Thus, a strong bullish reversal candle such as a Bullish Pin Bar shall attract the buyers to concentrate on the chart to go long. Now that we have found a strong support level what else to look for?

The price was down-trending by following a Trend Line. Can you spot that?

Have a look at this.

A down-trending Trend Line can be drawn. Buyers must wait for a breakout there. See the breakout candle. That was a strong bullish candle which was followed by another one. Moreover, the price came back and touched the Trend line after the breakout. Many buyers may have taken their entry there. This is not a bad idea. You may want to go long right after the second candle closes.

However, some buyers may want to go long at the neckline breakout. Have a look at the chart below.

To be very safe, some traders love to set a pending buy order and go long above the neckline level. It is a safer option for sure, but it has some disadvantages as well. We will talk about this later. Meanwhile, concentrate on what we have learned from this article.

  1. Candlestick or Candlestick pattern is to be formed at a value area.
  2. The existent trend is to be collapsed.
  3. Double Bottom or Double Top is to be evident.
  4. Breakout Candle is to be a strong commanding candle.


Categories
Forex Market Analysis

June 25 – Quick Technical Update on S&P500 & Gold

The U.S. stocks sank during a broad sell-off on Monday, with the S&P 500 dropping over 1.5 %. In particular, the technology companies bearing the strength of an escalating trade dispute between the U.S.  and different leading economies.


The U.S. Treasury was drafting curbs that may block companies with a minimum of 25% Chinese possession from purchasing  U.S. technology companies. In response, the dollar plunged to a two-week low against the yen as a rise in the global trade worries depressed investor risk appetites and turned down U.S. yields.


S&P 500 – Daily Outlook

The U.S. stock market index SPX is trading at 2709.02, down 45.25 points and 1.67%. S&P500 is facing a strong support near 2700 after falling 1.59% today. We can expect a pullback above 2700, whereas the violation of this level will lead SPX -1.66% towards 2685.


S&P500- Intraday Support & Resistance Levels 

Support     Resistance 

2745.54      2769.84

2738.04      2777.34

2725.89      2789.49

Key Trading Level:    2757.69


Gold – XAU/USD – Daily Outlook

The precious metal gold is trading bearish at 1267.57, down -0.17% on Monday. Technically, Gold is trading sideways with a lower range of 1264 – 1271. The breakout of this range will define the further trend of gold. The breakout above 1271 can lead gold prices towards 1275 while a breakout below 1265 will open further room for buying until 1261.


Gold- Intraday Support & Resistance Levels 

Support     Resistance 

1271.5     1273.64

1270.84    1274.3

1269.77    1275.37

Key Trading Level:    1272.57

That’s pretty much it for now. Investors are advised to monitor the U.S. CB Consumer Confidence in order to capture further movements in the dollar index, gold, and the U.S. stocks.