Bollinger Bands
Bollinger Bands are a type of volatility oscillator created by the great technical analyst John Bollinger. If this is your first time seeing this indicator, it probably looks both daunting, confusing, and somewhat silly. But it is a powerful tool for trading and identifying when prices are contracting and then when they finally breakout. There are some critical components of Bollinger Bands.
- The middle line is just a moving average, by default, a 20 SMA.
- The lines above and below the middle line are the volatility bands, observe how the ‘bubble’ gets expands as price moves up or down in a significant fashion.
- Most important is what is called the ‘Squeeze’ or a ‘Bollinger Squeeze.’ The Squeeze signifies decreased volatility and is evident when the bubble gets smaller, and the lines become very close. Squeezes are extremely important to watch.
Let’s look at a chart and see these concepts.
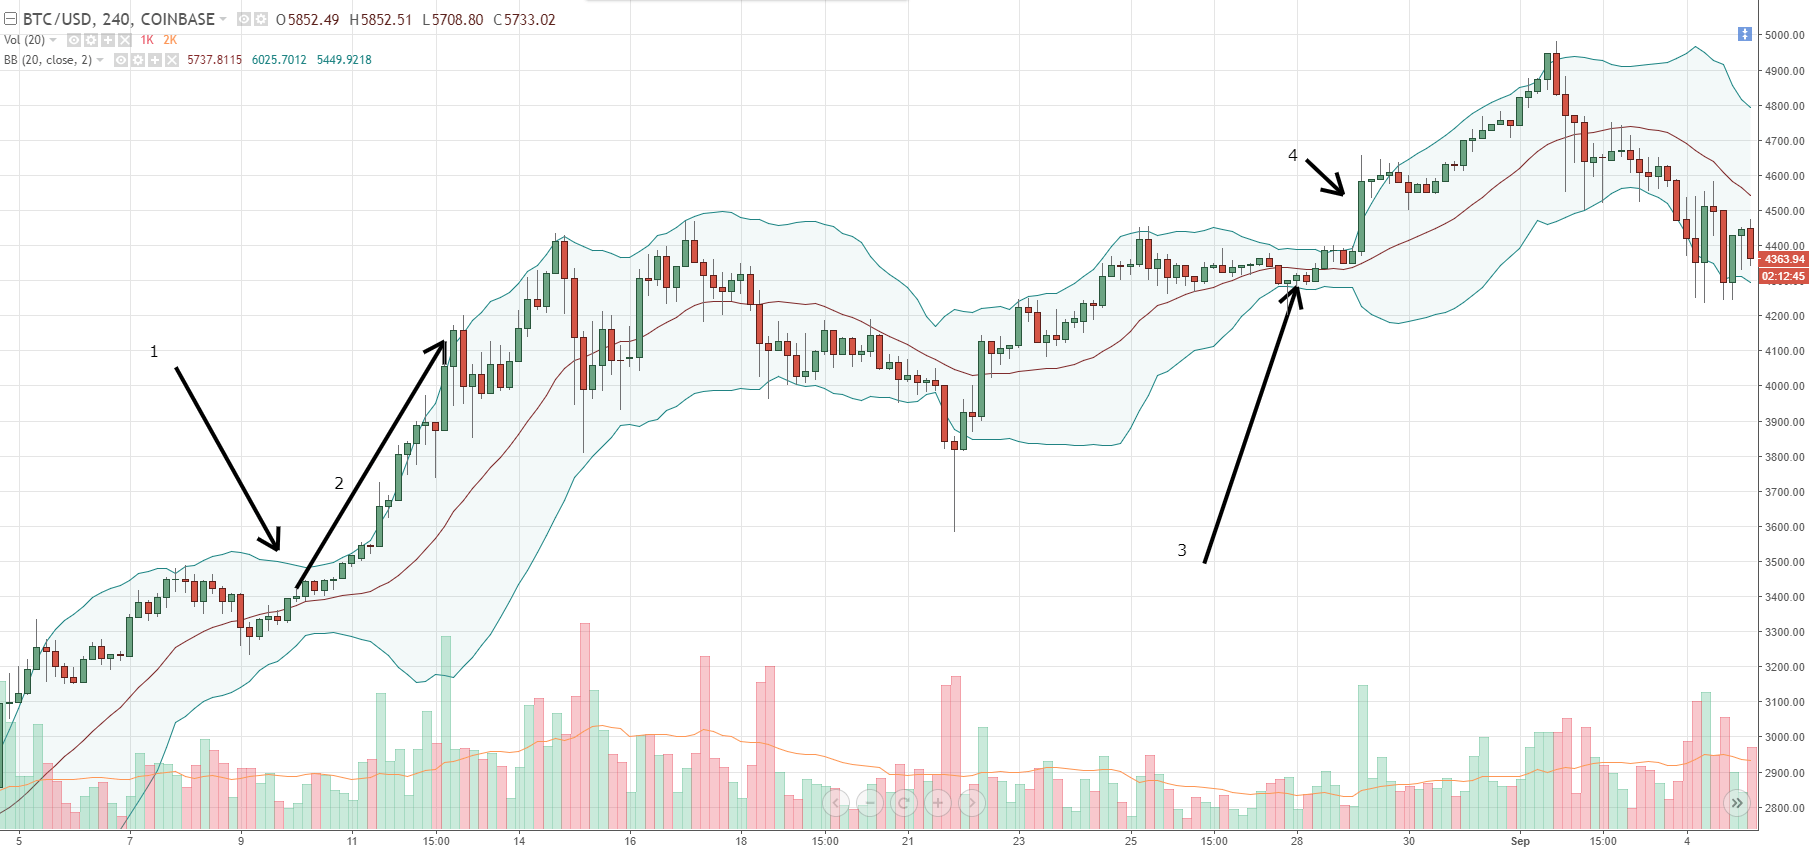
- Notice the bands contracting, ‘squeezing’ into each other.
- Notice the release, price is continuously pushing higher against the bands, and the bubble is expanding.
- Again, notice how price begins to consolidate and form another squeeze.
- The release after the squeeze.
Top touches do not mean “sell”, and bottom touches do not mean “buy”
Too often, new traders view indicators and oscillators with certain upper and lower boundaries as conditions to trade to the contrary. Bollinger Bands are no exception. People often assume, incorrectly, that when prices touch the upper band, then the price is somehow ‘oversold,’ and then a short trade should be taken. The inverse is true with bottom band touches.
In reality, prices will often ‘walk’ the bands. You should look at any instrument and see how often prices will trend higher by piercing and riding the bands higher or lower. This frequently occurs after both the upper and lower bands converge closer together, and the space between them constricts. This pattern is known as ‘The Squeeze.’
The Squeeze
Mr. Bollinger himself wrote that The Squeeze was a condition that created more questions than any other component in his Bollinger Band system. At the beginning of this article, I mentioned that Bollinger Bands are a volatility indicator – that is precisely what the upper and lower bands represent. When volatility increases, the bands expand and move farther away from one another. When volatility decreases, that is when we see the bands constrict, forming The Squeeze. Squeezes always precede increased volatility, and squeezes always occur after a period of significant volatility – a classic chicken or the egg problem. Regardless of which happens first, The Squeeze should be recognized as an opportunity to identify when a future explosive move may occur.
One should observe the direction of the breakout almost with suspicion. You will often find many false breakouts occur where price begins to trade in one direction at the beginning of a squeeze, only to reverse and start trending in the opposite direction. There are many ways to filter and interpret which breakouts are genuine and which are false – but that is for a lesson for another time.
Key Points
- Bollinger Bands are a measure of volatility.
- Price touching the upper or lower bands does not mean an automatic inverse trading move.
- Price will often ride the bands in a trend.
- Squeezes present opportunities.