When you’ve made up your mind to participate in trading, you should focus on conducting a comprehensive and in-depth study of how your trading systems work. Yeah, I’m pretty heavy on this algorithmic trading and ratios But really, in the end, this is just evidence of whether what you’re going to apply works or whether you should throw it away and not make your money go away foolishly. In other words, you need to learn how to statistically and objectively evaluate the performance of your trading systems.
As you know, mathematical statistics provide you with a variety of tools that will allow you to correctly evaluate the results of a trading strategy or system. One of these tools is the SQN (System Quality Number) ratio.
The SQN ratio was created by Van K. Tharp, in 2008 in his book The Definitive Guide to Position Sizing, to evaluate or measure the performance of a trading strategy or system. Then some variations in use have emerged such as the market regime indicator, obtaining optimal parameters that simultaneously maximize the average size of the operation, and the standard deviation of results in a sample space of N operations.
The SQN ratio measures the ratio between the average (expectation) and the standard deviation of the profit distribution generated by a trading system. Van Tharp recommends that the number of N trading system trades be at least 100, the more exchanges the better.
The mathematical formula for calculating the SQN is quite simple and is described below:
SQN= (EM/DT)* N
Where,
N: Number of system operations.
EM: Mathematical hope of the system in terms of R (Expectation or Average Benefit).
DT: Standard or standard deviation of multiples of R.
The first thing we must have clarified is the concept of R. R is the difference between your entry price and the initial stop loss, that is, the initial risk. Then all gains and losses are expressed as multiples of R.
The expectation of the trading system can also be defined as the average of the trading system’s R multiples (negative and positive).
How to calculate the expectation, the expected profit, and the SQN ratio according to the value of R.
Suppose our trading system has given us these results:
N° Operations / Buy $ / Stop $ / Value R / Sale $ / Result /Operation $ / Multiples R
- 1 40 30 10 70 30 1,5
- 2 50 40 10 75 25 1,25
- 3 55 45 10 45 -10 -0,5
- 4 160 150 10 145 -15 -0,75
- 5 125 115 10 140 15 0,75
- 6 85 75 10 105 20 1
- 7 165 155 10 155 -10 -0,5
- 8 125 115 10 135 10 0,5
- 9 115 105 10 137,5 22,5 1,125
- 10 75 65 10 65 -10 -0,5
Based on our results we can obtain the following data:
- % of winning trades: 60%
- % of losing trades: 40%
- Winning Trades Sum: 245
- Sum of losing trades: 90
- Average R: 0.775
- Standard deviation of R: 1.73
In the Van Tharp model the hope (E) of the system is defined as the average of the n multiples of R, therefore, in our example:
System hope: 0.775
The hope of the trading system allows us to calculate the profit we can expect from our system in X number of trades, using the formula:
Expected profit = Hope * Number of transactions * value of R
Knowing the standard deviation of R, we can finally calculate the SQN ratio.
SQN=(0.775/1.73)* 10=1.42
Now we take the same example above, but instead of 10 operations, we will assume that the results were obtained based on 100 operations. The SQN ratio would be as follows:
SQN=(0.775/1.73)* 100=4.49
Once you know how to calculate the SQN ratio, we have one task that is no less important: how to interpret the values obtained? Are they good or bad?
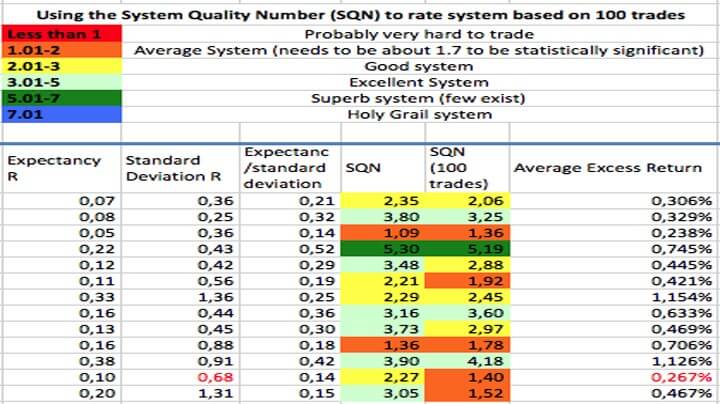
In order to assess whether our trading system is profitable or not, Van Tharp proposes the following scale:
- 1.6 – 1.9 Good. Below average, but you can trade
- 2.0 – 2.4 On average
- 2.5 – 2.9 Okay, OK.
- 3.0 – 5.0 Excellent.
- 5.1 – 6.9 Brutal.
Summarizing the table above, a system is considered good when the SQN ratio is greater than 2 and excellent if it is greater than 3.
It is important to take into account when calculating the SQN ratio that when the trading system does not have a fixed loss stop, the value of R can be estimated as the average loss of the trading sequence, provided that this average is sufficiently representative. From there we can see the distribution of multiples of R (standard deviation) and also calculate the expectation as the average of multiples of R.
SQN ratio a parameter optimizer.
Once we know how to calculate the SQN ratio and determine whether our trading system is good or not based on this ratio, the following question arises: Can I increase the value of the SQN ratio? How to do it the best way?
If we analyze the formula to calculate the SQN ratio, we can quickly realize that there are 3 parameters that we can adjust to increase this ratio:
3.1. Improve the average benefit.
To perform one of the most common ways to increase the average profit is to filter operations for fewer operations, but higher quality. Less trading also means less commission.
3.2. Reduce the dispersion of results around the mean.
This can be achieved by reducing loss stops and taking winnings. In this way, we get the results concentrated as close as possible to the average.
3.3. Increase the number of operations.
By making N as big as possible, we can also improve the robustness of our trading system and the statistical data we get from our system becomes more reliable. In addition, the profit curve becomes smoother and more continuous. Increasing the number of operations also allows us to have a broader picture of the behavior of our strategy in different time frames. It’s basically what I usually comment on in videos about having greater statistical relevance. The SQN ratio, therefore, favours systems with a longer operating history.
Conclusion
This measure developed by Van Tharp allows us to objectively evaluate the performance of our trading systems. With the SQN ratio, you can also optimize the parameters of your system to make it more robust. Although I am not a fan of optimization as you already know, especially when we look for robustness. But this is another topic. In my case, I use it only in evaluating my systems and it is not among my favorites, but I find it very useful.