Categories
Crypto Market Analysis

Daily Crypto Update 25.05.2018 – Prior Support Now Resistance Ahead


General Overview 


Daily Crypto News Updates
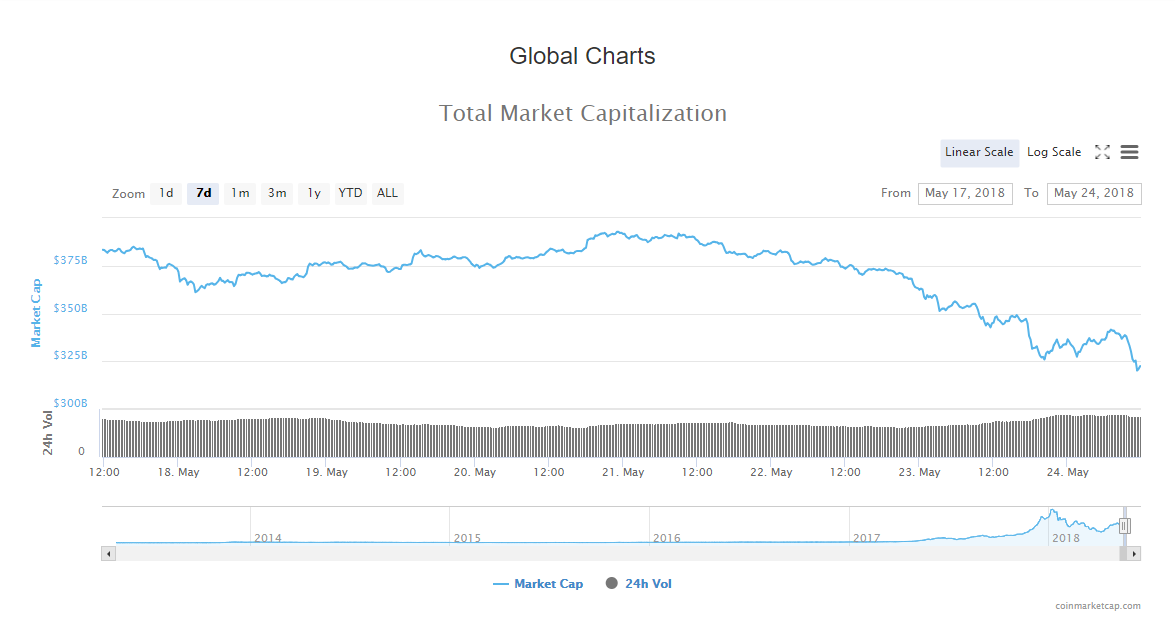
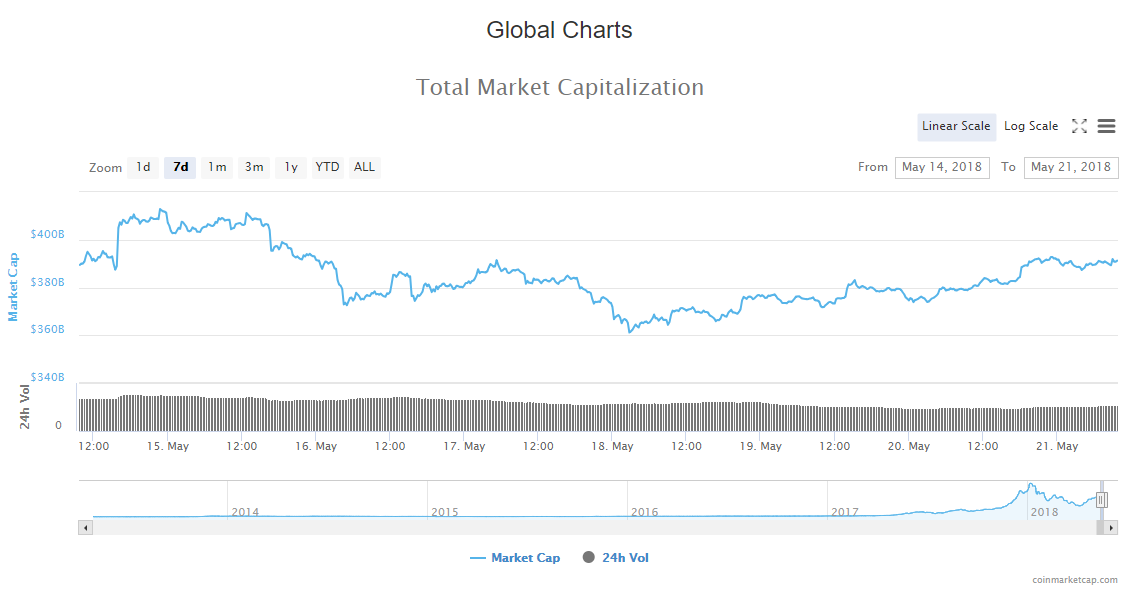
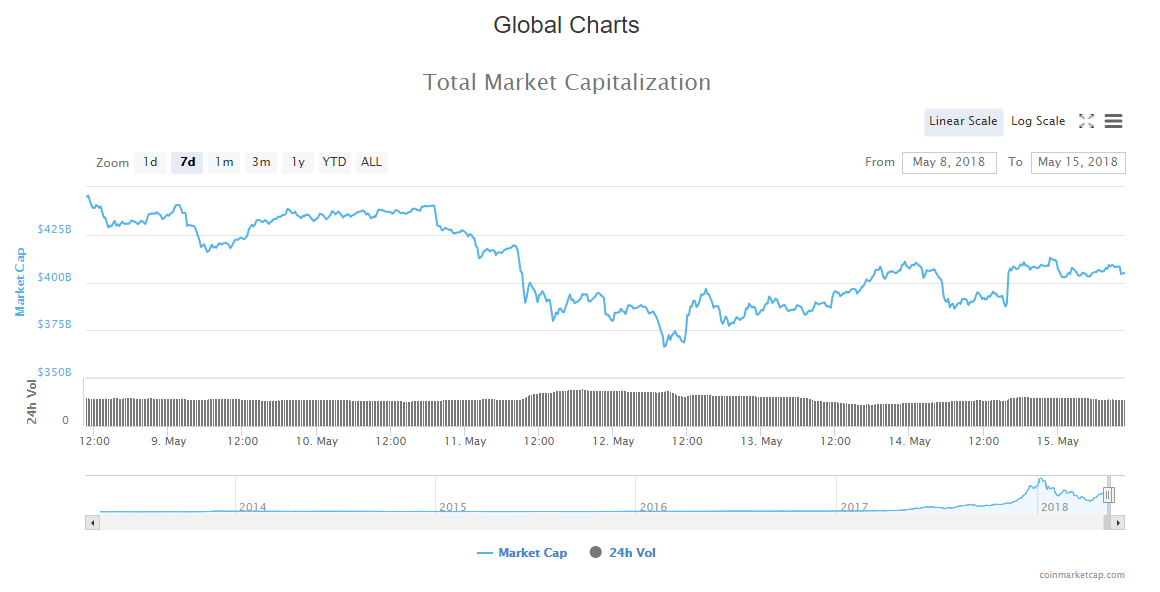
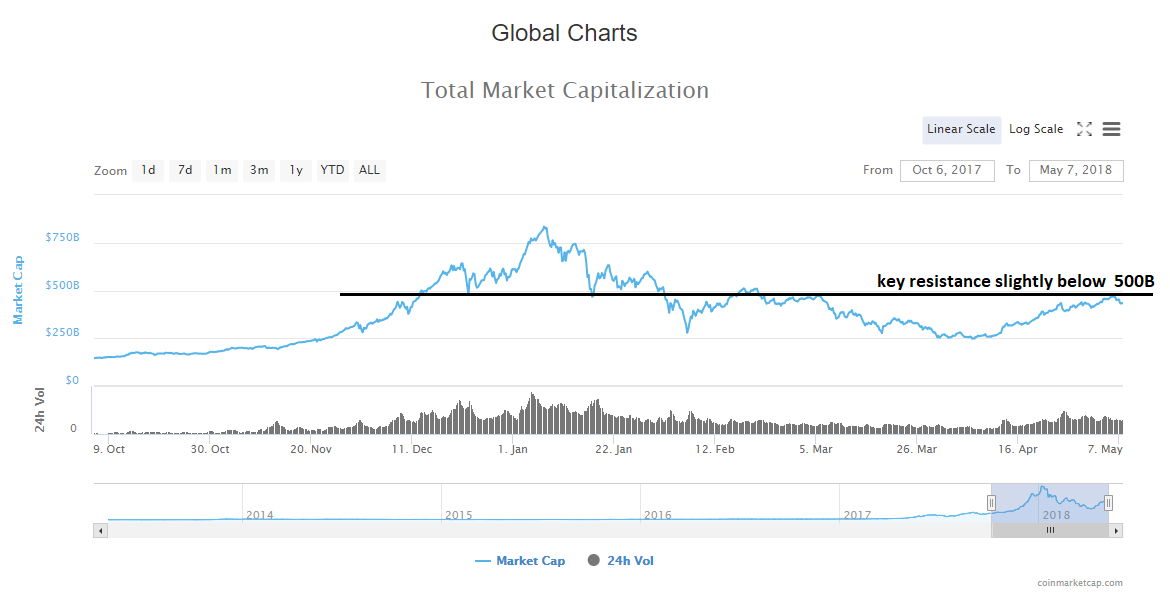
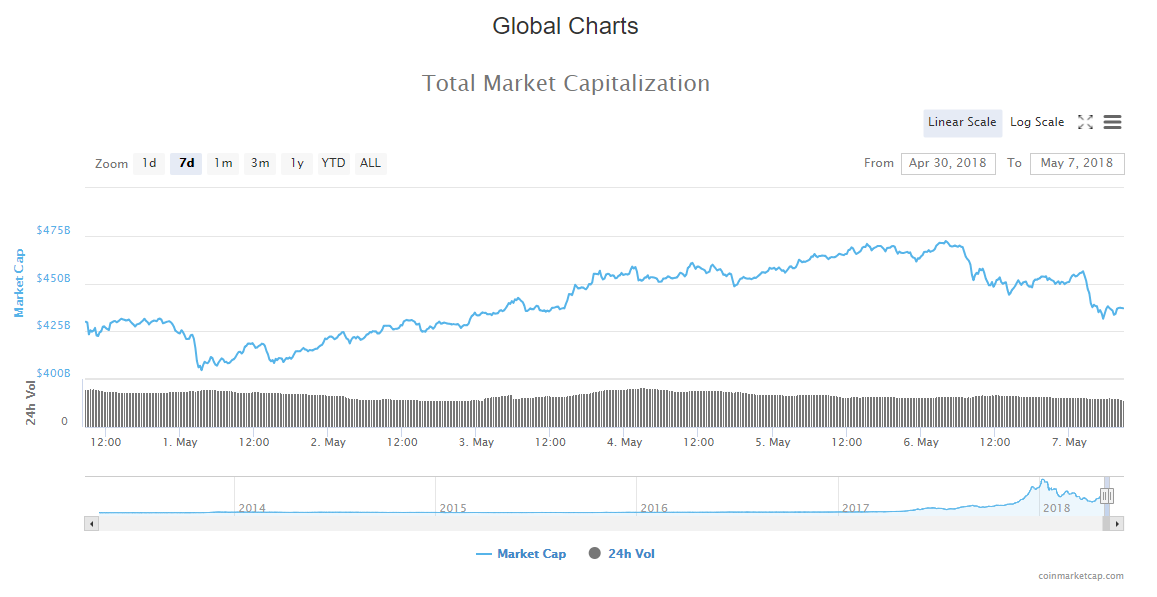
   Market Cap: $334,350,848,700 
      24h Vol: $18,412,644,843 
BTC Dominance: 38.2%

In the last 24 hours, market capitalisation has been rising, from yesterdays low at 320,1B to 342,74B and then fell back to 332,666B where it is currently sitting.
Daily Crypto News

The market is in green, with biggest gainers among top 100: Mixin +24%, CyberMiles 16%, Bitcoin Private 21%, Eos 11.6%.


Daily Crypto News 


Top stories that came out in the last 24 hours are the following:

German Bank and Steel Conglomerate Execute Forex Transaction via Blockchain

German bank Commerzbank and steel company Thyssenkrupp have completed a €500,000 pilot transaction of a forex (FX) forward on a blockchain, reported Cointelegraph auf Deutsch May 24.

Singapore Fires Compliance Warning at 8 Crypto Exchanges, Orders an ICO to Halt Sales

Singapore’s central bank said today, May 24, that it had issued a warning to eight cryptocurrency exchanges over securities compliance and ordered an ICO to stop issuing tokens.

Russia’s Largest Bank to Pilot First Official ICO

Russian bank Sberbank CIB and the National Settlement Depository (NRD) will pilot the country’s first official Initial Coin Offering (ICO) using the Bank of Russia’s regulatory sandbox, ForkLog reports today, May 24.

South Africa’s Central Bank Calls Crypto ‘Cyber-Tokens’, Not Currency

The South African Reserve Bank, the central bank of the Republic, has chosen to call digital currencies “cyber-tokens” because they “don’t meet the requirements of money,” Bloomberg reported May 24.

Source: cointelegraph.com


Analysis


BTC/USD 

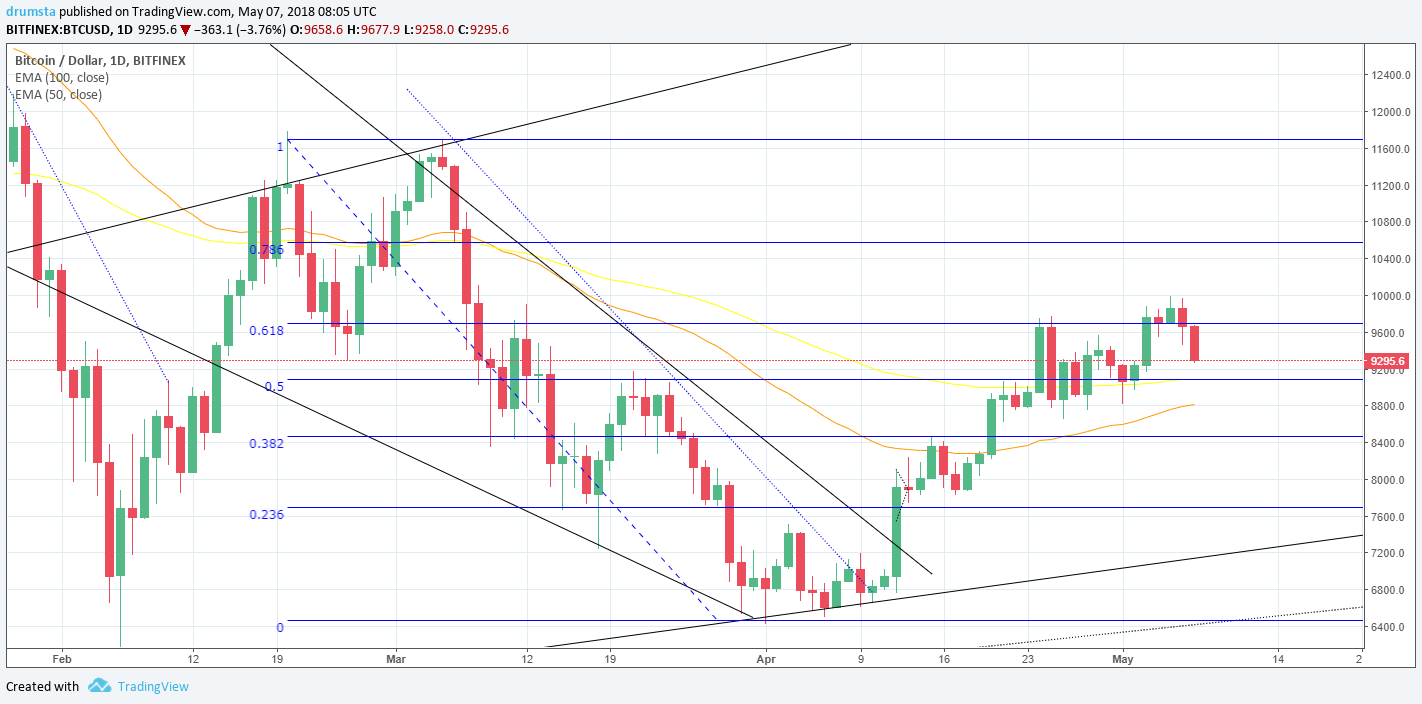
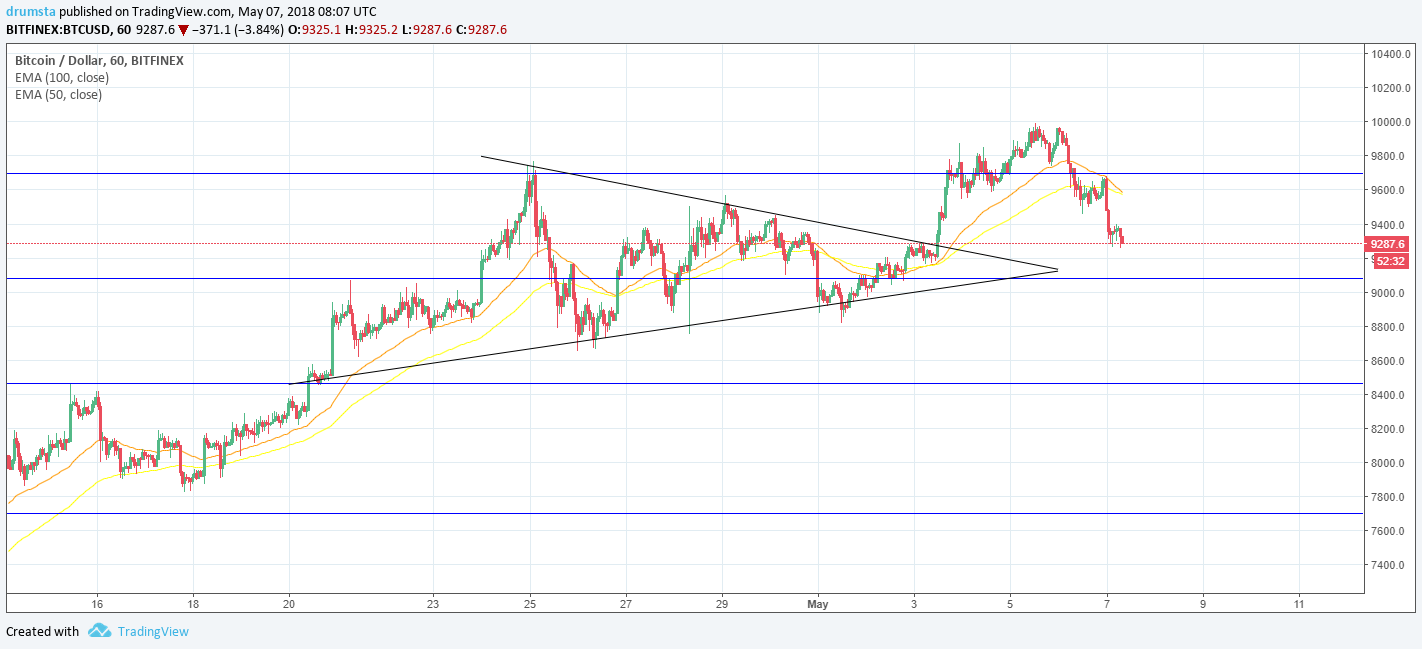
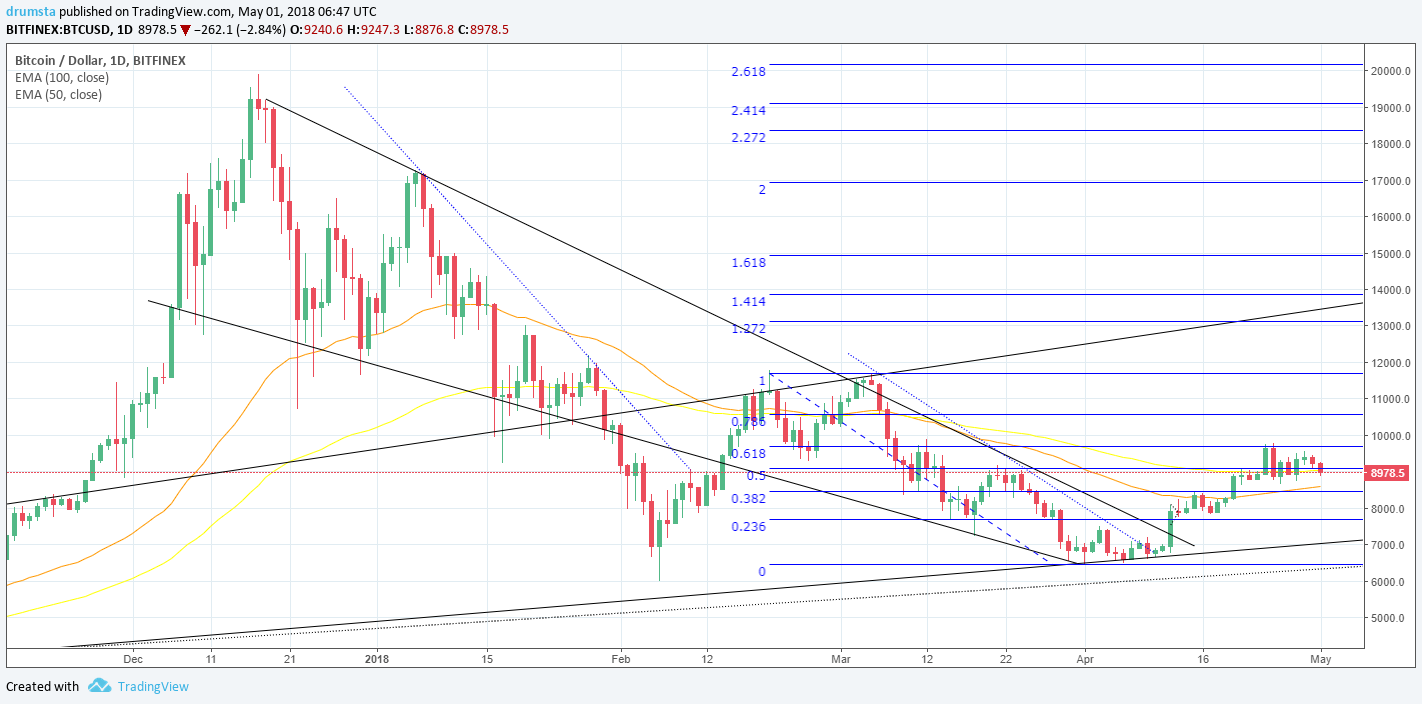
From yesterday’s open, the price of Bitcoin has decreased by 0.8% coming from 7574$ to 7510$ where it is currently.


Looking at the daily chart, we can see that support baseline was respected and that yesterday’s candle closed above the support line, leaving a wick below it. Today’s candle is red and its back on the levels of yesterdays opening, as the price is retesting the support.


Zooming into the hourly chart, we can see the interaction with the baseline support. The price bounced quickly but was repealed by the wedge support line which now serves as resistance.
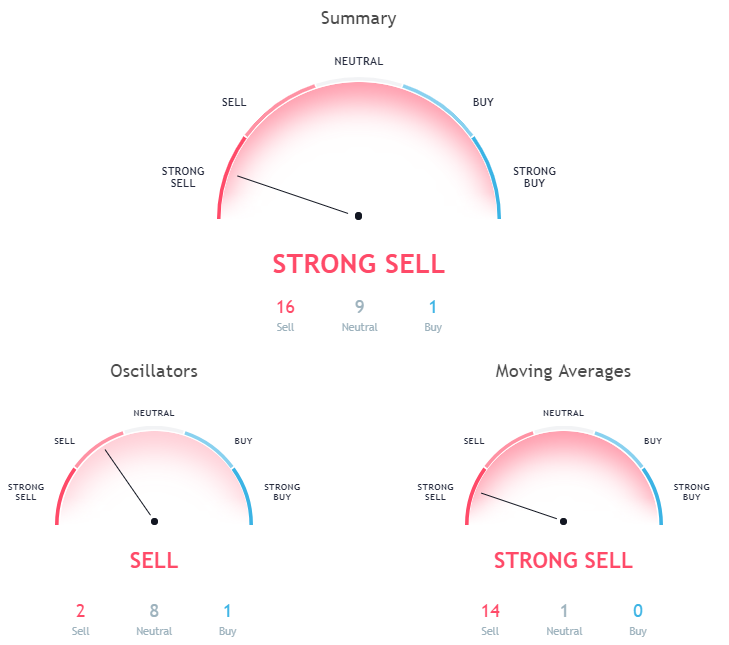
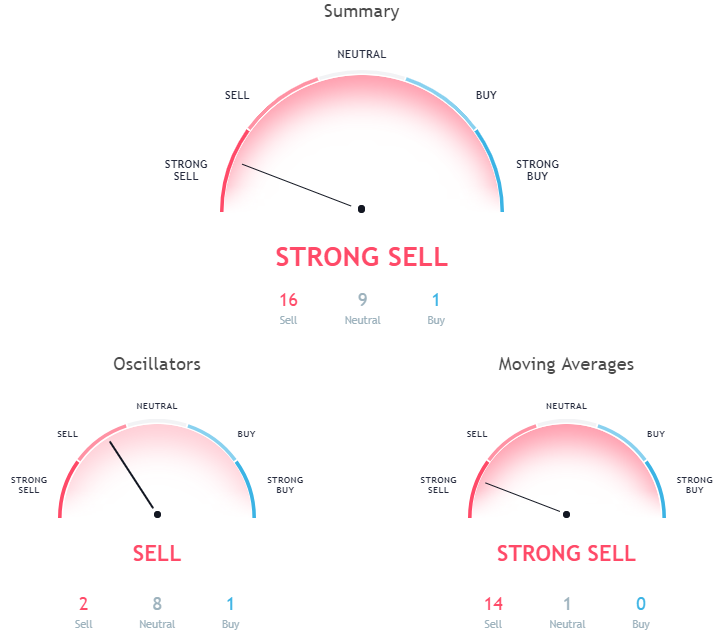
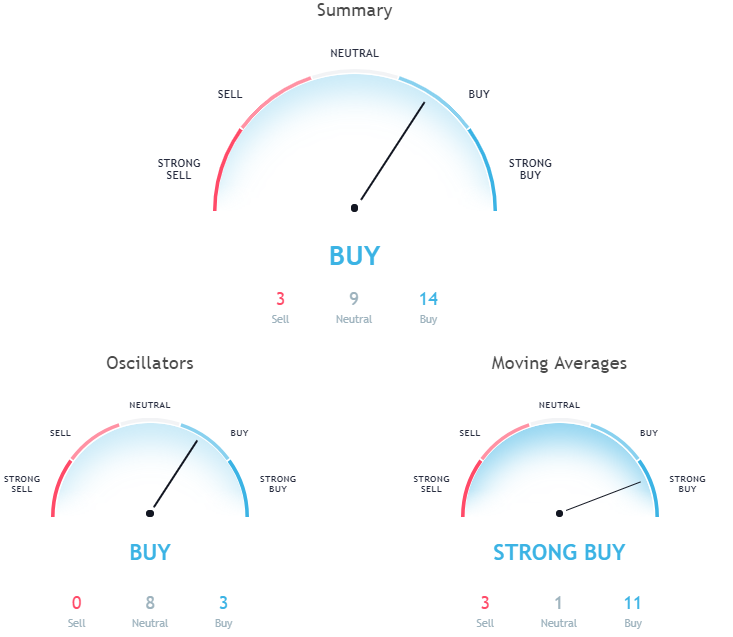

Market sentiment

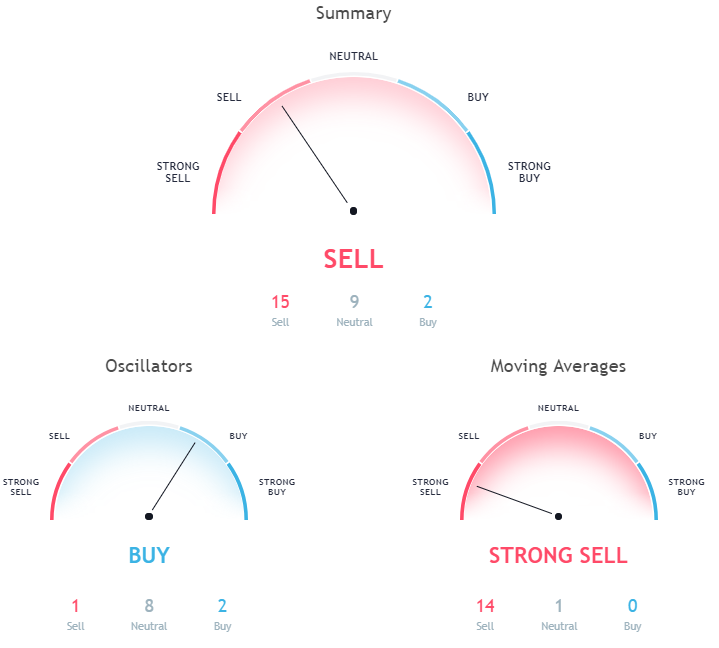
  • Bitcoin hourly chart technicals signal a sell.
  • Oscillators are neutral, and moving averages signal a sell.

Pivot points 

S3 6582.5 
S2 7052.3 
S1 7314.5 
 P 7522.2 
R1 7784.4 
R2 7992.0 
R3 8461.8
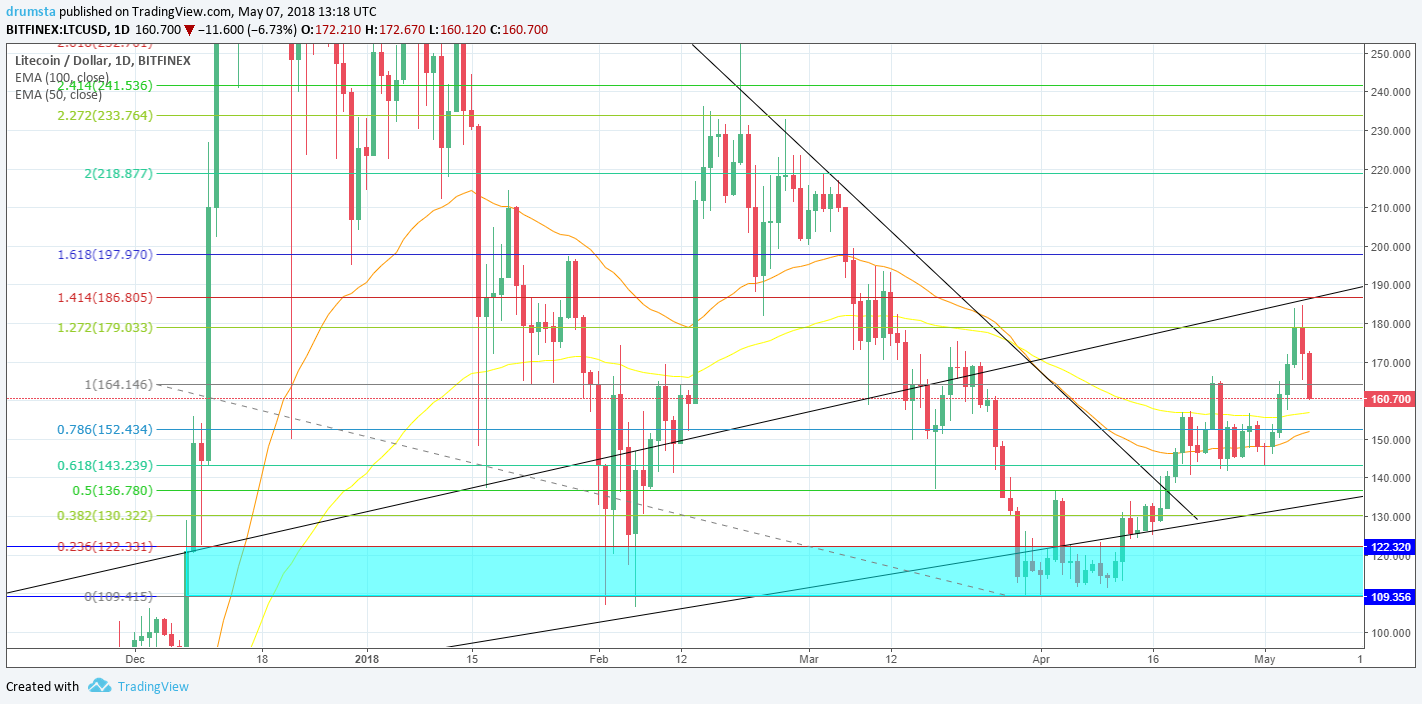
ETH/USD

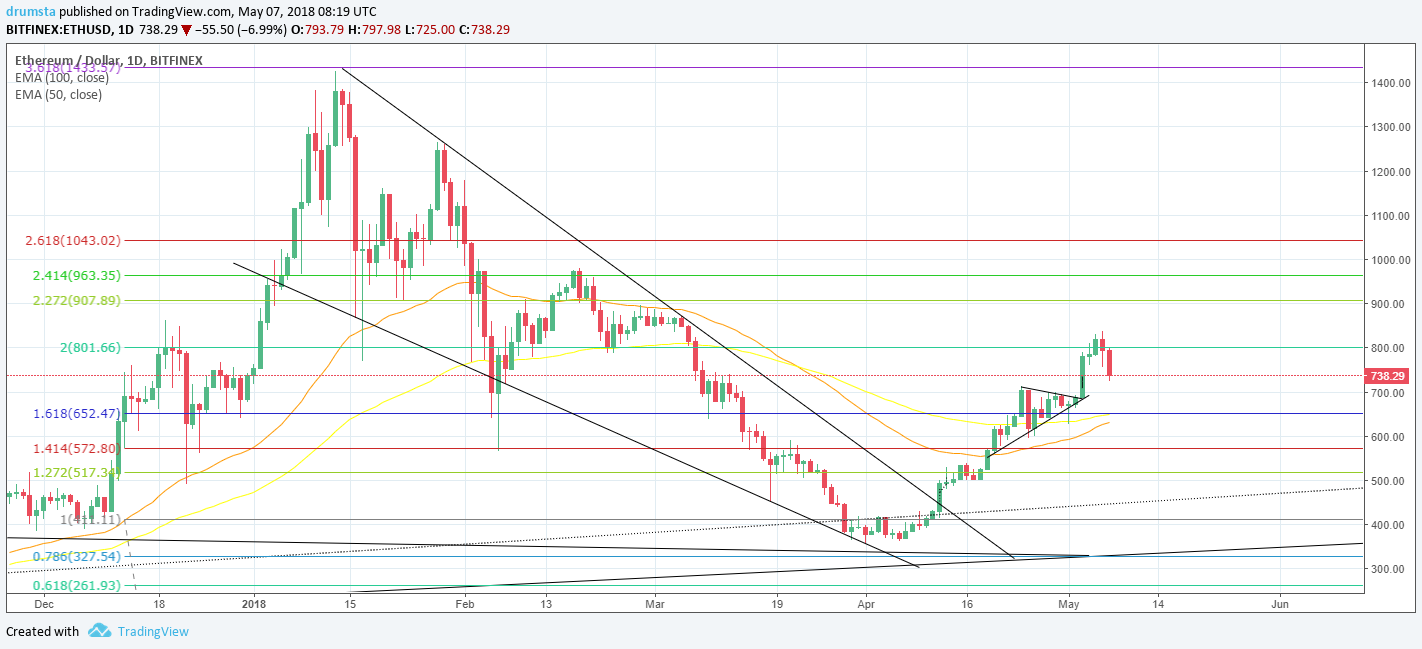
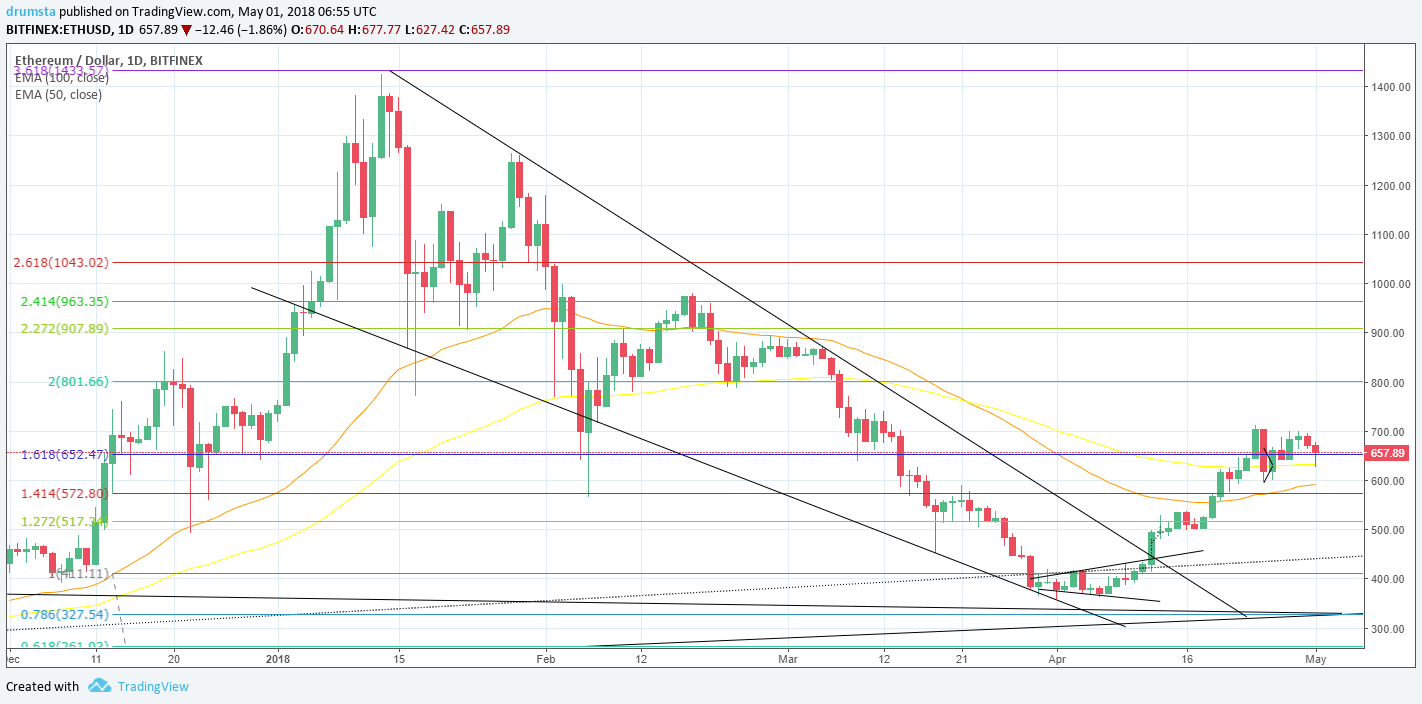
From yesterday’s open the price of Ethereum has increased by 3.34% coming from 588$ to 605$ where it is currently.


Looking at the daily chart, we can see that after the price spiked down to the first support, it went back up above the 0.382 Fibonacci level and is currently a doji candle with wicks from both sides. As you can see the current candle’s high is at the levels of a prior range support which now serves as resistance.


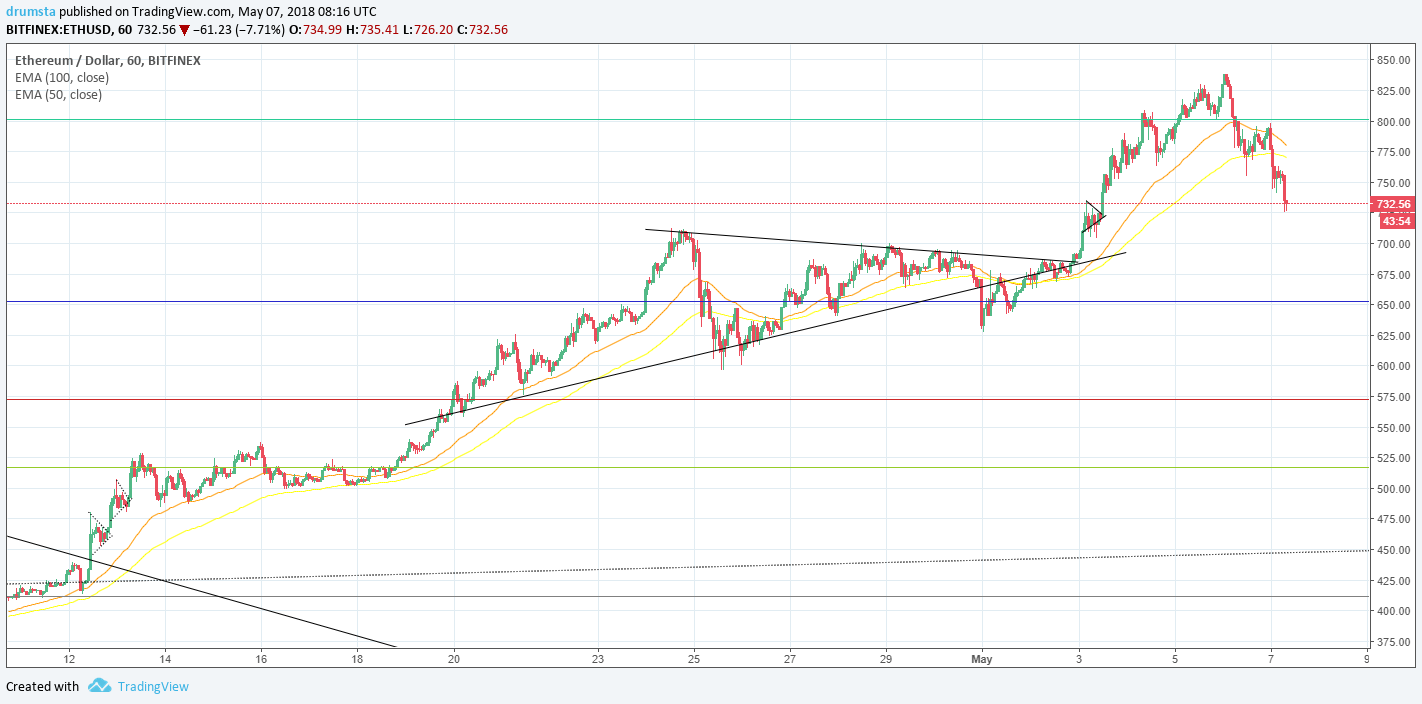
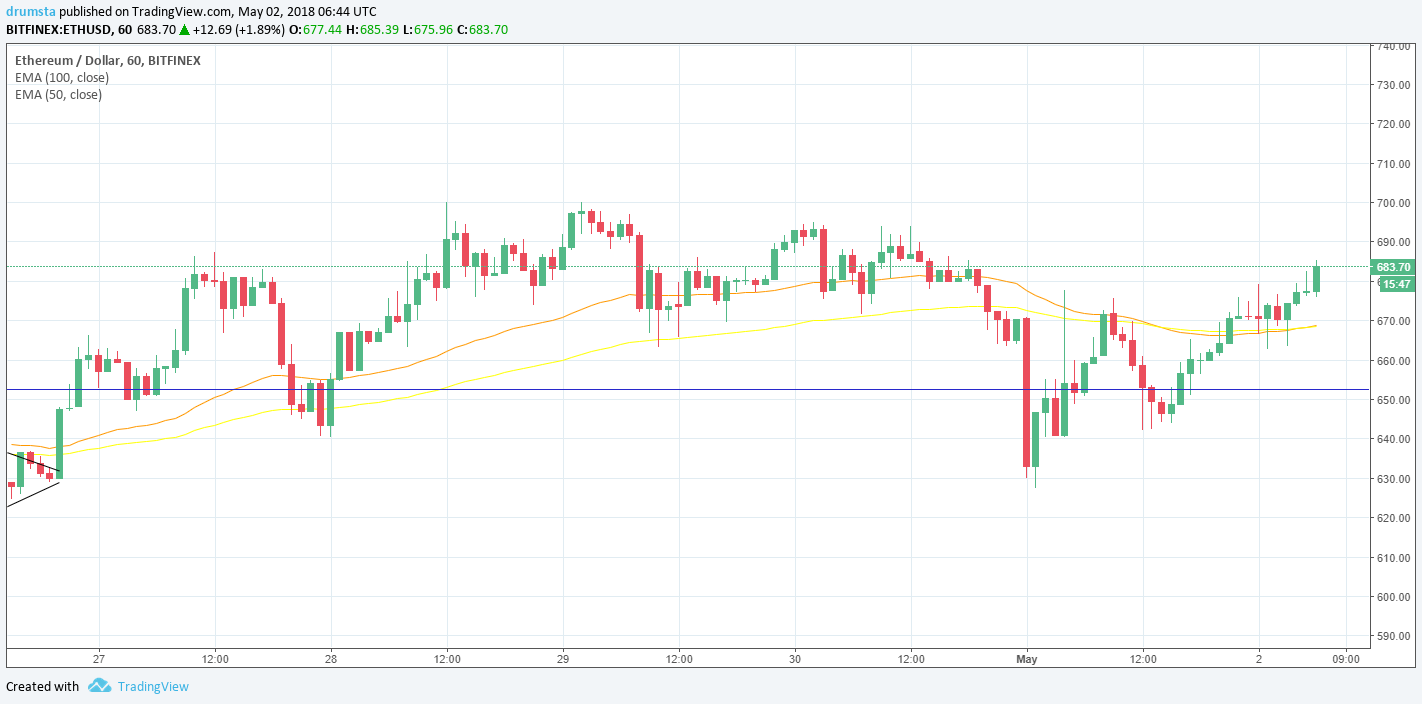
Zooming into an hourly chart we can see the interaction with the support line, and that even on the hourly chart there was a quick spike down. We can see some sideways movement as the price action is bouncing up and down between the range in which it is currently.
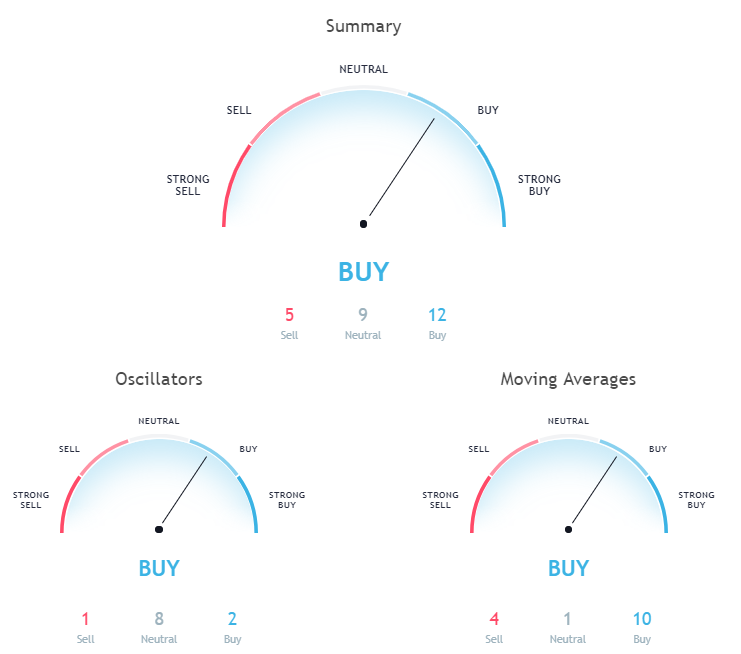
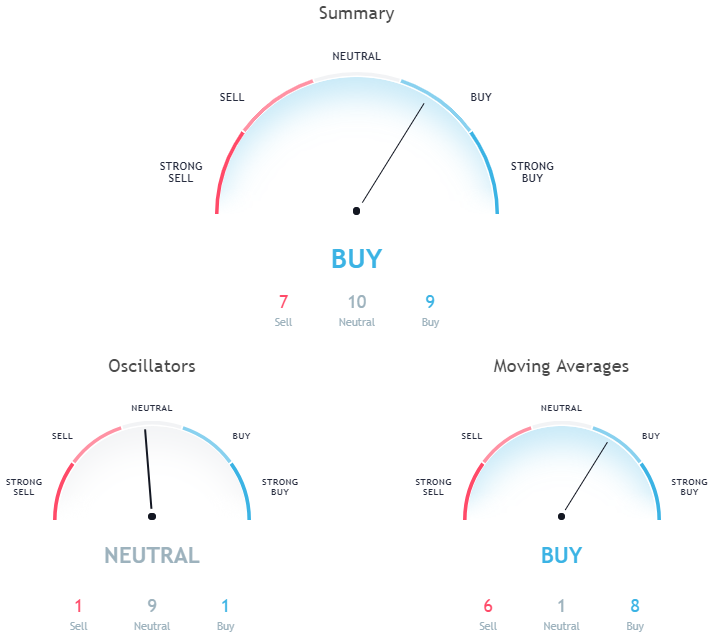

Market sentiment

  • Ethereum hourly chart technicals signal a buy.
  • Oscillators are on buy, and moving averages are signalling a buy.

Pivot points

S3 443.64 
S2 513.55 
S1 558.03
 P 583.46 
R1 627.94 
R2 653.37 
R3 723.28
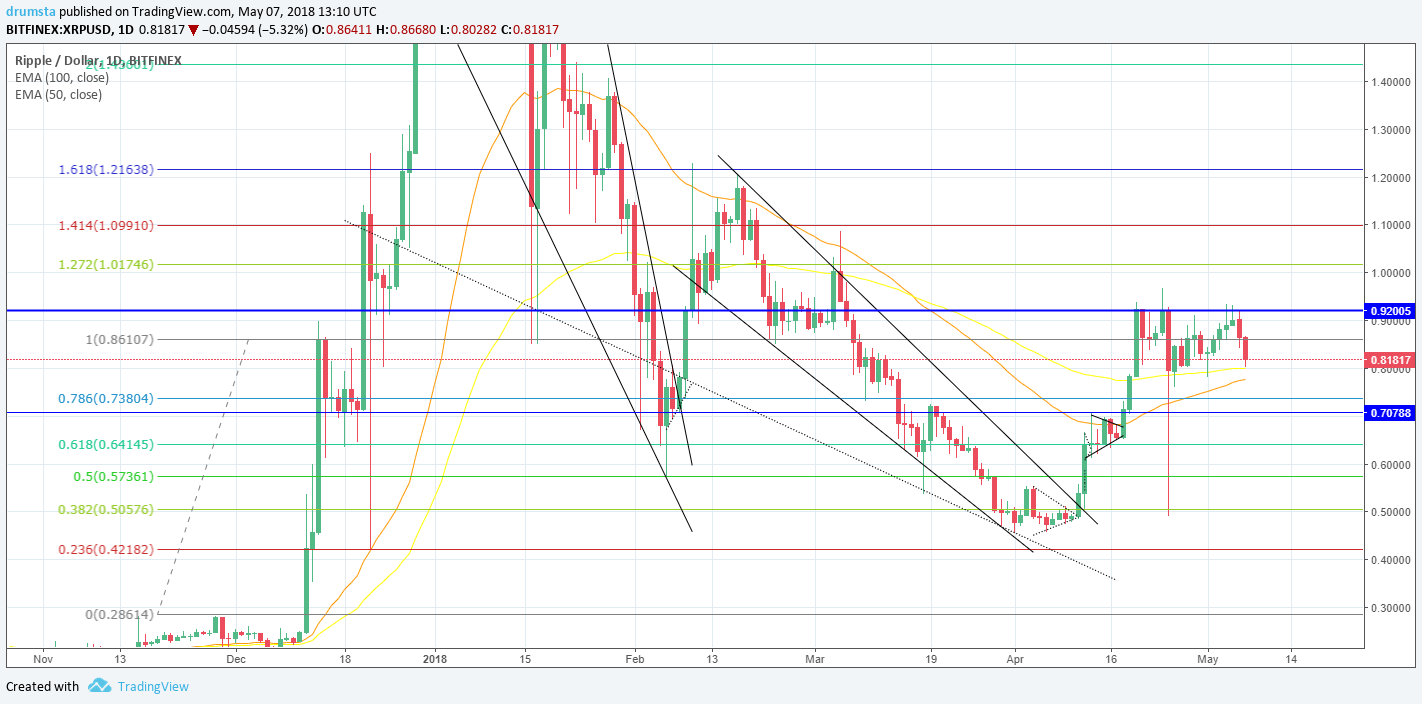
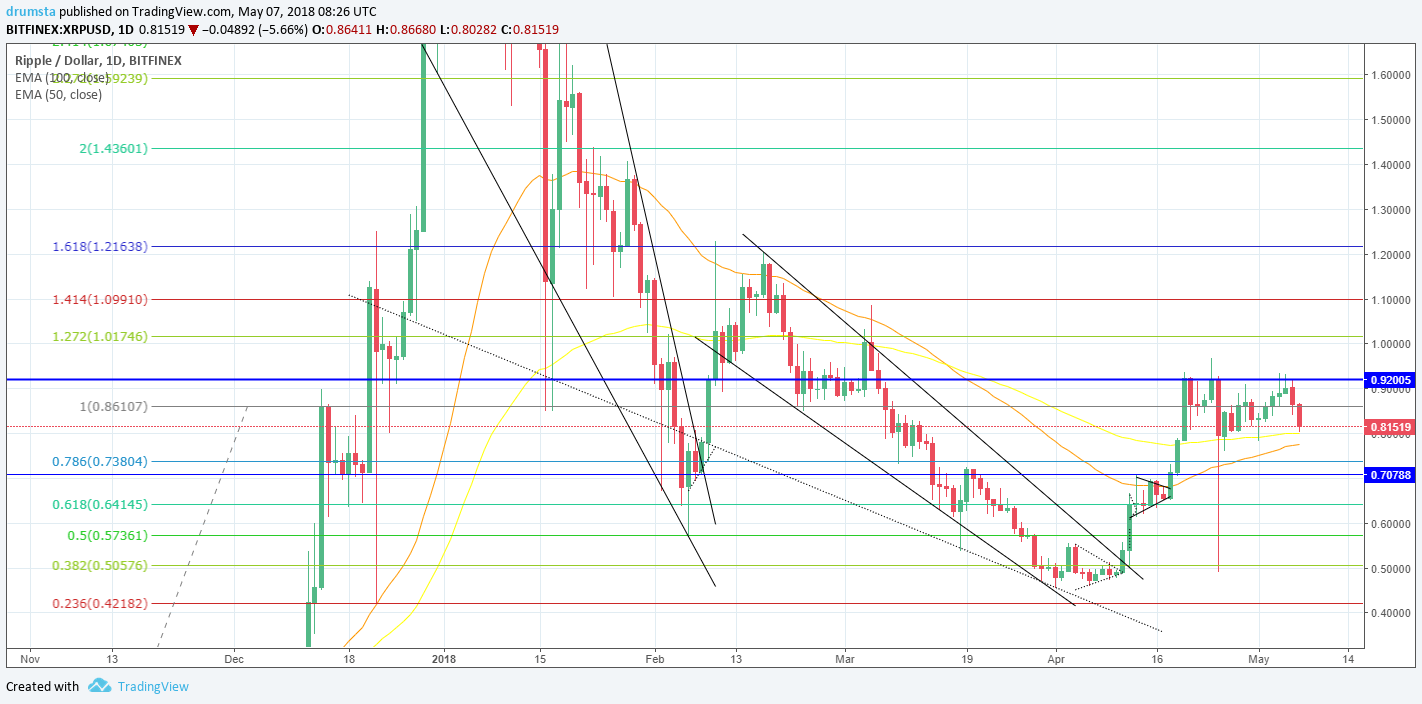
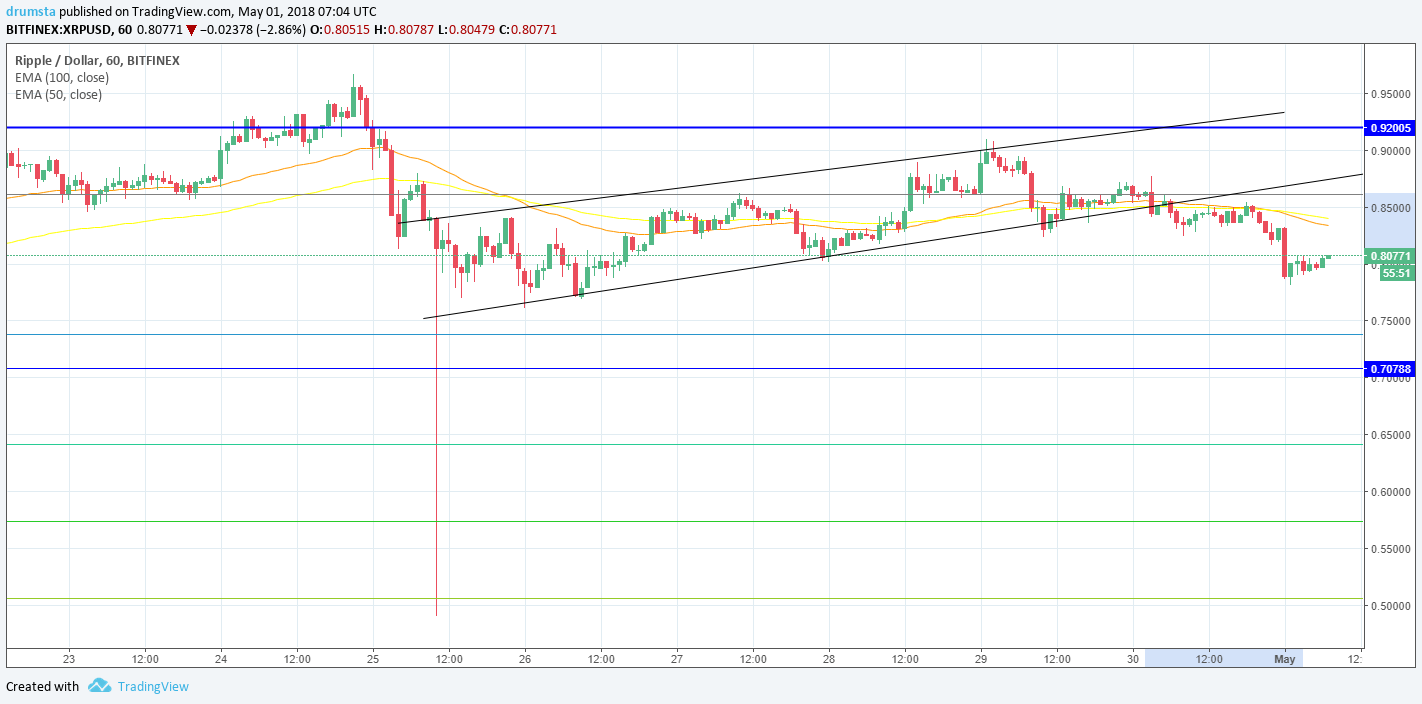
XRP/USD

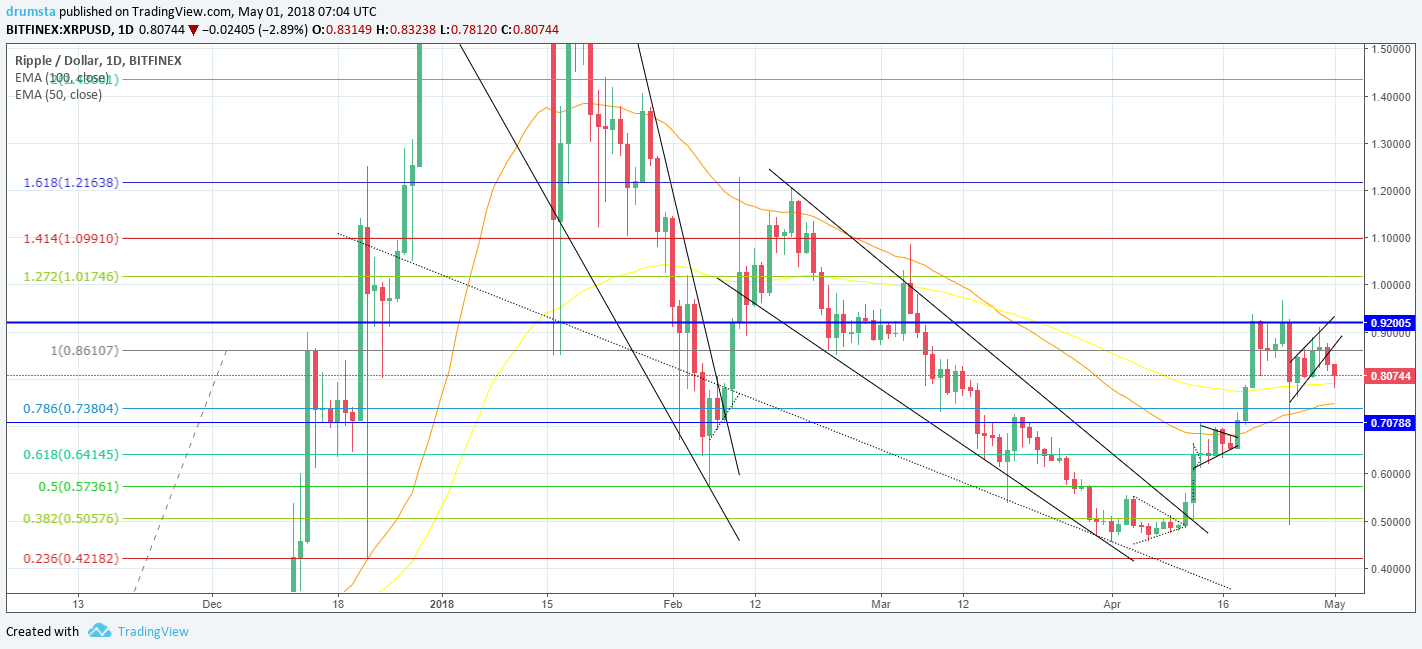
From yesterday’s open, the price of Ripple has increased by 2.46% from 0.6$ to 0.617$ where it is currently.


Looking at the daily chart, we can see that the price failed to exceed the 0.236 Fibonacci retracement level which serves as resistance, and as soon as the price hit it, it has retraced to the levels of prior range support.


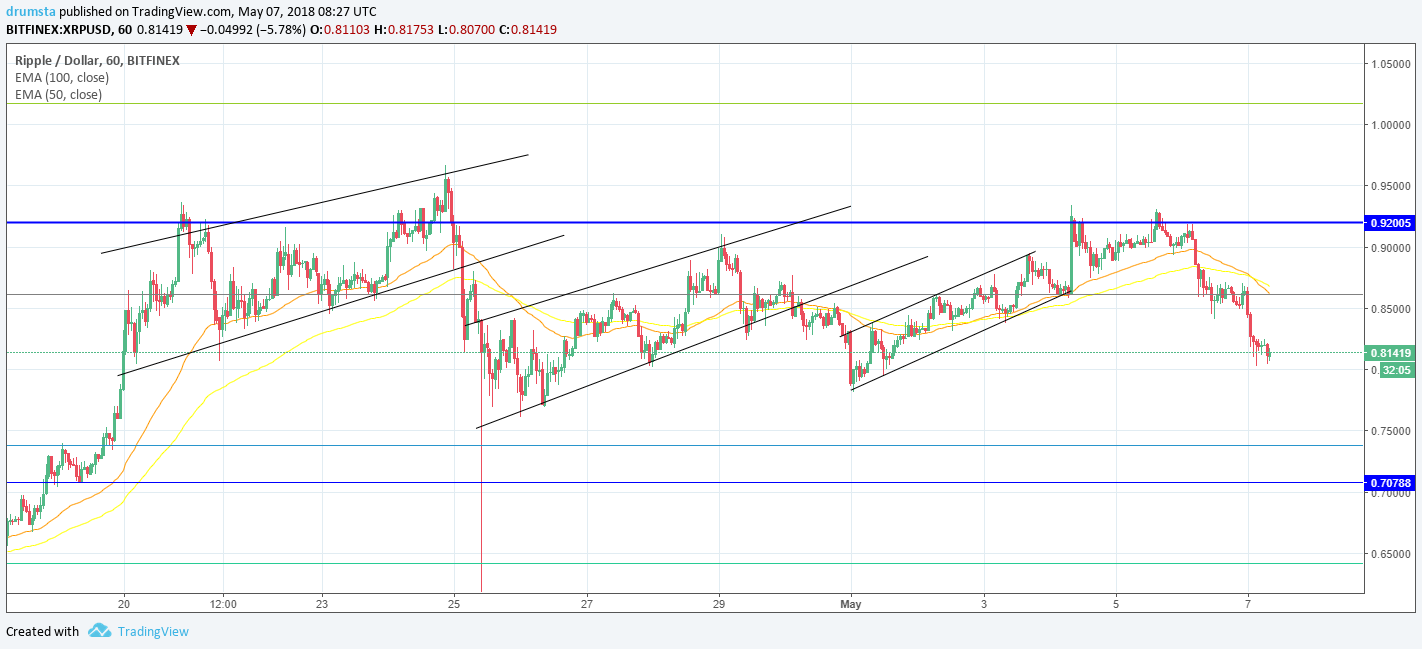
Zooming on the hourly chart, we can see the interaction with the 0.236 Fibo level clearly. The price struggled to go beyond it but failed to keep up the momentum. As it entered the seller’s territory, the selling has begun.
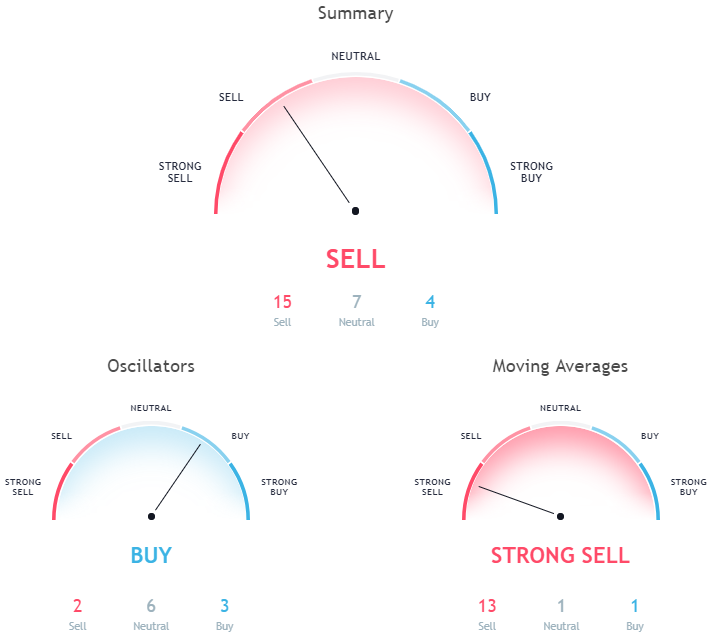
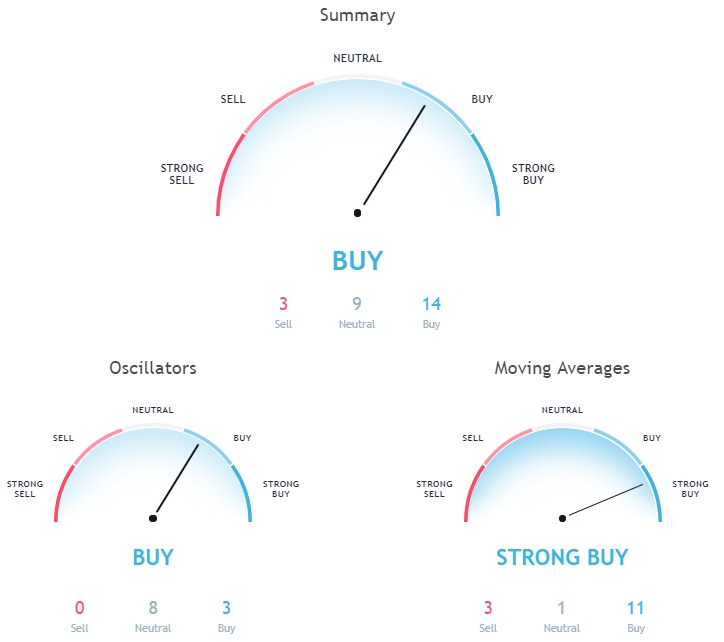
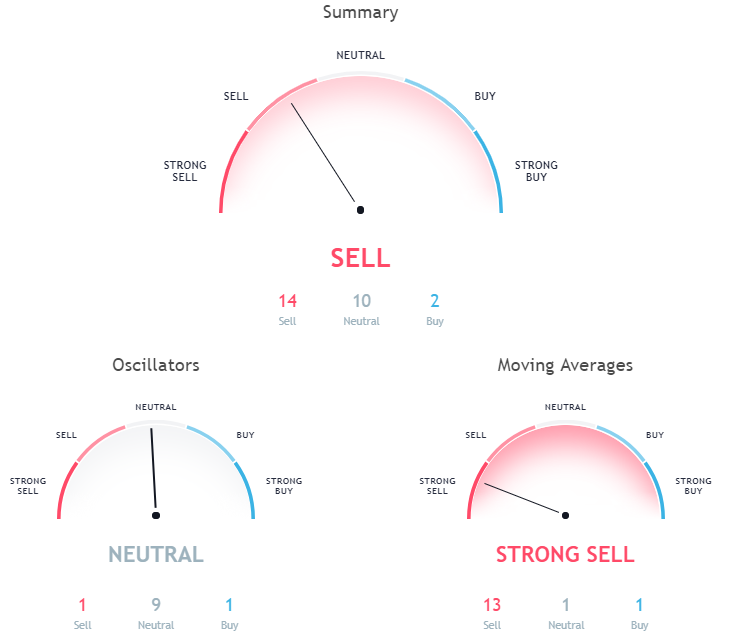
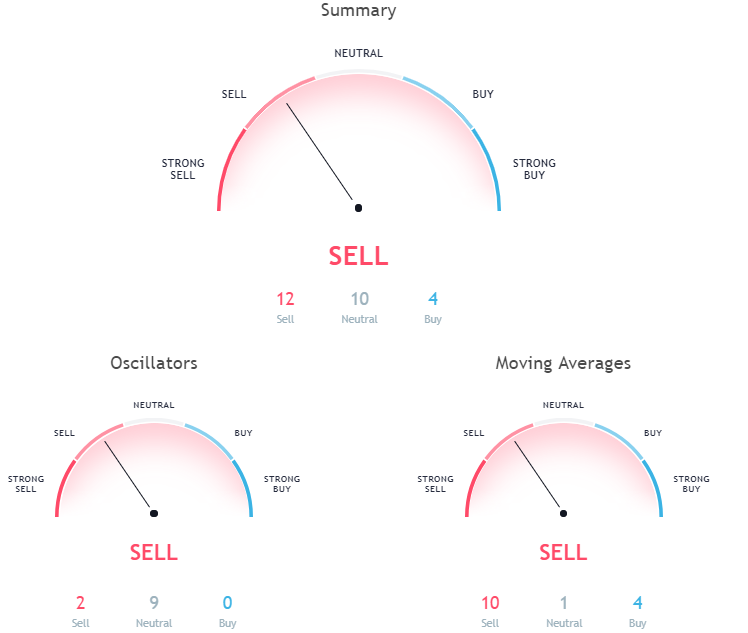

Market sentiment 

  • Ripple is still in the sell zone.
  • Oscillators are on neutral, and moving averages signal a strong sell.

Pivot points

S3 0.48865 
S2 0.55127 
S1 0.59016 
 P 0.61389 
R1 0.65278 
R2 0.67651 
R3 0.73913

Conclusion


Daily Crypto News Update: As we have seen yesterday, a strong momentum by the drop in price and the first interaction with the support levels, we are now seeing a reaction in a form of a quick bounce. Because the prices of three major cryptos are now back on the support levels of a prior range which now serve as resistance, we are either going to see buyers coming in a pushing the prices higher, which would mean that the correction has ended and that we are in for new highs, or the second and more probable scenario in which the prices enter seller’s territory and we are in for another low.

Categories
Crypto Market Analysis

Daily Crypto Update 24.05.2018 – The Prices Found First Support


General Overview


Crypto News Daily Updates:  
   Market Cap: $323,628,725,976 
       4h Vol: $20,747,314,659 
BTC Dominance: 39.1%

In the last 24 hours, the cryptocurrency market cap evaluation has fallen from 363,2 billion dollars to 320,1 billion dollars, which is a 43,1 billion dollar decrease.

Crypto Daily News

The market is in red with the biggest losers being around -10%. Only Steem +3,2% and 0x +9,1% are in green


Crypto Daily News


The top stories that came out in the last 24 hours are the following:

Coinbase Announces Launch of Coinbase Pro, Paradex Acquisition

Coinbase has announced Coinbase Pro, the new version of its trading platform GDAX, in a blog post Wednesday. The announcement comes on the same day as Coinbase’s acquisition of relay platform Paradex.

Bloomberg: US DOJ Opens Criminal Investigation Into BTC, ETH Price Manipulation

A criminal probe into Bitcoin (BTC) price manipulation by crypto traders has been opened by the U.S. Department of Justice (DoJ), Bloomberg reports today, May 24. Bloomberg cites four unnamed sources close to the matter as reporting that the criminal investigation – run by U.S. federal prosecutors and the Commodity Futures Trading Commission (CFTC) – will look into how traders could have engineered prices by illegal activities like spoofing and wash trading.

UN’s Project Services Arm Partners With IOTA to ‘Expedite’ its Mission With Blockchain

The United Nations signed a “memorandum of understanding” with blockchain platform IOTA to explore how the technology can increase efficiency, the two parties confirmed May 22. In a press release about the partnership, which features the United Nations Office for Project Services (UNOPS), the organization said the focus was on cutting intermediaries using blockchain.

Source: cointelegraph.com


Analysis


BTC/USD

From yesterday’s, open the price of Bitcoin has decreased by 7.67% from $7954 to $7355 where it is currently.


Looking at the daily chart the most important thing we see is that the price is currently interacting with the baseline support 1 which was the main support line from 14.07.2017, and held pretty strong in the past. Below that baseline is another unconfirmed which may serve as support if this one is broken.


Zooming into an hourly chart we can see the interaction with the support baseline, and that the price is currently below it. That doesn’t mean that the price is going further below, as this has happened twice before, the price interacted with that baseline support. We will see how today’s candle closes, but I am expecting a wick on the daily chart.


Market sentiment


  • Bitcoin is in the sell zone.
  • Oscillators are 9 on neutral, and moving averages signal a sell. 

Pivot points

S3 6404.6 
S2 7021.9
S1 7258.3 
 P 7639.2 
R1 7875.6 
R2 8256.5 
R3 8873.8

ETH/USD

In the last 24 hours, the price of Ethereum has dropped by 9.6% – from $649 to $586.5 where it is now.


Looking at the daily chart, we can see that the price is below 0.382 Fibonacci level and is looking for support at the levels of prior range resistance. As you can see from the wick, there was a good amount of buying pressure which propelled the price in an upward trajectory.  The price went above 0.382 Fibo level again for a while but has retraced since leaving a wick, which indicates the equal amount of selling pressure from above.


On the hourly chart, you can see that the price touched the prior resistance at $539.5 and bounced quickly, but it looks like now its entering seller’s territory. 


Market sentiment

  • Ethereum hourly chart technical signal a sell.
  • Oscillators are 9 on neutral, and moving averages signal a sell. 

Pivot points

S3 425.88
S2 511.34 
S1 544.12 
 P 596.80 
R1 629.58 
R2 682.26 
R3 767.72

XRP/USD

In the last 24 hours, the price of Ripple has dropped from $0.637 to $0.573 where it found temporary support and is now sitting at $0.615 which an overall decrease of 3.36%.


Looking at the daily chart, we can see that the price fell below 0.236 Fibonacci retracement level with strong momentum.


Zooming into an hourly chart we can see where the price found support, and it was on the levels of prior range resistance at $0.573. As you can see currently the price is up again, but on the same levels from which it has fallen before, which means that sellers are near, so we can expect another drop from these levels. 


Market sentiment

  • Ripple is in the neutral zone.
  • Oscillators and moving averages are signaling a neutral.

Pivot points

S3 0.46433
S2 0.53360
S1 0.56156
 P 0.60287
R1 0.63083
R2 0.67214
R3 0.74141

Conclusion


As prices of three major cryptocurrencies only made a quick dip toward their first support from which they bounced back to the prior high, I am expecting to see some short-term upside movement in the form of an upward channel after which the prices are likely to be heading down again for another low for a proper retest.


Categories
Crypto Market Analysis

Daily crypto update 22.05.2018 – New Corrective Move Has Started


General overview


Crypto Daily Update:

Market Cap: $377,526,863,027 
24h Vol: $15,782,191,998 
BTC Dominance: 37.6%


From yesterday’s high at 391,920,000,000$ crypto market cap has decreased to $377,1B steadily.

The market is in red, with approximately 3%-5% average decrease in value from top 100 cryptocurrencies.


News


Top stories that came out in the last 24 hours are mostly positive, however, there are no significant news that can impact the market. These are the most significant headlines:

Polish Finance Ministry Rolls Back Crypto Tax, Promises Smarter Regulation

Poland’s Ministry of Finance will temporarily suspend tax collection for cryptocurrencies, the Polish Press Agency (PAP) reported May 18. The Ministry says it will conduct an “in-depth analysis” of the crypto space to inform better regulation and taxation policies going forward.

Japan’s Largest Bank and Cloud Delivery Giant Akamai Announce Blockchain Payment Network

The Mitsubishi UFJ Financial Group (MUFG) has partnered with major U.S.-based cloud delivery platform Akamai Technologies to release a global payment network based on blockchain, Cointelegraph Japan reports today, May 21.

Walmart Files Patent for Blockchain-Based Customer Marketplace

Walmart has filed a patent for a blockchain-based marketplace for reselling purchased products, according to a US Patent and Trademark Office USPTO patent filing from May 17.

Thai SEC Holds Focus Group to Clarify New Crypto, ICO Regulations

Thailand’s Securities and Exchange Commission (SEC) held a focus group on cryptocurrency regulation today, May 21, streamed on Facebook Live. The hearing focused on the SEC’s approach to crypto-related businesses and fundraising through Initial Coin Offerings (ICO), local news outlet Siam Blockchain reports.

Germany’s BaFin Visits National Bank of Georgia to Discuss Crypto Regulations

One of the largest financial supervisors in Europe met with the National Bank of Georgia (NBG) and other members of the finance sector to discuss cryptocurrency regulation, according to a post on the NBG’s site May 18.

Bank of England Issues Working Paper on Central Bank Digital Currencies

On May 18, the Bank of England released a staff working paper, laying out various scenarios of possible risks and financial stability issues of central bank digital currencies (CBDCs).


Analysis


BTC/USD

From yesterday’s open at 8525$ the price of Bitcoin has decreased by 3,18% dropping to 8253$ where it is currently sitting.


Looking at the daily chart we can see that the price fell below 0,382 Fibonacci retracement level and is currently at the levels of the opening of the day before yesterday’s candle, which was a green candle, which broke out from the wedge pattern.


Zooming into an hourly chart we can see clearly what happened at the Fibonacci level. As you can see the momentum behind the move was strong, and the price is likely heading back to the wedge resistance for a retest.


Market sentiment

  • Bitcoin hourly chart technical signal a strong sell.
  • Oscillators are signaling a sell, and moving averages a strong one.

Pivot points


S3 7781.1 
S2 8116.0 
S1 8257.8 

P 8450.9 

R1 8592.7 
R2 8785.8 
R3 9120.7

ETH/USD

In the last 24 hours, the price of Ethereum has decreased by 4,2% coming from 715$ to 685$ where it is currently sitting.


Looking at the Ethereum daily chart we can see that the price was repealed by the resistance at 712$ and that from there the price only fell further.


Zooming into the hourly chart we can see that the price fell even further, but quickly bounced back to the support levels on which it’s currently sitting. The price found some temporary support, but judging by the momentum behind the move, that support won’t hold again.


Market sentiment

  • Ethereum hourly chart technicals signal a sell.
  • Oscillators are on buy, but moving averages signal a strong sell.


Pivot points

S3 632.57 
S2 666.63 
S1 681.38 

P 700.69 

R1 715.44 
R2 734.75
R3 768.8

XRP/USD

From yesterday’s open at 0.6991$ the price of Ripple has decreased by 4,56% dropping to 0,6673$.


On the daily chart, things haven’t changed much, the price is still in the range between 0,382 and 0,236 Fibonacci retracement levels, and after a move up it has retraced to the start of that move, looking for support.


On the hourly chart, we can see that the price was repealed by the resistance of the triangle from which it tried to burst but failed which propelled the price in a downward trajectory.


Market sentiment

  • Ripple is still in the sell zone.
  • Oscillators are on buy, and moving averages signal a strong sell.

Pivot points

S3 0.61103 
S2 0.64647
S1 0.66073

P 0.68191

R1 0.69617
R2 0.71735
R3 0.75279

Conclusion


Crypto Daily Update: As I have projected in my weekly forecast, the correction is still in play and we are in for new lows. The prices failed to break resistance at prior highs, and as they entered sellers territory the selling has begun.

Categories
Crypto Market Analysis

Weekly Crypto Update 20.05.2018 – More Correction Coming


General Overview


Weekly Cryptocurrency Update:

Market Cap: $383,203,468,592 
24h Vol: $15,118,655,008 
BTC Dominance: 37.2%

At the start of the week on Monday 14th May, the cryptocurrency market cap evaluation was $407,285,000,000 and it soon dropped to $386,345,000,000 before it spiked up to $412,903,000,000 which was the week’s high. From Monday to Friday, the market cap has been steadily dropping and it hit $361,113,000,000 which was the week’s lowest point.

Weekly Cryptocurrency Market Cap Update

From yesterday, the evaluation has been increasing but it looks like it entered the bearish territory, judging by the spike to $383,159,000,000, and a quick drop. However, this may be a new support level, as the evaluation appears to be stabilising around these levels.


Analysis


BTC/USD

At the start of the week, the price of Bitcoin was $8700 and the only time it went higher was on the same day when it hit $8815 after a drop to $8365. It is now sitting at $8370 which is a 4.8% decrease.


Looking at the daily chart we can see that Monday’s candle was a pin bar doji which indicated stronger buying pressure than the pressure from the sellers, but the position of the candle, however, indicated more downside.

Yesterday’s candle closed as a red doji and as you can see from the wick, the price hit the 0.382 Fibonacci level and retraced since so judging by the wick there’s still a lot of selling pressure.

Today’s candle is green, which is very unusual for Sunday, as on weekends there’s a lot of selling going on. 


Market sentiment

Daily chart technical signals a strong sell.

Oscillators are on a sell and moving averages are indicating a strong sell with 13 MA’s on sell


Pivot points

S3 5360.5 
S2 7120.1 
S1 7795.5 

P 8879.7

R1 9555.1 
R2 10639.3
R3 12398.9

ETH/USD

From Monday until today, the price of Ethereum has decreased by 2.8% going from $733 to $712 where it is now sitting. The price fell even lower to $660 on Friday which is the week’s low.


On the daily chart, we can see that the candle on Monday was a pin bar doji like in the case of Bitcoin and since then, the price fell to the 0.5 Fibonacci levels, where it found support. Yesterday’s candle was a doji also like in the case of Bitcoin, and the current one is green but not higher than yesterday’s which is still a bearish sign. 


Market sentiment

Ethereum’s daily chart technicals signal a buy.

8 oscillators are on neutral and moving averages are signalling a strong buy. 


Pivot points

S3 499.01 
S2 596.73 
S1 646.17 

P 694.45 

R1 743.89 
R2 792.17 
R3 889.89

XRP/USD

From Monday’s open until today, the price of Ripple has declined by 5.82% going from $0.73 to $0.688 where it is currently sitting. The price went down further on Friday to $0.645, but since then, it has been steadily rising to the levels on where it is currently.


Looking at the daily chart we can see that Monday’s candle was a pin bar doji like in the case of Bitcoin and Ethereum, but the correlation doesn’t end there as we can see that yesterday’s candle was a doji also, like it was on the BTC and ETH daily charts. 


Market sentiment

Ripple is still in the sell zone, as daily chart technicals signal a sell.

Oscillators are;- 3 on sell and 8 on neutral, but moving averages signal a strong sell with 12 on sell.


Pivot points

S3 0.48085
S2 0.58545
S1 0.63011

P 0.69005

R1 0.73471
R2 0.79465
R3 0.89925

LTC/USD

Overall this week, Litecoin has decreased by 3.38% from $144 on Monday’s opening to $139.2 where it is today. The price went higher than it was on the opening to $151 on Monday, and it was lower than today’s (Friday), to $129 which was the week’s low.


Looking at the daily chart we can see that the price of Litecoin is currently interacting with the 0.236 Fibonacci retracement level which serves as resistance. On Monday there was great indecision which can be seen on Monday’s candle wicks. On Wednesday we had a pin bar doji that closed above the Fibonacci level which indicated buying pressure, but as you can see the buyers failed to push the price higher, and the sellers were stronger so the price fell below the Fibo level on the next day. 


Market sentiment

Daily chart technicals signal a sell.

Oscillators signal a sell, and moving averages a strong one.


Pivot points

S3 90.493 
S2 114.733 
S1 124.937

P 138.973

R1 149.177
R2 163.213
R3 187.453

Conclusion


Weekly Cryptocurrency Update: I don’t believe that the corrective move is over. The prices of four major cryptocurrencies failed to exceed prior highs even though we are experiencing a move to the upside in the last couple of days. I think we are in for another low.

Weekly Cryptocurrency Update

This will correspond with a retest of prior resistance for support which is around $333B.

For more information about what’s likely coming in the following week make sure you watch the substitutionary video in which I provide a forecast and reasons why I believe there’s another low coming.


Categories
Crypto Market Analysis

Daily Crypto Update 21.05.2018 – Indecision


General Overview


Crypto Market Update Today:

Market Cap: $389,840,003,354

24h Vol: $17,523,547,047

BTC Dominance: 37.2%

In the last 24 hours, cryptocurrency market cap has increased from $375B to slightly below $390B.

Crypto Market Update TodayThe market is mostly in green, with the biggest gainers among top 100 being Tron +14%, Skycoin 10%, Holo 20%.


News


There isn’t any significant news that came out during the weekend. Top stories are therefore analytical in nature or follow-ups from prior stories.  These are some of the more significant headlines:

Iran and Russia Discuss Transacting in Crypto to Avoid International Sanctions

Iran and Russia could start using cryptocurrencies to avoid Western sanctions, Russian news portal RBC reported yesterday, May 17.

Norway Central Bank Considers Developing Digital Currency

Norway’s central bank, Norges Bank, is considering developing its own digital currency as a supplement to cash to “ensure confidence in money and the monetary system”, according to a working paper May 18.

Former UK Visa CEO Takes Helm of Crypto Consumer Payment Startup

The former head of Visa in the UK and Ireland has joined a startup bringing crypto to consumer payments, Business Insider NL reports today, May 19.

WSJ: Coinbase Spoke to U.S. Regulators About Acquiring Federal Banking License

Major U.S. cryptocurrency exchange and wallet Coinbase spoke to regulators about obtaining a federal banking charter, according to a report by the Wall Street Journal (WSJ) May 18.

Source: cointelegraph.com


Analysis


BTC/USD

From yesterday’s open, the price of Bitcoin has increased by 3.4%, going from $8229 to $8510 where it is currently sitting.


On the daily chart, we can see that the price is currently a red doji above 0.382 Fibonacci retracement level.  We can also see a breakout from the falling wedge.


Zooming into an hourly chart, we can see the interaction with the Fibo level, and the momentum behind the up move. Price action formed a double top, with the last top’s candles closed with two massive wicks from the upside, which indicates selling pressure.


Market sentiment

Bitcoin is in the buy zone, as indicated by hourly chart technicals.

Oscillators are on buy, and moving averages on a strong one.


Pivot points

S3 7578.2 
S2 8004.6 
S1 8264.2 
P 8431.0
R1 8690.6 
R2 8857.4 
R3 9283.8

ETH/USD

The price of Ethereum has increased by 3.34% from yesterday’s open, going from $690 to $712,8 where it is currently.


Looking at the daily chart, we can see that the current candle is a red doji, like in the case of Bitcoin, and it sits at the levels of prior high.


Zooming into an hourly chart, we can see that the price has retraced to retest the support, which is on the levels of prior high at $712. We can also see a breakout from a triangle which wasn’t that strong, as the impulse behind the move looks like any other prior move.


Market sentiment

Ethereum is in the neutral zone, as hourly chart technicals are on neutral.


Pivot points

S3 638.08 
S2 673.30 
S1 694.40 

P 708.52 

R1 729.62 
R2 743.74 
R3 778.96

XRP/USD

In the last 24 hours, the price of Ripple has increased by 3.17%, from $0,67250 to $0,69436. The price has been steadily rising and is now facing first strong resistance.


On the daily chart, we can see that the current candle is red, and is sitting at the levels of prior high.


The hourly chart paints a clearer picture. We can see that the price is still in an upward channel which is inside the symmetrical triangle pattern. The price found resistance on the triangle’s resistance line levels and is currently struggling to keep up the upward movement.


Market sentiment

Hourly chart technicals are on neutral, so the price of Ripple is currently indecisive.


Pivot points

S3 0.61264 
S2 0.65176 
S1 0.67536 

P 0.69088 

R1 0.71448 
R2 0.73000 
R3 0.76912

Conclusion


Crypto Market Update Today: In the last day, we have seen an upward movement has been stopped by first major resistance, as seen on the charts from three major cryptocurrencies that we are covering in this daily report. The market is currently showing signs of indecision indicated from the current candles being Dojis. We are likely to see a move down, which would be a final corrective move, before a new runup to new highs.

Categories
Crypto Market Analysis

Daily Crypto Update 18.05.2018 – Lower Lows Ahead


General overview


Crypto Market Cap Live Update:

Market Cap: $370,028,549,685

24h Vol: $19,283,416,338

BTC Dominance: 37.4%

In the last 24 hours, the crytocurrency market cap went from $381,331,000,000 to $391,463,000,000 which was yesterdays high. Since then, the evaluation has fallen to $361,113,000,000 this morning, and is slightly up from then.

Crypto Market Cap Live UpdatAs you would have suspected, the market is mostly in red, with an average decrease of 4-6% per coin amongst the top 100. Some of the biggest losers are iExec RLC -17%, Dragonchain -13%,  biggest gainers are Syscoin +19.3% and Huobi token 11.95%.


News


Top stories that came out are either about blockchain tech adoption or familiar names adopting it, but we can also see some negativity and criticism. These are some of the significant headlines:


Chinese IT Ministry Cryptocurrency Ratings Released: Ethereum 1st, Bitcoin 13th of 28

China’s Ministry of Industry and Information Technology has released its official cryptocurrency ratings. The “domestic experts” awarded Ethereum 1st and Bitcoin 13th out of 28 places. May 17. First-rate domestic experts and scholars” contributed to the ratings, which they calculated on the basis of three indexes: “technology,” “application” and “innovation.”


Germany’s 2nd Largest Stock Exchange To Launch Zero-Fee Crypto Trading App

Germany’s second largest stock exchange, the Stuttgart Börse, which reportedly has a trading volume of $100 bln, has announced it is launching a zero-fee cryptocurrency trading app, Thursday, May 17. The smartphone app, dubbed ‘Bison,’ will be free to use as of Autumn 2018, and has been developed together with fintech startup Sowa Labs.


JP Morgan Announces Prototype Blockchain Platform to Streamline Capital Markets Infrastructure

J.P. Morgan Chase & Co presented a prototype of its blockchain platform for capital markets, which aims to cut costs and enable smoother securities transactions. The announcement took place at NY’s Consensus conference Wednesday, the Wall Street Journal reported May 16.


Wall Street Journal Research Finds ‘Red Flags’ In almost 19% Of ICOs

The Wall Street Journal released findings from its analysis of almost 1500 initial coin offerings (ICOs) May 17, concluding 18.6% of them raised “red flags.” The latest source to investigate the still-booming ICO market, the WSJ warned that of the 1450 offerings it found, 271 of them were using what it described as “deceptive or even fraudulent tactics.”


JPMorgan Creates and Fills New Position of Head of Crypto Assets Strategy

Leading US banking group and financial services firm JPMorgan Chase has recently created and filled the new position of head of crypto-assets strategy, Business Insider reported today, May 17. London-based Oliver Harris, 29, will take the new role, reporting to the head of blockchain development, Umar Farooq. Harris will also lead JPMorgan’s internal blockchain project Quorum, which began testing by JP Morgan Chase and the National Bank of Canada last month.


Bitfinex Requires Customer Tax Info which it ‘May Exchange’ with Gov’t, Tax Authorities

Cryptocurrency trading platform Bitfinex has recently distributed a letter to certain users, saying that they are required to disclose their tax information, which the exchange may share with the government, according to a statement from the exchange on Twitter May 17.


Tel Aviv Stock Exchange Develops ‘First Of A Kind’ Blockchain Lending Platform

The Tel Aviv Stock Exchange (TASE) has developed a “first of a kind” blockchain-based securities lending platform, according to a press release May 16. The new platform was completed in partnership with Israeli fintech firm The Floor, global professional services company Accenture, and Intel.


Swiss Government Requests Study on State-Backed Digital Currency

The Federal Council of the Government of Switzerland has requested a report on the risks and opportunities of introducing its own state-backed digital currency, or so called “e-franc”, Reuters reported May 17.


Analysis


BTC/USD

From yesterday’s open at $8382 the price of Bitcoin has decreased by 3.11% coming to $8116 where it is now sitting. The price has fallen even further to $7940 but bounced back quickly to the levels at which it is now.


Looking at the daily chart we can see that the price is below the 0.382 Fibo level in a downward trajectory heading toward the 0.236 level.


On the hourly chart, we can see that the price is back at prior support, which now serves as resistance.


Market sentiment

Bitcoin hourly technicals signal a sell.

Oscillators are in favor of sell even though 8 are signaling neutral, and moving averages are indicating a sell.


Pivot points:

S3 7173.6 
S2 7673.3 
S1 7863.8 

P 8173.0 

R1 8363.5 
R2 8672.7 
R3 9172.4

ETH/USD

From yesterday’s high at $712, the price of Ethereum fell to $660 this morning but has since bounced back a bit to $680 where is now sitting, leaving an overall decrease of 4.6%.


On the daily chart, we can see that the price found support at the 0.5 Fibonacci level and has increased since it hit it.


On the hourly chart, we can see the interaction with the 0.5 Fibo level. The price went below it and quickly bounced back, but it is currently at the prior support levels which now serve as resistance.


Market sentiment

Ethereum is still in the sell zone.

Oscillators and moving averages both signal a sell.


Pivot points

S3 565.61
S2 624.01
S1 645.93

P 682.41

R1 704.33
R2 740.81
R3 799.21

XRP/USD

From yesterday’s open at $0.7 the price of Ripple has decreased by 5.3% to $0.67 where it is now sitting.


Looking at the daily chart we can see that things haven’t changed that much. The price action is still stuck between 0.382 and 0.236 Fibonacci levels. Today’s candle is green but it hasn’t exceeded prior highs.


The hourly chart tells us that the price broke out of the upward channel from the downside, found tempory support and is currently hovering around the levels of prior support which now serves as resistance.


Market sentiment

Ripple hourly technicals signal a sell.

Oscillators and moving averages are both signaling a sell.


Pivot points

S3 0.54850
S2 0.61100
S1 0.63479

P 0.67350 

R1 0.69729
R2 0.73600 
R3 0.79850 

Conclusion


Crypto Market Cap Live Update: The prices of three major cryptos that we cover in this daily report have experienced the same thing in the last 24 hours – breakout to the downside and retesting of prior resistance for support. After this retest is done I am expecting another downside movement and creation of lower lows.

Categories
Crypto Market Analysis

Daily Crypto Update 17.05.2018 – More Downside Expected


General overview


Crypto Market Cap Update:

Market Cap: $383,200,519,037

24h Vol: $19,647,906,771

BTC Dominance: 37.0%

Crypto Market Cap Live Update

In the last 24 hours, cryptocurrency market capitalization increased from $372,910,000,000 to $391,463,000,000 and then fell back to $381,952,000,000 where it is now sitting. The market is mostly in green, with an average increase of 2-4%.  Biggest gainers among top 100 are iExec RLC +35%, Veritaseum +11%, Augur +7%, while biggest losers are Wax -13% and Gifto -14,83%. 


News


Top stories that came out in the last 24 hours are mostly positive, however, following the markets decline there are some negative as well. These are the significant headlines:


JPMorgan Co-President Jerry Pinto: Cryptocurrency “Will Play a Role” in Future

JPMorgan co-president Jerry Pinto confirmed the bank was “looking into” the Bitcoin space May 16, saying cryptocurrency “will play a role” in the future. Speaking to CNBC over two interviews, Pinto, who could be in line to succeed CEO Jamie Dimon, said that JPMorgan is able to trade Bitcoin futures but has not yet opted to do so.

“We are looking into that space. I have no doubt that in one way or another, the technology will play a role,” he responded when asked about trading Bitcoin-based products.


Enterprise Ethereum Alliance Releases Client Specifications To Facilitate Interoperability

The Enterprise Ethereum Alliance (EEA) has released the Enterprise Ethereum Client Specification 1.0 today, May 16, that will enable interoperability for companies that use Ethereum blockchain-based solutions.


Russia’s Digital Economy Bill Supported by State Duma Committee in Move Towards Crypto Regulation

Russian State Duma’s Committee for Legislative Work will support the first reading of an initiative that will add the basic norms of digital economy to the Russian Federation Civil Code. This is the latest step on the road to regulating cryptocurrency in the country, local news outlet Izvestia reports Wednesday, May 16.


Twitter CEO Jack Dorsey Reaffirms Bullish Future on Bitcoin, Crypto as Global Payment

Twitter and Square Inc. CEO Jack Dorsey expressed optimism about cryptocurrency’s role in the future of payments, saying that “the internet deserves a native currency” and “it will have a native currency,” Bloomberg reports May 16.


Sberbank Completes First Blockchain-Enabled Commercial Bonds Transaction in Russia

Sberbank CIB, the corporate and investment banking business of Russia’s largest bank Sberbank, conducted the first blockchain-based commercial bond transaction in Russia, according to a Sberbank announcement May 16. The transaction was completed in partnership with MTS, a leading Russian telecoms operator, and the National Settlement Depository (NSD).


PayPal CFO Says Merchants Aren’t Interested in Crypto Due to Volatility

Centralized payment service PayPal was a pioneer in accepting cryptocurrencies. Merchants could opt-in to accept Bitcoin (BTC) on the platform as far back as 2014, when BTC was worth around $400. Today, Rainey stated that PayPal currently doesn’t see much interest in digital currencies from their merchants, as the volatile nature of cryptocurrencies can cause contingent losses.


Analysis


BTC/USD

From yesterday’s low at $8122 the price of Bitcoin has spiked to $8479 and has fallen back to $8270 which is an overall increase of 2%.


On the daily chart, things haven’t changed much since yesterday. As you can see from the wicks, yesterday’s candle indicated a lot of buying pressure, but those buyers failed to break sellers resistance at the 0.382 Fibonacci retracement level.


Zooming into an hourly chart, we can see the interaction with the Fibo level. The price action is starting to form what it looks like to be another upward channel.


Market sentiment

Bitcoin is still in the sell zone, as hourly technicals signal a sell.

Eight oscillators signal neutral and moving averages signal a strong sell.


Pivot points

S3 7524.2 
S2 7916.9 
S1 8126.5 

P  8309.6 

R1 8519.2 
R2 8702.3 
R3 9095.0

ETH/USD

From yesterday’s low at $678 the price of Ethereum increased by 3% coming to around $700.


As you can see from the daily chart, yesterday’s candle closed as a bullish pin bar, indicating a trend reversal. However, the price failed to come remotely close to the 0.618 Fibonacci level and exceed prior highs, which would mean that uptrend has begun. Today’s candle is red, meaning that the price is below yesterday’s close.


On the hourly chart, we can see that like in the case of Bitcoin. The price action is forming an upward channel. If we have in mind the fractal nature of the market, and what happened in a prior fractal, we can conclude that the price is going to fall further.


Market sentiment

Ethereum is still in the sell zone.

Oscillators are on neutral, and moving averages on a strong sell.


Pivot points

S3 557.19 
S2 622.19 
S1 664.38 

P  687.19 

R1 729.38 
R2 752.19 
R3 817.19

XRP/USD

From yesterdays low at $0.66, the price of Ripple has increased by 4.23% coming to $0.689 where it is now.


Looking at the daily chart, we can see that the price is on the levels of yesterdays open, which is not a good sign.


Zooming into an hourly chart, we can see the correlation with Ethereum and Bitcoin – there’s an upward channel from which the price is going down.


Market sentiment

Ripple’s hourly chart technicals signal a sell.

Oscillators indicate sell, and moving averages a strong one.


Pivot points

S3 0.58647
S2 0.63890 
S1 0.67322 

P  0.69133 

R1 0.72565 
R2 0.74376 
R3 0.79619

Conclusion


Crypto Market Cap Update: More down movements are expected as the prior fractal (upward channel) indicates. I have said in Thursday’s conclusion that even though the corrective move is over, it might be only the first one. I think we are in for new lows, as the first corrective move to the downside was over, and the small bullish one didn’t trigger a trend reversal.

Categories
Crypto Market Analysis

Daily Crypto Update 16.05.2018 – New Lows Ahead


General overview


Daily Crypto Market Update:

Market Cap: $377,867,819,649

24h Vol: $22,547,487,155

BTC Dominance: 37.2%

From yesterdays highest point at $412,9B  cryptocurrency market capitalization evaluation fell approximately by 40B, coming to $372,9B this morning.

cryptocurrency market capitalization

Amongst the top 100 coins, about 98% are in red, with an average decrease in percentage from 13%. Biggest losers are Augur -15%, Mixin -16%, Mithil -22%, Kin -22%, Salt – 15%. Out of those who are in green, Wax is the biggest gainer, increasing by 4%.


News

Top stories that came out in the last 24 hours are mostly positive in sentiment. There are many established companies mentioned starting to adopt blockchain technology, or starting their own blockchain projects. Here are some of the significant headlines:


IBM Partners With Veridium Labs To Let Companies Track Carbon Footprint Via Blockchain

IBM announced a partnership with Veridium Labs to tokenize carbon credits that will allow companies to track their carbon footprint with blockchain today, May 15, in a press release shared with Cointelegraph.


FedEx CEO: Blockchain Is The ‘Next Frontier’ For Global Supply Chains

Delivery services multinational FedEx said it is “quite confident” blockchain has “big, big implications” for supply chains in a speech May 14, as it continues engagement with the technology.


Coinbase Targets ‘$10 Bln’ Institutional Investor Market With New Suite Of Products

The four products – Coinbase Custody, Coinbase Markets, The Coinbase Institutional Coverage Group and Coinbase Prime – all focus on alleviating major concerns that have allegedly caused institutional investors to hold back from entering the cryptocurrency space so far, such as security and regulatory compliance.


World’s Fifth Largest Bank To Trial Own Cryptocurrency In 2019

The banking unit of Japan’s Mitsubishi UFJ Financial Group (MUFG) plans to trial its own cryptocurrency as early as 2019, Cointelegraph Japan reports today, May 15.


Two Ex-JPMorgan Blockchain Leaders Reveal New Decentralized App Store Startup

The Two former leads of JPMorgan’s blockchain program unveiled a new startup, a decentralized app (DApp) store, Fortune reported yesterday, May 14.


Amazon And ConsenSys’ Startup To Offer Simplified Blockchain Platforms

Amazon Web Services (AWS), the tech giant’s cloud computing arm, is partnering with ConsenSys’ blockchain startup Kaleido to offer simplified blockchain cloud platforms for its clients, CNBC reports today, May 15.


HTC Reveals Plans To Launch Blockchain-Powered Smartphone

Consumer electronics corporation HTC has unveiled “the first native blockchain phone”, HTC Exodus, which will launch with support for multiple blockchains, including Bitcoin (BTC) and Ethereum (ETH) networks, PCMag reported May 15. HTC Vive creator Phil Chen announced the forthcoming project at the Consensus conference in New York City today.


Belarus Considers Digital Economy a Top Priority, Develops Resolution For OSCE Meeting

Belarus considers the digitization of the economy a top priority and is developing a resolution promoting digital economy for a session of the Parliamentary Assembly of the Organization for Security and Co-operation in Europe (OSCE PA), local news BelTA reports May 15.


Analysis


BTC/USD

From yesterday’s open at $8683, the price of Bitcoin has decreased by 5.73% coming to $8191 where it is now sitting.


On the daily chart, we can see that the price has fallen below 0.382 Fibonacci retracement level and is now sitting at the level of the opening candle on the 12th of May where it temporarily found support.


Looking at the hourly chart, we are seeing that the price broke out of the upward channel support line, and is heading towards the 0.236 Fibo level.


Market sentiment

Bitcoin is still in the sell zone.

Oscillators are signaling a sell, and moving averages a strong one.


Pivot points

S3 7698.0 
S2 8138.7 
S1 8303.1 

P 8579.4 

R1 8743.8 
R2 9020.1 
R3 9460.8

ETH/USD

From yesterday’s open at $726, the price of Ethereum has decreased by 5.26%, coming to $688 where it is now.


Looking at the daily chart, we can see that the price has fallen to the levels on the opening candle on the 13th of May. 50 day and 100 day EMA are getting closer, and if 50 EMA goes across the 100 day from above, we will get a buy signal. However, I doubt that is going to happen, as the down move is only getting larger.


As you can see from the hourly chart, hourly EMA’s are crossing in a bearish manner, meaning 50 hour EMA is crossing 100 EMA from above. The price has broken out of the upward channel and has bounced off of the prior downward channel resistance line.


Market sentiment

Ethereum’s hourly chart technicals signal a strong sell.

Oscillators are on sell, and moving averages are on strong one.


Pivot points

S3 623.96
S2 668.50 
S1 686.78 

P 713.04 

R1 731.32 
R2 757.58 
R3 802.12

XRP/USD

From yesterday’s high at $0.741 which is on the 0.382 Fibo level, the price of Ripple has decreased by 8.92%, coming to $0.674 where it is now sitting.


On the daily chart, things haven’t changed much. The price action is still between 0.236 and 0.382 Fibonacci retracement levels, below 50 day and 100 day EMA’s.


On the hourly chart, we are seeing a breakout from the upward channel from the downside, like in the case of Bitcoin and Ethereum, which shows a strong correlation in the market. The price found temporary support at the levels of the channels starting point.


Market sentiment

Ripple is in the sell zone with hourly technicals signalling a strong sell.

Oscillators are signalling a sell while moving averages a strong one.


Pivot points:

S3 0.56768 
S2 0.63718
S1 0.66337 

P 0.70668 

R1 0.73287 
R2 0.77618 
R3 0.84568

Conclusion


Daily Crypto Market Update: While we have seen a bullish move in a form of upward channels yesterday, today we are seeing a breach from the downside. From this, I conclude that the correction to the downside is continuing and we are in for new lows.


Categories
Crypto Market Analysis

Daily Crypto Update 15.05.2018 – Indecisiveness


General Overview


Market Cap: $406,983,271,081

24h Vol: $22,745,382,371

BTC Dominance: 36.6%

Daily Cryptocurrency Update 15.05.2018

Since yesterday’s low at $386,345,000,000, the Cryptocurrency Market Capitalisation has been increasing rapidly and has reached $413B, from which it has retraced a bit to $407B, where it is now sitting.

As you would presume, the market is in green, with small exceptions on those cryptos that experienced a rise in price while everything was decreasing. Biggest gainers among top 100 are Zcash (44%), Salt (17%), Enigma (16%), and average increase is from 5-12% among the top 100.


News

Top stories that came out in the last 24 hours are extremely positive. These are some of the significant headlines:

HSBC Completes ‘World’s First’ Blockchain Trade Finance Deal, Ships Soybeans

UK-based banking giant HSBC has reportedly completed the world’s first ever trade finance transaction powered by blockchain, the Financial Times (FT) reported today, May 14.

New York City Wants To ‘Lead The Way In Blockchain’, Unveils Industry Initiatives

The President and CEO of the New York City Economic Development Corporation (NYCEDC) announced blockchain-related initiatives for the city today, May 14. The initiatives include the launch of the NYC Blockchain Resource Center and a public competition for blockchain apps to improve the public sector.

Forex Platform Serving Goldman Sachs and Morgan Stanley Adds Crypto Trading

Software developer Kx Systems has launched cryptocurrency trading on its white label forex (FX) trading platform Kx for Flow, the company reported in a blog post May 14. Starting today, Kx for Flow customers are able to conduct spot trading of Bitcoin (BTC), Ethereum (ETH), Bitcoin Cash (BCH), Litecoin (LTC), and Ripple (XRP).

CFO of Australia’s Commonwealth Bank Quits Role To Join EOS Token Developer Block.One

Rob Jesudason, the Chief Financial Officer (CFO) of Australia’s Commonwealth Bank (CBA), has left the bank to join a blockchain company, the Sydney Morning Herald reports May 14. Jesudason resigned with immediate effect in order to become the group president and chief operating officer of blockchain software firm Block.one.

CME Group Launches Ethereum Price Indexes In Partnership With Ethereum Futures Exchange

The Chicago Mercantile Exchange (CME Group) in partnership with Crypto Facilities, a UK-based digital asset exchange specializing in crypto futures, have launched the CME CF Ether-Dollar Reference Rate and Real Time Index, according to an announcement May 14. The indexes will provide users access to a real-time Ether (ETH) price in US dollars.

US: Seminole County Florida To Accept Crypto For Tax Payment

The Seminole County, Florida, tax collector Joel M. Greenberg announced May 14 that the county will begin accepting cryptocurrency for payment for various services this summer in order to eliminate heavy fees and improve payment accuracy and efficiency.

‘Global Blockchain Leader’ At Deloitte Resigns To Join Blockchain-Based Startup

Eric Piscini, former Global Blockchain Leader and Partner at one of the “Big Four” consulting firms, Deloitte, has left the company, Forbes reports May 14. Piscini, who helped build a $50 mln global blockchain practice, is joining the startup Citizens Reserve to move supply chain networks to a blockchain.

Taiwan: Taipei Bank Launches First Blockchain Payment System In The Country

Privately-held Taipei Fubon Commercial Bank has reportedly become the first bank in Taiwan to deploy a blockchain-based payment system, local media Taipei Times reports May 14. The bank announced that it deployed its blockchain-based payment system for restaurants and merchants near the National Chengchi University. Taipei Fubon Bank first revealed its plans to introduce a blockchain-based payment network in March 2017 when it signed a contract with the university to carry out “key technology and engineering R&D for [a] blockchain payment network.”

First Crypto Exchange Using Nasdaq’s Tech Announces Launch, Excluding US Customers

The first cryptocurrency exchange to use US stock market giant Nasdaq’s technology revealed it plans to launch next month in an exclusive with Finance Magnates Monday, May 14. Nasdaq, the second largest stock exchange in world by market capitalization after the New York Stock Exchange (NYSE), is providing the technology to power the new centralized crypto exchange, DX, according to the project’s CEO Daniel Skowronski. Skowronski called the upcoming exchange a “one-stop-shop” for “exchanging fiat and crypto, holding coins and as well as wallet services.”

Source: cointelegraph.com


Analysis


BTC/USD

Since yesterdays low at $8362, the price of Bitcoin has increased to $8726, which is a 4.28% increase.


Looking at the daily chart, we can see that the price is currently below the 50-day EMA with which it interacted with and bounced back, leaving a wick from the upside. Yesterday’s candle closed as a Doji with a higher wick from the downside which indicates buying pressure.


Zooming into the hourly chart, we can see that the price is currently in an upward channel that intersects the downward one. The price has broken the upper resistance line of the downward channel and retested it for support.


Market sentiment

Hourly chart technicals are on neutral.

Oscillators and moving averages are both on neutral.


Pivot points

S3 7381.8 
S2 7995.3 
S1 8333.0 

P  8608.8 

R1 8946.5 
R2 9222.3 
R3 9835.8

ETH/USD

From yesterday’s low at $695, the price of Ethereum increased by 4.71%, going to $728.


On the daily chart, we can see that the price interacted with its 0.618 Fibonacci retracement level yesterday, and has retraced since closing as a shooting star. Today’s candle is currently a doji which means indecision.


As in the case of Bitcoin, the price of Ethereum is in an upward channel on the hourly chart and is currently interacting with the support line.


Market sentiment

Hourly chart technical signal buy.

Oscillators are on neutral, and moving averages are signaling a buy in a 6:8 ratio.


Pivot points

S3 601.44 
S2 659.80 
S1 693.61 

P  718.16 

R1 751.97 
R2 776.52 
R3 834.88

XRP/USD

From yesterday’s low at $0.692, the price of Ripple has increased by 5.56% and is currently sitting at $0.73.


Looking at the daily chart, we can see that the price of Ripple interacted with its support at $0.7 and quickly bounced back, closing on a Doji yesterday. Since then the price is slightly up, as indicated by today’s green candle, but it hasn’t exceeded the 0.382 Fibonacci retracement level which serves as resistance.


Zooming into an hourly chart, we can see the interaction with the 0.382 Fibo level. The price is above 50 and 100 hourly EMA’s which look like they are about to cross in a bullish manner. The price action is currently forming an ascending triangle, which usually means that the price will drop the same hight as the triangle, which would be somewhere around $0.692 in this case.


Market sentiment

Hourly chart technicals signal a sell.

Oscillators are on sell, and moving averages on neutral in a 7:1:7 ratio.


Pivot points

S3 0.59291 
S2 0.65694 
S1 0.69195 

P  0.72097 

R1 0.75598 
R2 0.78500 
R3 0.84903

Conclusion


The corrective move is definitely over, but it may be only the first one, and we are seeing a retracement to the upside before more downfall. I am still bearish until I get a confirmation. And the confirmation would be if we see the evaluation of the cryptocurrency market cap above $470B levels, which would be a higher high than on the March 5. on which this downfall to $250B levels started. There is a lot of indecisiveness in the price action and a lot of uncertainty at the moment.


Categories
Crypto Market Analysis

Daily Crypto Update 14.05.2018 – Is The Correction Over?


General overview


Daily Crypto Update:

Market Cap: $394,117,066,327

24h Vol: $22,301,856,601

BTC Dominance: 36.6%

Yesterday’s cryptocurrency market cap started to rise up steadily from $385,301,000,000 to $410,338,000,000  which was the highest point this morning, after which the evaluation steeply declined to $386,345,000,000.


market cap

The market is currently in a mixture of green and red with a mean of 2% change.


News

There isn’t any significant news that came out during the weekend, but they are all positive in sentiment. These are some of the most significant headlines:

S. Korean Media: Electronics Giant LG Launches Own Blockchain Service ‘Monachain’

LG CNS, a subsidiary of South Korean LG Corporation that supplies information technology services, has recently launched its own blockchain-powered service, local Yonhap News Agency reports Sunday, May 13.

Source: cointelegraph.com


South Korea’s Top Financial Watchdog Joins Probe Into Cryptocurrency Exchanges

South Korea’s top financial regulator the Financial Services Commission (FSC) joined the ongoing probe into local cryptocurrency exchanges Sunday, May 13.

Source: cointelegraph.com


Chris Matta Walked Away from Goldman Sachs Position to Venture Into Cryptocurrency

The cryptocurrency industry attracts talent from all strides of life. Anyone with financial expertise may have a slight advantage to find a job in this booming sector.

Source: newsbtc.com


Another Wall Street Trader Moves to a Cryptocurrency Exchange, Talents Migrate

Wall Street is losing a lot of talented individuals in rather quick succession. Steve Hunt is the latest individual to join this growing list. He is the former CTO of Jump Trading and has been acquired by Kraken, the popular cryptocurrency exchange. It is not the first time talent is poached from Wall Street, nor will it be the last.

Source: newsbtc.com


Commonwealth Bank CFO Leaves Financial Sector in Favour of EOS

The financial sector is slowly becoming a career stepping stone rather than a final destination. A lot of people working in this industry eventually move on to completely different things. This has become especially apparent when it comes to the cryptocurrency industry. The CFO of Commonwealth Bank is now the COO and Group President of the EOS project.

Source: newsbtc.com


Analysis


BTC/USD

From yesterdays opening at $8410, the price of Bitcoin went to $8743 but is now back at the same levels as the opening, decreasing by 0.53% overall.


Looking at the daily chart, we can see that the price is below 0.382 Fibonacci retracement level, and the 50 day EMA.


Zooming into an hourly chart, we can see that the price of Bitcoin is in a downward channel and that the run-up to the $8743 level was stopped because of the channel’s resistance. The price is currently struggling, as indicated by the wicks, to find support below the Fibo level and the channel’s support line.


Market Sentiment

Hourly chart technicals signal a sell.

Oscillators are indicating neutral while moving averages a strong sell.


Pivot points

S3 7703.9
S2 8145.6
S1 8414.6

P  8587.3

R1 8856.3
R2 9029.0
R3 9470.7


ETH/USD

From the yesterday’s opening price, Ethereum has increased by 4.29%, from $674 to $702 where it is now.


On the daily chart, we can see that the price is above the 0.5 Fibo level and the 50, 100 EMA’s which is a bullish sign. What is also significant is that yesterdays candle’s close is above the opening of the candle on 11th of May.


On the hourly chart, the price is sitting on the 50 hours EMA and the wick from the downside indicate buying pressure.


Market sentiment

Ethereums is however still in a sell zone, as hourly chart technicals signal a sell.

Oscillators indicate a buy, and moving averages a strong sell.


Pivot points:

S3 568.58
S2 640.49
S1 684.63

P  712.40

R1 756.54
R2 784.31
R3 856.22


XRP/USD

In the last 24 hours, the price of Ripple has increased by 5.20% coming from $0.675 to $0.711 where it is now sitting.


The daily chart shows us that the price is sitting above the $0.7 support line, but above the 0.382 Fibonacci level and the EMA’s.


The hourly chart paints a clearer picture. The price broke out of the downward channel with a strong momentum from the downside, went back into the channel only to break out off it again, and is now back up for a retest.


Market sentiment

Ripple hourly technicals signal a sell.

Oscillators a buy, and moving averages a sell.


Pivot points:

S3 0.54100 
S2 0.62675 
S1 0.67714 

P  0.71250 

R1 0.76289 
R2 0.79825 
R3 0.88400

Conclusion

Daily Crypto Update: After the initial sell-off, we are seeing the first major stop and a move to the upside from which the prices retraced back slightly. It is uncertain if the correction is over, so we will need to monitor what happens closely at these levels, on which are the prices of the three major cryptocurrencies, but it definitely looks like the first support has been found. Can that support hold the momentum to the downside, we would just have to wait and see.

Categories
Crypto Market Analysis

Correction Almost Over


General overview


Market Cap: $397,806,215,035

24h Vol: $27,157,849,685

BTC Dominance: 37.7%

Daily Cryptocurrency Update: In the last 24 hours, cryptocurrency market cap fell from 440B to 389B with a steep fall.


daily crypto update-11-05-2018

Among the top 100 coins, the average price drop is around 14%.


News

The top stories that came out in the last 24 hours are mostly positive with the dominant topic being an adoption of the blockchain technology.

These are some of the significant headlines  (Green positive, Brown negative):

  1. Ethereum ‘Stakeholders’ Meet To Discuss Governance, Without Vitalik Buterin’s Involvement
  2. Bank Of America CTO Calls Bitcoin ‘Troubling’, Reconfirms Credit Card Purchase Ban
  3. Iran Sanctions: Citizens Use Crypto To Move $2.5 Bln Out Of Country
  4. Robinhood App Raises $363 Mln To Expand Its Zero-Fee Crypto Trading Platform US-Wide
  5. De Beers Tracks Diamonds With Blockchain For The First Time
  6. Dutch Ministry Develops National Blockchain Research Agenda
  7. Kodak Announces Token Offering Goal For Blockchain Image Protection Platform
  8. Ripple Cross-Border Payments Pilot: Financial Institutions Report Significant Time, Cost Savings
  9. Huawei Releases Bitcoin Wallet In App Store, Pre-Installed On All New Smartphones
  10. Nvidia Reports First Quarter Crypto Sales, Expects Two-Thirds Drop In the Second Quarter


Analysis


BTC/USD

From yesterdays opening, the price of Bitcoin has fallen by 6.27% – from $9329 to $8751 where it is now.


Looking at the daily chart we can see that the price has fallen below 0.5 Fibonacci level and the 50 days EMA.


Zooming into an hourly chart we can see that the price is looking for support, and has found one at 0.786 Fibonacci extension level.


Market Sentiment

  • The overall market sentiment for the BTC  is in the SELL zone.
  • Oscillators are in a neutral zone while Moving averages show a STRONG SELL.


Pivot points:

S3   8356.5
S2   8747.4
S1   8882.7

P    9138.3

R1   9273.6
R2   9529.2
R3   9920.1


ETH/USD

In the last 24 hours, the price of Ethereum has decreased by 11% from yesterday’s high at $766 to $682 where is now sitting.


As you can see from the daily chart the price is in a downward trajectory, heading down toward 0.5 Fibonacci retracement level, trying to find support.


On its hourly chart, we can see that, after yesterday’s breakout from the triangle from the upside, the price failed to exceed the $840 level and create new highs, and has dropped significantly, which made the EMA’s cross.


Market Sentiment

  • The overall market sentiment for the ETH  is in the SELL zone.
  • Oscillators are in a neutral, although leaning to the sell zone, while Moving averages show a STRONG SELL.


Pivot points:

S3    645.29
S2    691.64
S1    707.51

P     737.99

R1    753.86
R2    784.34
R3    830.69


XRP/USD

From yesterday’s high, the price of Ripple has fallen by 18%, from $0.81 to $0.667 where it is now.


On the daily chart, we can see that the price fell below 0.382 Fibonacci retracement level, and the support line 2, and is in a downward trajectory heading toward 0.236 level.


On the hourly chart, we can see that the price broke out off the descending channel with strong momentum.


Market Sentiment

  • The overall market sentiment for the XRP  is in the SELL zone.
  • Oscillators are in a sell zone as well, while Moving averages show a STRONG SELL.

Pivot points:

S3   0.64964
S2   0.70799
S1   0.72798

P    0.76634

R1   0.78633
R2   0.82469
R3   0.88304


Conclusion

Daily Cryptocurrency Update: We are seeing the final stages of the correction, but more downside is expected, especially having in mind that the weekend is coming. The prices of the three major cryptocurrencies are looking for support at new lows. For a clearer picture of what’s coming next, make sure to check the weekly update, in which I provide a forecast for the upcoming week.


Categories
Crypto Market Analysis

Cryptocurrency prices looking for support


General overview


Market Cap: $420,694,166,630

24h Vol: $23,401,165,415

BTC Dominance: 36.8%

In the last 24 hours, the cryptocurrency market cap has dropped by approximately 10B, from 430B to around 420B.

cryptocurrency market cap

The valuation is at the same level as it was nine days ago, at the start of the month.

The market is currently in red, with the biggest decrease of around 11% for some cryptocurrencies like Salt, Kyber Network, Ox and Aion. Meanwhile, some cryptos are in the green like Pundi X +25%, Augur +12%, Zilliqua +10.11%.


News

Some of the significant stories that came out yesterday are the following:

Facebook Forms Exploratory Blockchain Team Led By Coinbase Board Member

David Marcus, the head of Facebook’s messaging app Messenger, announced that the social media site is exploring possible applications for blockchain technology, CNBC reported May 8. “I’m setting up a small group to explore how to best leverage blockchain across Facebook, starting from scratch,” Marcus shared in a post Tuesday afternoon on his personal page. Marcus has been leading Messenger for almost four years. In December, he joined cryptocurrency exchange Coinbase as a board member. However, Facebook hasn’t revealed how interested it is in applying blockchain.

Source: cointelegraph.com


Ukrainian Securities Regulator To Consider Crypto As Financial Instrument

The Ukrainian National Securities and Stock Market Commission (SSMCS) will consider recognizing cryptocurrencies as a financial instrument, according to an announcement on the 8th of May. The head of the commission, Timur Khromaev, made the announcement in a Facebook post following the annual conference of the International Organization of Securities Commissions (IOSCO) on Crypto and Initial Coin Offerings (ICOs).

Source: cointelegraph.com


Ex-Goldman Sachs President Says Global Cryptocurrency Will Come, But It’s Not Bitcoin

Gary Cohn, former Goldman Sachs President as well as former chief economic advisor to US President Donald Trump, believes that there will a global cryptocurrency in the future, but it will be a coin “more easily understood” than Bitcoin (BTC), CNBC reports May 8.

Source: cointelegraph.com


Analysis


BTCUSD

From yesterday’s opening until now, the price of Bitcoin has decreased by 3.14% – from $9380 to $9081.


On the daily chart, we can see that the price is currently sitting on a 0.5 Fibonacci retracement level, slightly below the 100-day EMA. This is the fourth consecutive red candle on the daily chart, which indicated that bears are in control.

Zooming into an hourly chart, we can see the interaction with the Fibo level. The price has fallen below it four times, after which it quickly bounced back above it, leaving a lot of wicks. This looks like the price is struggling to find support there, but the bears have more power at the moment.


Market Sentiment

Overall, hourly chart signals a strong sell.

hourly chart signals a strong sell


Pivot points:

S3  8382.3
S2  8808.0
S1  8996.3
P   9233.7
R1  9422.0
R2  9659.4
R3 10085.1


ETH/USD

In the last 24 hours, the price of Ethereum has dropped from $770 to $716, which is a 7% decrease.

Looking at the daily chart, we can see that the price has fallen below the 0.786 Fibonacci level, and is currently looking for support at the prior high of the triangle from which the price broke out, which is around the $710 level. Exponential moving averages are below the price and the 0.618 Fibo level, so the price is likely heading towards them for support.


Zooming into an hourly chart, we can see that the price is ready for another drop.


Market Sentiment

Overall hourly chart signals a strong sell.

ETH hourly chart signals a strong sell


Pivot points:

S3  637.60
S2  692.76
S1  720.35
P   747.92
R1  775.51
R2  803.08
R3  858.24


XRP/USD

Since yesterday’s open, the price of Ripple has dropped by 8.68% going from $0.84 to $0.769 where is currently sitting.


Looking at the daily chart, we can see that the price is currently below the 50-day EMA, which didn’t serve as support, so the price is heading towards the 0.786 Fibonacci retracement level, as it is the next significant level which can serve as support.


Zooming into an hourly chart, we can see that the 0.786 Fibonacci level is crossing over my downward channel support line, which would be a perfect point of reference for a short-term target.


Market Sentiment

Overall, hourly chart signals a sell.

Market Sentiment Overall, hourly chart signals a sell


Pivot points:

S3 0.70279
S2 0.75859
S1 0.78247
P  0.81439
R1 0.83827
R2 0.87019
R3 0.92599


Conclusion

Having three major cryptocurrencies falling below their pivot points, they are now looking for a strong support which can hold back this bear momentum. Even though we can see that this find is almost completed I wouldn’t say this for a correction overall. I am expecting a larger move to the downside in the following days, as buyers were exhausted previously. The only thing that can push prices back up, and past the prior high is some global hype like we have seen in December, so a catalyst is needed.

Categories
Crypto Market Analysis

Correction Is On The Way

General overview

Weekly Crypto Update: At the start of the week, on Monday, April 30. Cryptocurrency market capitalization was around 430B. On the next day, it dropped by 30 billion dollars and has on the rise all the way to 472,272,000,000$ at the highest point on yesterdays open. Since then the evaluation dropped again to 433B where it is now sitting, slightly above the starting point.

Analysis

BTC/USD

From the opening price on Monday, April 30. The price of Bitcoin hasn’t changed much. It is approximately at the same levels, experiencing only a 0.8% decrease from 9396$ to 9322$ where it is now sitting. However, the price experienced new highs, coming to slightly below 10k to 9952$ to be exact on yesterday’s close, but has decreased significantly in the last 24 hours.

Looking at the daily chart we can see that the price broke out of the triangle in which it was consolidating, and went above 0.618 Fibonacci level, retested it for support, but the level didn’t hold. The price is significantly above the 100-day EMA which is a good sign.

Daily chart signals a buy.

Pivot points

S3 7212.3
S2 8384.4
S1 9122.8
P 9556.4
R1 10294.8
R2 10728.4
R3 11900.4

ETH/USD

Since last Monday the price of Ethereum has increased by 5.18% coming from 692$ to 730$ where it is now sitting. Like in the case of Bitcoin the price has increased more, to 837$ on yesterdays close, but dropped significantly in the last 24 hours.

Looking at the daily chart we can see that the price of Ethereum broke out of the triangle on May 3. and went to create higher highs, going slightly above the 2 Fibonacci level, retested it for support, but there was no support there, which made the price go in a downward trajectory.

Daily chart signals a buy, moving averages a strong buy.

Pivot points

S3 353.88
S2 556.46
S1 688.07
P 759.04
R1 890.65
R2 961.62
R3 1164.20

XRP/USD

Starting from last Monday, the price of Ripple has decreased by 4,61% from 0.862$ to 0.818$ where it is now sitting.

The price failed to break the key resistance line at 0.92$ and is currently sitting above 100-day EMA from which it bounced. A lot of sideways movement for Ripple this week, between the key resistance 100% Fibonacci level and the 100 EMA.

Daily chart overall, signals a buy, however, oscillators are on neutral.

Pivot points

S3 0.56663
S2 0.71933
S1 0.81017
P 0.87203
R1 0.96287
R2 1.02473
R3 1.17743

LTC/USD

Litecoin’s price has increased by 4,64% from last week’s opening, coming from 154$ to 161$. The highest point of the week was at 182$ on yesterday’s close and the lowest at 142$ on 1. of May. 

As you can see from this daily chart, the price went above the 1,272 Fibonacci level, but it closed below and is currently below 100%, heading toward 100-day EMA, looking for support.

Daily chart signals a buy, overall.

Pivot points

S3 86.403
S2 127.483
S1 153.147
P 168.563
R1 194.227
R2 209.643
R3 250.723

Conclusion

Weekly Crypto Update: After hitting major resistance lines, four of the major cryptocurrencies are experiencing a pullback, like it was predicted in the last week’s forecast.

Those key resistance’s are correlated with the resistance on the global chart as you can see above.

We are currently seeing a correction, after a runup that lasted from April 9.
Check out the substitutionary video for the forecast for the upcoming week.

©Forex.Academy

Categories
Crypto Market Analysis

Pullback Has Begun

General overview

Market Cap: $435,421,093,161

24h Vol: $22,446,339,237

BTC Dominance: 36.5%

In last 24 hours, cryptocurrency market cap has fallen from 471,210,000,000$ to 435,421,000,000$ where is now sitting.

cryptocurrency market cap

The market is mostly in red, with the average drop in price by 6% for top 100 cryptocurrencies.

News

News that came out in the last 24 hours isn’t responsible for the decrease in market capitalization, as news is mostly positive in nature.

New Head Of South Korean Financial Regulator Notes ‘Positive Aspects’ Of Crypto

The newly appointed governor of South Korea’s Financial Supervisory Service (FSS) said that he sees “some positive aspects” to cryptocurrencies in a press conference today, May 6. The governor also said the FSS will be working on crypto regulatory “issues” in collaboration with other regulators, local news outlet The Korea Times reports.

Source: cointelegraph.com

Azerbaijan’s Taxes Ministry Says Crypto Revenue Is Subject To Taxation

Revenue from crypto-to-fiat transactions will be subject to taxation in Azerbaijan, local news outlet Trend reported Saturday, May 5. Nijat Imanov of the country’s Taxes Ministry outlined the new measures during the second Finance and Investment Forum (FIF 2018) in Baku Saturday.

Source: cointelegraph.com

Japan’s Financial Watchdog Sets Out New Requirements For Crypto Exchanges

Japan’s financial watchdog, the Financial Services Agency (FSA), has laid out yet further regulatory stipulations for domestic crypto exchanges, Cointelegraph Japan reports today, May 6.

Source: cointelegraph.com

“It Never Was a Security”: Ethereum Under The Regulatory Spotlight

The cryptocurrency is subject to a looming enquiry by the US Securities and Exchange Commission (SEC) as well as the Commodity Futures Exchange Commission (CFEC) for its token presale in 2014. According to the Wall Street Journal, regulators are taking a close look at the cryptocurrency and whether it should be classed as a security, as set out in the Securities Act 1933. The major point of concern is the presale of ETH tokens in 2014. In total, 31,000 BTC were raised by the Ethereum Foundation to fund the development of Ethereum – worth around $18.3 mln at the time (and about $300 mln at press time).

Source: cointelegraph.com

Analysis

BTC/USD

From yesterdays opening, the price of Bitcoin has dropped by 6,78% coming from 9960$ to 9286$ where it is now sitting.

Analysis BTC/USD

Looking at the daily chart we can see that the price went above 0.618 Fibonacci level, retested it for support, but it didn’t hold and is now below it. The price is, however, still above the 100-day EMA.

Pullback Has Begun | Forex Academy

Zooming into an hourly chart, we can see the momentum behind the drop, and it was the same strength as the prior rise from the triangle pattern.

Hourly chart signals a sell.

Hourly chart signals

Pivot points

S3 8672.2
S2 9182.2
S1 9420.5
P 9692.2
R1 9930.5
R2 10202.2
R3 10712.2

ETH/USD

In the last 24 hours, the price of Ethereum has dropped by 12,66% coming from 838$ to 733$ where it is now sitting.

Forex Pullback Strategy

Looking at the daily chart we can see that as in the case of Bitcoin, Ethereum’s price has reached the upper Fibo level, before being repealed by it, and is now in a downward trajectory.

Forex Pullback Trading Strategy

Zooming into an hourly chart we can see the similarities with Bitcoin – the momentum is equally strong as is was when the price was rising, and because of this, the head and shoulders pattern is being formed, with the head slightly sticking out from above the 2 Fibonacci level.

That’s why hourly chart signals a sell.

hourly chart signals a sell

Pivot points

S3 629.13
S2 712.33
S1 753.06
P 795.53
R1 836.26
R2 878.73
R3 961.93

XRP/USD

Ripple’s price has dropped by 12,57% coming from 0.926$ to 0.814$ in the last 24 hours.

Forex Pullback Trading Strategy: Pullback Has Begun

On the daily chart, we can see that once again the price failed to break the key resistance level at 0.92, and was repealed by it, pushing it down significantly. It is now sitting at the 100 day EMA which serves as support.

Forex Pullback Trading Strategy: Pullback Has Begun | Forex Academy

Looking at the hourly chart, we can see that the price is at the same levels as it was at the beginning of the three consecutive upward channels, looking for support.

Hourly chart signals a sell.

Hourly chart signals a sell

Pivot points

S3 0.71843
S2 0.79646
S1 0.83029
P 0.87449
R1 0.90832
R2 0.95252
R3 1.03055

Conclusion

As stated in the last daily update on Friday 4. May, the prices have reached the key resistance levels and were likely going the get repealed by them, as the momentum behind the upward move was starting to get exhausted, which could be seen from price action. That was, in fact, the case. After the surge in price, we are experiencing a first serious pullback in the cryptocurrency market.

©Forex.Academy

Categories
Crypto Market Analysis

Reversal has started

General overview

Market Cap: $409,364,645,716

24h Vol: $30,469,124,781

BTC Dominance: 37.3%


In the last 24 hours, the evaluation of market capitalization has dropped from 438B to 404B and has found support at those levels.


News

News that came out in the last 24 hours are mostly regarding governmental relation to cryptocurrencies. Some of the headlines are the following:

US: ICO Market Is Example Of Unregulated Securities Market, Says SEC Commissioner

US Securities and Exchange Commission (SEC) Commissioner Robert Jackson highlighted consumer protection regarding Initial Coin Offerings (ICO) in an interview on CNBC today, April 30.

Source: cointelegraph

Iran: Model Of State-Issued Digital Currency Now Ready, Says Gov’t Minister

An Iranian government minister has confirmed that an experimental model of a domestic digital currency is now ready, Reuters reported Saturday, April 28.

Source: cointelegraph

US Federal Trade Commission To Offer Free Workshop On Crypto Scams

The US Federal Trade Commission (FTC) will be holding a free workshop this summer titled “Decrypting Cryptocurrency Scams” according to a press release published today, April 30.

Source: cointelegraph

Saudi Arabian Communications Ministry Hosts ‘Blockchain Bootcamp’ With ConsenSys

The government of Saudi Arabia completed a “blockchain bootcamp” last week, the Ministry of Communications and Information Technology (MCIT) announced in a press release April 29.

Source: cointelegraph

Analysis

BTC/USD

Crypto Daily Chart

Bitcoins price dropped from 9396$ to 8975$ which is 4,58% decrease from the yesterdays opening. Cryptocurrency daily chart shows us that the price has fallen below 0.5 Fibo level again and the 100 day EMA.

Looking at the hourly chart we can see the momentum behind the drop. The price has fallen below 100 and 50 EMA and is now looking for support.

Hourly chart signals a buy, but it’s more like neutral overall.

Hourly chart signals

Pivot points

S3 1793.1
S2 5135.4
S1 7188.0
P 8477.7
R1 10530.3
R2 11820.0
R3 15162.3


ETH/USD

ETH/USD daily chart

Ethereums’s price also dropped from the yesterdays opening, from 690$ to 658$ which is a 4,66% decrease. Cryptocurrency daily chart is showing the sign of struggle, as indicated by the wick. The price is above 1.616 Fibonacci level and 100 day EMA which is a good sign.

Ethereums's price also dropped

Zooming into the hourly chart we can see the wich being a drop to 632$ after the price quickly bounced back.

crypto hourly chart

Hourly chart signal is leaning to the sell side.

Pivot points

S3 420.56
S2 541.36
S1 612.31
P 662.16
R1 733.11
R2 782.96
R3 903.76

XRP/USD

In the last 24 hours, the price of Ripple has fallen by 7% from 0.86$ to 0.8$ where it is now sitting.

XRP/USD chart

Cryptocurrency daily chart looks bearish, as the price was clearly repelled by 100% Fibonacci level. The price hasn’t fallen below 100 EMA, it touched it and quickly bounced of it as seen from the wick.

Cryptocurrency daily chart - forex.academy

Zooming into an hourly chart we can see that the price broke out of the upward channel in which it was from 25. of April, and is currently below 100 and 50 EMA.

Zooming into an hourly chart

Hourly chart signals a sell

Pivot points

S2 0.29625
S1 0.57893
P 0.77278
R1 1.05546
R2 1.24931
R3 1.72584

Conclusion

I have stated yesterday that if we see a close on the red candle, we are going to see a start of a trend reversal. This is what is happening now, and we can conclude that the downside movement has started.

©Forex.academy

Categories
Crypto Market Analysis

Crypto Trend reversal potentially starting today?

General overview

Market Cap: $430,509,684,622

24h Vol: $31,576,562,200

BTC Dominance: 36.8%


Crypto Trend Reversal Potentially Starting Today?

In the last 24 hours market cap has been struggling to create higher highs. Yesterday’s opening market cap evaluation was 345,980,000,000$ and it rose up to 441,274,000,000$ at the highest point. The second time it rose up it failed to exceed that prior high, coming to 438,6B. It is currently sitting at around 430B.

News

There was no significant news coming out in the last 24 hours. Dominant headlines are mostly analytical in nature.

Crypto Markets Edge Back Into The Green After Mid-Week Correction

Source: cointelegraph

Morgan Stanley Research: Defined Regulations Main Factor For Crypto Exchanges When Choosing Country

Thanks to its well-defined regulatory framework, Malta now accounts for the largest share of cryptocurrency trading volume in the world. This conclusion comes from a Business Insider report Sunday, Apr 29, that cites a recent research done by the Morgan Stanley bank.

Source: cointelegraph.com

BTC/USD Could Break $10,000

Source: newsbtc.com

Analysis

BTC/USD

In the last 24 hours, the price of Bitcoin hasn’t changed much. It went from 9350$ to 9520$ and is now sitting at approximately the same levels as on the start of April 29, which is 9340$.


Crypto Trend Reversal

Looking at the daily chart, we can see that the price action is constrained. Sunday ended on a doji, and we are now seeing the struggle to create higher highs. The price is above 100-day EMA and between 0.5 and 0.618 Fibonacci levels.


The current market sentiment is positive.

market sentiment

Looking at the hourly chart, we can see the sideways price action movement. The price is between 100 and 50 EMA, and it bounces back of the 100 EMA.

Crypto Trend reversal potentially starting

Overall, hourly chart signals a sell.


hourly chart signals

Pivot points

S3 7024.7
S2 8139.9
S1 8742.8
P 9255.1
R1 9858.0
R2 10370.3
R3 11485.5


ETH/USD

In the last 24 hours, the price of Ethereum rose only by 0.5%. The price is currently 686$ which is 4$ more than the yesterdays opening price.

ETH/USD

The daily chart shows signs of a potential reversal. There is a strong resistance at these levels like in the case of Bitcoin. The price is struggling to form higher highs. However, the price is still above 50, 100 EMA and 1,618 Fibonacci level.

The current sentiment is very positive.

current sentiment is very positive

ETHUSD

If we zoom into the hourly chart we can clearly see that the price hasn’t been advancing much to the upside, creating higher lows, but now higher highs. The price bounced off the 50 EMA and is now looking to get beyond the current high.

Overall, hourly chart signals a strong buy.

hourly chart signals

Pivot points:

S3 420.56
S2 541.36
S1 612.31
P 662.16
R1 733.11
R2 782.96
R3 903.76


XRP/USD

Like in the case of Ethereum, Ripple’s price hasn’t changed in the last 24 hours. It is around 0.852$ which is approximately the same as on the yesterdays opening.

XRP/USD

Looking at the daily chart, we observe that the price is still below 100% Fibonacci level, but above its 100 and 50-day EMA which is a bullish sign.

The current market sentiment is positive

current market sentiment is positive

XRPUSD

Looking at the hourly chart, we see that the price is interacting with the 100% Fibo level and is now like in this upward channel which leads to the strongest resistance line. These levels are going to be very interesting to watch, as we can see some crazy influx in volume soon.

Overall, hourly chart signals a sell.


hourly chart

Pivot points

S3  0.29625
S2 0.29625
S1 0.57893
P 0.77278 1
R1 1.05546
R2 1.24931
R3 1.72584


Conclusion

After Sunday ended with a doji on the three major cryptocurrencies that we are covering in this report, I would expect the prices to temporarily reverse. Market cap is showing signs of struggle which is also imprinted in the chart of Bitcoin, Ethereum, and Ripple. If today’s candle closes red, I believe the trend reversal is starting.

©Forex.Academy

Categories
Crypto Market Analysis

Cryptocurrency Market Is On The Rise Again

General overview

Market Cap: $413,692,195,374

24h Vol: $26,702,372,910

BTC Dominance: 37.9%

Since yesterday, cryptocurrency market cap is on the rise again. Market capitalization was  380,513,000,000$ at the lowers point, and it has increased to almost 416B.Cryptocurrency Market Cap Is On The Rise Again

The market is in green, and some of the biggest gainers among top 100 are Siacoin +52% and Bitcoin Diamond 42%. Other cryptos are about 7-9% up on average since yesterday.

News

IBM And Jewelry Industry Leaders To Use Blockchain To Trace Origin Of Diamonds

>Leaders in the gold and diamond industry have partnered with IBM to develop a blockchain network for tracing the origin of finished pieces of jewelry, IBM announced in a blog post-April 26.
Source: cointelegraph.com

Mt. Gox Moves Around $165 Mln In BTC And BCH From Its Wallets
>16,000 Bitcoin (BTC) and 16,000 Bitcoin Cash (BCH) have been moved out of cold wallets associated with the infamous, now defunct Japanese Bitcoin (BTC) exchange MT. Gox today, April 26, according to Mt. Gox cold wallet tracking data on Crypto Ground.

Source: cointelegraph.com

Comcast’s Venture Capital Arm Is Bullish On Bitcoin and Blockchain

>Gil Beyda, managing director of the venture capital (VC) arm of Comcast, appeared on CNBC today, April 26, with a bullish outlook for Bitcoin and real-world applications of blockchain technology

Source: cointelegraph.com

17 Mln Of Total 21 Mln Bitcoins Now Mined In Milestone For Digital Scarcity

>In a round million milestone, 17 mln bitcoins (BTC) have now been mined as of today, April 26, according to data from statoshi.info. Because of Bitcoin’s supply cap of 21 mln, this means that only four mln Bitcoin, or about 19 percent, remain to be mined.

Source: cointelegraph.com


Analysis

BTC/USDBTC/USD

In the last 24 hours, the price of Bitcoin has increased by 5,42% coming from 8750$ to 9200$ where it is now. Looking at the daily chart we can see that the price went above 0.5 Fibonacci level and the 100 day EMA againThe current sentiment for Bitcoin is positive according to sentimnt.io having 74% positive mentions out of 70 in total.

The current sentiment for Bitcoin is positive according to sentimnt.io having 74% positive mentions out of 70 in total.


Bitcoin is positive having 74% positive mentions out of 70 in totalZooming into an hourly chart, we can see that the move to the upside had momentum and that the price has formed a mini cup and handle.

Overall hourly chart signals a buy.

Overall hourly chart signals a buy

Pivot points

S3        6109.5
S2        7355.5
S1        8134.0
P          8601.5
R1       9380.0
R2       9847.5
R3       11093.5


ETH/USD

ETH/USD

Since the start of April 26 until now the price of Ethereum went from 599$ to 651$ which is an 8,45% increase. Looking at the daily chart, we can observe that the price went above 1.618 Fibo level and is now sitting right on it. 100 day EMA is also below serving as support.Ethereum is very positive

The current sentiment for Ethereum is very positive according to sentimnt.io having 82% positive mentions out of 67 in total.

Ethereum is very positiveHourly chart is similar to that of Bitcoin, meaning that the price is forming a mini cup and handle pattern.


Overall hourly chart signals a buyOverall hourly chart signals a buy

Pivot points

S3        324.51

S2        450.42
S1        527.43
P          576.33
R1       653.34
R2       702.24
R3       828.15

XRP/USD

XRP/USD

The price of Ripple has also increased in the last 24 hours and did so by 7,83% coming from 0.772$ to 0.832$. The daily chart is looking bullish, as the price is above 100-day EMA.

The current sentiment for Ripple is negativeThe current sentiment for Ripple is negative, having 61,5% negative mentions out of 13 in total, according to sentimnt.io

RIPPLE


Hourly chart is similar to that of Bitcoin and Ethereum, however, unlike those cryptocurrencies, XRP is below 100 EMA.

Overall hourly chart signals a buy.Hourly chart is similar to that of Bitcoin and Ethereum

Pivot points

S3        0.20439

S2        0.50804
S1        0.68659
P          0.81169
R1       0.99024
R2       1.11534
R3       1.41899


Conclusion

A strong correlation between the three largest cryptocurrencies is shown, meaning that the chart looks pretty much the same. Market capitalization hasn’t exceeded the prior high at around 434B and has formed a mini cup and handle that retraced back to prior lows for a retest of support. In the next 24 hours, we are going to monitor what is going to happen but, I am expecting a new influx of money into the market, which will push the evaluation further to breakout and form new highs above 434B evaluation.

©Forex.Academy

Categories
Crypto Market Analysis

Is The Crypto Market Sell-Off Natural?

If you read all the analysis/trade setups in the Crypto Picks section, you’ll notice that I’ve talked about a temporary rebound and about a corrective phase after the last day’s impressive rally.

Technically, today’s aggressive drop was somehow expected because the major cryptocurrencies have reached very strong upside obstacles.

Cryptocurrencies – a new generation of speculative assets

Personally, I’m not surprised by the current sell-off as the cryptocurrencies are very volatile and you should be very careful when you trade or invest in them. Cryptocurrencies are representing the next generation of speculative assets, and they should be treated accordingly.

I’ve seen today all sorts of reasons why the cryptocurrencies have dropped. Most of the specialists have talked only about fundamental reasons. I want to show you the technical factors and reasons why the major cryptocurrencies have dropped today.

Is The Crypto Market Sell-Off Natural | Forex Academy

Source: investing.com

I’ve selected the most important three cryptocurrencies because these are leading the crypto market. Bitcoin dropped by 2.28%, Ethereum by 10.73% and the Ripple by 14.50% at this moment, but this drop could be only temporary if the near-term support levels will hold and will stop the bearish momentum.

Bitcoin (BTC/USD)

Crypto Market Sell-Off

Bitcoin drops after the yesterday’s impressive rally and could invalidate a further increase at this moment. It has found strong resistance right above the 350% Fibonacci line (descending dotted line), above the 23.6% retracement level and above the 50% Fibonacci line. A minor decrease was somehow expected after the breakout above the WL2 of the descending pitchfork. So, a false breakout above the mentioned resistance levels will send the rate down again in the short term as expected.

Only a valid breakout above the  50% Fibonacci line, the 350% Fibonacci line, and the 23.6% level will really confirm a broader upside movement towards the 12000 and 15000 levels.

Ethereum (ETH/USD)

Ethereum (ETH/USD) - Forex.Academy

ETH/USD plunged after the false breakout above the 150% Fibonacci line. Price is pressuring the 50% Fibonacci line and could drop towards the 565.44 static support and towards the upper median line (UML).

The crucial downside obstacle is represented by the lower median line (lml) of the ascending pitchfork. Only a breakdown below it will invalidate a further increase on the Daily chart. A corrective phase was expected after the impressive rally and after the breakout above the upper median line (UML) of the descending pitchfork.

Ripple (XRP/USD)

Ripple (XRP/USD)

The Ripple registered a massive drop today but will be very important where will close the trading session. It has dropped as much as 0.49010, but it has squeezed in the last hours and now is trading at 0.79212.

Yesterday’s false breakout above the 23.6% retracement level and above the 50% Fibonacci line has sent the rate down. This is the second false breakout above the 50% Fibonacci line signaling a major exhaustion.

Conclusion

Technically, the major cryptocurrencies have reached some very strong supply areas and now could come down to test and retest the downside obstacles. The rates could decrease and could also start a sideways movement because they need to recapture more bullish energy before will really start a medium to the long-term upside movement.

©Forex.Academy

Categories
Crypto Market Analysis

Pullback In The Crypto Market Has Begun

General overview

Market Cap: $407,231,674,925

24h Vol: $36,479,367,950

BTC Dominance: 39.1%

In the last 24 hours, cryptocurrency market cap evaluation went from $400B to just slightly below  $437B at the highest point, and is now 30 billion dollars less, sitting at around $407B.


Pullback In The Crypto Market Has BegunThe market is mostly in the red, with the numbers being from -0.38% for ZRX and -0.31 for Ontology to the most prominent loser among top 100 Bytom -17%. However there are some gains today, for example, Decred rose up by 27% followed by Tron whose price has increased by 21% in the last 24 hours.

News

Most talked about news in the last 24 hours is MyEtherWallet DNS hack, and for a good reason, people who have their funds stolen wanted to make sure others wouldn’t.

MyEtherWallet Warns That A “Couple” Of Its DNS Servers Have Been Hacked

Cryptocurrency wallet MyEtherWallet (MEW) tweeted a warning that a “couple” of its DNS servers have been hacked and users risk being redirected to a phishing site this morning, April 24. MEW is now in the process of verifying which servers have been targeted and is working to resolve the hack “asap,” they added.

Source: cointelegraph.com

Other news is either analytical in nature or just not relevant as a catalyst for impacting the market.

Bitcoin Price Will Top $11,500 Soon, Says Crypto Bull who Predicted Recent Crash And Rally

Bill Baruch, a cryptocurrency bull who foresaw both bitcoin’s recent slump and ensuing rally, has set a near-term bitcoin price target of $11,500 to $11,800. Baruch, the president of Blue Line Futures, has a pretty good track record for bitcoin price predictions. In February 2018, when BTC plunged to $7,200 during the market correction, Baruch confidently forecast that bitcoin would return to $10,000.

Source: ccn.com

MIT Publishes a Plan to ‘Destroy’ Bitcoin

The MIT Technology Review has a plan — or three — to take down Bitcoin. Writing in an article titled “Let’s Destroy Bitcoin,” tech writer Morgan Peck presents three scenarios that she believes could lead to Bitcoin’s eventual demise.

Source: ccn.com

Snoop Dogg to Perform at Ripple’s Blockchain Week NYC Party

Distributed ledger startup Ripple is hosting a VIP gathering featuring Snoop Dogg – and will be giving away 10 tickets to the event on Twitter.The company announced Tuesday that Snoop would perform at its XRP Community Night during Blockchain Week NYC in May. The event itself will celebrate the company’s work to date in developing its XRP token and the accompanying ledger technology.

Analysis

BTC/USD

In the last 24 hours the price of Bitcoin went from 8911$ to 9700$ which is 9,31% increase, but since the price reached the highest point, it has retraced to 9380$ where is now sitting.

Analysis BTC/USD

Looking at the daily chart, we can see that the price has created a higher high exceeding the levels of the price of the lower high, which is a bullish sign. The price has pulled back to the 0.786 Fibonacci level, but its still over the 100-day EMA.


The current market sentiment is slightly positive, meaning out of 199 mentions in total 65.33% are positive.

Bitcoin price sentiment is slightly positive

Source: sentimnt.io
current market sentiment is slightly positive

Zooming-in to the hourly chart we can see that the price has pulled back to the 50 EMA which held the price as well as the significant Fibo level.

Overall, hourly chart signals a buy.

 hourly chart signals

Pivot points

S3 6109
S2 7355
S1 8134

P 8601
R1 9380
R2 9847
R3 11093

ETH/USD

In the last 24 hours, Ethereum’s price changed only by +2.7%. However, the price went all the way up to 710$ before falling back to the levels at which is now sitting, just slightly above 660$.

ETH/USD

Looking at the daily chart, we can see that the price is still above 100-day EMA and 1.618 Fibonacci level.

The current sentiment for Ethereum is positive, meaning out of 98 mentions in total, 77,5% are positive.

 sentiment for Ethereum is positive

Source: sentimnt.io
Ethereum is positive

Looking at the hourly chart, we can observe the interaction with the 1.618 Fibonacci level better. The price went below it and is now retesting it from the other side. Also on this chart, we can see that the price has fallen to the 100 EMA which served as support.


Overall, hourly chart signals a sell.

Overall, hourly chart signals a sell

Pivot points

S3 324
S2 450
S1 527
P 576
R1 653
R2 702
R3 828


XRP/USD

In the last 24 hours, Ripple’s price has dropped by 5,8%.  Ripple opened at 0,87$, rose up to 0.96$ before falling down to the lower point from yesterday’s open at 0.82$.

XRP/USD

Looking at the daily chart we can see that the price of Ripple is on the downward trajectory, but its held by 100% Fibonacci level. The price is likely going to fall back to somewhere around the levels of the 50-day EMA and the blue support line at approximately 0.7$


The current market sentiment for Ripple is positive, meaning 79% out of 73 mentions in total are positive.

Ripple is positive

Source: sentimnt.io

XRPUSD-

Looking at the hourly chart, we can see that the price has begun falling steeply, going below 50 and 100 EMA and the 100% Fibo level.

Overall hourly chart signals a sell.

hourly chart signals

Pivot points:

S3 0.20439

S2 0.50804
S1 0.68659
P 0.81169
R1 0.99024
R2 1.11534
R3 1.41899

Conclusion:

The highly anticipated pullback in the crypto market has begun. This is only a short-term pullback, to retest prior levels for support. How low will it go? I wouldn’t be surprised to see market capitalization at around 350B again, but we will have to wait and see.

©Forex.Academy

Categories
Crypto Market Analysis

Crypto Market Close to Consolidation or a Pullback

General overview

Market Cap: $420,627,984,827

24h Vol: $27,680,549,243

BTC Dominance: 37.4%

Crypto Market Consolidation

In the last 24 hours market cap has been rising and the rising, all the way from 388B to around 420B where is now sitting. 

total market cap - global charts

This new high exceeds the level from which the market cap evaluations was 7. March which is a good confirmation that the uptrend has begun.

Crypto Market Consolidation News:

News that came out in the last 24 hours is very positive, and leaning towards cryptocurrency adoption and acceptance.

Chinese Gov’t Reiterates Strict Stance On Crypto, Focuses On Illegal Fundraising

The Chinese government has recently reiterated its negative stance towards Initial Coins Offerings (ICOs) and cryptocurrency exchanges at a news conference in Beijing, claiming that financial authorities will continue to monitor private lenders’ interest rates, securities companies, and futures firms to combat illegal fundraising, Reuters reports April 23.

Source: Helen Partz, April 24, cointelegraph.com

U.S. Court Rules Money Laundering-Related Case Against Coinbase Must Have Public Trial

A U.S. federal court has ruled that law firm Silver Miller’s money laundering-related class action lawsuit against crypto exchange and wallet  must be held in open court as opposed to a private arbitration boardroom, Silver Miller attorney David Silver told Cointelegraph in an email today.

Source: Molly Jane Zuckerman, April 24. Cointelegraph.com

California State Senator Promotes Blockchain Bill For Recording Stock Information

Last week, Senator Bob Hertzberg (D), who represents California’s 18th Senate District, advanced legislation permitting Blockchain technology for certain business practices, financial information platform Equities.com

Source: Ana Alexandre, April 24. Cointelegraph.


Analysis

BTC/USD

In the last 24 hours, Bitcoin’s price went from 8800$ to 9250$ which is approximately 5% increase.

BTC/USD

Looking at the daily chart, we can see that the price has gone above 100-day EMA and is now interacting with 0.786 Fibonacci level.

The current sentiment for Bitcoin is positive.

Bitcoin is positive

Source: sentimnt.io

forex academy diagram

On the hourly chart, we can see that the price is experiencing selling pressure, but it’s still holding strong at these levels.  

Overall hourly chart signals a buy.

Overall hourly chart signals a buy

Pivot points:

S3 6109.5
S2 7355.5

S1 8134.0

P 8601.5

R1 9380.0
R2 9847.5
R3 11093.5

ETH/USD

ETH/USD

In the last 24 hours, Ethereum’s price increased by 9.35%, coming to 678$ from 617$ where it was yesterday.

On the daily chart, we can see that the price went over the 100-day EMA and the 1.618 Fibonacci level.

The current market sentiment is positive, meaning that out of 96 mentions in total, 78% are positive.

eth current market sentiment

eth chart

Looking at the hourly chart, we can see that there’s a lot of momentum behind this move and that the price is far from EMA’s.

hourly chart

Overall hourly chart signals a strong buy.

Pivot points:

S3 324.51

S2 450.42
S1 527.43
P 576.33
R1 653.34
R2 702.24
R3 828.15


XRP/USD

Ripple has been the first among three cryptocurrencies that are covered in this report to advance upward in price. In the last 24 hours the price increased by 5,2% coming from 0.855$ to 0.9$ where is now sitting.

XRP/USD

The daily chart shows that the price was held by the 100% Fibonacci level since yesterday but hasn’t made new highs which is a sign of struggle.

The current sentiment is very positive, however, there are only 29 mentions in total.

ripple chart

Source: sentimnt.io 

Zooming into the hourly chart we can see why the price has struggling to make new highs, it was trapped in a triangle but has breached out since to the upside.

ripple hourly chart

Overall, hourly chart signals a buy.

hourly chart signals

Pivot points:

S3 0.20439
S2 0.50804
S1 0.68659
P 0.81169
R1 0.99024
R2 1.11534
R3 1.41899

Conclusion

After a higher high has been made on the global chart and seeing how much price’s of three major cryptocurrencies have risen over the last days hitting key resistance levels, a Crypto market consolidation or a pullback is near. Before advancing further prices have to stabilize and retest prior resistance for support, like in the case of Ripple.

©Forex.Academy

Categories
Crypto Market Analysis

Market Is Moving Strong But For How Long?

General overview

Market Cap: $393,028,123,788

24h Vol: $21,794,182,916

BTC Dominance: 38.2%

During the weekend evaluations of the cryptocurrency market capitalization went from 395,120,000,000$ to 367,852,000,000$ on Saturday, and has been rising steadily since then, coming at around 393 billion dollars where is now sitting.

cryptocurrency market capitalization

News

There is no significant news that can impact the market. Most dominant headlines are about the percentage gains made by cryptocurrencies and are mostly optimistic in sentiment.

Bitcoin Brushes $9,000 As Crypto Markets Continue Making Steady Gains

Bitcoin (BTC) is on the cusp of $9,000, and Ethereum (ETH) is over $630, as the crypto markets continue to climb upwards today, April 22, according to data from Coin360.

Source: Molly Jane Zuckerman, April 22. cointelegraph.com

Buyers Control the Cryptocurrency Market More Than Any Time Since March 2017

The percentage of cryptocurrency traders ‘in the buy’ has reached the highest level in over a year, a strong sign that the market’s two-week recovery has more room to grow.

Source: Sam Bourgi, Aprill 22. hacked.com

This kind of news may impact the market positively because investors may be grabbed by their attention.

Analysis

BTC/USD

BTC/USD

In the last day, the price of Bitcoin has been stagnating at around the levels of the prior high on March 20-24. As you can see from the daily chart, 22. April candle was a doji, and the price has been held by 100-day EMA.

market sentiment for Bitcoin

The current market sentiment for Bitcoin is positive, meaning out of 150 mentions in total 74% are positive.
Source: sentiment.oi


Bitcoin is positive,

Looking at the hourly chart, we can see that the price has bounced off the 50-period EMA and is now looking to potentially cross it below, to retest the 100 EMA before advancing further to the upside.

Overall hourly chart signals a buy.

hourly chart

Pivot points

S3 6109
S2 7355
S1 8134
P 8601
R1 9380
R2 9847
R3 11093


ETH/USD


ETH/USD

Since yesterday the price of Ethereum has been rising from 594$ to 642$, and it retraced since to 634$. Looking at the daily chart, we can see that the price is held back by 100 day EMA, but it’s on a steep upward trajectory.

Ethereum has been rising

The current sentiment is positive, meaning out of 50 mentions in total 78% are positive.

Source: sentiment.io


 sentiment is positive

Looking at the hourly chart, we can see that the price is almost going to hit 1.618 Fibonacci level, which in combination with the 100-day EMA on the daily chart is going to serve as a strong resistance.

Overall, hourly chart signals a buy.

hourly chart signals a buy

Pivot points:

S3 324
S2 450
S1 527
P 576
R1 653
R2 702
R3 828


XRP/USD

XRP/USD

In the last 24 hours price of Ripple is stagnating on the same levels around 0.86$. As you can see from this daily chart, the price went above 100-day EMA and 100% Fibo level. Since then it has fallen back to exactly to the Fibo level to retest it for support.

The current market sentiment for Ripple is positive, meaning out of 70 mentions in total, 75% are positive.

Source: sentiment.io
Ripple is positive

FOREX ACADEMY

Looking at the hourly chart, we can see the interaction between the Fibonacci level and the 50 EMA.

Overall, hourly chart signals a sell.

hourly chart signalsPivot points:

S3 0.20439
S2 0.50804
S1 0.68659
P 0.81169
R1 0.99024
R2 1.11534
R3 1.41899


Conclusion

After the market experienced a run-up, the prices are starting to get held back from advancing further, by first stronger resistance served by 100-day EMA’s and significant Fibonacci levels. Will the price breach out to the more upside, or retrace back to retest prior support we will just have to wait and see. However, Ripple can offer some clues on what is likely going to happen, as Ripple was the first cryptocurrency that showed advancement in this upward move.


© Forex.Academy

Categories
Crypto Market Analysis

Ripple Further Increase Expected

Ripple (XRP)

Market Cap. $28 179 718 865

Volume (24h) $754 165 000

Circulating Supply: 39 122 794 968 XRP

Total Supply: 99 992 362 643 XRP

Max Supply: 100 000 000 000 XRP


The Ripple XRP has finally managed to jump above the short-term downtrend line. The crypto has lost the bearish momentum, so the current rebound was natural and expected.

Ripple XRP Price Predictions April 2018

XRP/USD retested the broken downtrend line and now is pressuring the 0.71192 static resistance. Maybe some of you have already entered long on Ripple after the breakout above the downtrend line. Personally, I’m waiting for a valid breakout above the inside sliding parallel line (sl1) to be sure that the rate will really move towards new highs.

It seems like that the major corrective phase is completed, but we still need a confirmation that the Ripple XRP will start a broader upside movement.

A valid breakout above the sliding line (sl1)  and above the 0.80000 level will signal a further increase towards the median line (ML) of the ascending pitchfork. The major upside target will be at the upper median line (UML).

The perspective is bullish on the short term as long as the rate stays above the downtrend line and most important above the outside sliding parallel line (sl) of the ascending pitchfork.

Ripple XRP Predictions April 2018

XRP/USD slipped lower to test and retest the 0.70835 broken resistance. A failure to make a valid breakout above the sliding line (sl1) will signal a minor exhaustion. Price could come back to test and retest the lower median line (LML) or the outside sliding (sl) before will give birth to a larger bullish movement.

Note: if you want to go long on the XRP/USD you should place a Stop Loss somewhere below the outside sliding line (sl). You can place it somewhere below the 0.53550 to be safe if the rate will come down a little.

Categories
Crypto Market Analysis

Cryptocurrency market is starting to gain confidence

General overview

Market Cap: $343,721,340,582

24h Vol: $20,346,209,841

BTC Dominance: 40.3%

Global market cap charts

In the last 24 hours, new 20B have entered the market. Market capitalization has been steadily rising as you can see from the chart.  

News

News that came out is mostly around cryptocurrency use cases and adoption which is extremely positive. Most significant headlines are the following:

NASA Funds Development Of Autonomous Spacecraft That Uses Blockchain

The National Aeronautics and Space Administration (NASA) has awarded a new grant that supports the development of an autonomous spacecraft that could make decisions using Blockchain technology without human intervention, news outlet Space.com reported April 18.

Source: Ana Alexandre, April 18. Cointelegraph.com

IBM And Salon Media Pilot Blockchain Project To Prevent Fraud In Advertising Industry

IBM and Salon Media are piloting a proof-of-concept Blockchain product created by AdLedger, a nonprofit consortium that develops shared ledger technologies for the digital advertising market, Marketing Dive reported April 18.

Source: Marie Huillet, April 18. Cointelegraph.com

US Stablecoin Project Basis Raises $133 Mln From Major VC Firms

The US-based Blockchain project Basis (formerly known as Basecoin), which claims to provide a non-volatile cryptocurrency or stablecoin, has recently raised $133 mln in funding from big name investors, according to an official blog post published today, April 18.
Source: Helen Partz, April 18. Cointelegraph.com

Hedge Fund Och-Ziff Exec Leaves Wall Street To Become Coinbase CFO

The Chief Financial Officer (CFO) at Wall Street’s Och-Ziff Captial Management (Oz Management) has left to become the new CFO at major crypto wallet and exchange service Coinbase, according to Coinbase’s blog post published yesterday, April 17.

Source: Molly Jane Zuckerman, April 18. Cointelegraph.com

China’s Telecom Giant Huawei Launches Blockchain-As-A-Service Platform

Chinese telecommunications giant Huawei revealed its latest Hyperledger-fuelled Blockchain offering at a conference in Shenzhen Tuesday, April 17. The Blockchain-as-a-Service (BaaS) tool, which comes a month after the release of Huawei and Hyperledger’s joint project Caliper, will be known as the decidedly low-key “Blockchain Service.”

Source: William Suberg, April 18. Cointelegaph.com

Energy Giant BP Says It’s Tested ‘Internal’ Tokens

Energy giant BP would consider partnering with blockchain startups that are doing initial coin offerings, and it’s even tested tokens internally, an executive said Wednesday. Speaking at the Blockchain Expo in London, Julian Gray, the technology director for BP’s digital innovation organization, voiced a common theme: non-financial enterprises are perhaps more open to open-blockchain innovation than their financial-services counterparts.

Source: Ian Allison, April 18. Coindesk.com


Analysis

BTC/USD

Analysis BTC/USD chart

In the past 24 hours, Bitcoin is up around 3,55%, coming from slightly below 8000$ to around 8200$ where is now sitting. Looking at the daily chart we can see that support has been retested, and it held up pretty good.

Bitcoin is up around 3,55%

The current market sentiment for Bitcoin is slightly positive, meaning 65% out of 297 mentions in total are positive.

Source: sentiment.io

market sentiment for Bitcoin

Zooming into the hourly chart we can see that another short-term support has been crossed and that the price is sitting just above it. A lot of wicks on these candles are formed, which means that there’s a lot of pressure from both sides.

Overall, hourly chart signals a buy.

hourly chart signals a buy ETH/USD

Pivot points:

S3 4361
S2 5990
S1 6997.9
P 7619
R1 8626
R2 9248
R3 10877

ETH/USD

ETHUSD chart - forex academy

In the past 24 hours, Ethereum’s price is up by 6,37% coming from 501$ to 536$ where is now sitting. Looking at the daily chart we can see that the price is above the 1,272 Fibonacci level which is serving a support.

Current ETH sentiment is positive, meaning 74% of 171 mentions in total are positive.

Source: sentiment.io

Ethereum’s price is on an upward channel, and is now interacting with the upper line of the channel.

Looking at the hourly chart, we can see that Ethereum’s price is on an upward channel, and is now interacting with the upper line of the channel.

Overall, hourly chart signals a buy.

hourly chart signals XRP/USDPivot points:

S3 183.46
S2 327.57

S1 415.01
P 471.68
R1 559.12
R2 615.79
R3 759.90

XRP/USD

XRPUSD

In the past 24 hours, Ripple is up by around 8%, coming from 0.657$ to 0.7$ where is now sitting. Looking at the daily chart, we can see that the price has been repealed by the 0.786 Fibonacci level.

Ripple is up by around 8%, coming from 0.657$ to 0.7$ The current market sentiment for Ripple is positive, meaning 87,88% of 66 mentions in total are positive.

Ripple is positive, meaning 87,88% of 66 mentions in total are positive.

If we look into the hourly chart, we can see that the price has breached out of the triangle and is now sitting at the support line which is in the same levels as the starting point of the triangle.

Overall, hourly chart signals a buy.

Pivot points - forex academyPivot points:

S3 0.13715

S2 0.37215
S1 0.50608
P 0.60715
R1 0.74108
R2 0.84215
R3 1.07715


Conclusion

Yesterday’s pullback has been completed, and market capitalization is on the rise again. All three of the coin are testing their recent support levels so that the price can go further up. Having said that and, being that news is extremely positive, the market is starting to gain newly found confidence.   

Categories
Crypto Market Analysis

Ripple Breakout In Play

  • Ripple breakout needs confirmation.
  • ETP/USD still under pressure.
  • EOS could resume the short-term rebound.


The major cryptocurrencies have found a temporary resistance in the yesterday’s trading session and have slipped lower. Bitcoin, Ethereum, Ripple are still expected to climb much higher in the upcoming period, despite the minor retreat. I’ve said in the yesterday’s daily report that the main cryptos could come back down to test and retest some support levels before will start to increase again.

Ripple

The coin changed little in the early morning, but this decrease is natural after the breakout above a dynamic resistance. Ripple is trading at 0.65254 right now and could register an impressive upside movement after the integration with banks and traditional financial institutions.

Ripple dropped by 2.62%, but personally, I’m still expecting to see a bullish momentum soon as the rate has managed to jump in the buyer’s territory.

Ripple breakout in play

Price has finally managed to break out above the downtrend line. However, the breakout needs confirmation because this could be a false one if the rate will drop significantly in the upcoming hours.

Ripple increased in the last days from the 0.45410 low and after the minor accumulation. It is premature to talk about a larger upside movement as long the Bitcoin and Ethereum are still sluggish.

The rate is trading much above the 0.57210 static support (resistance has turned into support) and above the lower median line (lml) of the ascending pitchfork. Ripple could come back down to test the lower median line (lml). A rejection from this dynamic support or a false breakdown will send the rate towards the median line (ml). Minor resistance could be found at the downside 50% Fibonacci line as well. You should know that the perspective remains bullish on the short term as long as the rate remains within the ascending pitchfork’s body.

EOS/USD

The EOS increased by 4.12%, reaching the $8.60 again after the minor corrective phase. We have a $6 866 517 270 market capitalization and a $626 057 000 daily trading volume. The crypto could become strongly bullish soon.  We may have a great trading opportunity on the EOS/USD if the price will have enough directional energy to stabilize somewhere above the 10.00 psychological level.

EOS/USD - Forex Academy

EOS/USD rallied today and reached the median line (ml) of the ascending pitchfork. It has come down to retest the broken upper median line (UML) of the major descending pitchfork and now tries to resume the upside movement.

A valid breakout above the median line (ml) and above the 9.00 psychological level will signal a further increase. Technically, it will be expected to climb towards the upper median line (uml) if it will close above the $10 level. EOS could find temporary resistance at the 50% Fibonacci line and at the 150% Fibonacci line.

ETP/USD

Metaverse increased by 57.52% in the last 7-days, but unfortunately, it remains under some selling pressure. Price failed to reach and retest two important resistance levels and now slipped below the 1.00 psychological level.

ETP/USD - Forex Academy

ETP/USD registered humble gains today and could resume the yesterday’s bearish candle. Price moves in a range between the 0.5705 and 1.1105 levels. It has failed to reach the lower median line (lml) and the 1.1105 level, signaling a minor exhaustion and a potential drop.

Only a valid breakout from the minor sideways movement and above the lower median line (lml) will confirm a significant increase.

Conclusion

XRP/USD, EOS/USD and the ETP/USD have decreased in the yesterday’s trading session and now are fighting hard to stay higher. We need confirmations all the analyzed crypto pairs before we can say for sure that the rates will reach fresh new highs.

© Forex.Academy

Categories
Forex Market Analysis

Consolidation In The Crypto Market

Cryptocurrencies have been stagnant and without many big moves to either side. The reason for that is the uncertainty abbot what happens on the tax day. We see less movement in crypto because, whoever wanted to pull their money out before tax date, did already, and we now see only people that hold.

BTC/USD consolidating

After the recent spike due to positive fundamental news (approval of the Muslim community), Bitcoin has its momentum slowed down. It made an attempt over an 8230 Fibonacci retracement line of resistance, but failed and is now consolidating and going slightly downwards, with decreasing volume. The price range is currently between the 50 EMA and 100 EMA on the 1h time frame.

crypto consolidation

NEO/USD bouncing off the resistance line

As we have concluded in the last analysis, neo was in a tough spot, and the most likely thing that would happen to it was the bounce off the red resistance line (shown in the graph). That is exactly what happened to it. This is a big deciding point for NEO, as indicators are “fighting” for the range and the direction of the next movement. RSI just left overbought, volume is declining, and there is a major resistance on the upside, but there are also both EMAs as support, they crossed each other, signaling a bull trend. I am more inclined towards the bear side for a bit until all the indicators get in line.

NEO/USD bouncing off the resistance line

XRP/USD forming a triangle pattern

XRP has recently spiked, after the big announcement that regarded cooperation with Apple. When that happened, XRP spiked up and broke the $0.63 resistance line, which has now become support. It bounced off of it a couple of times, forming a perfect triangle pattern, with the expected breakout from the pattern around the 19th or 20th of April. It will most likely be an upwards move, but it can’t be said with certainty. EMAs and the support line form a “defense” against triangle patter break downwards, but ultimately, people will decide.

XRP/USD forming a triangle pattern

Final word

Markets are mostly consolidating since these are uncertain times fundamentally. Everyone is waiting for a catalyst, for a reason to re-enter the market. The next few days will determine the overall short-term trend of the market, so watch out for the swing trades for now. One thing is good, and that is the increasing volume in the general crypto market.

© Forex.Academy

Categories
Crypto Market Analysis

Market Capitalization Sligthly Up

General overview:

Market Cap: $327,852,350,305

24h Vol: $15,480,704,734

BTC Dominance: 42.1%

Total Market Capitalization

In the past 24 hours market capitalizations went up from slightly below 322B to around 338,703,000,000$. Currently, it is sitting around 329B.

News:

There was no significant news in the past 24 hours. However, three major headlines have stood out.


Lithuanian Central Bank Initiates Dialogue On Crypto Between Banks, Regulators, Traders

The Bank of Lithuania has reportedly begun looking into cryptocurrencies, initiating a dialogue between commercial banks, government regulators, and crypto traders, local news outlet.

Source: Molly Jane Zuckerman, April 16. cointelegraph.com

Malta Regulator Seeks Feedback On Proposed Crypto Financial Instrument Test

The Malta Financial Services Authority (MFSA) has released a consultation paper on the possible introduction of a “Financial Instrument Test” that would legally define virtual tokens, according to an April 13 announcement on their site.

The Financial Instrument Test, first proposed in a Nov. 30 paper on Initial Coin Offerings (ICO), virtual currencies, and related service providers, would determine whether a Distributed Ledger Technology (DLT) asset falls under EU and traditional financial regulations or Malta’s proposed Virtual Financial Assets Act (VFAA).

Source: Molly Jane Zuckerman April 16, cointelegraph.com

Mastercard Eyes Blockchain for Fighting Fake Identities

A newly published patent filing from Mastercard suggests that the payments giant is looking at blockchain as a way to safeguard identity data. In an application released by the U.S. Patent and Trademark Office (USPTO) last Thursday, Mastercard describes a system in which a semi-private or private blockchain would be used to receive and store identity data, the pieces of which could include a “name, a street address, tax identification number” and more.

Source: Annaliese Milano, April 16. Coindesk.com

Analysis

BTC/USD

BTC/USD chart

In the last 24 hours, Bitcoins price went from 8060$ to 8383$, and it has retraced since to 8042$ where is now sitting which is 3.62% drop. Looking at the daily chart, we can see that the price is still above the 0.618 Fibo level which is a good sign.

The current sentiment for Bitcoin is very positiveThe current sentiment for Bitcoin is very positive, meaning that 80% of the total 200 mentions are positive.
Source: sentiment.io

Bitcoins price went from 8060$ to 8383$

Zooming into the hourly chart, we can see that the price is finding support and is now resting at the levels of prior resistance.

hourly chart signals a sellOverall, hourly chart signals a sell

Pivot points:

S3 4361.0
S2 5990.0
S1 6997.9
P 7619.0
R1 8626.9
R2 9248.0
R3 10877.0

ETH/USD

Ethereum’s price went from 504$ to 533$

In the last 24 hours, Ethereum’s price went from 504$ to 533$ and has since pulled back to 507$ where is now sitting.

sentiment for Ethereum is positive meaning 75% of 136 mentions in total are positiveCurrent sentiment for Ethereum is positive meaning 75% of 136 mentions in total are positive.
Source: sentiment.io


price found resistance at the 1,272 Fibonacci level

Looking at the hourly chart, we can see that the price found resistance at the 1,272 Fibonacci level.

hourly chart signals

Overall, hourly chart signals a sell.

Pivot points:

S3 183.46
S2 327.57
S1 415.01
P 471.68
R1 559.12
R2 615.79
R3 759.90

XRP/USD

XRP/USD

Ripples price went from 0.64$ to 0.69$ and it has pulled back since to 0.65$ in the last 24 hours. Looking at the daily chart we can see that the price is heading down towards 0,618 Fibonacci level for a retest.

current sentiment is positiveThe current sentiment is positive, meaning 75% of 64 mentions in total are positive.
Source: sentiment.io

Ripples price went from 0.64$ to 0.69$
Zooming into an hourly chart we can see that the price has formed a rising wedge, from which is likely going to breakout downwards.

hourly chart signals a sell - forex academyOverall, hourly chart signals a sell.

Pivot points:

S3 0.13715
S2 0.37215
S1 0.50608
P 0.60715
R1 0.74108
R2 0.84215
R3 1.07715


Conclusion

All of the crypto pairs are pulling back after the price surge that we’ve seen in the last couple of days. This is a wave 2 out the 12345 impulse wave, and in order to see new highs, the price needs to find solid support, which is now happening in the market.

Categories
Crypto Market Analysis

The crypto market showing oversold signs

The cryptocurrency market has started to show some oversold signs in the last days but is still premature to talk about a broader rebound at this moment. The major cryptocurrencies have found temporary support and are fighting hard to jump higher again.

Bitcoin

The BTC/USD dropped a little today and continued to stay below the 7000 psychological level. Price is moving sideways in the short term and remains to see if this will be an accumulation or a distribution movement. Unfortunately, the Bitcoin remains under high selling pressure; the perspective remains bearish as long as it is trapped below some very important resistance levels. Technically, the crypto is somehow expected to start a significant upside movement after the amazing corrective phase, but the fundamental factors are still very strong.

Cryptocurrency Market BTC/USD dropped

You can see on the Daily chart that the rate has made a valid breakout above the first warning line (WL1) of the major descending pitchfork, but only a valid breakout above the lower median line (lml) of the minor ascending pitchfork will confirm an upside movement.

Bitcoin has tested and retested the sliding line (sl) and continues to stay much above the 6000 support level. A valid breakout above the lower median line (lml) will signal an increase towards the 50% Fibonacci line and towards the median line (ml).

However, a valid breakdown below the sliding line (sl) will force the rate to drop below the 6000 psychological level as well.

Ethereum

The Ethereum downside movement was paused and now is trying to approach and reach some very important upside targets.

Ethereum downside movement

Price has failed to stabilize below the 385 static support and now has jumped much above the median line (ML) of the major descending pitchfork. Resistance can be found at the 50% Fibonacci line again. Only a valid breakout above it will send the rate towards the upper median line (UML).

The failure to approach and retest the downside 50% Fibonacci line has signaled an oversold and a potential leg higher. A valid breakout from the descending pitchfork will really confirm a larger upside movement.

Ripple

Ripple tries to become the leader in the payments transfer sector on the cryptocurrency market. It could launch a Ripple-based international payment app. in partnership with the Bank Santander. Ripple invests $25 million worth of XRP in the VC Firm Blockchain Capital. All these efforts could help the crypto price to increase in the upcoming period.

Ripple tries to become the leader in the payments transfer sector

Technically, the XRP/USD is still trapped below the minor downtrend line and below the 0.57210 broken static support. I’ve drawn an ascending pitchfork hoping that I’ll catch an upside movement. Price slipped below the lower median line (lml), but a false breakdown could signal another leg higher. We may go long on this cryptocurrency after a valid breakout above the downtrend line and if will stabilize above the lower median line (lml).