Categories
Crypto Videos

Cryptocurrency – Coin Vs Token – Which Is Better?

Cryptocurrency Coin vs. Token

Before we jump into the comparison, let’s start with understanding the definition of cryptocurrencies. Cryptocurrencies are digital currencies that are secured with encryption. This encryption is created by using cryptography, which is simply the use of encryption techniques to secure and verify the transfer of transactions.
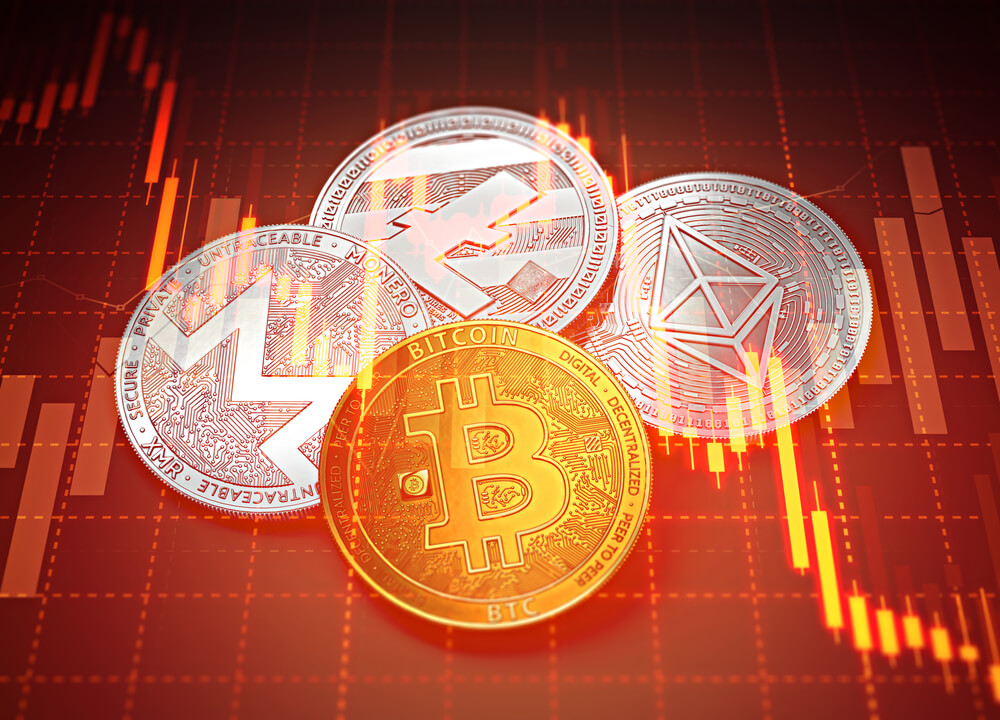
Bitcoin is considered the first decentralized cryptocurrency. It is powered by blockchain, a public ledger that records and validates all transactions that happen on it. Even though Bitcoin was not the first cryptocurrency, its creation is extremely important as it is the first distributed and decentralized one. The creation of Bitcoin managed to start a whole market of other cryptocurrencies (coins and tokens) that are regarded as cryptocurrencies even though most of them do not fall under the definition of a “currency,” but rather try to solve a different problem in society.

Cryptocurrency Categorisation

As previously mentioned, the term cryptocurrency is not completely accurate for most cryptocurrencies. In order for a cryptocurrency to be considered a currency, it technically needs to represent a unit of account, a store of value, and a medium of exchange.
These currency characteristics are inherent within Bitcoin, and since the whole cryptocurrency industry started with Bitcoin’s creation, the rest of the cryptocurrencies began being called currencies. In order to better understand the nature of cryptocurrencies, there are a couple of categorizations. We will talk about the most common one today. Cryptocurrencies can be separated into:
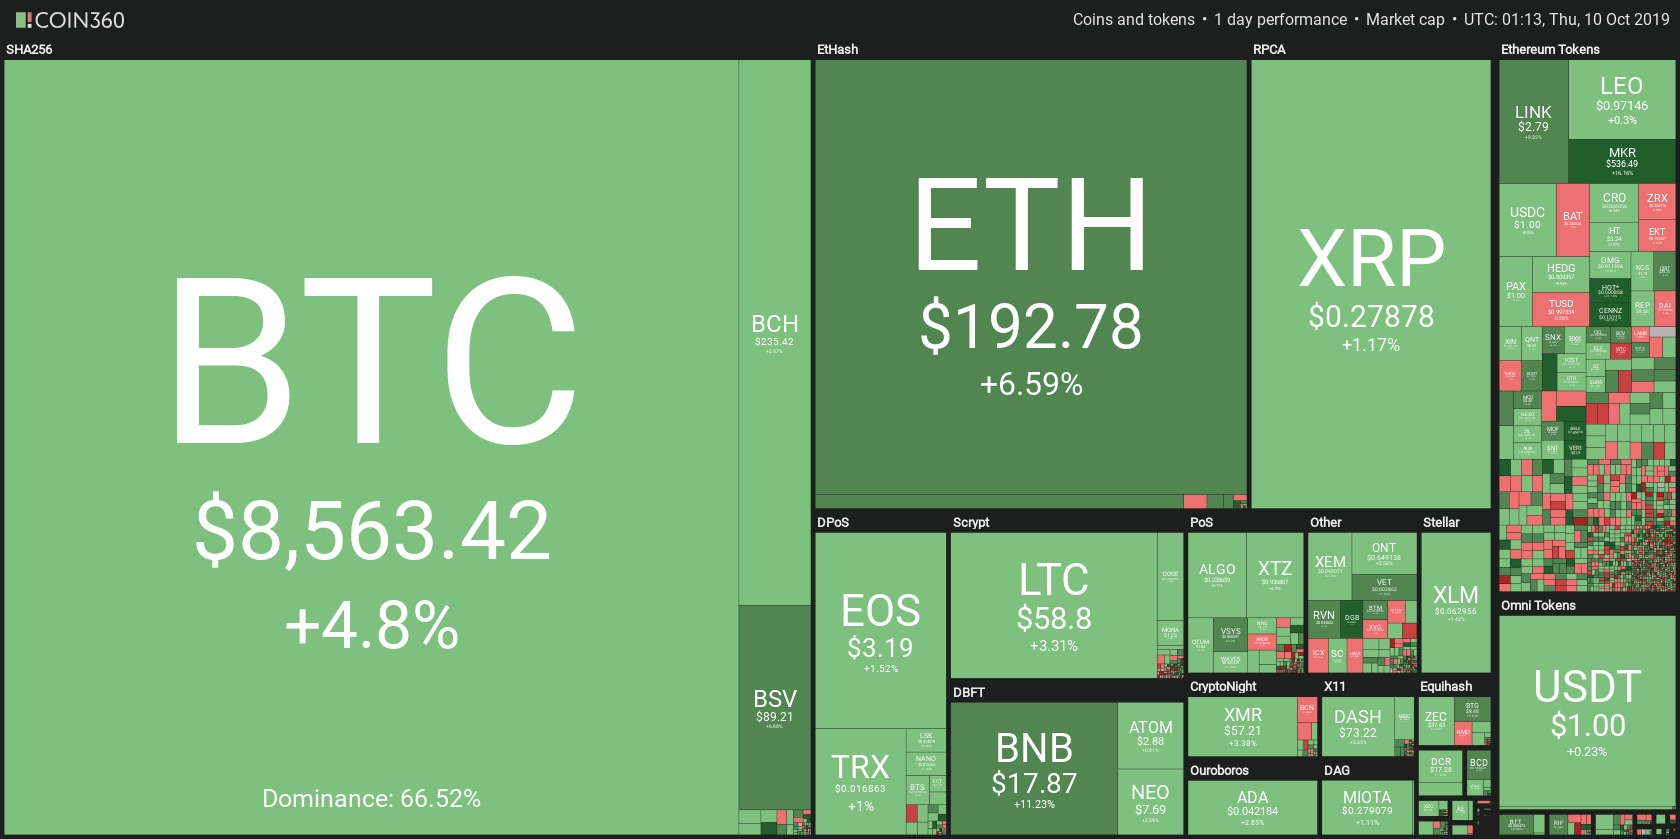
Coins (Altcoins), Tokens.

Coins


Alternative cryptocurrency can also be called altcoins or simply “coins.” Altcoin simply refers to coins that are not Bitcoin. Most altcoins came to life as a fork of Bitcoin, built using Bitcoin’s original protocol with a couple of changes to its underlying codes. These changes are, even though seemingly small, what actually sets these new coins apart from Bitcoin, as they offer a different set of features to it.
A concept of modifying open source codes to create new coins is called hard forks, while a change to a code that does not create a new cryptocurrency is called a soft fork. A few examples of altcoins that came from Bitcoin’s code are Namecoin, Litecoin, Dogecoin, Bitcoin Cash, Bitcoin Private, Auroracoin…
However, not all altcoins came from Bitcoin’s code. There are altcoins that have created their own Blockchain as well as a protocol that supports their native currency.

These coins include Ethereum, Ripple, Bitshares, NEO, Waves. What sets altcoins apart is that they each possess their own independent blockchain. This blockchain is where all transactions of their native currency occur.

Tokens

Tokens are considered a representation of an asset or utility that resides on top of another blockchain. Tokens do not have their own blockchains as altcoins do. They can represent basically any asset that is fungible and tradable. This could range anywhere from commodities to loyalty points.

Creating a token is a much easier task than creating a coin. This is simply because the code from a particular protocol does not have to be modified in order to create a token. Platforms such as Ethereum or Waves offer certain guidelines which, if followed, allow anyone to create a token. Creating tokens is made possible through the use of smart contracts. Smart-contracts are programmable computer codes that are self-executing as long as the terms are met. They don’t need any third-parties to operate.
As tokens built on the same blockchain have the same template, they share many characteristics. This provides a standard interface for interoperability between tokens, which allows people to store different types of tokens on a single wallet. A great example is the ERC-20 standard on the Ethereum blockchain, which has been used to create over a thousand tokens. Most (if not all) of these tokens can be stored on ERC-20 wallets.

Tokens are mostly created and distributed through an Initial Coin Offering (ICO). An ICO is simply a way of crowdfunding where developers fund their projects through the release of a new token or a promise of a token. The ICO market has been filled with successful as well as very unsuccessful projects. There were also a lot of scams on the market as people were buying anything and everything during the time of the cryptocurrency price boom of late 2017. Nowadays, the ICO market has died down compared to 2017 but is still active. However, people are a lot more cautious when it comes to where they invest their money.

Final Thoughts

The main difference between coins and tokens is in their structure, where coins are separate currencies with a separate blockchain, while tokens are cryptocurrencies that operate on top of an already-made blockchain.
When it comes to the number of coins and the number of tokens, the majority of cryptocurrencies in existence are tokens as they are simply easier to create.

Categories
Crypto Market Analysis

Daily Crypto Review, Oct 30 – UK discusses Crypto Regulation, Chinese Mining Company files for $400 mill IPO

The cryptocurrency market had a slow day price-wise. Most prices stayed on the same levels even though the volumes, as well as RSI values, fell. The past 24 hours were uneventful as far as price is concerned as most cryptocurrencies are either in the slight green or slight red. Bitcoin went down 1.72%, and it is now trading at $9,238. Ethereum gained 0.44%, while XRP gained 1.07%.

Bitcoin’s dominance increased over the weekend even as cryptocurrencies rose in price. However, it is on the downturn in the past 48 hours. Its dominance now sits at 67.3%, which represents a 0.4% decrease when compared to its dominance value 24 hours ago.

Cryptocurrencies ended up being divided between being in the green or red in the past 24 hours. The industry’s market capitalization fell slightly when compared to yesterday’s value. It now has a market capitalization of $248.6 billion, which represents a $2.3 billion decrease when compared to the previous day.

What happened in the past 24 hours

There was no major news in the cryptocurrency industry in the past 24 hours that could shake the prices up or down. The volumes, as well as RSI values, are descending. These are just indicators of a healthy consolidation.

The UK lenient approach to crypto regulation might change by Jan 10, 2020. This may be done with the implementation of the “Fifth Money Laundering Directive.” Eric Benz, CEO of Changelly, said that the UK’s regulatory framework is just trying to keep up with the cryptocurrency market, which is growing. He said:

“I do think regulation is a good thing but only if done in a way, which suits this new market. Applying traditional archaic regulation to crypto simply will not work as it’s been designed in its nature to avoid regulation. There has to be a much better understanding of the market and technology on behalf of Governments not just in the U.K. but globally.”

Chinese cryptocurrency mining company Canaan Creative filed for an IPO on Oct 28. Canaan intends to be the first publicly-traded crypto-mining company. Canaan Creative filed for an IPO with the U.S. Securities and Exchange Commission to raise $400 million by selling its shares on the Nasdaq under the ticker CAN.

_______________________________________________________________________

Technical analysis

_______________________________________________________________________

Bitcoin

There were no significant changes in Bitcoin’s price in the past 24 hours. Ever since Oct 26, which is right after Bitcoin surged up to $10,430, the price was steady and in the consolidation state. Its price is currently hovering around the $9,220 mark, which is a bit lower than the $9,450 that it was trading at yesterday.


Bitcoin’s RSI levels are now falling under the RSI overbought territory and entering the regular trading territory. This indicates that the pressure that the buyers had is slowly dying out. On top of that, its volume is descending slowly. However, it is still above the levels it was at before the big spike.


Ethereum

Ethereum is doing pretty much the same thing Bitcoin does. After the big price surge, a consolidation needed to happen to make this move healthy. Ethereum is now hovering between its immediate support and resistance levels of $$185 and $193.5. Ethereum has attempted to break this range both to the upside and the downside in the past 24 hours but failed both times. It is currently trading at $186.7, which is almost exactly the price it was trading at 24 hours ago.


Ethereum’s RSI is falling below the overbought territory, and it is now valued at 53. Ethereum’s volume stopped dropping as it returned to the state it was in before the price spike.


XRP

XRP is, as stated in yesterday’s article, performing its consolidation a bit differently from Bitcoin and Ethereum. It is not trading in a specific range, but following its ascending trend line. Even though the volume seems to stay at the same levels, XRP is finding the strength to move upwards and follow the ever-rising resistance line. Just following this line indicates major strength to the upside. However, the trend of price hovering just below the line will have to stop soon as the aforementioned line is too steep.


XRP’s RSI is dropping from the overbought levels into regular trading levels. It’s currently sitting at the value of 53.


Categories
Crypto Daily Topic

Is Ripple a Cryptocurrency?

Ripple has long generated a lot of debate as to whether it’s even a cryptocurrency after all. Crypto enthusiasts and experts have always been at loggerheads on whether Ripple meets the tenets of a “real” cryptocurrency. One of these people is Anatoly Castella, CEO of Elpis Investments, who has gone on record to say Ripple’s XRP is “neither a digital fiat nor a real cryptocurrency,” and that it does not fall under the “purest interpretation of cryptocurrency.”

A crypto exchange – Coinmotion, even warned users about XRP not being a real cryptocurrency. “What one needs to know about XRP is that it is not a cryptocurrency in the strict meaning of the word…What differentiates XRP from other cryptocurrencies is that it is not based on blockchain, it is not mined and it is heavily centralized.”

The 2000+ cryptocurrencies out there all derive inspiration from Bitcoin, the world’s first Bitcoin. Some of these cryptocurrencies strive to remain “true” to what exemplifies Bitcoin, e.g., running on a decentralized blockchain ledger, using cryptography to secure the network, transactions being carried out via mining, a finite supply of coins, etc.  But should a cryptocurrency take after each of bitcoin’s traits to be labeled as such? 

Let’s begin by understanding Ripple

Ripple was released in 2012 as a payment settlement, currency exchange, and money transfer network. Ripple’s goal was to circumvent the lengthy waiting processes and expenses involved in the traditional banking model.

XRP is the native currency for the Ripple platform. The company has issued 100 billion XRP tokens, which the company promises to be the maximum number to ever be in existence, although some in the crypto community think Ripple may not adhere to this vow in the future. The XRP token is meant to be the bridge between currencies. It treats all currencies the same way –from fiat currency to gold to even airline miles, which makes it easier to exchange any currency for another.

As a cryptocurrency, Ripple has only recently achieved “mainstream” popularity. Traders and investors have long kept it at arm’s length, mostly due to its traditional makeup that reconciles crypto with fiat currency. For this reason, among others, some in cryptoverse have refused to recognize it as a real cryptocurrency. The question is, are they right? Let’s review some aspects of XRP that will help us answer this question.

XRP is More Premium on Blockchain

XRP was not designed to be a coin, at least in the sense of Bitcoin, Litecoin, etc. While Bitcoin, for instance, accords the cryptocurrency and the network both equal importance in security, speed, availability to all, and applicability, Ripple does not place too much weight on XRP as an investment-worthy security. Instead, it focusses on making the blockchain as robust and scalable as possible. This enables Ripple to enable seamless processes with its client organizations, e.g., the American Express and Santander Bank.

Ripple doesn’t support mining

Unlike Bitcoin and other comparable cryptocurrencies, there is no mining or miners with Ripple. Most other cryptocurrencies utilize different mechanisms which accord varying levels of power to the miners. Proof-of-Work, Proof-of-Capacity, Proof-of-Stake are just some of the many consensus mechanisms used by cryptos to power transactions. However, Ripple transactions are powered via a “centralized” blockchain. The idea behind the centralized network is to make it more reliable and quick.

Again, with most cryptocurrencies, miners are motivated to conduct network transactions by being rewarded with the currency of the network. For Ripple, however, this is unsustainable. In a service built for the benefit of the banking establishment, it makes no sense to have a separate group with different incentives for running/maintaining the network. 

The idea of mining and making the network open for any interested miners is to aid other cryptocurrencies to remain decentralized – with no central authority making the rules. While this has helped them stay true to the “spirit” of censorship-resistance, freedom from interference by corporates and governments, it also slows them down. This is something Ripple cannot afford. The no-mining aspect bleeds into other Ripple features as well, taking it further apart the standard.

Can XRP Be Minted on Demand?

In the majority of cryptos, miners are rewarded with cryptocurrency. This pretty much sums up how new crypto coins are released: by mining. Ripple has created 100 billion XRP already in circulation, which makes it nonvolatile for its clients.

This has led to some people in the crypto community to conclude the currency can be minted anytime – which is against the deflationary nature of cryptocurrencies. But this has been refuted by David Schwartz – one of the original architects of XRP ledger. In a Twitter post in November 2017, Schwartz stressed: “There was never any way to create additional XRP.”

He noted that the original code was prone to a malicious act that would conceivably allow someone to “violate system invariants” and add more XRP. But, they’ve since added an “invariant checker” that seals this loophole.

In other words, there is currently no functionality of adding XRP in the code. If, for any reason, new XRP needed to be printed, it would require a major amendment to the code and adoption into the whole network of validators.

Centralized Blockchain?

Users have access to a Ripple wallet, but accessing the Ripple network is another matter altogether. In the case of Bitcoin, the blockchain network is controlled by Bitcoin users all over the world. By contrast, the Ripple blockchain is not open for all, because that would create risk for the otherwise sensitive environment.

And while XRP uses cryptography to protect participants, in essence, it’s protecting “trusted” parties registered on the network. This way, the cryptocurrency has the benefits of a blockchain ledger, but in a safer and walled ecosystem that lends it more efficiency and control. We could say Bitcoin is maintained by participants who have an incentive to continue doing so, but still, they could decide to shut off their computers and walk away. This event would put Bitcoin in a sort of a precarious position, something which Ripple has avoided.

Conclusion

Ripple is not a “real” cryptocurrency, at least by the standard definition. It is more of a solution than an asset. While other cryptos may fit in the asset mold – complete with the deflationary qualities of mining and volatility, which makes them attractive to investors – Ripple offers a platform that may, technically, be a “cryptocurrency,” but one which cannot be regarded as such by crypto hardliners.

Categories
Crypto Market Analysis

Daily Crypto Review, Oct 29 – Cryptocurrencies surging, China’s President Optimistic on Blockchain

The cryptocurrency market has had an astonishing weekend, which brought many cryptocurrencies great gains. Yesterday was a continuation of the buying move that started over the weekend. Many cryptocurrencies gained over 5%. In order to make the moves healthy, the cryptocurrency market required a consolidation, which it is getting now. As for the past 24 hours, Bitcoin went down 2.59%, and it is now trading at $9,403. Ethereum gained 0.41%, while XRP lost 1.34%.


Bitcoin’s dominance increased over the weekend even as cryptocurrencies rose in price, but fell back down a bit in the past 2 hours. Its dominance now sits at 67.7%, which represents a 0.5% decrease when compared to its dominance value 24 hours ago.

Cryptocurrencies ended up being divided between being in the green or red in the past 24 hours. The industry now has a market capitalization of $250.9 billion.

What happened in the past 24 hours

There was no major news in the cryptocurrency industry in the past 24 hours. The elevated volume and continuous buying pressure seemingly come from China after their president told his citizens to seize the opportunity that is blockchain and crypto industry.

As reported by many news outlets, the Chinese took the words of their president very literally and started investing in cryptocurrency almost immediately.


Technical analysis


Bitcoin

There were no significant changes in Bitcoin’s price when compared to the state, it was 24 hours ago. After bouncing from the $7,410 support line, Bitcoin surged up to $10,430. To keep the gains and to consider this move healthy, Bitcoin needed to retrace. That is exactly what it is doing at the moment. The price is currently hovering around the $9,450 mark.


Bitcoin is currently trading right below the RSI overbought territory, with its volume elevated, but descending.


Ethereum

Ethereum is doing pretty much the same thing Bitcoin does. After the big price surge, a consolidation needed to happen to make this move healthy. Ethereum is currently trading at $186.5. After leaving its falling wedge pattern, Ethereum’s outlook is much more positive. However, its other indicators show a possible downward-facing move in the near future.


Ethereum’s RSI is also right below the RSI overbought territory with trading volume elevated, but descending.


XRP

XRP is performing its consolidation a bit differently from Bitcoin and Ethereum. Even though it is trading within a range just like the other two cryptocurrencies, XRP does not experience significant volume drops. On top of that, its RSI is dropping from the overbought levels into regular trading levels.


When it comes to the position of XRP’s price, XRP is hovering just below the upward-facing trend line, which it does not intend to cross. Just following the line below, it would indicate major strength to the upside for XRP.

It has become a regular occurrence that Bitcoin and Ethereum almost mirror each other while XRP makes its own moves in the industry.

Categories
Crypto Market Analysis

Daily Crypto Review, Oct 28 – Cryptocurrencies surging, China’s president optimistic on blockchain technology

The cryptocurrency market has had an astonishing weekend. The past couple of days have brought us one of the largest price surges in a single 24-hour candle. The last time we saw a 40%+ 24-hour candle from Bitcoin, it was trading at $0.40 and $5.65. This could indicate an influx of buyers that are here to stay. Precisely this happened, as most cryptocurrencies’ price did not retrace, but instead stayed at their highs. As for the past 24 hours, Bitcoin went up 5.86%, and it is now trading at $9,698. Ethereum gained 4.59% of its value, while XRP gained 3.56%.

Bitcoin’s dominance increased over the weekend even as cryptocurrencies rose in price. This is because Bitcoin’s price itself gained more than the other cryptos did. Its dominance now sits at 68.2%, which represents a 2.1% increase from the beginning of the weekend.

Most cryptocurrencies ended up being in the green in the past 24 hours, which reflected on the market cap of the cryptocurrency industry as a whole. The industry now has a market capitalization of $256.69 billion.

What happened in the past 24 hours

There was no significant news regarding cryptocurrencies in the past 24 hours. The price was keeping up its upward momentum from the news that came earlier during the weekend.

As far as the weekend goes, the big news was the Chinese president Xi says that China should “Seize Opportunity” to adopt blockchain. On top of that, China passed a cryptography law which will be effective on January 1, 2020. This law will try to tackle regulatory and legal challenges in commercial cryptography use-cases.

Technical analysis

Bitcoin

The past week was not especially good for Bitcoin until the weekend came. After failing to spike up from the bull flag that it formed, Bitcoin started dropping in value, managing to fall from $7,950 down to $7,300 in less than 30 minutes. The support line at $7,410 was quite a strong one, and Bitcoin manage to consolidate at that price point. However, the volume suddenly spiked up, and Bitcoin’s price skyrocketed all the way to $10,360 before retracing a bit. Bitcoin is now trading around the $9,700 mark.


Bitcoin’s volume is still quite high, while its RSI is indicating trading in overbought territory.

Ethereum

Ethereum has also had a great weekend, as its price skyrocketed as well. After reaching the big support area at $153, it went up and eventually gained upward momentum. Ethereum’s price reached $199.6 before retracing. One important thing to note is that Ethereum’s price did try to fall below the falling wedge line. However, it quickly declined, and the price shot up once again.


Ethereum is now trading at $186.6 with elevated levels of volume. Its RSI is approaching overbought territory but is not there yet.

XRP

XRP has also gained quite a bit over the weekend. After breaking its upward-facing trend at $0.29, it crashed down to $0.25. However, the price recovered as the bulls kicked in, establishing support at $0.266. This was a baseline for the big move upwards, which ended at $0.315. As the volume faded, XRP retraced a bit and fell under the aforementioned trend line, which it did manage to cross during the spike. It has tried to break it quite a few times since but failed every single time.


Even so, there is no need for attempts to break above the trend line to be successful as the line is too steep upwards. Even following it is a great indicator of strength. XRP is now trading for $0.30.

Categories
Crypto Market Analysis

Daily Crypto Review, Oct 25 – Today’s market neutral, Peter Schiff warming up on crypto

The cryptocurrency market has been relatively neutral in the past 24 hours. After a pretty horrible drop that ended with some cryptocurrencies dropping double digits in price, the market is in a stabilization phase. While some cryptocurrencies gained a bit of value, most remained at their yesterday’s levels. As for the top3 cryptocurrencies, Bitcoin went up 0.24%, while Ethereum gained 0.2% of its value. XRP was the biggest gainer out of the three and gained 2.45%.

Bitcoin has lost a fraction of its dominance due to it not moving much while some other cryptocurrencies managed to secure gains in the past 24 hours. It now sits at 65.6 %, which represents a 0.04% decrease when compared to the previous day.

The industry has gained some value as far as market capitalization goes in the past 24 hours. Cryptocurrencies now have a market capitalization of $205.66 billion, which represents a $1.5 billion increase from the previous day.

What happened in the past 24 hours?

The markets have been pretty stable in the past 24 hours as there were no moves from neither bears nor bulls. There were also no significant news that could impact the price of the overall crypto market.

XRP has managed to gain some value on positive news, however. CryptoBull tweeted that he remains bullish on XRP and that his price goal would be $10 by the end of 2020. On top of that, Tim Draper also announced that he expects XRP to explode soon.

Cryptocurrencies are gaining momentum in adoption, and we can see the future changing right before our eyes. Peter Schiff, an economist that is considered anti-crypto and a goldbug, announced that “Privately issued cryptocurrencies, backed by real assets, would represent a major improvement over our current system of national fiat currencies.”

Technical analysis

Bitcoin

Bitcoin was pretty stagnant in the past 24 hours. After finding resistance at $7,410, Bitcoin could not move far above the price point. However, this support line stopped a big bear move from that could cause much more harm to Bitcoin’s price.


Bitcoin’s RSI is slowly moving out of the oversold territory while the volume is on the decrease. This condition has historically shown that a move (bullish or bearish) is near.

Ethereum

Ethereum has had a slightly better day than Bitcoin in terms of price. Even though its price gain is far from big, Ethereum did manage to pull away somewhat from its support zone.


It is now sitting at $161.5, with the same indicator positions as Bitcoin (RSI and volume)

XRP

XRP has gained the most in the past 24 hours. This fact could be attributed to a large bull rally when the price broke $0.266. Even though the price managed to slip below the line, bulls rallied and propelled it upwards.


XRP is now trading at around $0.278 and looks pretty bullish in the short-term.

Categories
Crypto Guides

What Should You Know About Ripple? The Most Centralized Cryptocurrency!

Introduction 

In our previous articles, we have seen that Bitcoin has inspired and paved the way for a multitude of new and affordable platforms using cryptocurrencies. Ripple is one such platform developed by Ripple Lab’s incorporation, a US-based company in 2012. It is a payment platform built upon a distributed open-source protocol. This best part about this cryptocurrency is that it is backed by major Banking and financial institutions. They use Ripple for transferring money, commodities, cryptocurrencies, or any other units of value like flier miles or free mobile minutes.

Objective

The Objective of Ripple is to rule over all the international transactions worldwide. They have come up with this objective as the cost of international transactions is too high if we transact using traditional means. It also takes days to settle the transaction. The most innovative idea behind this platform is that we can use the network to transfer any currency, not only cryptocurrency, to be more specific. Thus, making the platform currency independent. Ripple Network, also knows as RippleNet, enables many banks and financial institutions to send and receive money smoothly throughout the world.

How is Ripple different from other cryptocurrencies?

In the world of blockchain, the upcoming networks or platforms are trying to eradicate the existing systems. Ripple is doing precisely the opposite. Instead of trying to remove them, this technology is trying to cooperate with them to make them better. Several products by Ripple Labs (XCurremt, XVia, and XRapid) are being used by several banks to perform transactions globally. The native cryptocurrency of the platform XRP plays an essential role in the system.

Let us see how the transactions are performed globally using Ripple technology. The currency which is being transacted is converted into XRP before the transaction. As the recipient receives the money, the user will have an option to convert the XRP into his/her desired currency. Thus, XRP plays a bridge between two different currencies in this case. The transaction fees for this transaction is as less as $0.00001. This transaction fee disappears from the network after the transaction is processed.

Market Capitalization 

Ripple’s XRP is in third place in terms of market capitalization amongst Cryptocurrencies. Currently, this crypto is trading at $0.295, while the total market cap is around 12 billion dollars. The 24-hour trading volume is $1,729,560,739. The maximum number of coins the XRP ever can have is 100,000,000,000, while 43,242,653,330 out of them are already in circulation (43.2%).

Pros and Cons of Ripple

We have already seen that many banks have trust in Ripple technology and started using this network. By using this technology, some world-renowned banks claim that they are potentially saving 70% of the transaction costs annually. Since all the coins are minted already, inflation i.e., the value of Ripple, remains stable over the period.

Ripple is highly centralized, unlike other cryptocurrencies. 61% of the coins minted are in control of the founders of the Ripple Labs. They decide when and how much of the coins are released. Hence centralization is the major con. In May 2018, Ripple was accused of alleged cheating through its ICO.

Conclusion

Since 2013, many traditional platforms that serve international transactions have adopted Ripple as an alternative remittance option to its customers. By December 2014, Ripple combined its services with Earhports payments systems, making it the first-ever partnership of Ripple with a giant payments network. Western Union, American Express, and Unicredit are some of the largest customers of this technology, making the technology achieve its goal closer every passing day.

Categories
Crypto Market Analysis

Daily Crypto Review, Oct 24 –Crypto market bleeding out, Zuckerberg announces Libra’s strategy

The cryptocurrency market has been bleeding out in the past 24 hours. After a pretty average performance throughout the day, cryptocurrencies dropped in price in a blink of an eye. Most of them lost 5%-8% of their value in a matter of minutes. The move happened extremely fast and with an amazing bear force. It seems like more bearish funds entering the market after cryptocurrencies have consolidated. The market is fighting for dear life as many people have given up on thoughts that this is a retracement in the bull trend, but rather an extension of a bear market that dates back from January 2018. As for the top3 cryptocurrencies, Bitcoin went down 6.84%, while Ethereum lost 4.09% of its value and XRP lost 6.2%.

Unlike with most bear moves, Bitcoin’s dominance decreased this time.  It now sits at 66 %, which represents a 0.05% decrease when compared to the previous day.

As almost every single cryptocurrency was in the red, the market lost a significant portion of its value. The industry now has a market capitalization of $204.28 billion, which represents an enormous $13.1 billion decrease from the previous day.

What happened in the past 24 hours?

Big influx of selling pressure caused the cryptocurrency market to lose over $13 billion of its market capitalization in a matter of minutes. There was no specific news that caused this. In fact, there was no news at all that was regarded as completely bearish in the past 24 hours. However, after the price drop happened, people started resurrecting the thought that the markets have not been in a bull market at all after the big crash of Jan 2018. In fact, many people believe that the price rise to $13,000-$14,000 was just a bear market retracing and then falling back again.

Besides the price drop, the cryptocurrency industry spent the day talking about Mark Zuckerberg’s appearance before the United States House of Representatives Committee on Financial Services. He was in front of the Committee as the sole witness that was invited to testify about his role in developing Libra, Facebook’s cryptocurrency that is backed by a basket of stable international assets.

Technical analysis

Bitcoin

Bitcoin has had an incredibly bad day, which is what we can say about many cryptocurrencies in if we take a look at their performance in the past 24 hours. After failing to spike up from the bull flag that it formed, Bitcoin started dropping in value slowly. However, today’s selling pressure spike caused its price to plummet. Bitcoin fell from $7,950 all the way down to $7,450 in less than 30 minutes. After hitting a support line sitting at $7,410 Bitcoin started consolidating. This support line dates back from Nov 2017 and most recently May-Jun 2019.


So far, the support seems strong and the downward-facing move seems to have ended. This is further confirmed by RSI which is now heavily oversold.

Ethereum

Ethereum has also had a red day, but a better one than Bitcoin price-wise. Its price is currently $160 as the support held on during the time of crisis. The $153 support area is quite a strong one and should hold any slight fluctuations or bearish attempts.


Ethereum’s RSI is approaching oversold territory, indicating the end of the bearish move.

XRP

XRP was certainly not excluded from the influx of sellers coming into the market. After it’s ranging ascending price trend got broken yesterday, the price started falling sharply. The price fell quickly and even reached $0.25 levels. However, the bulls kicked in and established support at $0.266 which is considered a strong long-lasting support price point for XRP.


The price is now consolidating right above the support while RSI is just fluctuating above oversold territory.

Categories
Cryptocurrencies

What is Ripple? A Complete Guide to the Cryptocurrency

Ripple has undoubtedly made a ripple in the world of finance and the cryptocurrency community. From making headlines for alleged price manipulation to its unusual monetary policy, the currency has firmly made a mark in the finance world. 

Ripple Explained

The first thing to know is that Ripple is both a cryptocurrency and a digital payment and exchange platform. The ripple cryptocurrency – abbreviated as XRP, is the native currency of the Ripple platform.

Ripple is more recognized as a digital payment platform than for its cryptocurrency. Through its Ripple Network (RippleNet), the model circumvents the multiple intermediaries and high fees typical with traditional banking models. 

History of Ripple

XRP was founded in 2012 by Jed McCaleb and Chris Larsen. The model integrated the elements of an earlier payment system called OpenCoin that was designed by decentralization expert Ryan Fugger.

After its launch in 2012, it became the second-oldest crypto after Litecoin. As of October 2019, Ripple is the third-largest cryptocurrency by market cap – after Ethereum and Bitcoin.

Network Design and Security Model

The XRP ledger is to Ripple what blockchain is to, say, Bitcoin. The ledger is a decentralized and peer-to-peer network of servers that powers borderless payments across multiple banking systems across the world. XRP acts as a bridge between currencies, making it easy to exchange any currency for another.

The XRP ledger uses the Ripple Protocol Consensus Algorithm (RPCA) to verify transactions. This algorithm enables the numerous nodes on the network to decide by consensus which transactions will go through, and in what order. These confirmations take only four seconds.

Monetary Policy of XRP

The maximum supply of XRP is 100 billion. The coins were all pre-mined before issuance, and according to Ripple, no other coins can ever be created. 

20 billion coins were given to Ripple founders Chris Larsen, Arthur Britto, and Jed McCaleb. Another 20 billion has been sold to companies and individuals, 7 billion is held by Ripple. In 2017, Ripple placed 55 billion in an escrow account, releasing a billion XRP each month for the next 55 months. At the end of each selling period, all unbought coins will be returned to escrow accounts for issuance beyond the 55 months. To decrease XRP’s supply overtime and prevent its devaluation, Ripple destroys XRP coins after they have been used to facilitate transactions. 

XRP can be divided down into six decimal places, and the smallest unit is known as a drop. This means 1 million drops are equal to 1 XRP. 

Differences between XRP and Bitcoin

Being the native currency for the Ripple ecosystem, XRP significantly differs from other cryptocurrencies in several ways. And since Bitcoin is the pioneer and the most popular of all cryptos, it makes sense to juxtapose the two to understand XRP better. Here is how the two cryptos differ:

☑️Aim of Development: Bitcoin was created as a digital means of exchange, but without the central authority and control exercised over fiat currencies by banks and governments. By contrast, Ripple was created for the banking system as a payment settlement, remittance system, and currency exchange. The idea was to design a system for asset transfers that were quicker, cheaper, safer, and more transparent.

☑️Mining Rewards: Ripple is not designed to be mined, unlike Bitcoin. All 100 billion XRP coins were pre-mined before their release. Only 43 billion are in circulation as of October 2019. On the other hand, Bitcoin has to be mined before being released, and miners get mining rewards in the form of BTC coins. 

☑️Protocol: Bitcoin is enabled by a technology known as blockchain to verify and confirm transactions. XRP is powered by an independent, patented ledger known as Ripple Protocol Consensus Algorithm to process transactions. Also, Bitcoin uses a proof-of-work mechanism to validate transactions, while Ripple relies on a consensus protocol to do so.

☑️Transaction Speed: Bitcoin transactions take 10 minutes on average, while XRP transactions take an incredible 4 seconds.

☑️Approach to the Banking Establishment: Bitcoin and other cryptocurrencies are disruptive to the established monetary system, with the potential to replace it in the future. Conversely, Ripple is cozy with the established system, with its value proposition, in fact, relying on being adopted by banks as a payment and settlement network.

Where to Buy and Store XRP

You can buy Ripple at any of the popular cryptocurrency exchanges, including Coinbase, Bittrex, Kraken, Binance, and Changelly.

For those intending to hold the coin for the long term, it is recommended to store your currency in cold (offline) storage such as a hardware wallet because it’s much safer and invulnerable to hacking attempts. An example of such a wallet is the Ledger Nano S and CoolWallet S, both of which support XRP.

For more active and frequent traders, having a software wallet such as Ripple’s own wallet or Edge and Abra wallets is more appropriate. Also, bear in mind that to store your coins in a Ripple Wallet, you need to deposit a minimum of 20 XRP. 

Should You Invest in XRP? 

XRP offers a quicker way for banks to process transactions faster, which could streamline banks’ operations in a major way and benefit both sides massively. Therefore, the question of whether XRP is a good candidate for investment depends on whether more banks and other financial institutions will adopt it as their payment and settlement infrastructure. Since no one is sure whether Ripple will succeed in its vision, the future value of XRP remains highly speculative for now. 

In any case, there is no such thing as a safe investment, and each decision bears a risk. Therefore, it’s entirely up to you to decide. 

Conclusion 

Being one of the most talked-about cryptocurrency and with its current rank among cryptos, Ripple looks set to continue being dominant in the crypto space. However, its potential for increasing in value hinges very much on the attitude of the banking establishment, something the crypto community is watching keenly. 


Categories
Crypto Market Analysis

Daily Crypto Review, Oct 23 – Stablecoins may be considered securities, crypto markets in the red today

The cryptocurrency market is in the red for the past 24 hours. Most of the day has passed by without any downside resistance whatsoever. There has not been any new money coming into the markets as volume seems to be a bit lower than average. However, the downward-facing moves were not weak, but rather steady and stable. The market is now trying to find a price level to consolidate. As for the top3 cryptocurrencies, Bitcoin went down 3.03%, while Ethereum lost 4.3% of its value and. XRP was down 3.01% in the past 24 hours. Out of the top50 cryptocurrencies, BAT performed the best with its gains reaching over 7.5%.


Bitcoin’s dominance increased a fraction of a percent when compared to yesterday’s value. It now sits at 66.5%, which represents a 0.01% increase from the previous day.


Most cryptocurrencies ended up being in the red in the past 24 hours. This, of course, slightly increased the value of the cryptocurrency market as a whole. The industry now has a market capitalization of $217.4 billion, which represents a $5 billion decrease from the previous day.

What happened in the past 24 hours

Cryptocurrencies have had both positive and negative news in the past 24 hours.

As reported by CoinDesk, Morgan Creek Digital managed to raise $60.9 million for its second blockchain venture capital fund. It seems that two pension funds invested $50 million into the project. This is more than double what they initially started with ($21 in the first blockchain fund).

The US Congress may consider a bill which would classify stablecoins as securities. This bill draft was published on Tuesday by Rep. Sylvia Garcia. The bill wants to regulate stablecoins under the Securities Act of 1933, seeking to provide clarity in an area the bill suggests lacks regulatory guidance.

Technical analysis

Bitcoin


Bitcoin has managed to break a bull flag downwards, making quite a bearish announcement to the market. If we take a look at the charts, the downtrend that started on Sep 30 ended up with a bull flag that broke upwards and increased in price right to the 161.8% of the downwards-facing move. After that, another similar downtrend started and we’ve come to the point when a bull flag was starting to rise. Everyone was expecting it to break upwards and Bitcoin to attempt to reach new highs (a 161.8% increase would mean a price of $9,440).

However, Bitcoin managed to fail the pattern and broke it downwards. Its price stabilized at just below $8,000.

Ethereum

Ethereum has lost over 4% of its value in the past 24 hours. It seems to be forming a falling wedge pattern on the daily chart. One more descending move is to be expected before Ethereum could attempt a price increase. However, if that does not happen, even a price of $110 is not excluded.


At the moment, Ethereum is sitting at $167, with a big support line being at $157. Its volume is at extremely low levels and RSI is approaching oversold territory.

XRP

XRP broke its ascending trend range and fell to $0.288. After creating a range that it moved in all the way from Sep 19 until now, XRP managed to break it downwards. It is now trying to recover and get back into the range, but the attempt has been unsuccessful so far.


XRP’s volume is average while its RSI is neither oversold nor overbought. It would take a significant increase in bull power in order for XRP to get back in its lane. If that does not happen, however, XRP has strong support sitting at $0.266.

Categories
Crypto Market Analysis

Daily Crypto Review, Oct 22 – Slow day for cryptocurrencies, Bitcoin SV skyrocketing

The cryptocurrency market has been pretty stagnant in the past 24 hours. After a green day (for the most part), cryptocurrencies have consolidated at their respective prices. The past 24 have been pretty stable when it comes to volume. Even though the majority of cryptocurrencies are in the green, there has not been any significant increase in the top-3 cryptocurrencies. However, Bitcoin SV skyrocketed and increased more than 20% in the past 24 hours. Bitcoin went down 0.56%, while Ethereum lost 0.13% of its value. XRP was the biggest gainer out of the top3, with a price rise of 2.25%. Bitcoin SV is the best performing large cryptocurrency in the past 24 hours (with the gain of over 15%) while the rest are pretty stable and have increased or decreased in price by a few percents at maximum.

Bitcoin’s dominance dropped a fraction of a percent when compared to yesterday’s value. It now sits at 66.4%, which represents a 0.02% decrease from the previous day.

Most cryptocurrencies ended up being in the green in the past 24 hours. This, of course, slightly increased the value of the cryptocurrency market as a whole. The industry now has a market capitalization of $222.86 billion, which represents a $0.5 billion increase from the previous day.

What happened in the past 24 hours

The global economy is looking pretty weak at the moment. Several central banks across the world have had to impose rate cuts. While the supply of fiat currencies has been growing in the past couple of years, Bitcoin’s block rewards are decreasing in an event called “halving.” Bitcoin’s new supply will drop even further after halving in 2020. Previous instances of halving resulted in a sharp price increase of both Bitcoin and the other cryptocurrencies.

Technical analysis

Bitcoin

Yesterday’s spike got Bitcoin all the way up to $8,320. However, that price did not hold up against the falling pressure of buyers and the rising pressure of sellers. Bitcoin is trying to stabilize at either above or below the 38.2% Fib retracement line, which is at $8,200. The volume is average, and the RSI doesn’t show any signs of overbought or oversold trading. Bitcoin is now left in the hands of the bulls and the bears and their momentum.


Ethereum

Ethereum’s volume has been on the rise in the past 24 hours. The bulls seem to have taken over the wheel at the start, bringing ETH up to $179.5. However, as it could not break the $180 mark, Ethereum had to consolidate at a lower price. After bouncing from the 23.6% Fib retracement line, which stands at $173, Ethereum is consolidating between that line and the resistance line, which is sitting at $176.


Even though the overall volume seems to be higher when compared to the previous day, it is on the decline at the moment, which makes an upward-facing move quite unlikely.

XRP

XRP is on the rise in the past 24 hours. After consolidating in a range between $0.29 and $0.295, XRP had a parabolic move upwards. In a matter of minutes, its price rose from 0.292 to 0.303. However, the top of the movement got rejected quickly, and the price is not reversing downwards. XRP’s first point of support is the 23.6% Fib retracement line, which sits at $0.299. With bear volume increasing and RSI reaching the overbought territory, it is almost inevitable for XRP to consolidate below $0.3.


Categories
Crypto Guides

What Is Market Capitalization? Top Cryptocurrencies With Highest Market Cap!

Introduction

Market capitalization is estimated for publicly traded companies in general to determine the value of that company. The value is calculated based on the total number of outstanding shares in the market multiplied by the individual share price. In simple words, the market cap is nothing but the market value of a publicly trading company.

Initial Public Offering (IPO)

Initial Public Offering or IPO’s are widely known. Companys which issue IPOs are publicly trading companies willing to raise capital for investing in the business to diversify and expand the company. When a company issues IPO, it agrees to sell a certain stake of the company to the public to raise the company. There are many successful IPO’s since 1602, when the first-ever IPO was recorded. Global companies like Amazon and Apple crossed one trillion-dollar in market cap, making them powerful than some smaller countries.

Initial Coin Offering (ICO)

Similar to IPOs, we have ICOs called Initial Coin offering with regards to cryptocurrencies. ICOs help crypto companies to raise funds that will be invested in creating a new coin, service, or dApps. These companies generally release a white paper detailing the aim of the ICO, minimum capital they intend to raise, and the basic design and properties of the product they are trying to create. Many investors plan to invest in ICOs to make quick bucks and earn tremendous profits. The result of some of the prominent ICOs promises the same.

Hence, the market cap of a cryptocurrency is determined by the number of outstanding coins in the market multiplied by the individual value of a coin.

Now, let’s look at the top 10 cryptocurrencies in terms of market capitalization.

  1. Bitcoin (Market Cap – $146.1 BN)

Bitcoin is the first-ever cryptocurrency, and it is obvious that this crypto tops the list in terms of market cap. The market cap of Bitcoin is $146,141,293,771, with the total number of coins in circulation being almost 18 million. As we all know, only 21 million Bitcoins can ever be mined.

  1. Ethereum (Market Cap – $19.1 BN)

Ethereum rightly earned its second place as it was developed to overcome the limitations of bitcoin, and it has become the second favorite amongst the investors. The market cap of Ethereum is around $19,191,075,792 with 108,182,195 coins in circulation.

  1. Ripple (Market Cap – $12.8 BN)

Ripples XRP takes third place with $12,833,995,058 as a market cap. The total number of coins in circulation is around 43,166,787,298. This crypto earned its credibility by gaining support from some of the most powerful centralized institutions like Federal Reserva.

  1. Tether (Market Cap – $4.1 BN)

Tether has been developed to be a stable coin, i.e., the price will always be maintained as one dollar. This coin has been developed to have the stability of fiat currency while having the key properties of cryptocurrency. The market cap of Tether is $4,121,497,986, with 4,108,044,456 coins being circulated in the market.

  1. Bitcoin Cash (Market Cap – $3.9 BN)

Bitcoin cash is created by forking the main Bitcoin platform. The market cap is around $3,956,035,700 with 18,061,950 number of coins in the market.

  1. Litecoin (Market Cap – $3.4 BN)

Litecoin is a spinoff of Bitcoin, thus earning the name of altcoin, which means alternate coin (to bitcoin). Around 63,484,804 Litecoins are currently circulating in the market.

Some of the other cryptos with high market cap include

Binance Coin (Market Cap – $2.8 BN)

EOS (Market Cap – $2.7 BN)

Bitcoin SV (Market Cap – $1.5 BN)

Stellar (Market Cap – $1.3 BN)

All the above information is as of 16th October 2019. For real-time figures, you can visit this website.

The adoption and usage of cryptocurrencies will only increase in the future as they are here to stay. At the peak of the bitcoin price in December 2017, the market cap of all the cryptocurrencies was around 125 billion dollars, and as of today, it is 221.3 billion dollars. Given the history, the market cap of all the cryptocurrencies can quickly reach a trillion dollars in the near future.

Categories
Crypto Market Analysis

Daily Crypto Review, Oct 18 – XRP taking over, green day for the crypto market

After a pretty grim-looking situation in the past couple of days, the cryptocurrency markets are seemingly stabilizing. The past 24 hours have shown us mostly buying pressure, which can be seen in the cryptocurrency market overview. Most of the top cryptocurrencies are green, with XRP leading the path. The volume seems to have decreased a bit, which could indicate that strong bears took a break.  Almost every single cryptocurrency ended up in the green today. Bitcoin went up 1.65%, while Ethereum gained 1.71% of its value. XRP was the biggest gainer out of the top3, with a price rise of 6.07%. Once again, XRP showed to be the most resistant cryptocurrency of this week.

Bitcoin’s dominance has decreased slightly when compared to the previous day. It now sits at 66.1%, which represents a 0.03% decrease from yesterday.

Most cryptocurrencies ended up being in the green in the past 24 hours, which reflected on the market cap of the cryptocurrency industry as a whole. The industry now has a market capitalization of $221 billion, representing an increase of a little over $3 billion.

What happened in the past 24 hours

As the selling pressure and volume altogether decreased when compared to the past couple of red days, we can conclude that the bears have taken a break, at least for a day. Many people see this as the beginning of a bear market, but we have yet to see what is coming for the crypto industry. Most cryptocurrencies bounced off their immediate support lines and managed to stabilize or even attempt to form new daily highs above the resistance lines. Only a handful of cryptocurrencies managed actually break them, but this could be considered a good sign for the bulls.

Technical analysis

Bitcoin

Bitcoin reached a low of $7,900 yesterday after a series of downward-facing spikes and strong bear presence. However, this support line was not broken, and Bitcoin managed to bounce up over $8,000. Its overall volume has decreased (as shown on the chart), which could represent bears backing off. However, the lack of volume also stopped Bitcoin from crossing over the $8,130 resistance line. After two attempts, Bitcoin is still making a move and trying to go above it, but the decrease in volume does not seem helpful.


Bitcoin’s RSI is also approaching overbought territory, which means that there is a high probability of this attempt of breaking resistance to be rejected as well.

Ethereum

Ethereum managed to distance itself from Bitcoin a bit in the past 24 hours. Even though they shared a similar fate, Ethereum’s moves were not a mirror of Bitcoin. After the low of $172.5, Ethereum’s bulls picked up the pace and started pushing the price up. Ethereum breezed through the $176 resistance line, which now turned into a support line. Even so, the low volume kept it from pushing further up. The upward-facing move was strong, but not strong enough. Ethereum managed to push through $178.8 and reached for $180.7 resistance line, but got rejected. This pushed the price back into a zone around the $176 support line, which holds for the moment.


Ethereum’s RSI is somewhere above the middle of the range, while its volume is constantly low.

Ripple (XRP)

Against all the odds, XRP has managed to rise during the hard times that the cryptocurrency market is in at the moment. After a fairly stable day, XRP brought in some new capital, which pushed it from $0.28 all the way up to $0.305. This move happened extremely quickly, as the majority of is move actually happened in one 30-minute candle. Besides the huge 30-minute spike in price and volume, XRP’s volume got higher when compared to the past day.


XRP is now struggling to keep its gains, and time will tell whether it will stay above the $0.3 or fall below the line.


Categories
Crypto Market Analysis

Daily Crypto Review, Oct 17 – Bears Taking Over, Cryptocurrencies in the Red

Cryptocurrency market’s attempt to stabilize its price after the new highs last week has failed, and bears have started taking over. Slowly but steadily, most cryptocurrencies lost their gains and then some. The past 24 hours came with an increase in volume as bear presence increased.  Almost every single cryptocurrency ended up in the red today. Bitcoin fell down 2.13%, while Ethereum lost 2.91% of its value. XRP held on a bit better and lost only 1.99%, which would put it at the spot of the cryptocurrency that lost the least in the past 24 hours out of the top10 (excluding Tether).


Bitcoin’s dominance has increased slightly when compared to the previous day. It now sits at 66.4%, which represents a 0.02% increase from yesterday.

Most cryptocurrencies ended up being in the red in the past 24 hours, which reflected on the market cap of the cryptocurrency industry as a whole. The industry now has a market capitalization of $217.73 billion.

What happened in the past 24 hours

As volume increased steadily for a couple of days now, people were expecting a move upwards. However, they were greeted with a surprise as the market started dropping in price. As suspected yesterday, we can now say with certainty that the volume is coming from the bears instead of bulls, at least in the past couple of days. Most cryptocurrencies tested their immediate support lines and broke them downwards, trying to reach a point of consolidation. Only a handful of cryptocurrencies managed to stay out of the red today, while most of the cryptocurrencies lost several percents of their value.

Technical analysis

Bitcoin

Bitcoin’s short-term chart looks pretty grim at the moment. The bulls have seemingly left the building, and the bears are running the place. With volume increasing dramatically (and not just for one quick spike), Bitcoin seems to be dropping down slowly all throughout the day. The price seems to drop quickly and then consolidate at the next support line, which then gets rejected, and the price gets lower. That’s exactly what happened three times since the last green day Bitcoin has had. Bitcoin’s immediate support is currently at $7,912, and it is holding up well for now.


Bitcoin’s RSI has just left the oversold territory while the price remained on the same level. As for volume increases, it looks like that the big downward-facing price spikes require less and less volume, while volume during consolidation periods is increasing.

Ethereum

As stated in yesterday’s article, Ethereum started mirroring Bitcoin’s movements due to a lack of identity at the moment (mostly volume). Ethereum started falling in price slowly, dropping from $181 to $179, which is when the big drop happened. The spike dropped Ethereum from $179 all the way down to $172 in just over one hour. This price level became support as Ethereum rejected lower price points. The price is now in between the $172 support line and the $176.3 resistance line.


While its volume seems to be elevated, it does not seem enough to break from the major influence that Bitcoin has become.

XRP

Unlike Bitcoin and Ethereum, XRP did not have such a bad day. Even though it lost some value, it did not break any support lines. One the other hand, it did fail to break a resistance line as it tried to push past $0.2855 on one occasion. After the attempt of breaking the resistance failed, XRP dropped down to its support line, which is sitting at $0.282 and bounced from it to the middle of the “range.” If other cryptocurrencies keep dropping in value slightly every day, XRP might follow, but there is also a high probability of it just staying where it is price-wise as the bear volume avoided coming into it (at least for now).


XRP has not seen the same volume increase as with Bitcoin and Ethereum, which further proves that bear money has entered the market (it just avoided XRP for some reason).

Categories
Crypto Market Analysis

Daily Crypto Review, Oct 16 – Another Red Day in Play

The cryptocurrency market has been trying to recover and find a point of consolidation for some time now. While most cryptocurrencies ended up in green yesterday, that is not the case today. Bitcoin fell down 2.05%, while Ethereum lost 3.05% of its value. XRP held on a bit better and lost only 1.47%.  Bitcoin SV did the best out the top10 cryptocurrencies, being the only one in the green. It managed to gain 6.11% in the past 24 hours.

Bitcoin’s dominance hasn’t changed all that much from yesterday, but it did fall a few fractions of a percent. Its dominance now sits at 66.2%.

Most cryptocurrencies lost a few percents of their value, which reflected on the market cap of the cryptocurrency industry as a whole. The industry now has a market capitalization of $222.99 billion, which represents close to a $5 billion drop from yesterday.

What happened in the past 24 hours

A steady increase in volume and a green day for most cryptocurrencies indicated bulls rallying. Today, however, prices fell even with the volume keeping its level. The volume seems to have been coming from the bears instead of bulls today. Most cryptocurrencies tested their immediate support lines and broke them downwards, trying to reach a point of consolidation. While some cryptocurrencies only lost a fraction of a percentage, many lost a couple of percent of their valuation.

Technical analysis

Bitcoin

After a green day yesterday, Bitcoin seemed strong as it tried to establish a support line at $8,300 and even contest new highs. The bulls could not pass through $8,395, which is when bears seem to have taken over. With volume remaining at the same levels, Bitcoin started dropping down slowly until one big red candle, which brought its price from $8,326 all the way down to $8,078. This price got rejected quickly, and Bitcoin found its new short-term support at the $8,130 level.


Bitcoin’s RSI is currently not in overbought or oversold territory, but the current position does not look good. If the price goes under the support level, Bitcoin might have to look for new support at a level below $8,000.

Ethereum

Ethereum suffered from the same faith as Bitcoin today. After having a great day, the bulls lost momentum, and bears took over. Unlike Bitcoin, Ethereum had low volume levels throughout the week. After failing to break the $188 price point, Ethereum went down to $176. As with Bitcoin, this price got rejected, and Ethereum found support at the 0% Fib retracement line, which sits at $177.85.


Ethereum seems to have low volume levels apart from the sudden spikes in volume, which correct its price upwards or downwards. This fact might implicate that Ethereum has a high probability of mirroring Bitcoin’s movements in the short-term.

XRP

XRP lost the least out of the top-three cryptocurrencies today. This fact can mainly be attributed to its superb gains from the day before. With its volume looking good, yesterday’s move had to retrace a little in order for it to be a healthy move.


With XRP not having enough strength to pass $0.3, bears decided to take things into their own hands. The price dropped to $0.283 but quickly sprung up to $0.286, which now represents its immediate support. It is still uncertain whether XRP will try to push higher, consolidate or try its luck at a lower price point.

Categories
Crypto Market Analysis

Daily Crypto Review, Oct 15 – Gradual 24-Hour Volume Increase

The cryptocurrency market has been trying to recover and find a point of consolidation in the past 24 hours. Most of the cryptocurrencies ended up slightly in the green, while some even went up by quite a bit. While Bitcoin gained only 0.86%, Ethereum went up by 2.57% and XRP by 5.75%. Stellar was the biggest gainer of the day out of the top10 cryptocurrencies by market cap, gaining 7.08%.

Bitcoin has remained a dominant force in the industry as it always was, but it has dropped a few fractions of a percent today. Its dominance now sits at 66.25%.

As mentioned above, most cryptocurrencies kept their price levels or went up in the past 24 hours. This could translate to the overall market cap of the cryptocurrency market in a positive way. The industry now has a market capitalization of $227.11 billion.

What happened in the past 24 hours

After a red weekend, cryptocurrencies are trying to recover and settle at their respective price levels. Most of them had a slight increase in volume and a few attempts to break immediate resistances. Some made it through, and some didn’t. Even so, almost all of the top cryptocurrencies maintained their price levels or went above their most recent lows, which could only indicate a return of the bulls. This time, Bitcoin is not the main player, as many altcoins managed to outperform it.


Technical analysis


Bitcoin

Once the low of $8,133 got rejected, Bitcoin tried to find a price to settle at. It was unsure whether that price will be above or below the 23.6% Fib retracement line, which is now at the price of just below $8,300. However, as volume gradually increased during the day, Bitcoin went above the line and contested the next resistance twice. The $8395 line was not so kind to Bitcoin as it could not pass through it either time. Both attempts were rejected, and Bitcoin is now settling in between the Fib retracement line 23.6%, which now acts as support and Fib retracement 38.2% line, which is the immediate resistance.


As Bitcoin is now in a limbo between the two lines, RSI shows us that it’s not oversold or overbought. One thing that is different this time is that, unlike over the weekend, the volume increase was not sudden and a one-time thing. Bitcoin’s volume in the past 24 hours has been elevated, rather than it being one big spike of volume and then back to normal.


Ethereum

Ethereum has, similar to Bitcoin, denied its low of $178 and tried to find a price to consolidate at. With new money seemingly coming in, Ethereum slowly moved above the 23.6% resistance line now turning support, but quickly lost its momentum and headed straight back down. However, the bulls rallied, creating a sudden spike in price, skyrocketing Ethereum past two resistance lines ($182 and $185.5). The bullish sentiment toned down at that point, making the upward-facing move unable to reach another milestone and pass $188. Ethereum kept its daily gains and is now consolidating at $187.


XRP

XRP has had a great day. Unlike Bitcoin, which managed to consolidate or Ethereum, which made a slight move upwards, XRP skyrocketed and breezed through its resistance lines. The move completely nullified the whole weekend of price losses and then some. Its price went up from $0.273 all the way up to $0.3, which is its significant resistance. XRP is currently making moves towards reaching above this price, and only time will tell if it will be broken soon or not. However, the volume seems to be gradually tapering off, which might not be a good sign for the XRP bulls.


Categories
Crypto Market Analysis

Daily Crypto Review, Oct 11 – Healthy Consolidation Following a Green Day

The cryptocurrency markets are almost entirely mimicking the happenings we covered a few days ago. The market is trying to find a balance point to consolidate at, just like it did a couple of days ago. While Bitcoin did not go down, the other cryptocurrencies still try to find their points of consolidation below their highs from yesterday. Bitcoin went up all the way to $8710 and kept almost the same price level throughout the day. Most of the cryptocurrencies reached RSI overbought territory and started to decline in price as well as in volume. Bitcoin gained 0.04% on the day, while Ethereum went down 0.49% and XRP by 3.21%. Most of the top cryptocurrencies are in slight red today, but there have been no significant price fluctuations.

Bitcoin has managed to score a few fractions of a percent and add them to the dominance chart as it was one of the cryptocurrencies that did not drop in price today. The market capitalization of the crypto markets decreased slightly over the past 24 hours and is now standing at $230.57 billion.

What happened in the past 24 hours

After the upward-facing move in price came into the markets yesterday, markets decided to consolidate as there were no major resistances that could be broken. Most cryptocurrencies consolidated at their daily highs or slightly below them. After the influx of new money coming into the market yesterday, charts showed us a considerable increase in volume. Even though the price jump is over, some of the volume managed to stay in the markets, which is now that much more liquid than it was before the jump.

Technical analysis

Bitcoin

After reaching the price of $8,710, Bitcoin started to show signs of a possible retracement as the volume began to lower. RSI entering heavily overbought territory further proved the case. Bitcoin, however, did not retrace at all. It just consolidated at nearly the same price that it went to the price spike. After drawing a new Fib retracement line from the start of the new price jump, we can see that it is still uncertain whether Bitcoin will go above or below the 23.6% retracement line. The 38.2% line was, however, tested once today. The price briefly dropped below it, but quickly recovered and gained slight upward momentum.


If we take a look at the volume, we can clearly see that it is not the same as it was during the spike. However, it can also be seen that the volume is much higher than what it was before the spike.

Ethereum

Ethereum has, following Bitcoin, going upwards yesterday. It reached a critical resistance line from September at $196 and bounced back from it. The price dropped as low as $188 but managed to recover some of its value. Ethereum is now trying to consolidate above or below the newly-made 38.2% Fib retracement line. It is more likely that the price will end up above the line at this moment as Ethereum keeps rejecting lower price points, but only time will tell where it will actually consolidate.


The volume, just like with Bitcoin, has increased when compared to what it was before the price spike.

XRP

Unlike Bitcoin and Ethereum, XRP did not have such a good day yesterday. It did go up but only touched $0.29 before dropping down to the price level of after the October 7th price spike. The price retraced all the way to the newly-made 61.8% Fib retracement line before finding support. That support seems to be holding for now.


XRP’s volume seems to have returned to the levels it was before the price jump, making it close to impossible to push through the immediate resistances.

Categories
Crypto Market Analysis

Daily Crypto Review, Oct 10 – Market pushes up again, majority of cryptocurrencies in the green

After yesterday’s day of consolidation, the markets decided to head up and test new prices. With increased volume and new money coming into the market, Bitcoin increased its price by 4.5%, while Ethereum managed to go up by 6.62% and XRP by 1.35%. After reaching RSI overbought territories, the prices started stabilizing at the same or slightly lower levels, while RSI managed to settle down.

As both Bitcoin and most altcoins are in the green, the total cryptocurrency market cap has increased. It is now hovering at around $231,8 billion, just down from the daily high of $232,47 billion. Bitcoin is still keeping its dominance high, currently being around 66.6%.

What happened in the past 24 hours?

Cryptocurrency markets, judging by the increase of volume, have had an influx of new money coming. That has sparked some solid price growth, especially if we expand our views to not only Bitcoin but the rest of cryptocurrencies. Out of the top50 cryptocurrencies, only eight have been in the red. Out of the eight being in the red, half of them are stablecoins, which happen to lose out when the cryptocurrency markets go up. On top of this upward-facing move, the prices are not consolidating far below the levels they reached today. In fact, most of the cryptocurrencies kept their gains and are looking promising in the short-term.

Technical analysis

Bitcoin

Bitcoin has reached a new short-term high of just above $8700, before stabilizing its price at just below $8,600. The new influx of money coming into the markets helped Bitcoin surpass the immediate resistances and start making its way up. With volume skyrocketing, Bitcoin flew through the immediate resistance lines and stopped as the volume started reducing. However, it did not lose its gains and started consolidating at the top, which is rarely seen. This move has sparked some new thoughts in terms of whether the altcoins season has started or not. As the price reached the top of the movement, RSI indicated it was heavily overbought but managed to reach lower levels as the price consolidated.

Ethereum

Ethereum has surpassed Bitcoin in gains today, reaching the price of $196.3. It has retained its gains and started consolidating at close to its daily highs, which is a highly bullish sign. However, that may not be as promising as it sounds. Ethereum found new resistance at the $196.3 line. This price point acted as support and resistance as far as September and proved to be effective as both support and resistance. Only time will tell whether Ethereum can surpass this resistance, or if it will fall back to its previous levels.

On a brighter note, Ethereum’s RSI is almost identical to the one currently seen on the Bitcoin chart. After being heavily in the overbought territory, it started to fall while the price did not follow it. Even though the volume died down quite a bit, it still sits at a higher level than what it was before today’s spike.

XRP

Unlike Bitcoin and Etherum, XRP did not have a particularly good day. XRP moved, fueled by the price growth of Bitcoin and other cryptocurrencies, passed the 23.6% resistance line that the Fib retracement from the Oct 7th-Oct 8th move. However, it quickly found resistance at the top of the Fib retracement (0%), failed to break it, and retraced to the 23.6% line, which now acts as support.

Another thing separating XRP from the top2 cryptocurrencies at the moment is volume levels. Unlike the other two, XRP’s volume is currently lower than what it was before the upward-facing spike. Even with the RSI indicator reducing and the price staying relatively high, it might not be enough to keep XRP on a green path.

Categories
Crypto Market Analysis

Daily Crypto Review, Oct 03 – Slight advances on Decreasing Volume

Yesterday, cryptocurrencies moved sideways during the European and American sessions. Then, they advanced slightly during the Asian session.  Bitcoin gained +1.71%. ATOM /+7.38%), and LINK(+8.63%) experienced the more significant gains of the last 24 hours. Market cap is currently $221.85 billion (+0.59%), and the dominance of the Bitcoin is 68.25%.

fig 1- 24H market capitalization and Traded Volum


Fig 2- Heat Map of the crypto sector

What is Happening?

An exchange-traded product (EPT) combining Bitcoin and Ethereum has been made available on SIX, Switzerland’s Stock Exchange.  The product comes from a collaboration between Fintech firm Amun AF and Bitcoin Suisse AG, a Swiss cryptocurrency custodian. The EPT trades under the ticker symbol ABBA.  Source: The Block.

US Congressmen French Hill and Bill Foster are worried the Dollar is left behind for the rise in cryptocurrencies and issued an open letter to the Federal Reserve asking Jerome Powell to create a Digital Dollar. Source: dailyhodl.com.

The Indonesia government is hosting an eight-nation international conference on cryptocurrencies. The nations participating are Turkey, Singapore, Australia, Malaysia, Thailand, Russia, and Hong Kong. According to knowledged sources, Indonesia is hosting this conference with the aim of providing lawyers and enforcement agents with the knowledge needed to fight crypto-related crimes. Source: btcmanager.com.

BitPay will add support for Ripple (XRP) by the end of the year. Source: The Block.

Samsung-backed Blocko has launched in the UAE. In April 2018 the Dubai announced its Emirates Blockchain Strategy 2021, which aims to migrate 50% of its transactions to a blockchain platform. Blocko, in partnership with SEED Group, will be part of the effort to bring this plan to reality.  Source: coindesk.com.


Technical Analysis


Bitcoin

Bitcoin had modest advances during the last 24 hours. That said, the buying interest seems to be limited. Currently, the daily chart shows that the price has been encountering resistance in the 200-day MA (green). We see also that the volume is shrinking as the price advanced.


The 4H chart shows the price still moves in the upper side of the Bollinger band with the MACD in a bullish phase that gives a bit more weight to a short-term continuation to the upside. We see also that the 8,519 level is a fierce resistance level and that 8,200 has been holding the price lately. Therefore, these are the levels to watch. A Credible break of one od them will signal the future price direction.


Ethereum


Ethereum continues moving with a slight upward bias. The Bollinger mean line has been holding the price for some time. Currently, we see the price in the middle of the ascending channel, but what we see suggests the price is moving to retest the $185 resistance. A break below $177 will invalidate this scenario.


Ripple


Ripple still directionless after the large bullish candle. The price moves still in a band between 0.2468 and 0.257.  To be bullish, we need to see the price above the 0.253 level. A break of the 0.246 support will mean a possible visit to the 0.234 level and invalidate the bullish candlestick made on September 30.


Categories
Crypto Market Analysis

Daily Crypto Review, Oct 2 – Pullback Day or Dead Cat Bounce?

Yesterday, cryptocurrencies behaved as expected, retracing some of their Monday’s gains. Early morning losses continued. Bitcoin lost 2.47% over its 24-hour value. Most altcoins joined the movement such as Ethereum (4%), Ripple (-4.04%), Bitcoin Cash(-4.47%), EOS(-4.57%), Bitcoin SV(-6.15%)  and TRON (-5.61%).

The market cap descended to $218.5 billion, while the 24H volume was $26 billion, as seen in the figure below.

The current market dominance is as follows:

  • BTC:67.55%
  • ETH:8.62%
  • XRP:4.85%
  • BCH:1.82%
  • LTC:1.60%
  • EOS:1.24%
  • Others:15%

The Heat map here, shoes that, as usual, the whole sector moves with almost perfect correlation.

What happens

Ethereum-bases dApp FairWin has collapsed after the exposure of a vulnerability in its smart contract. Researches found the platform admins could drain the entire balance in the dApp easily, an $8 million worth of ETH stored in the platform. Researchers found $250,000 was stolen in a previous version. Source: Medium.com.

According to an article by condesk.com, major Libra backers Visa and Mastercard are re-thinking its participation in this digital project. Libra has been the trigger for regulators to start worrying for the irruption of digital assets and Libra has been opposed by European financial authorities saying Libra could destabilize the Euro, while the US Congress has demanded a complete halt on its development.

The Federal Reserve injects the USD worth the entire crypto market cap in days according to this article by beincrypto.com. The last one is said to add $162 billion to the total USD supply. US FED noted that it is a temporary measure.


Technical Analysis


Bitcoin


Bitcoin’s price has been losing ground after making a double top at $8,519. The MACD is dangerously approaching a bearish transition, while the price is currently sitting on the mean line of the Bollinger Band, at 8,200. That was our expectations yesterday. Thus, nothing to worry about unless weakness continues and the price keeps moving to the lower side of the Bollinger bands and challenge the $8,000 again.


Ethereum


Ethereum is moving in an ascending channel, a weak form of trending. Its price made a high at $185, then during the latest 4H candles has been retracing. At the moment of this writing, the price was held by the mid-line of the Bollinger Bands. MACD is also close to a bearish crossing. The figure created by the latest price action suggests the entire channel is a consolidation of the significant drop made on September 24. Short-term, if the price holds, we see a new test of the $185  high, although the price might go visiting the lower side of the channel.


Ripple


Ripple has retraced more than 50% of the large candlestick made on Sept. 30. Now the price is touching the upper border of the band where it had been ranging before that bullish candle. That may be a supply zone of people who wanted to go long that day but were late.  That means a bounce off of this level is likely. If that does not happen, then the bullish candle was just a trap for bulls, and the movement is negated.


Litecoin


Litecoin is starting to show signs of buying interest. The price has been held by the Bollinger mean line and now has headed up. MACD is bullish, also. The movement is still feeble, and $57 acts as a resistance level, so to confirm a bullish scenario we would like to ask for a close above that level.


Categories
Crypto Market Analysis

Daily Crypto Update, Oct 01 – Reversal Day!

Yesterday was a reversal day. Bitcoin went down from $8,054 to touch $7,701 to swiftly reverse its path and close above $8,300. Other cryptocurrencies followed. The heatmap here testifies the 24H advances, with Bitcoin, BCH, BSF, ETH, and XRP  up more than 7% over its previous session. Market capitalization went up to $224.8 billion with a traded volume of $33.4 Billion.

Fig- 1 Market Cap and Traded Volume

Fig 2 –  24-hour Heat Map


The News Front

Industry giants Coinbase, Bitrex, Kraken, Anchorage, and others join to form the Crypto Rating Council to qualify on how likely a coin is likely to be regulatory compliant and characterize tokens into currency, commodity, security or something else. The notable exception is Binance, which seems it has been excluded. Source: beincrypto.com.

SEC announced it had settled an agreement with Block.one the company behind EOS to settle the charges for raising billions in an ICO, back in 2017.  Block.one agreed to pay a “civil penalty” of $24 million. Source trustnodes.com.

Cardano is partnering with New Balance shoemaker to authenticate the company’s premium line of sports shoes. Cardano can produce blockchain.based data that consumers and stores can trust. Source: dailyhodl.com.

Bitpay achieves Service Organization Control (SOC2) compliance. That certification means BitPay is certified for confidentiality, security, privacy, processing integrity, and availability.  Source: cointelegraph.com.


Technical Analysis


Bitcoin


After creating a double bottom, yesterday bitcoin made a reversal day. The price made a kind of harami in the 4H chart and continue moving up to cross the Bollinger line mean and then the +1SD line. By crossing that line and then moving near the +1SD line, we should assume a new upward trend is initiated. MACD also confirms the bullish phase of the bitcoin.

Right now the price has bounced off of the $8,524 level, which touches the 200-day moving average on the daily chart. That means it is a tough resistance level to cross. If crossed, the price will need to fight the 8.800 level with is June’s 02 topping area. Right now BTC may need to consolidate near the Bollinger Mean line before continuing with the trend.


Ethereum


Ethereum has confirmed its bullish leg up by making another higher high and higher low. MACD and Bollinger bands are in agreement, obviously since indicators lag the price action. Currently, the price was rejected by the $185 resistance and is retracing some of the recent advances, as the price is overextended. We estimate that the price will retrace near its $177 support and, then continue its way up.  A breach of the $177 level ( on a closing basis) would imply less buying strength than anticipated.


Ripple


Ripple has made a sharp impulsive candle on strong volume, yesterday, and since then is making corrective candlesticks near the top of that range, the price hold by the 200-period MA. That is fine since this candle created a price overextension that now is being corrected. The MACD and Bollinger Bands confirm XRP has started a bullish trend, so buy the dip is the motto here. The chart shows the current key levels for this asset.


Categories
Crypto Market Analysis

Daily Crypto Update, Sept 30 – Bitcoin under $8,000 drives Crypto Assets Down!

Bitcoin breached the $8,000 early morning today, as the bearish sentiment keep persisting in the crypto sector. That lack of buyers is creating a pronounced bearish trend in the whole sector. This weekend, Bitcoin lost another 5% Bitcoin Cash(-5.55%), Binance Coin(-5.82%), Monero(-5.05%) and DASH(-6.2%) lead the loses.  The Market Capitalisation of the sector went further to $207.9 billion.

The heatmap below shows the price change of coins and tokens during the weekend.

The News Front

The Ukranian government is planning to legalize cryptocurrency. That is so according to a report published by an independent Ukranian news media. Currently, cryptocurrencies are not illegal in Ukraine. This step is a government move to regulate it and benefit via taxation. Source: The Block.

JP Morgan strategist Nikolaos Panigirtzoglou claims Bakkt’s launch of a physically-settled Bitcoin Futures contract was the reason for the Bitcoin 20% drop. Source: dailyhodl.com.

Denis Baykov has been fined the value of $7,000 by Russian authorities after mining bitcoin using a supercomputer able to petaflop speeds from an old Russian nuclear facility in Sarov, western Russia. Source beincripto.com.

Google has created a 50qbit computer able to execute in minutes what would have taken 20,000 yeats using a regular computer. Besides that, quantum computing is not a threat to crypto-assets, according to a news piece by bitcoinnews.com.


Technical analysis


Bitcoin


Today, bitcoin definitively broke the $8,000 support level and confirmed, also, the breach of the 200-day MA. On the daily chart, we see also the price has also broken the lower trendline of the descending wedge to the downside.

The next level to break is the $7,700 and, next, we could observe if the supply zone below $7,725 is able to hold prices and stop the downward evolution of the price, to, at least, experience a bounce.


Ethereum


Ethereum’s bounce ended, although the price has not broken the $166 support. We see the price moving slightly below the -1 Bollinger line, which means a downward pressure to prices. That, combined with the bitcoin weakness, makes us think ETH will continue descending to test $160 at least. But we can’t be surprised if $152 is reached in the coming days.


Ripple


Ripple seems to keep holding inside the range between 0.234 and 0.2468, besides the persistent BTC weakness. Today the price is losing 1% while bitcoin is -3.55% down. That shows there is some hidden buying power holding its price. The current sideways channel and technical indicators still show the price is in a downtrend, though. That and another BTC downward spike may force this token to break its support. The best course of action is to be in the sidelines while this is resolved.


Categories
Crypto Market Analysis

Daily crypto update 08.08.2018 – Flash crash


General overview


  • Market Cap: $232,384,144,425
  • 24h Vol: $15,580,869,369
  • BTC Dominance: 48.5%

In the last 24 hours, cryptocurrency market cap evaluation fell from 257,284,000,000$ to 229,140,000,000$ at its lowest today which is a 28,144 billion dollar decrease which happened in about 12 hours in total. 

The market is currently in red, with an average percentage of change among top 100 coins ranging from 6-12%. Only Pundi X and Aurora are up by 2,9% and 2,3%.


News


Major headline that is the causing this flash crash as many news media outlets are reporting is that VanEck-SolidX Bitcoin ETF application was delayed for consideration for September by the U.S. Securities and Exchange Commission (SEC). 

The Securities and Exchange Commission late Tuesday delayed a decision on an application for the first bitcoin-related exchange-traded-fund. The regulator said it planned on making a decision on the proposed ETF from VanEck and SolidX on Sept. 30. A decision was expected no earlier than Aug. 10, 45 days from the time the ETF duo submitted their application for the fund.

Source: market watch

“Accordingly, the Commission, pursuant to Section 19(b)(2) of the Act,6 designates September 30, 2018, as the date by which the Commission shall either approve or disapprove, or institute proceedings to determine whether to disapprove, the proposed rule change,” the SEC said.

Source: investing


Analysis


BTC/USD

From yesterday’s high at 7159$ the price of Bitcoin has fallen by 10,93% and is currently trading below 6500$.


The price fell steeply and quickly and is currently below the 0 Fibonacci retracement level which is the significant support level that was broken last time Bitcoins price was heading downwards and created a lower low. This indicates a very bearish sentiment and another lower low scenario.


Market sentiment 

Hourly chart technical indicators are signaling a sell.


Pivot points

S3 5902.6
S2 6375.6 
S1 6547.2 
P 6848.6 
R1 7020.2 
R2 7321.6 
R3 7794.6

ETH/USD

From yesterday’s high at 410$ the price of Ethereum has decreased by 10,44% and is currently trading at 367$.


Looking at the hourly chart, we can see that the bearish pennant was broken on the downside which propelled the price of Ethreum for a steep fall. The price is now looking for support and is currently sitting just slightly above the 0 Fibonacci retracement level which is the prior low level on the daily chart.


Market sentiment

Ethereum is in the sell zone.


Pivot points 

S3 300.06 
S2 342.79 
S1 360.30 
P 385.52 
R1 403.03 
R2 428.25 
R3 470.98

XRP/USD

From yesterday’s high at 0,4133$ the price of Ripple has fallen by 16,91% as its currently trading at 0,347$.


Looking at the hourly chart we can see that the triangle was broken from the downside and as the triangle’s support was also a significant horizontal support level the breakout resulted in a straightforward downfall. The price is currently looking for support and it found some support on the current levels but they are far from strong in order to hold the momentum behind the sell-off.


Market sentiment 

Hourly chart technical indicators are signaling a sell.


Pivot points

S3 0.26042 
S2 0.36093 
S1 0.39822 
P 0.46144 
R1 0.49873 
R2 0.56195 
R3 0.66246

Conclusion


It looks like the last straw that investors held on to in order not to fall into the abyss of the cryptomarket death was the Bitcoin ETF. The news has so hyped out that now after the SEC announced they are postponing the decision for late September that straw broke and the straight downfall started. I think that this is going to be the final sell-off but I don’t mean that it will be over soon. What I would expect from here on for the cryptomarket is another despair and pain period with no upside on the horizon.

Categories
Crypto Market Analysis

Daily crypto update 02.08.2018


General overiview


  • Market Cap: $272,382,783,020
  • 24h Vol: $12,683,202,800
  • BTC Dominance: 48.3%

Cryptocurrency market cap has found some support around the 267B levels and is currently testing it, hovering around it. 

The market is consolidating which is the next logical step after the fall of approximately 31 billion dollars in the evaluation. The colors are mixed so we can see both red and green with a small average percentage of change among top 100 coins.


News


Coinbase Adds British Pound Support, Speeding Fiat Transfers for UK Clients

Leading US-based cryptocurrency exchange Coinbase said it is adding British pounds (GBP) to its list of accepted fiat currencies as of Thursday, in a move that will allow faster fiat deposits and withdrawals for its UK-based clients.

Morgan Stanley Hires Crypto Expert From Rival as Crypto Race on Wall Street Intensifies

Morgan Stanley appointed Andrew Peel as head of digital asset markets. The update comes from his LinkedIn profile, where the new position is listed. He leaves Credit Suisse after twelve years with the bank, where his latest job was vice president of sales and trading innovation, although he spent the majority of his stay in the Delta One desk.

EU Advisory Body Claims that Blockchain Innovation is at Risk within the European Union

The European Commission’s blockchain advisory body has warned that the EU’s lack of legal and regulatory certainty can stop blockchain development and the Union’s leading role in innovation. On August 1, the European Blockchain Observatory and Forum published its first-ever report analyzing the blockchain industry in the Union and outlining several recommendations to the bloc.

Source: Coinvest


Analysis


BTC/USD

From yesterday’s open at 7732$ the price of Bitcoin has decreased by 1,46% and is currently trading at 7572$. The price went even lower to the 7440$ but has recovered since leaving a spike on the hourly chart.


Looking at the hourly chart, we can see that the yesterday’s open was on the 0,236 Fibonacci level and from there fell below the blue bold line which is the support from the triangle on the daily chart. From here I am expecting the price to go to the dotted black line which is the baseline support 2 line where it will look for support. Because that level wasn’t respected recently I would expect the price to rester there for a while before breaking it on the downside and continue in a downward trajectory.


Market sentiment

Hourly chart technicals signal a sell with moving averages signalling a strong one.


Pivot points

S3 6969.0 
S2 7284.9 
S1 7445.4 
P 7600.8 
R1 7761.3 
R2 7916.7 
R3 8232.6

ETH/USD

From yesterday’s open at 433$ the price of Ethereum has dropped by 5,2% and is currently trading around 410$.


Hourly chart looks bearish as the price fell below the minor support line and is currently interacting with the minor range support on the same levels as the wave Z was. It looks like the support will hold for now but I am expecting in to break anytime soon, as this level isn’t all that strong.


Market sentiment 

Hourly chart signals a sell.


Pivot points 

S3 362.74 
S2 392.20 
S1 406.12 
P 421.66 
R1 435.58 
R2 451.12 
R3 480.58

XRP/USD

From yesterday’s spike at 0,4633$ the price of Ripple has decreased by 6,81% and is currently trading at 0,432$.


Looking at the hourly chart, we can see that the price of Ripple is once again below the 0 Fibonacci retracement level and the ascending channels support line. Those two including the fast fall after the spike is a very bearish sign. From here I am expecting the price to go to the 0,41444$.


Market sentiment 

Ripple’s sentiment is bearish as hourly chart technical indicators are signalling a sell.


Pivot points

S3 0.37042 
S2 0.40775 
S1 0.42707 
P 0.44508 
R1 0.46440 
R2 0.48241 
R3 0.51974

Conclusion


More downside is expected for the cryptocurrency market as support levels have been broken. Maybe a small rebound could be seen but that would be short-lived.

Categories
Crypto Market Analysis

Daily Crypto Update 31.07.2018 – Breakout From The Downside As Expected


General overview


  • Market Cap: $278,463,268,852
  • 24h Vol: $15,188,740,539
  • BTC Dominance: 48.0%

From yesterday’s high at $299B the evaluation of the cryptocurrency market cap has fallen by 23 billion, as today’s low was around $276B. This was expected as a triangle pattern formed on the global chart.

Consequently, the market is currently in red with an average percentage of change among top 100 coins ranging from 3-7%.  The biggest loser is Pundi X with a decrease of 19%.


News


As the market experienced a decline in the evaluation, many headlines are analytical in nature. However, some significant headlines have come out in the last 24 hours.

Australian Government Awards Grant to Blockchain Project for Sustainable Sugar

The Australian government has granted A$2.25 million ($1.7 million) to the Sustainable Sugar Project, Foodnavigator-Asia reports July 30. The Sustainable Sugar Project, led by the Queensland Cane Growers Organization, will use blockchain technology to track the provenance of sugar supplies to Australia. The initiative known as the Smart Cane Best Management Practice (BMP) is part of a sugar industry push for better sustainability and traceability.

It isn’t the first time the Australian government has given a grant to a blockchain start-up. Power Ledger a blockchain based solar electricity solution received about 8 million dollar grant last year for further research and development.

Chamber of Digital Commerce Proposes Guidelines for ‘Responsible’ Crypto Market Growth

The Chamber of Digital Commerce Token Alliance has released a collaborative report of proposed guidelines for “responsible growth” of the cryptocurrency market, according to their July 30 press release. The document, entitled “Understanding Digital Tokens: Market Overviews & Guidelines for Policymakers & Practitioners,” is broken up into three sections: a regulatory overview of digital token markets in five countries, principles for those distributing digital tokens that are not intended to be securities, and economic coverage of the “global token landscape.”

It is an obvious attempt to provide the regulators more material on the cryptocurrency market as the SEC is more and more active in the regulation clamp down on the cryptocurrency space with little to no understanding of the underlying technology.

China: World’s Fourth Largest Bank by Assets Trials Blockchain Loans Backed by Land

The Agricultural Bank of China (ABC), the world’s fourth-largest bank by assets, has issued its first loan on blockchain, local news outlet Financial News reported July 31. State-owned ABC, which counts itself among China’s “Big Four” lenders, revealed it had issued a loan worth around $300,000 backed by a piece of agricultural land in the Guizhou province.

This headline is significant as China’s stance toward cryptocurrency was negative in the past, but it looks like they are switching the tone as they are getting more and more informed of the benefits that adopting blockchain and cryptos are carrying.

Major Swiss Online Bank Posts Soaring Profits After Offering Clients Crypto Investing

Online banking service provider Swissquote has seen a 44 percent surge in profits in the first half of 2018, an uplift attributed to the “crypto boom” earlier this year, local news outlet Finews reports July 31. In July 2017, the Swiss-based online bank was credited by many with becoming “the first” European online bank to launch Bitcoin (BTC) trading accounts for its clients.

Nobel Prize Winning Economist Paul Krugman Expresses Skepticism About Crypto, Predicts Collapse

Nobel Prize winning economist Paul Krugman has expressed his skepticism about the value of cryptocurrencies in a New York Times Opinion piece published July 31.

Source: cointelegraph


Analysis


BTC/USD

From yesterday’s open at 8265$ the price of Bitcoin has decreased by 6,21% and is currently trading at 7732$.


Looking at the two-hour chart, we can see that the price of Bitcoin has broken down the descending triangle and is currently sitting right on the 0,236 Fibonacci retracement level. This breakout to the downside of the triangle was expected and explained in yesterday’s report and because these current levels aren’t going to serve as strong support, so more downside is expected, maybe after some consolidation. If that happens and the price goes below the 0,236 Fibo level the next target would be the baseline support 2 (black dotted line) at around 7400$.


Market sentiment 

Bitcoins hourly chart technical indicators are signalling a strong sell.


Pivot points

S3 7233.1
S2 7673.6 
S1 7926.6 
P 8114.1 
R1 8367.1
R2 8554.7 
R3 8995.2

ETH/USD

From yesterday’s high at 456,9$ the price of Ethereum has dropped by 5,2% and is currently trading at 433$.


On the 2 hour chart, we can see that the breakout was real and that the price has recovered a bit to the channels support line retesting it for resistance. It looks like the price is getting rejected by those levels which is why I would expect more downfall for Ethereum in the upcoming period.


Market sentiment

Ethreum’s hourly chart technical indicator signal a sell.


Pivot points

S3 411.23 
S2 434.49 
S1 445.57 
P 457.75 
R1 468.83 
R2 481.01 
R3 504.27

XRP/USD

From yesterday’s at 0,45548$ the price of Ripple has decreased by 5,31% and is currently trading at 0,431$


Looking at the 2 hour chart we can see that the price has broken out off of the ascending channel in which it was consolidating which is why more downside is expected from here.


Market sentiment

Ripple’s hourly chart technical indicator signal a sell.


Pivot points

S3 0.40185 
S2 0.42371 
S1 0.43485 
P 0.44557 
R1 0.45671 
R2 0.46743 
R3 0.48929

Conclusion


In yesterday’s report I have discussed the possibility of a breakout from the downside for the major cryptos as well as the global chart market cap evaluation. As that happened yesterday, in the upcoming days more downside is expected for the crypto market.


Categories
Crypto Market Analysis

Daily crypto update 30.07.2018 – Consolidation Before A Breakout


General overview


  • Market Cap: $293,468,610,906
  • 24h Vol: $13,964,438,115
  • BTC Dominance: 47.7%

From yesterday’s high at 299,774,000,000$, the evaluation of the cryptocurrency market capitalization has decreased by 6,3 billion as its currently sitting at around $293,4B. As you can see from the global chart the evaluation is narrowing down in a triangle like pattern. This consolidative structure has formed as the evaluation failed to break the $300B mark, and from the current level, I would expect the evaluation to go further down to the triangle’s support around $290B. If that level holds than another attempt at the breakout on the upside can be a possibility, but a breakout from the downside is more likely to 284B level.

Following the 6,3 billion dollar decline, the market is currently in red but with a small average percentage of change among top 100 coins ranging from 1-5%. The biggest loser is Mithil which decreased by 17% in the last 24 hours.


News


In the last 24 hours, most significant headlines are those that can fit into the adoption category.

First by its adoption magnitude is the news story of Iran’s plan on creating a state-back cryptocurrency in the midst of the announced U.S. sanctions that will take effect in August. As reported by the Iranian media, a senior official within the government says that the currency could be developed in the next three months. This measure against the sanctions is definitely constructed with Venezuela’s example in mind, as they have developed their cryptocurrency ‘petro’ to surpass the imposed U.S. sanctions in 2017.

The second headline that caught my attention as I viewed it as significant is that Commonwealth Bank of Australia (CBA) successfully, facilitated a shipment of 17 tonnes of almonds from Australia to Germany and in that process tested their supply management system based on the Ethereum blockchain according to a press-release on Monday. Chris Scougall, managing director of industrials and logistics in client coverage at CBA, said in a press release.


“We believe that blockchain can help our partners reduce the burden of administration on their businesses and enable them to deliver best-in-class services to their customers,”

CBA facilitated all three key services in this type of trade deals–shipment operations, documentation and finance issues – by using the cryptocurrency technology.

The third headline by its significance in the adoption category is that Nasdaq discussed with Gemini and other crypto exchange representatives the future trends in regulation and the ways those exchanges can be in line with them as a way to improve the image of the cryptocurrency market in general, a source familiar with the matter told Bloomberg. This interest and reaching out seen by Nasdaq to the cryptocurrency exchanges certainly isn’t because they want to help other exchanges. It looks like they want to take advantage of the cryptocurrency market potential when it’s still an evolving market and push it to the mainstream providing more legality and in the end maintaining their position as the operator of one of the worlds largest exchanges.

In April, Bloomberg reported that “Gemini partnered with Nasdaq to use its advanced surveillance system to prevent and control market manipulations.” and they have confirmed last week that they are offering their technological solution to SBI Virtual Currencies and three other cryptocurrency exchanges that were not disclosed.

This is very important especially when the Winklevoss brothers, Bitcoin Trust application for an ETF was declined again with an explanation that The Securities and Exchange Commission doesn’t find the product safe enough for investors. The SEC said that it cannot “conclude that bitcoin markets are uniquely resistant to manipulation.”

So potentially is Nasdaq provides the solution to that problem with their surveillance technology that can provide more certainty for the SEC to approve a Bitcoin ETF soon.


Analysis


BTC/USD

From yesterday’s open which is also yesterday’s high at 8276$ the price of Bitcoin has decreased by 1,84% as its currently trading at 8128$.


As it can be seen on the hourly chart, the price action has formed a descending triangle and is currently interacting with its support levels. Descending triangle pattern usually breaks from the downside and that already happened on Friday but the price action found itself back in it again, which means that buyers are there. This triangle pattern is similar to that on the global chart, so I would expect a breakout soon. This pattern could be interpreted as a bull flag buy investors and traders and they might act accordingly – buying at support, which would result in a breakout to the upside. However, that is highly unlikely.


Market sentiment 

Hourly chart technicals support the bearish scenario as they signal a sell.

Oscillators are signaling a sell, and moving averages a strong one.


Pivot points

S3 7838.5 
S2 8028.8 
S1 8124.9 
P 8219.1 
R1 8315.2
R2 8409.4 
R3 8599.7

ETH/USD

From yesterday’s open and high at 471,3$ the price of Ethereum has decreased by 3,65% as its currently trading at 453$.


Looking at the hourly chart we can see that the price of Ethereum has broken out off of the ascending channel on the downside and judging by the size of that red candle it isn’t an interaction with the support that will result as a wick on the higher time-frame like it did prior three times. As I think Ethereum is lagging behind Bitcoin, and it didn’t retest the prior low on the daily chart, this breakout is going to push the price of Ethereum significantly down in the upcoming period – if the breakout doesn’t end like a fakeout that is.


Market sentiment 

Ethreum’s hourly chart technicals signal a sell.


Pivot points 

S3 444.41 
S2 455.61 
S1 461.04 
P 466.82 
R1 472.25 
R2 478.03 
R3 489.24

XRP/USD

From yesterday’s open at 0,454$ the price of Ripple has decreased by 2,5% and is currently trading at 0,442$.


On the hourly chart we can see that the price of Ripple is in a similar position like the price of Ethereum – its on the support levels of the ascending channel, but unlike the Ethereum, Ripple’s price is just starting to interact with it. As the price struggled to exceed the 0,453$ level where 0 Fibonacci retracement level is this decline is the logical progression of the price pathway. If we have in mind the global chart, the Bitcoin chart and the Ethereum’s potential breakout, we can say that a breakout on the downside should be expected.


Market sentiment 

Hourly chart technical indicators are signaling a sell.


Pivot points 

S3 0.43719 
S2 0.44567
S1 0.44939
P 0.45415 
R1 0.45787
R2 0.46263 
R3 0.47111

LTC/USD

From yesterday’s open at 85,118$ the price of Litecoin has decreased by 5,27% as its currently sitting at 80,786$.


On the hourly chart, we can see that yesterday’s open was on the triangles resistance line which again rejected the price and has sent it on a downward trajectory. The price is currently sitting on the minor range support, but I am expecting it to continue going down to the ascending channels support at around 78,111$.


Market sentiment

Like in the case of other cryptos, Litecoin’s hourly chart technical indicators are signaling a sell.


Pivot points 

S3 80.043 
S2 82.184 
S1 83.130 
P 84.325 
R1 85.271 
R2 86.466 
R3 88.607

Conclusion


As the prices of four major cryptocurrencies are interacting with their minor support levels, and Ethereum is showing early stages of a breakout, more downside is expected in the upcoming period for the cryptocurrency market. Bitcoin’s chart is similar to that of global pattern wise, and this doesn’t come as a surprise as Bitcoin’s dominance has increased to 47,7%. On the global chart, we have seen an attempt to break the $300B mark, after which the market is consolidating. After the consolidation, a breakout on the downside is most likely, but it is also possible that buyers make another attempt at breaking that level. If that happens, and I hope it does the prices will go further up but not that further as sellers are just waiting for a better price to dump their holdings.

I hope this happens as it would be a healthy move for the market thus making further projections more accurate. This would result in dumb money getting dumped on which would cause them to give up buying and those who are willing to sell are going to push the prices down where they should have gone.

Categories
Crypto Market Analysis

Daily crypto update 24.07.2018 – Recovery Continues


General overview


Market Cap: $298,408,763,099

24h Vol: $20,100,077,895

BTC Dominance: 47.0%

From yesterday’s open at around $280B the evaluation of the cryptocurrency market has increased by 20 billion dollars as it is currently sitting just slightly below 300B.

As you can see from the chart above it has entered the seller’s territory and that resistance is pushing the evaluation down, but buyers are aggressive which is why there’s a cluster forming around those levels.

The market is mostly in green with an average percentage of change among top 100 coins ranging from 3-6%.


News


In the last 24 hours, the most significant headlines are essentially positive in sentiment, but there aren’t any major headlines that are causing this bullish sentiment fundamentally. These are some of the headlines:

Gibraltar Stock Exchange’s Blockchain Platform Opens to Public Trading

The UK Overseas Territory of Gibraltar launched its Gibraltar Blockchain Exchange (GBX) July 23, a press release confirmed, opening up cryptocurrency trading.

TRON Acquires Major P2P Platform Operator BitTorrent

TRON’s long-rumoured acquisition of BitTorrent Inc., the operator of popular torrent client uTorrent, has been confirmed by TRON founder Justin Sun in a community letter published July 24

Google to Offer Distributed Ledger Solutions in Cloud Platform Marketplace

Google is joining the list of tech giants to deploy blockchain technology to offer customers fintech and cloud service solutions, according to an official statement Monday, July 23.

Crypto Exchange Giant Binance to Launch Operations in South Korea: Report

Binance, the world’s largest cryptocurrency exchange by trading volume, is reportedly planning to enter South Korea, one of the world’s major crypto trading markets.

Many headlines are analytical in nature and in favor of the bullish sentiment. Some of the headlines that fit into that category are the following:

$300 Billion: Cryptocurrency Market Cap Hits Major Milestone as Bitcoin Soars

Prominent Investors Bullish on Bitcoin Reaching $8,100 With Strong Volume

Bitcoin Price Blitzes to $8,200 but Wider Crypto Markets and Tokens Suffer


Analysis


BTC/USD

In the last 24 hours, the price of Bitcoin has increased by 11,2% coming from 7380$ to 8182$ where it is currently trading.


Looking at the hourly chart, we can see that the price has broken the triangle resistance line and is blazing upwards exponentially. The price has found resistance and has retraced since the spike up to 8362$. Since the price has increased exponentially, a retracement is expected.


Market sentiment 

Bitcoin is in the buy zone.


Pivot points

S3 6745.9 
S2 7191.9 
S1 7455.9 
P 7637.9 
R1 7901.9
R2 8083.9 
R3 8529.9

ETH/USD

From yesterday’s low at 448$ the price of Ethereum has increased by 6,36% and is now trading at 476$.


As you can see on the hourly chart the price has gone to channels resistance line and found support there. Currently, it is at the midpoint of the channel and judging by the cluster a retracement should be expected.


Market sentiment 

Hourly chart technicals signal a buy.


Pivot points

S3 406.20 
S2 430.80 
S1 440.20 
P 455.40 
R1 464.80 
R2 480.00 
R3 504.60

XRP/USD

From yesterday’s open at 0.448$ the price of Ripple has risen by 2,16% and is now sitting at 0,458$.


As you can see from the hourly chart, the price went even further to 0,468$ but since it went above the 0 Fibo level, it had to pull back to retest it for support.


Market sentiment 

Ripple is in the buy zone.


Pivot points

S3 0.40488
S2 0.42765 
S1 0.43633 
P 0.45042 
R1 0.45910 
R2 0.47319 
R3 0.49596

Conclusion


As the prices increased over the last couple of days, new participants are coming into the market which is why we have seen this small increase over the last 24 hours. Recovery continues but for how long we are yet to see.

Categories
Crypto Market Analysis

Daily crypto update 23.07.2018


General overview


  • Market Cap: $288,355,459,859
  • 24h Vol: $13,743,240,958
  • BTC Dominance: 45.9%

From Friday’s low at 280B the evaluation of the cryptocurrency market cap has even lower on Saturday to around 272,506,000,000$ which was the weekends low. After that, the evaluation has been steadily rising and is now sitting just slightly below 290B.

The market is mostly in green, with an average percentage of change among top 100 coins ranging from 3-8%. The biggest gainer is Holo who increased by a staggering 64%. Next is Bitcoin Diamond with an increased of 52% and two-three more coins have shown gains of around 12%.


News


Two of the 12% gainers that are mentioned are Nuls and Augur. Fundamental are impacting the price, and the traction is picking up creating a small hype around them for now, but I will look if this hype increased over the next day or so.

NULS Spikes as Binance Backs Mainnet Token Swap

Nuls (NULS), the virtual coin of a project for a commercial blockhain ecosystem, leapt nearly 14% on a daily basis on Monday morning (UTC), reaching $2.76, a level not seen since mid-June, when the project announced its main network (mainnet) token swap. The possible reason for NULS price growth, which was one of the largest this morning, may be the announcement of Binance support for the NULS swap.

Augur (REP) Price Booms as Betting on its Platform Picks Up

REP prices have been picking up again, adding more than 26% overnight to reach $37.36 as of 4:30 UTC. The jump in prices comes on the back of surging volumes, with trading of REP against BTC on Binance gaining notable traction. Still, the most active trading of Augur, almost half of the total volume, happens on Upbit, against the Korean Won.

Source: Coinvest


Analysis


BTC/USD

From yesterday’s low at 7331$ the price of Bitcoin has increased by 4,39% and is now trading at around 7696$.


Bitcoin has reached another significant resistance level at the 0.236 Fibo line where also the resistance line of the triangle from the daily chart is.


Market sentiment 

Bitcoin is in the buy zone.


Pivot points

S3 6942.1
S2 7188.0 
S1 7292.8
P 7433.9 
R1 7538.7 
R2 7679.8 
R3 7925.7

XRP/USD

The price of Ripple has been hovering around the same levels from Friday, and the price hasn’t changed much.


As you can see from the hourly chart, the price is sitting around 0 Fibonacci retracement levels.


Market sentiment 

Hourly chart technicals signal a sell.


Pivot points

S3 0.41922 
S2 0.43596 
S1 0.44238 
P 0.45270 
R1 0.45912 
R2 0.46944
R3 0.48618

LTC/USD

The price of Litecoin has changed by only 1,1% since yesterday’s low at 82$.


As you can see on the chart things are looking pretty calm, which is why I am expecting some more sideways movement.


Market sentiment 

Hourly chart technicals signal a sell.


Pivot points

S3 77.505 
S2 80.100 
S1 81.160 
P 82.695 
R1 83.755 
R2 85.290 
R3 87.885

Conclusion


The market is experiencing some short-term sideways movement and in the following day, we will see where this trend wants to go.

Categories
Crypto Market Analysis

Daily crypto update 20.07.2018 – Uptrend Confirmation


General overview


Market Cap: $284,394,661,536

24h Vol: $16,128,684,818

BTC Dominance: 45.0%

From yesterday’s level, the evaluation of the cryptocurrency market capitalization has decreased by 4 million dollars which is not that significant. As you can see on the chart below the evaluation has formed a plateau. 

The market is mixed in colors, with an average percentage of change among top ranging from 2-4%.


News


Looking at the headlines that came out in the last 24 hours I see that many are analytical in nature as everyone is now speculating on whether the cryptocurrency market has reached its bottom, because of the rebound that the market has experienced.

Some of the headlines that fit that category are the following:

Bitcoin Rally Converts Staunch Bear, Sees Price Breaking Above US$8,000

Billionaire Investor Says No One Wants to Buy Bitcoin, Market Shows Otherwise

‘I’d Like to See Us Test $5,000’: BitMEX CEO Pragmatic on Bitcoin Price Rise

Bitcoin Price and Seasonality: The Coming Rally?


Analysis


BTC/USD

From yesterday’s open at 7290$ the price of Bitcoin has increased by 2% and is currently sitting around 7467$.


As you can see from the hourly chart the price action is testing the resistance line of the prior triangle support (bold blue line) and has formed a symmetrical triangle around it. The breakout looks near and judging by the steepness of the support line it looks like buyers are more aggressive at the moment which is why a breakout on the upside is more likely, but not by more than 15% likely.


Market sentiment

Hourly chart technicals signal a buy.

Moving averages are signaling a strong buy.


Pivot points

S3 6881.1 
S2 7159.7 
S1 7316.6 
P 7438.3 
R1 7595.2 
R2 7716.9 
R3 7995.5

ETH/USD

From yesterday’s high at 483$ the price of Ethereum has fallen by 4% as its currently sitting at 464$ level.


As it can be seen on the hourly chart, the price action is in the channel and currently in the lower midpoints of the channel. As the market is correlated, if the price of Bitcoin goes up so will the price of the Ethereum to the channels resistance line at least.


Market sentiment 

Hourly chart signals a sell.


Pivot points

S3 428.44 
S2 450.16 
S1 459.40 
P 471.88 
R1 481.12 
R2 493.60 
R3 515.32

XRP/USD

From yesterday’s open at 0.493$ the price of Ripple fell to 0.448$ level but has recovered since and is currently sitting at 0.462$ which is an overall 6,35% decrease


Looking at the hourly chart we can see that the price fell steeply and quickly which indicates that the demand was not that strong, but currently, we are seeing a higher low which is an indicator of a starting uptrend.


Market sentiment 

Hourly chart technicals signal a sell.


Pivot points

S3 0.43408 
S2 0.45760 
S1 0.46732
P 0.48112 
R1 0.49084
R2 0.50464 
R3 0.52816

Conclusion


Today is a very important day because we will see either a confirmation that the uptrend started or an invalidation, and a shift toward a short-term recovery in a downtrend scenario.

Categories
Crypto Market Analysis

Daily Crypto Update 17.07.2018 – Trend Continuation Or A Retracement


General Overview


Crypto Trend Analysis:

Market Cap: $271,154,252,040

24h Vol: $15,384,760,656

BTC Dominance: 42.5%

In the last 24 hours, the evaluation of the cryptocurrency market capitalisation has increased from 254,441,000,000$ which was yesterday’s low, to 273,729,000,000$ which is today’s high. Since this high, the evaluation has retraced slightly.

Crypto Trend Analysis

The market is in green with an average percentage of change by around 5%. The biggest gainer is Tenx with an increase of 31% while there are others like Powerledger, Enigma, Loom Network, WAX around 15%.


News


Top headlines that came out in the last 24 hours are mostly positive in sentiment. First among the significant headlines that already impacted the market in a positive way is that Robinhood listed Dogecoin (DOGE) on its Robinhood Crypto platform, which leads to an increase of 16% over the last 24 hours for this cryptocurrency.

Another significant headline in the similar category is that Coinbase got regulatory approval to list coins considered a security. 

Cryptocurrency exchange and wallet service provider Coinbase has received approval from the U.S. Securities and Exchange Commission (SEC) and the Financial Industry Regulatory Authority (FINRA) to list digital coins considered to be securities, Bloomberg reported July 16.

Third in the line of the similar headlines is that BitPay received BitLicense from New York Department of Financial Services.

Global crypto payments processor BitPay has been granted a BitLicense by New York state’s financial regulator, according to a press release shared with Cointelegraph July 16. The recently acquired virtual currency license from New York’s Department of Financial Services (NYDFS) will allow BitPay to do business with customers and companies based in the state. Additionally, New York-based businesses will be able to use BitPay to accept Bitcoin (BTC) and Bitcoin Cash (BCH) for purchases from users worldwide.


Crypto Trend Analysis


BTC/USD

From yesterday’s open around 6,350$, the price of Bitcoin has increased by 5.68% as its currently sitting around the 6,702$ level.


Looking at the hourly chart we can see that the price interacted with the minor resistance line and has been rejected by it, which is why it has retraced slightly. Currently, we are seeing a lower high being formed just slightly lower than the prior ones which might be an indicator of the downtrend starting, but it can also be a retracement before a breakout on the upside.


Market sentiment

Hourly chart signals a buy.

Oscillators are on neutral and moving averages signal a strong buy.


Pivot points

S3 5756.3 
S2 6179.2 
S1 6454.2 
P 6602.1 
R1 6877.1 
R2 7025.0 
R3 7447.9

ETH/USD

From yesterday’s open at 446$, the price of Ethreum has increased by 6% and is currently sitting around 473$.


On the hourly chart, we can see a similar pattern like on Bitcoin’s chart. The price has entered sellers territory which is why it has retraced since the spike at the 481$ level. Currently, the price is on the minor range support where it is testing for the support. If the support is found I would expect a breakout from the upside, but if not, I am expecting the price to fall back to the 445$ level which served as support recently.


Market Sentiment

Hourly chart signals a buy.

Oscillators are on sell and moving averages are signalling a buy.


Pivot Points

S3 396.67 
S2 432.54 
S1 455.82 
P 468.41 
R1 491.69 
R2 504.28 
R3 540.15 

XRP/USD

In the last 24 hours, the price of Ripple has increased by 7%, from 0.443$ to 0.474$.


Looking at the hourly chart, again, we can see a similar price action pattern like on Bitcoin’s and Ethereum’s chart. The price found first resistance significant enough to be rejected by those levels and has currently retraced to minor support level testing for support.


Market Sentiment

Hourly chart technicals are signaling a buy.

Oscillators are on a sell and moving averages on a buy.


Pivot points

S3 0.38614 
S2 0.42809 
S1 0.45526 
P 0.47004 
R1 0.49721 
R2 0.51199 
R3 0.55394

 Conclusion


Judging by the position of the market cap evaluation as well as the charts analysed in today’s report, I conclude that the prices have found first resistance and the sellers are on the alert. Today we will see either a breakout on the upside if the sellers don’t get nervous and let the buyers push the price, or, a retracement of this uptrend to the first support levels. I think the second scenario is more likely because in order for the prices resistance to be broken, strong support is needed and there is none on the current levels.

Categories
Crypto Market Analysis

Daily Crypto Update 04.07.2018 – Bears everywhere

The market is returning all the gains of the beginning of the week in an interesting movement of the bears that shows that the general trend has not changed and that more consolidated movements are needed in order to define a real change.


General Overview


Market Cap: $263.141.302.151

24h Vol: $15.751.561.828

BTC Dominance: 42.2%

The cryptocurrency market capitalisation has dropped by 10 billion in 24-H

Coin Market Trends

Only 14 of the top 100 Cryptos are in green numbers today, this is showing the big percentage of sellers around.


Top 100 Gainers of the day

  1. Syscoin             49,61%
  2. Decentraland  33,11%
  3. Steem               6,66%
  4. Status               6,54%
  5. SmartCash      6,24%

Top 100 Losers of the day

  1. BCN                      -16,35%
  2. Golem                   -14,02%
  3. WAX                     -12,46%
  4. Mixin                    -12,24%
  5. Loom Network   -11,34%

 News


There is not any considerable news that moves the market in the last hours, here is a short summary extracted from the portal CCN.com.

Binance Leads $12 Million Funding Round in the Tokenisation Startup Republic
A retail investment platform called Republic recently completed $12 million in financing to tokenise its platform and introduce its own security token, led by Binance Labs and NGC ECO Fund. The financing round was also supported by ZK Capital, Oyster Ventures, FBG Capital, Hazoor Capital, East Chain, Zhen Fund and others.
Source: CCN.com

Microsoft Launches Enterprise Blockchain Partnership in Taiwan
Microsoft Taiwan has entered into a partnership with Digital China and Hot Cool in the hope that the three companies can use blockchain technology to improve the financial, e-commerce, entertainment, and other industries.
Source: CCN.com

Bermuda Amends Banking Act to Favour Blockchain Startups
Bermuda continues its push to become a global hub for blockchain and fintech innovation, having recently announced plans to change its banking laws to create a class of banks catering to blockchain and fintech companies, according to Finextra. The amendment to the country’s Banking Act follows the recent passage of a Digital Asset Business Act and an initial coin offering (ICO) bill.
Source: CCN.com


COIN MARKET TRENDS ANALYSIS


NEO/USD

NEO is trying to cross the lower side of the bullish pennant pattern in this 60-minute chart after bouncing in the upper side around $37.40. A breakout of this level could be an opportunity to go short in the short term and against the rules of the trend, the bulls have lost strength and they are returning an important part of the 22% of gains of the last two days.


We must wait for a confirmation of the break to enter about $35.31 and look for the $35.17 (Fib. 61.8%) and then the $34.28 (Fib. 76.4). We can go short in $35.31, placing a stop loss at $36.17, take 70% profit at $34.28 and look for the Pivot S2 at $33.16 or the 100% Fib Retracement.


Market sentiment 

Hourly chart signals buy.

Oscillators are leaving oversold levels and pointing up.


Pivot points

S3 41.59 
S2 40.28 
S1 38.51 
P  36.71 
R1 34.48 
R2 33.17 
R3 30.94 

BTC/USD

BTC/USD has lost -2.34% in the last 24-H while the buyers weren’t strong enough to maintain the upside momentum and to beat the important resistance at $6,700, with the opening of the Asian Market, the bearish pressure has started and Bitcoin goes back to lower levels close to the Pivot S1 and is sitting at $6,460.


The technical perspective is showing us a possible bounce in this EMA-100 of this 1H chart according to the readings of the RSI and Stochastic showing oversold levels, another test to the EMA-100 could encourage the buyers to push the price again and send it to test $6.676 again.


Market sentiment 

Hourly chart signals buy.

Oscillators are leaving oversold levels and neutral.


Pivot points

R3 6830.92
R2 6750.36
R1 6627.50
PP 6546.94
S1 6424.09
S2 6343.53
S3 6220.67

XRP/USD

XRP has returned more than 62% of its last rally in just 24 hours and has not been able to keep the support at $0.4889, at this moment the price is held by the EMA-100 and if a break by the bears happens we could see a fast drop down to the $0.4500 zone.


Market sentiment 

Hourly chart signals sell.

Oscillators are in oversold levels and pointing up.


Pivot points

R3 0.5521
R2 0.5360
R1 0.5102
PP 0.4940
S1 0.4683
S2 0.4525
S3 0.4265

Conclusion


Coin Market Trends: Although a correction in the rise was expected, this has been quite long and it is still possible that we continue to see minimums in most of the pairs while the BTC continues to feel the pressure of the sellers.

Categories
Crypto Market Analysis

Daily Crypto Update 02.07.2018 – Consolidation


General Overview


Market Cap: $255,642,066,379

24h Vol: $14,559,907,139

BTC Dominance: 42.6%

Cryptocurrency Market Consolidation: In the last 24 hours, things haven’t changed much. After the initial spike up, the evaluation of the cryptocurrency market is stagnating making a plateau around 256 billion dollars.

Cryptocurrency Market Consolidation

The market is mostly in red but is showing a mixed colour. The average percentage change is ranging from 0,5-2%. The biggest loser is MOAC who decreased by 21%, and the biggest gainer is FunFair who increased by 10.82%.


News


The only significant news that came out in the last 24 hours is that a flood in China has damaged a lot of mining gear in the Sichuan province, as reported by cointelegraph. The province is known for the crypto mining operations, and cold weather and cheap electricity attracted a lot of miners there. After the heavy rain from 27 to 29 of June, the province was flooded which resulted in the damage of a lot of mining equipment.

Many news outlets, including Golden Finance – Chinese blockchain and crypto information platform who originally reported on this subject, have associated the floods in Sichuan with a drop in Bitcoin network’s hashrate.

The most significant story that came out over the weekend is the speculation on what pushed the price of Bitcoin higher. Some say it is because CME futures expired on 29th of June but there isn’t any detailed analysis of this correlation.


Analysis


BTC/USD

The price of Bitcoin has experienced a recent pop in price, but in the last 24 hours, the price has decreased by 53$.


The price is currently in a descending channel in which it is consolidating after a recent increase which didn’t go above 0 Fibonacci level.


Market sentiment

Hourly chart technical signal a buy.

Oscillators are signalling a sell, and moving average a strong buy.


Pivot points

S3 5990.1 
S2 6170.0 
S1 6259.8 
P 6349.9 
R1 6439.7 
R2 6529.8 
R3 6709.7

ETH/USD

In the last 24 hours, the price of Ethereum has decreased by only 4$.


Looking at the hourly chart we can see that the price is in a descending channel, consolidating, like in the case of Bitcoin.


Market sentiment 

Hourly chart technicals signal a buy.

Oscillators are on sell, and moving averages signal a buy.


Pivot points

S3 426.43 
S2 438.84 
S1 445.44 
P 451.25 
R1 457.85
R2 463.66 
R3 476.07

XRP/USD

From yesterday’s open at 0.468$, the price of Ripple has decreased by 2.39%.


On the hourly chart, we can see the same pattern like on the Bitcoin and Ethereum charts – a rise in the form of a big green candle after which the price is currently consolidating in a descending channel.


Market sentiment 

Ripple is in the sell zone, unlike the previous two cryptos.

Oscillators are signalling a sell, and moving averages also.


Pivot points

S3 0.42020
S2 0.44020 
S1 0.45070 
P 0.46020 
R1 0.47070 
R2 0.48020 
R3 0.50020

Conclusion


Cryptocurrency Market Consolidation: As you can see from the top cryptocurrencies that are covered in this report, the markets are strongly correlated. The rise in evaluation caught many off guard, which is why the prices are consolidating. What will happen after the consolidation there aren’t any signs, but if the pump was artificial, the dump will be worse, like when we saw the last two times this happened – on a short squeeze and again recently in June.

Categories
Crypto Market Analysis

Daily Crypto Update 28.06.2018 – More Downside Expected


General Overview


Market Cap: $246,339,425,253

24h Vol: $10,306,976,047

BTC Dominance: 42.5%

Yesterday the evaluation of the cryptocurrency market capitalization started off with 250,553,000,000$ and from there it fell to 242,196,000,000$ today. Since that low, it has recovered to just slightly below 250B again before it fell back again.

The market is currently showing mixed colours but the more dominant is green. The average percentage change is ranging from 0.5-2%. Biggest gainer among top 100 coin by market capitalisation is Mithril which increased by 19%.


News


There aren’t any significant news items that could impact the market either positively or negatively at this point. However, there are some follow-ups from yesterday and other news that could impact the prices of particular coins.

First in the line is that ZenCash and Tron are added as payment options on Pornhub.

According to a blog post by ZenCash, the new integration will allow users to set up recurring payments and simply pay-per-use while leveraging the anonymity of the privacy coin.

This new use case for these cryptos could impact the price positively, much like it did for Verge when a similar announcement was made.

In the case of EOS, the news is negative. Dan Larimer the CTO of EOS project has proposed rehauling the project’s existing constitution to limit so-called arbitrators’ powers, in an EOSGov Telegram chat yesterday, after the recent mishaps the network has experienced. Three distinct groups work to ‘keep one another in check,’ as defined by the project’s current constitution which are known block producers and is similar to miners in the Bitcoin network.

This could impact the price of EOS negatively as FUD (Fear, Uncertainty and Doubt) takes over.

In the other news that fit into law/regulation category, the most significant one is coming from Hong Kong.

Hong Kong’s Securities and Futures Commission (SFC) released their annual report yesterday, in which they state that they will “keep a close watch” on crypto and Initial Coin Offerings (ICO), as reported by cointelegraph.

The SFC notes that since new technologies “come with risks,” they will be looking closely at crypto and ICOs and “intervening when appropriate.” The report states that the SFC took regulatory action against crypto exchanges and ICO issuers in Hong Kong this year, and released two public warnings to investors about the risk of investing in crypto.

One of the headlines that is neglected but provides an insight into the current fundamentals of the Bitcoin network is the study of Diar in which the analysed Lightning networks usage and transactions, and they have concluded that “the reliability of successfully routing a payment on the Lightning Network is still quite low”.

But while the capacity and the number of nodes as well as channels are increasing steadily, the reliability of successfully routing a payment on the Lightning Network is still quite low, especially for larger amounts. The success rate for a payment for no more than a few dollars between random LN nodes is 70%

The last headline is the one that follows up on Facebook’s ad unban. As you may remember, a few days ago Facebook has decided to lift the ban from cryptocurrency related advertisements.  This follow up is a more detailed view of the implications and the actual changes that are going to be made to their “misleading or deceptive promotional practices” policy.

On June 26, the same policies were again updated and Facebook announced that it would allow cryptocurrencies to be advertised again, but ICOs would remain banned. The company stated that it had been looking at the best way of refining its blanket ban on cryptocurrency adverts.

The revised “prohibited products and services policy” now reads:

“Starting June 26, we’ll […] allow ads that promote cryptocurrency and related content from pre-approved advertisers. But we’ll continue to prohibit ads that promote binary options and initial coin offerings.”

The phrase that caught attention was ‘pre-approved advertisers’, which means that not everyone who wants to advertise will be able to do so.

This censorship will allow Facebook more power to promote those coin and projects that are aligned with their agenda or even moderate content as to create a certain impression of a particular project.


Analysis


XRP/USD

Since yesterday’s open, the price of Ripple hasn’t changed much, as the percentage change is only +0.6%. The price went higher than on the open but it fell down to the prior levels quickly.


As you can see from the hourly chart, there’s a bearing pennant from which I am expecting a breakout on the downside. Currently, the price is on the levels of the pennants support in an upward trajectory which is why first I would look out for a bounce from the resistance line before confirming the breakout’s direction.


Market sentiment 

Ripple is in the sell zone, as indicated by hourly chart technicals.


Pivot points

S3 0.40898 
S2 0.43698 
S1 0.45409
P 0.46498 
R1 0.48209 
R2 0.49298 
R3 0.52098

NEO/USD

From yesterday’s open the price of Neo has increased only by 1.34% and is now sitting at around 30$ like yesterday.


The price action has formed a triangle and the breakout is near. From which side the breakout is about to happen we are yet to see but judging by the steepness of the support angle it looks like buyers are more aggressive at this point. But as this is a symmetrical triangle, a breakout from both sides has the same probability. If the price goes up I would be looking at a 33.8$ level as a target, and if it goes down I would look out for 26.28$ level.


Market sentiment 

Neo is in the sell zone, as indicated by the hourly chart technicals.


Pivot points

S3 27.82 
S2 28.97 
S1 29.67 
P 30.13 
R1 30.83 
R2 31.29 
R3 32.44

DASH/USD

From yesterday’s open at 229.4$, the price of Dash has decreased by 3.25% and is now sitting at 221.5$.


On the hourly chart, nothing has changed much. My target of 211.8$ remains the same.


Market sentiment

Dash is in the sell zone.

Oscillators are signalling a sell and moving averages signal a strong sell.


Pivot points

S3 208.22
S2 217.78
S1 223.09
P 227.34
R1 232.65
R2 236.90
R3 246.46


Conclusion


As the market cap evaluation hasn’t gone beyond the 250B level, and the chart of three cryptos that were covered in this report are forming bearish patterns, more downside is expected.

Categories
Crypto Market Analysis

Weekly Crypto Update 27.06.2018 – One More Low Expected To The Bottom


General Overview


Market Cap: $245,897,879,486

24h Vol: $10,982,438,642

BTC Dominance: 42.6%

From last Monday, the cryptocurrency market has been in a constant decline as the market fell from 294,184,000,000$ which was last weeks high on Tuesday 19.06.2018. The lowest the crypto market has been was on Sunday when the crypto market capitalization hit 235,331,000,000$.

Those levels were expected to be a lower low after which the cryptos were going to recover, but as the new high failed to exceed the prior one, there aren’t any signs of a trend reversal, and the evaluation is close to the last low levels. This situation implies that a lower low is more likely and that this is the bottom after which the trend reversal is going to start.


News


Out of those stories that marked the past week, the most significant one is the Bithumb hack.

Bithumb, which has fallen from 6th to 10th place for cryptocurrency exchanges worldwide by trading volume, has had about $30 million worth of cryptocurrencies stolen in an apparent hack.

This headline created a lot of FUD (fear, uncertainty, and doubt) in the market and many blamed this event as the fundamental reason of the continuation of the bear market, which was not the case as this exchange is not that large.

In the law and tax category, there are two major headlines. First is that  U.S. federal employees will have to report their cryptocurrencies holdings if they equal more than $1,000 or made more than $200 during the reporting period. The other one is that the Uruguayan Chamber of Fintech has announced the creation of a special committee to develop a framework for crypto regulation and promote innovation to support the country’s financial system.

Both of this news is positive, as the first one implies that cryptocurrency is valuable and should be reported as “other forms of securities.”

In the adoption category, the news items that stands out is the news of Square receiving the New York BitLicense. The announcement means that Cash App users in every state except for Georgia and Hawaii now have the option to buy and sell Bitcoin.


Analysis


BTC/USD

From the opening on Monday, June 18 at 6875$, the price of Bitcoin has decreased by 11.19% as it is now sitting around 6110$. The opening price is the highest Bitcoin has been, and the lowest was at 5770$, from which it quickly recovered closing as a Doji candle with a big a wick from the downside on the daily chart on 24.06.2018.


Looking at the daily chart, we can see that the current wave is near completion, but it looks like another low might happen whos target I’ve projected to be from 5664$ on the supportive significant level (purple dotted line), to 5515$ which is the support line from which Bitcoin created the all-time high. As I think this current wave is the wave X of the WXYXZ sideways correction, I am waiting to see signs of the short-term trend reversal, before the price continues to new lows.


Market sentiment 

Daily chart technicals signal a strong sell.

Oscillators are on sell, and moving average signal a strong one.


Pivot points

S3 4426.3 
S2 5365.2 
S1 5758.6 
P 6304.1 
R1 6697.5
R2 7243.0 
R3 8181.9

LTC/USD

From last Monday, the price of Litecoin has depreciated in value from 100$ to slightly below 80$ which is a 20% decrease in ten days. The opening on Monday was the weeks high, and the lowest Litecoin has been is to the 73.5$ area on Sunday.


Looking at the daily chart, I am seeing another low ahead to the support line at 71.29$ which is significant as from that level the price of Litecoin went on to create the all-time high. If that level holds I would be expecting a short-term trend reversal as I think that the current wave is an X from the WXYXZ sideways correction


Market sentiment

Litecoins daily chart technicals signal a sell.

Oscillators are on sell, and moving averages signal a strong one.


Pivot points

S3 44.663 
S2 66.371 
S1 74.517 
P 88.079 
R1 96.225 
R2 109.787 
R3 131.495

EOS/USD

At the start of last week on Monday, June 18, the opening price of EOS was at 10.95$. Since then the price has decreased substantially to 8$ which is a decrease of 25.81%. The price went even lower on Sunday when it spiked to 6.89$.


Looking at the daily chart, we can clearly see that the corrective move was a WXY correction and that the Y wave is near completion. I am expecting the price to drop to the 6.58$ level were an 8/1 Gann fan level is and another support level from a prior range from whom similarly to the case of Bitcoin and Litecoin, the price created the all-time high. As this would be the last low a trend reversal would be expected, but how long would it live we are yet to see from the formations and patterns ahead.


Market sentiment

Daily chart technicals signal a sell.

Oscillators are indicating a sell, and moving averages signal a strong one.


Pivot points

S3 3.3173 
S2 6.2033 
S1 7.2797 
P 9.0893 
R1 10.1657 
R2 11.9753 
R3 14.8613

XRP/USD

From the opening price at 0.55$ last Monday, the price of Ripple has decreased by 15.48% as it is now sitting at 0.47$.


On the chart, we can see that the support at the prior low level at 0.4541$ held the price again. As the current wave is the last impulse wave I am expecting a trend reversal, but the price may fall a bit lower before that happens. The new potential low would be at the next support level at 0.4144$. However, this level may hold and the trend reversal starts happening from here. The move up would be a corrective move, probably in a form of another three-wave ABC move, which is why I am expecting the price to go down further.


Market sentiment

Ripple’s daily chart technicals indicate a sell.

Oscillators are signalling a sell, and moving averages a strong one.


Pivot points

S3 0.32270 
S2 0.41468 
S1 0.45231 
P 0.50666 
R1 0.54429 
R2 0.59864 
R3 0.69062

XMR/USD

The price of Monero is on the same levels like on Monday last week which is around 128$. The price fell by 17% from Monday to Sunday to the weeks low at 106.78$.


Looking at the 4-hour chart, we can see that the price is currently on the rise, but that would only be a corrective move from where I am expecting the price to go lower to the 100$ level, which would be the support line 2 of the support area.


Market sentiment

Monero is in the buy zone.

Both oscillators and moving averages signal a buy.


Pivot points

S3 97.133 
S2 102.972 
S1 108.811 
P 126.405 
R1 146.510 
R2  190.105 
R3 210.210

Conclusion


If you remember this was my projection from 02.06.2018

As you can see I was expecting to see on the global chart that the prior lows at around 250 billion dollar evaluation get retested, after which another similar pattern would appear.

The lows were retested and the evaluation is hovering around those levels which is why now I am looking for signs of a reversal.

After looking at the charts of major cryptos, and especially Bitcoin as it has the 42% market dominance, I think that another low is going to happen before some short-term recovery. Those lows would be to tests the support levels from where the all-time high was made in all cryptos that we’ve covered in this report.

Categories
Crypto Market Analysis

Daily Crypto Update 27.06.2018 – More Stagnation


General Overview


Crypto Market Capitalization Chart:

Market Cap: $246,600,162,313

24h Vol: $11,274,713,968

BTC Dominance: 42.5%

In the last 24 hours, the evaluation of the cryptocurrency market capitalisation has decreased from $256B to 242,426,000,000$ and has recovered slightly since.

Crypto Market Capitalization Chart

The market is currently in red with an average percentage change among top 100 coins ranging from 3 to 6%. Monaco, Nebulas and Qtum are the only ones in green with an increase of 11, 8, 7%, respectively and everything else is in red with biggest losers being around 11%.


News


In the last 24 hours, the most significant headlines that came out, many of them regarding cryptocurrency exchanges, are as follows. The first that came out is Binance suspended trading and withdrawals due to a risk warning, according to a note from Binance.

“Due to a warning from a pre-trade check in our risk management system, we will postpone the start of trading and withdrawals.

Please stay tuned for more information regarding the reopening of trading and withdrawals.

We apologise for any inconvenience and thank you for your patience.”


Meanwhile Singapore-based CoinBene and Hong Kong-based Bit-Z have introduced a new “transaction fee mining” model which made them the largest volume holders in the last 24 hours, with the first one ranked as first with more than $2.1 billion in trading volume, and second one ranked as second with about $1.5 billion in trading volume over a 24 hour period.

This impacted the rank of Binance, which previously sat in the number one spot and is now ranked fourth, with 629$ million in daily trading volume.

The third largest cryptocurrency exchange in the world by 24-hour trading volume, Huobi has announced in an email sent to investors in Japan on Wednesday, that they are to remove the Japanese option from its homepage and suspends trading services from July 2, as reported by Coinpost.

As suggested in the Coinpost report, Huobi Pro made the decision to withdraw Japan-based services because is not registered with the Financial Services Agency (FSA), Japan’s financial watchdog, as mandated under a money transaction law introduced in 2016. It is not currently clear if the exchange has been contacted by the FSA over the issue.

While we are on watchdogs, another significant headline that fits into the exchange category is that Korean Watchdog is to tighten the rules on crypto exchange bank accounts.

South Korea’s financial regulator has amended the anti-money laundering rules that apply to cryptocurrency exchanges in the country, requiring domestic banks to tighten up monitoring of related bank accounts.

According to an announcement from the Financial Services Commission (FSC) on Wednesday, the amendment – which will initially be in effect for a year – means domestic banks who provide services to crypto exchanges must now monitor all the accounts held by an exchange.

Out of the news items that’s not in the exchange related category, the most significant one is that Facebook has updated its policy to allow cryptocurrencies to once again be advertised, while upholding its ban on the promotion of initial coin offerings (ICOs), in an announcement published Tuesday, June 26, as reported by cointelegraph.


Analysis


BTC/USD

From yesterday’s open at 6251$, the price of Bitcoin has decreased by 2.66% as it’s now sitting at 6090$.


As you can see on the hourly chart, from the resistance found at 6277$, the price has been in a constant steady decline. The price interacted with the downtrends resistance line with a quick spike in order to test that resistance. We can expect that the price is going to continue its downward movement today and go to the support line at 6000$.


Market sentiment 

Bitcoin is in the sell zone.

Oscillators are on neutral and moving averages signal a strong sell.


Pivot points

S3 5673.6 
S2 5904.2 
S1 5988.8
P 6134.8 
R1 6219.4 
R2 6365.4 
R3 6596.0

ETH/USD

From yesterday’s open at 461.22$ the price of Ethereum has decreased by 6% coming to around 432$ where it is currently sitting.


Looking at the hourly chart we can see that the price is currently on the levels of the downtrend resistance line where the price is looking for support, but as the trend is down the support goes down as well. We will see if the support hold, but lower low is more likely at this point.


Market sentiment 

Hourly chart technicals signal a sell.

Oscillators are signalling neutral and moving average a strong sell.


Pivot points

S3 374.87
S2 407.37 
S1 418.35
P 439.87 
R1 450.85
R2 472.37 
R3 504.87

XRP/USD

In the last 24 hours, the price of Ripple has decreased by 3.91% from 0.4819$ to 0.4629$.


Looking at the hourly chart we can see that the price is on the same levels of the recent low as it retested the 0 Fibo level. It has recovered slightly but not nearly that fast in order to show some sign of strength, which is why I think we are in for more downside today.


Market sentiment 

Ripple is in the sell zone.

Oscillators are on neutral and moving averages signal a sell.


Pivot points

S3 0.39681 
S2 0.42945 
S1 0.44081 
P 0.46209 
R1 0.47345
R2 0.49473 
R3 0.52737

Conclusion


Looking at the charts of the three cryptos we covered in this report, I am under the impression that the prices are struggling and aren’t stable. They are at or close to the levels of the recent low as the recovery was short-lived. We are potently going to see another low today, but the continuation of the stagnation with some sideways movement is more likely.

Categories
Crypto Market Analysis

Daily Crypto Update 25.06.2018 – Short-term Recovery Expected


General Overview


Live Trading Update:

Market Cap: $254,201,622,949

24h Vol: $15,258,651,571

BTC Dominance: 41.7%

In the last 24 hours, the evaluation of the cryptocurrency market capitaliSation started off at 259,367,000,000$ and shortly after that it fell to 235,331,000,000$ yesterday. This is the lowest cryptos have been since the correction has started, and the last time we saw this evaluation was in the first half of November last year. Currently, the evaluation has recovered from yesterday’s low and is sitting on the levels prior to the drop.

Live Trading Update

The market is currently in green with an average percentage of change ranging from 5-10%. Biggest gainers among top 100 coins are WaykiChain 39%, Cortex 38%, and Theta Token 26%.


News


There aren’t any significant news items that came out in the last 24 hours. Most of the headlines are analytical in nature as the cryptocurrency market experienced the recent low, followed by interviews that reassert the bullish views on cryptos over the long run.

These are some of the headlines:

Bitcoin Price Hits 2018-Low at $5,825, Where Will it Bottom Out?

Bitcoin’s Defense of $6K Raises Odds of Relief Rally

Ether Price Drops to 10-Week Low Near $400

Cardano Co-Founder: Wall Street Will Bring ‘Tens of Trillions of Dollars’ to Crypto

Blockchain CEO Says Bitcoin Adoption Will Take a Long Time, Survivors Will Win

One of the headlines that stand out and is not from this category is that China’s state-backed monthly ratings are out and according to them, EOS in number 1. The rating is called “Global Public Chain Technology Evaluation Index” and is published by the China Center for Information Industry Development (CCID) of the Ministry of Industry and Information Technology.

EOS’ top ranking is attributed to the “outstanding technical advantages in transaction confirmation efficiency, network throughput, and transaction costs” of the protocol.

While conceding the EOS Mainnet’s recent mishaps – since going live on June 15, the network has faced technical issues, and criticism for freezing some accounts – the evaluation nonetheless judges the project to be “highly active in technological innovation,” a “new generation public blockchain” that is “currently most regarded by the industry.”

Source: cointelegraph


Analysis


BTC/USD

From yesterday’s low at 5777,3$ the price of Bitcoin has recovered by 7.54% and is currently sitting at 6224$.


Looking at the hourly chart we can see that the price of Bitcoin has fallen below the 6000$ level which was a psychologically significant level as are most round numbers. This spike at around 5700$ played out yesterday just like I’ve predicted and now the price is likely going to start to recover.


Market sentiment 

Bitcoin’s hourly chart technicals signal a buy.

Oscillators are signalling a buy and moving averages are signalling a buy.


Pivot points

S3 5061.5 
S2 5556.2 
S1 5852.1 
P 6050.9
R1 6346.8 
R2 6545.6 
R3 7040.3

XRP/USD

From yesterday’s low at 0.4417$, the price of Ripple has recovered by 9% as it is currently sitting around 0.481$.


On the hourly chart, we can see that the price has fallen below the 0 Fibonacci retracement level, which means that the price fell lowest since the correction has started as this is the ending point of the prior retracement. Currently, it looks like is testing for support on the last range support and we are yet to see if it holds.


Market sentiment 

Hourly chart technicals signal a buy.

Oscillators are on buy, and moving averages signal a buy.


Pivot points

S3 0.35393 
S2 0.41192 
S1 0.44334 
P 0.46991 
R1 0.50133 
R2 0.52790
R3 0.58589 

EOS/USD

From yesterday’s low at 6.96$ the price of Eos has recovered significantly as it rose by 15.3% coming to around 8$ where it is currently sitting.


On the hourly chart, we can see that the price action created a similar U shape bottom as in the case of Bitcoin and Ripple. After the recovery the price has experienced, it is currently looking for support on the levels from which the drop appeared.


Market sentiment

EOS is in the buy zone.

Oscillators are on buy, and moving averages signal a buy.


Pivot points

S3 4.7107 
S2 6.2507 
S1 7.1489 
P 7.7907 
R1 8.6889 
R2 9.3307 
R3 10.870

XMR/USD

Monero is another coin which experienced significant recovery. From yesterday’s low at 108.6$ the price has increased by 15.8% coming to 127$. Currently, the price has retraced a bit and is now sitting at 124.7$.


Unlike other cryptos, Monero didn’t just spike down to its lows but instead retested those levels two more times after the first spike down. The price is now above the levels from which it previously dropped, looking for support, as you can see from the chart.


Market sentiment

Hourly chart technicals signal a buy.

Oscillators are on neutral and moving averages signal a buy.


Pivot points

S3 80.973 
S2 99.403 
S1 110.097
P 117.833
R1 128.527 
R2 136.263 
R3 154.693

 Conclusion


Live Trading Update: As the prices of all major cryptos fell to their lowest since the correction has started, and in a way, retested the lowest cryptos have ever been, I am now looking for signs of a short-term trend reversal that will serve as a retest of prior highs. Spikes that we’ve seen look like the bottoms as they are V-shaped and were short lasted which is how markets usually bottom out. As those spikes could be interpreted as a missed opportunity by buyers, fear of missing out on the bottom can push the prices higher.

Categories
Crypto Market Analysis

Daily Crypto Update 19.06.2018 – Will Yesterday’s Spike Trigger a Trend Reversal


General Overview


Market Cap: $287,823,534,235

24h Vol: $12,135,483,741

BTC Dominance: 40.0%

In the last 24 hours, something strange has happened. After a period of stagnation, all of a sudden the evaluation of the crypto market cap has spiked up from 276,698,000,000$ to 289,453,000,000$. The spike wasn’t caused by news or any fundamental factors, which is why this is strange.

I have written my take yesterday on what I think has happened in the post entitled ‘The Reason Of The Sudden Rise In The Crypto Market May Be Manipulation‘ which you can read here.

The market is currently in green as a result of the rise with an average percentage change ranging from 3-5%.


News


There aren’t any significant news items that came out in the last 24 hours that can justify the up move we have seen in the market. Top headlines that came out are informative in nature and every major news outlet reported on the sudden rise in the crypto market capitalisation rise.

Crypto Markets See $13 Bln Price Spike in One Hour, Despite Negative BIS Report – cointelegraph

Investors Turn Bullish as Cryptocurrency Market adds $12 Billion 24 Hours – ccn

Bitcoin Recovery Stalls Raising Risk of Price Drop – coindesk

Majority of analysts expected a steep fall to 6000$ for Bitcoin, which is why this unexpected rise is considered a news event and was reported by many.

Other relevant news in the crypto space are the following:

US: Federal Employees to Disclose Crypto Holdings Following New Guidance

The US Office of Government Ethics (OGE) has ordered federal employees to report their holdings of virtual currency, according to new guidance issued June 18. The guidance will affect around 2 million federal executive branch employees, including the Departments of Homeland Security, the Army, Justice, Veterans Affairs, and others.

Source: cointelegraph

EOS Vulnerability Will Lead to ‘Massive Exchange Hack’, Predicts Cornell Blockchain Researcher

Cornell professor Emin Gün Sirer forecasted his belief that EOS, will be the root cause of a significant cryptocurrency exchange hack at some point during the next calendar year.

“I’m calling it: there will be a massive exchange hack within the next year, taking advantage of an EOS vulnerability. That exchange will lose its hot wallet.”

“If EOS uses its arbitrators to reverse the hack, the contagion will spread downstream,” he added. There will be threats of lawsuits involving the devs and the [block producers].”

While clarifying that this prediction is not based on any specific vulnerability he has identified or believes lies hidden within the EOS source code, he argued that such an exploit is likely inevitable given the way developers “handle safety critical bugs.”

Source: ccn


Analysis


BTC/USD

From yesterday’s opening at 6378$ until now, the price of Bitcoin has increased by 5.28% and is currently sitting around 6714$.


Looking at the hourly chart we can see that the price interacted with the unconfirmed baseline support 2 (black dotted line) and was stopped at resistance found on those levels at 6850$. Currently, the price is sitting quietly in the middle of the range, as market participants are waiting to see if the spike up will push the prices higher.


Market sentiment 

Hourly chart signals a buy.

Oscillators are on buy and moving averages signal a strong one.


Pivot points 

S3 5685.4 
S2 6164.3 
S1 6436.7 
P 6643.2 
R1 6915.7 
R2 7122.2 
R3 7601.1

XRP/USD

From yesterday’s opening, the price of Ripple has increased by 4.91% going from 0.52$ to 0.547$ where it is currently.


The price has found support at the 0.51$ level and bounced off it, and is starting to interact with the minor resistance line, as you can see from the hourly chart. We will see what happens in the following hours, but if this resistance line gets broken I would expect the price to go up to the purple dotted line which is a significant level that served as support in the past.


Market sentiment 

Hourly chart technicals signal a buy.

Oscillators are on buy, and moving averages signal a strong buy.


Pivot points

S3 0.43653 
S2 0.48395 
S1 0.51157 
P 0.53137 
R1 0.55899 
R2 0.57879 
R3 0.62621

LTC/USD

In the last 24 hours, the price of Litecoin has increased by 4.29% rising from 93.6$ to 98$ where it is currently.


On the hourly chart, we can see that the price broke out of the bearish pennant on the upside and has stopped at a minor resistance line like other coins.


Market sentiment 

Litecoin is in the buy zone.

Oscillators are on sell, and moving averages signal a strong buy.


Pivot points

S3 82.890
S2 90.100
S1 94.469
P 97.310
R1 101.679
R2 104.520
R3 111.730


Conclusion


After the sudden rise, the prices of all major cryptos including these that are covered in this report have spiked up but were stopped out at minor resistance levels which means that the momentum behind the move wasn’t strong. Today, we will see if the spike serves as a signal for market participants to start buying, and that will be confirmed if the minor resistances are going to be broken and we see a high exceeding the prior one. That will in the case of Bitcoin be around 7000$, in the case of Ripple around 0.578$ and in the case of Litecoin around 111$.

Categories
Crypto Market Analysis

Daily Crypto Update 14.06.2018 – The Market Is Stressed

The market is trying to take a break in its drop and Technical Indicators seem to be pointing to a bullish movement for some of the most important currencies, some greens are now in the charts after some important support levels were touched yesterday. The drop, however, has not been declared as finished and all the accumulated drops of the week need big buying efforts to call the following days positive for the different pairs.


General Overview


Cryptocurrencies: 1628
Market Cap: $274.212.015.277
24h Vol: $16.658.912.029
BTC Dominance: 40.1%

Market capitalisation has moved down but just by 2 billion dollar which indicates the Capital Outflow has decreased and the market seems ready to receive buyers.


News


Thailand SEC Eyes Approval of 5 ICOs out of 50 Applicants This Month
Thailand’s Securities and Exchange Commission (SEC), the country’s capital markets authority, is reportedly expecting to approve five initial coin offerings (ICOs) this month.

India’s Central Bank Banned Cryptocurrency with Zero Research or Consultation
The Reserve Bank of India has responded to a query seeking explanations for its reasons to ban banks from dealing with the cryptocurrency industry, admitting it conducted no research prior to its prohibitive action.

$250,000 to $20 Million: Coinbase Launches Index Fund for Large Investors
Coinbase has officially launched its new cryptocurrency index fund, a product specifically catered to large investors, enabling access to all five cryptocurrencies listed on the platform.

Bitcoin Price Bounces From $6,100 to $6,500, Market Buys Breathing Room
The bitcoin price has demonstrated a short-term corrective rally from $6,100, rebounding to $6,500 over the past 24 hours, rising by around 6.5%. Small cryptocurrencies and tokens followed the price movement of bitcoin on the upside.

ICOs are Securities, ‘Don’t Know How Much More Clear I Can Be’: SEC Chairman
The SEC held a public forum on June 13, “Investing In America: Atlanta Town Hall Meeting.” The town hall was highly anticipated because regulators planned on speaking about cryptocurrency regulations and innovation. The session was open to the public and streamed live on the SEC website.

Source: cnn.com


Analysis


ETH/USD

ETH/USD Has gained 9.61% in the last 24 hours, the price reached $494 showing what would be a good rebound signal and quickly weakened sending the price to $463, then came a big and unexpected buyers movement that sent the price over the immediate resistances and its moving right now at $516, just over the 100-EMA .


With this movement, the indicators changed to point up, which indicates that there may be a good upward journey.


 Market sentiment

1-hour chart Technical indicator show Bullish Momentum.


Pivot Points

R3 554.7 
R2 528.5 
R1 502.2 
P 476
S1 449.7 
S2 424.1 
S3 397.9

TRON/USD

The price of TRON reports an increase of 4.10% today, Thursday, bouncing strongly in the pivot R1 in this 4H chart and its current price is $0.0413. TRON continues its Bearish trend and it seems that it wants to stay in the middle of the Bearish Channel.


For now, the Central Pivot Point is holding the price but a breakout of this could take it to the bottom of the channel, On the positive side we see that indicators are leaving the oversold area and pointing up. What can keep the price above the Central Pivot Point?


Market sentiment

4-hour chart Technical indicators pointing up, Bearish.

Moving averages separated and pointing down, showing sell signs.


Pivot points

R3 0.0511
R2 0.0477
R1 0.0443
P 0.0408
S1 0.0375
S2 0.0340
S3 0.0306

XRP/USD
The price of the XRP reports a slight increase of 1.73% in the last 24 hours without showing a significant recovery and remains below $0.55, the price did not reach in its short recovery at the R1 Pivot in this 4-hour chart and its moving now at $0.5484. This level is important to maintain as it would avoid more losses in the short term.


 The resistance of $0.55 in R1 is quite strong and there must be a significant buyer impulse to take it above $0.56.


Market sentiment

4-hour chart Technical indicators pointing up, Bearish.

Moving averages crossing possible bearish movement.


Pivot points

R3 0.6176
R2 0.5899 
R1 0.5601
P 0.532 
S1 0.5016
S2 0.4739
S3 0.4431

Conclusion


The market is stressed after the long drops of the current week, buyers should appear in any moment to take advantage of the minimums in many pairs.

Categories
Crypto Market Analysis

Weekly Crypto Update 12.06.2018 -Indecision (VIDEO)

From last Monday, 4th of June, cryptocurrency market capitalisation has decreased from 350,914,000,000$ to slightly below $300B where it is currently, which is a 51 billion dollar decrease.

After we have seen the prices decrease over the last 7 days, we are likely to see some sideways action in this one, followed by indecision over the weekend. I think that the prices are going to retest prior support levels which now serve as resistance and fall back further to the levels of prior lows, which for Bitcoin would be around the 6000$ area. That may trigger some buying or may create a panic selling. I am considering this week a ‘no-trade week’ as long as I don’t see either retest of the prior lows or a confirmation of a trend reversal.

For the reasons why I think that, make sure to check the video.

Categories
Crypto Market Analysis

Weekly Crypto Update 12.06.2018 – Indecision


General Overview


Market Cap: $299,872,893,997

24h Vol: $14,697,169,020

BTC Dominance: 39.1%

From last Monday, 4th of June, the cryptocurrency market capitalisation has decreased from 350,914,000,000$ to slightly below $300B where it is currently, which is a 51 billion dollar decrease.


Analysis


BTC/USD

From last Monday, the price of Bitcoin has decreased by 11.87% from 7749$ to 6814 where it’s currently sitting.


Looking at the daily chart we can see that the price has broken out from the triangle and found support on the unconfirmed baseline support 2 (dotted line) that dated back from 23.03.2017. The price is currently recovering from yesterday’s low and is likely heading toward the triangle’s support for a retest of resistance.


Market sentiment 

Bitcoin daily chart technical signal a sell.

Oscillators are on neutral, and moving averages signal a strong sell.


Pivot points

S3 6735.8 
S2 7142.8 
S1 7320.7 
P 7549.8
R1 7727.7 
R2 7956.8 
R3 8363.8

ETH/USD

From last Monday, the price of Ethreum has decreased by 14.62% – from 620$ to 529.70$ where it is currently.


Looking at the daily chart we can see that the price broke four support lines since Monday – 0.382 Fibonacci level,  569.47$ support (red line), channel resistance which served as support (purple line) and the support at 539.5$ (black line). The last three were broken by the red candle two days before on Sunday when the price found support at 0.236 Fibo level.


Market sentiment 

Ethereum daily chart technicals signal a sell.

Oscillators are on neutral, and moving averages signal a strong sell.


Pivot points

S3 492.69 
S2 545.99 
S1 569.60 
P 599.29 
R1 622.90 
R2 652.59 
R3 705.90

XRP/USD

From last week, Ripple’s price has decreased by 16.88%, dropping from 0.689$ to 0.574$ where it is currently sitting.


Looking at the daily chart we can see that the price is currently sitting on the unconfirmed support line (dotted purple line), which will be confirmed if the price finds support now after this current retest. Prior to that, support at 0.236 Fibonacci retracement level has been broken and the price found temporary support on the 0.573$ level, leaving a wick below it close to the prior low levels.


Market sentiment 

Ripple daily chart technicals signal a strong sell.

Oscillators are on sell, and moving averages signal a strong one.


Pivot points

S3 0.51906 
S2 0.59188
S1 0.62438 
P 0.66470
R1 0.69720 
R2 0.73752 
R3 0.81034

LTC/USD

The price of Litecoin has dropped by 16.43% in the last week, as the price fell from 126$ to 104,8$ where it is currently.


On the daily chart, we can see that the price is below the retracement zone which serves as a strong support in the past and is now going to serve as strong resistance. The price is likely going to retest how strong that resistance really is, so I am expecting a short-term upward movement to those levels at around 111$ before another drop. The next low I am looking at is the wedge support line (dotted blue line) which is at around 85.4$.


Market sentiment 

Litecoin is in the sell zone.

Oscillators are neutral, but moving averages signal a strong sell.


Pivot points

S3 92.713 
S2 106.843
S1 112.077 
P 120.973 
R1 126.207 
R2 135.103 
R3 149.233

Conclusion


After we have seen the prices decrease over the last 7 days, we are likely to see some sideways action in this one, followed by indecision over the weekend. I think that the prices are going to retest prior support levels which now serve as resistance and fall back further to the levels of prior lows, which for Bitcoin would be around 6000$ area. That may trigger some buying or may create a panic selling. I am considering this week a ‘no-trade week’ as long as I don’t see either retest of the prior lows or a confirmation of a trend reversal.

As far as the global chart is concerned this was my last week’s projection 

So far, it is playing out as I have projected as I think we will have another low to around $250B which would be a retest of prior lows.

Categories
Crypto Market Analysis

Daily Crypto Update 11.06.2018 – “Buy The Dip” May Lead To Short-Term Recovery


General Overview


Daily Cryptocurrency Tracker:

Market Cap: $297,297,869,282

24h Vol: $19,935,454,309

BTC Dominance: 38.9%

In the last 24 hours, cryptocurrency market capitalisation experienced a significant drop from yesterday’s opening at 340,435,000,000$ to 291,000,000,000$ which was today’s low so far.

Daily Cryptocurrency Tracker:The market is in red as you would presume, with an average decrease of 12% amongst the top 100 coins. Biggest losers are: Skycoin -26%, Cortex -18%, WaykiChain -24.45%, and only Veritaseum is green among top 100 with an increase of 6.19%.


News


Most significant headlines that came out in the last 24 hours are those regarding the reason why the markets are pungling hard.

On Saturday, CoinUpdates reported that a “Huge Bitcoin Whale With 94,000 BTC, Transfers Crypto Onto an Exchange, Rattling Nerves” in which they analysed using blockchain data that 8000 BTC where sent to Huobi exchange in two transactions:

Blockchain data shows that bitcoin address 1KAt6STtisWMMVo5XGdos9P7DBNNsFfjx7 accumulated more than 93,947 BTC — at one point worth more than $700 million — during a two-month period between March 25 and May 27. Since then, the wallet owner has reduced their balance by 8,000 BTC.

The post continues on by speculating to whom this address may belong as it is the “sixth-richest in the bitcoin ecosystem”, after Bitfinex, Binance, Bittrex, Huobi, and Bitstamp addresses.

China-based news outlet BABI Finance found that most of the funds appear to have been garnered from wholesale trading on over-the-counter (OTC) platforms. BABI cites an anonymous source involved with OTC cryptocurrency sales who said that the wallet belongs to a broker in Dubai acting on behalf of an unknown — perhaps institutional — buyer.

Many blamed the current dump on the fact, that another exchange, CoinRail, got hacked. According to coindesk, the crypto exchange has suffered a loss of 40 million dollars, which caused a lot of FUD (fear uncertainty and doubt). However, that can be true as this exchange is not that significant

Data from CoinMarketCap showed the platform was ranked around 90th largest around the time of the hack, with some $2 million 24-hour trading volume on the site.

According to cointelegraph “All of Top 100 Cryptocurrencies See Red Amidst CFTC Price Manipulation Probe“.

The sharp decline in cryptocurrencies’ prices takes place in the wake of the news that the US Commodity Futures Trading Commission (CFTC) has requested trading data from crypto exchanges Bitstamp, Coinbase, itBit and Kraken. These are respectively the 21st, 14th, 45th and 13th largest exchanges in the world by trade volume, according to Coinmarketcap.

This also doesn’t make sense even though those are significant exchanges with large trading volume, unlike CoinRail, but I don’t see how exchanging subpoenas for potential price can manipulate and scare investors, and push them to sell their crypto.

What is more likely is what is reported on a Coinsupdates post titled “What Caused a Flash Crypto Crash?” in which the stated reason is “Bitcoin investors in the United States are selling off their crypto to pay off capital gain tax”.

First-time investors in Bitcoin are faced with large capital gain taxes from the profit they made in 2017. Reports show that they are now selling off quickly before they file their April taxes. If an individual buy and sells Bitcoin within the same year, the person will be taxed on short-term capital gains which can be as high as 39% depending on the tax bracket. However, when a person holds on to Bitcoin for more than a year before selling, it will only be liable for what the IRS refers to as long-term capital gains. The rate for this kind of tax is significantly lower from about 15 to 23.8%.

While fundamental reasons for this sell-off are still unclear, they always tend to come after the fact as a bias justification. So as a predominantly technical analyst, I am always looking for clues that come beforehand, and the chart told me all of this throughout last week that the prices are going lower. So in my mind, there is no other reason than basic price action and human psychology.


Analysis


BTC/USD

In the last 24 hours, the price of Bitcoin has been declining steeply from 7501$ to 6675$ which is an 11% decrease and is currently up a bit, sitting at 6748$.


Looking at the hourly chart we can see the interaction with what was until now unconfirmed baseline support 2, like I had predicted in my last week’s weekly update video. If the price bounces back to the upside I am going to confirm the baseline support 2. The price is currently consolidating in a triangle. We will see what happens next. Maybe we will see another straightforward drop after the consolidation, or we may see a bounce off of the baseline support 2 and a quick recovery.


Market sentiment 

Hourly chart technicals signal a sell.

Oscillators are on neutral, and moving averages signal a strong sell.


Pivot points

S3 5199.1 
S2 6078.8 
S1 6418.4 
P 6958.5 
R1 7298.1 
R2 7838.2 
R3 8717.9

ETH/USD

From yesterday’s open at 579$, the price of Ethereum has dropped by 14% to today’s low at 503$.


As you can see from the hourly chart, the price has bounced back from those levels by 30$, off the 0.236 Fibonacci level leaving a wick below it. The price has fallen steeply to the levels of prior low, as like I’ve expected it.


Market sentiment 

Hourly chart technicals signal a sell.

Oscillators are on sell, and moving averages signal a strong one.


Pivot points

S3 343.83
S2 440.75 
S1 482.15 
P 537.67 
R1 579.07 
R2 634.59 
R3 731.51

XRP/USD

The price of Ripple decreased by almost 16% in the last 24 hours from 0.6571$, which was yesterday’s open to 0.55214$, which was today’s dip.


On the hourly chart, we can see that the price is currently sitting on the support at 0.573 and on the uptrend significant level (dotted purple line) which also served as support. So the price found some temporary support there, but we will see if that support is strong enough to stop the momentum, after which I will confirm it, as the price fell below it leaving a wick.


Market sentiment 

Ripple is in the sell zone.

Oscillators are on buy, and moving averages signal a strong sell.


Pivot points

S3 0.38312
S2 0.48954
S1 0.53503
P 0.59596
R1 0.64145
R2 0.70238
R3 0.80880


Conclusion


Daily Cryptocurrency Tracker: After the steep decline that major cryptos have experienced, today, I am expecting a recovery as there’s a “buy the dip” psychology in the cryptomarkets. Buy the dip is considered to be a good strategy in a bull market, but crypto investors are not that knowledgeable and are acting on what they hear. So after they see that they are holding heavy bags, the sell-off will continue.

Categories
Crypto Market Analysis

Daily Crypto Update 07.06.2018 – Nothing Has Changed Since Yesterday


General Overview


Market Cap: $345,346,669,155

24h Vol: $14,967,182,843

BTC Dominance: 37.9%


In the last 24 hours, the crypto market cap has been moving sideways. Yesterday started off at around $344B and has been hovering around these levels before it dropped steeply to $338B only to go up again to previous levels. Today’s high was at 349,653,000,000$ and since then, the evaluation has retracted back to yesterday’s levels.

The market is currently showing mixed colours. Biggest gainer among top 100 is Aeternity whose price increased by 13.7%, and the biggest loser is Nexus who’s price decreased by 15.16%.


News


The most significant news that came out in the last 24 hours is that the U.S. Securities and Exchange Commission Chairman Jay Clayton stated that the agency won’t change securities laws to cater to cryptocurrencies

“We are not going to do any violence to the traditional definition of a security that has worked for a long time,” U.S. Securities and Exchange Commission Chairman Jay Clayton told CNBC on Wednesday. “We’ve been doing this a long time, there’s no need to change the definition.”


That means that cryptos are intended to compete with sovereign currencies like the US dollar, won’t be defined as a security.

“(Cryptocurrencies) These are replacements for sovereign currencies, replace the dollar, the euro, the yen with bitcoin,” Clayton said. “That type of currency is not a security.”

However, those tokens that are sold during an ICO are securities by Clayton’s definition.

“A token, a digital asset, where I give you my money and you go off and make a venture, and in return for giving you my money I say ‘you can get a return’ that is a security and we regulate that,” Clayton said. “We regulate the offering of that security and regulate the trading of that security.”

This is fairly good news, but we are yet to see the implications of it. For example, many ICOs are emphasizing their token’s utility to escape being seen as a security.

While we are mentioning SEC, another significant headline that came out in the last 24 hours is that Van Eck Associates Corp. and SolidX Partners Inc. filed a request to list a Bitcoin-linked ETF to the U.S. Securities and Exchange Commission on Wednesday, as reported by Bloomberg.

SEC has rejected Winklevoss Bitcoin Trust ETF last year, so we are yet to see if these two companies make the ETF. The important thing is that this fund will be physically backed, meaning they will hold the actual Bitcoin, which would be insured in a theft or loss event.

Another news item regarding regulation and filing is that Circle Internet Financial Limited – a peer-to-peer payments technology company, who obtained the cryptocurrency exchange Poloniex is pursuing both a federal banking license with the Office of the Comptroller of the Currency (OCC) and registration as a brokerage and trading venue with the US Securities and Exchange Commission (SEC), as reported by Bloomberg

Similar news is that Coinbase is aiming at becoming an SEC regulated broker, through an acquisition of securities dealer Keystone Capital Corp. according to their blog post.

Today, we’re announcing that Coinbase is on track to operate a regulated broker-dealer, pending approval by federal authorities. If approved, Coinbase will soon be capable of offering blockchain-based securities, under the oversight of the US Securities and Exchange Commission (SEC) and the Financial Industry Regulatory Authority (FINRA). This step forward is being made possible by our acquisition of a broker-dealer license (B-D), an alternative trading system license (ATS), and a registered investment advisor (RIA) license.

CFTC denies FOIA request for Bitfinex and Tether subpoenas, as reported by Coindesk.

The top U.S. futures regulator has denied a Freedom of Information Act (FOIA) request for subpoenas reportedly issued to crypto exchange Bitfinex and the closely-linked ‘stablecoin’ operator Tether, according to records obtained by CoinDesk.

The FOIA request, filed by an individual who requested anonymity when speaking to CoinDesk, sought “subpoenas issued to iFinex inc. also known as Bitfinex and it’s subsidiary companies, as well as subpoenas issued Tether Limited and its subsidiary companies” and was initially submitted in February.

Thus, we still don’t have the light shed on the controversy surrounding Bitfinex and Tether Stablecoin.

Parity urges users to install the update after discovering a Testnet vulnerability

Users of Ethereum software issued by Parity Technologies face enforced updates this week after warnings a testnet vulnerability could spread to the Ethereum network, according to Parity’s blog post on June 6.

Parity is a UK-based provider of infrastructure software for interacting with the Ethereum network. A blog post from the company June 5 originally flagged the security problem, describing it as a “potential consensus issue with Parity Ethereum.”

For those who don’t know this isn’t the first time Parity had a bug, as in November last year there was a “Parity multisig hack” in which about $300M was frozen and (probably) lost forever.


Analysis


BTC/USD

From yesterday’s low at 7510$, the price of Bitcoin rose up to 7700 which is a 2.37% increase.


Looking at the hourly chart we can see that the price is currently in another cluster below the 0.236 Fibonacci retracement level. However, the price is above the baseline support line and the triangle resistance line. This is a very crucial time for the price of Bitcoin because if the price continues to go higher that may trigger buying and we can see a short-term trend reversal. I think that’s now going to happen, as the likely scenario is that the price fells below those resistance lines again from this current cluster as it did before and retest old lows at around 7000$.


Market sentiment 

Bitcoin is in the buy zone as indicated by hourly chart technicals.

Oscillators are on neutral, and moving averages on a strong buy.


Pivot points

S3 7198.6 
S2 7406.9 
S1 7530.5 
 P 7615.2 
R1 7738.8 
R2 7823.5 
R3 8031.8

ETH/USD

From yesterday’s low at 594$, Ethereum’s price has increased by 1.6% coming to 606$ currently.


As you can see from the hourly chart, the price bounced off the 0.236 Fibonacci level where it found support yesterday, and since then it has broken out of this short-term triangle like pattern and is now back on prior resistance for a retest of support. The price is also above the purple bold line which is the descending channel resistance line.


Market sentiment 

Ethereum is in the buy zone as indicated by the hourly chart technicals.

Oscillators are on buy, and moving averages are on neutral.


Pivot points

S3 562.18 
S2 582.91 
S1 594.79 
 P 603.64 
R1 615.52 
R2 624.37 
R3 645.10

XRP/USD

From yesterday’s low, the price of Ripple has increased by 3.2% from 0.659$ to 0.681$ where it is currently sitting.


Looking at the hourly chart we can see that the price broke out of the symmetrical triangle two days ago on the upside as I’ve projected it would, but my short term target hasn’t been met. The price has stopped out at 0.68$ level and retraced to 0.659$ which was yesterday’s low and is now back on those same levels struggling to make a new high, and I still think it is going to get there which would be slightly below 0.7$


Market sentiment

Hourly chart technicals signal a buy.

Oscillators are on buy, and moving averages are signalling a strong one.


Pivot points

S3 0.61446 
S2 0.64266 
S1 0.65853 
 P 0.67086 
R1 0.68673 
R2 0.69906 
R3 0.72726

Conclusion


Things haven’t changed much since yesterday. We are still yet to see where the prices are going from these levels. As the prices are looking unstable I am expecting another drop to prior lows for a retest, before a short-term trend reversal.

Categories
Crypto Market Analysis

XRP/BTC Looks To Trade Higher


Ripple (XRP)


Market Cap: $26.18B

Circulating Supply 39.24B XRP

Max Supply: 100B XRP

Volume (24h) $397.67M


XRP/BTC Technical Analysis


XRP/BTC increased and maintains a bullish perspective in the short term. It remains to see what will really happen in the upcoming period because the crypto market is still weak. The rate dropped in yesterday’s trading session as the crypto market dropped further.

The price rebounded in the short term after the failure to reach the previous lows. The rate has managed to break out above some very important resistance levels and now is struggling to reach new highs.


The rate has made a false breakdown below the 150% line of the descending pitchfork signalling that we may have an oversold situation. It has moved sideways on the short term but now has started an upside movement after the breakout above the WL1 of the descending pitchfork.

The perspective will remain bullish in the short term as long as the rate stays above the 150% Fibonacci line of the minor ascending pitchfork. The next upside obstacle is at the 61.8% Fibonacci level, so we need a breakout above this level so we can think of a further increase.

It looks bullish in the short term, you can see that the price failed to retest the minor red uptrend line, signalling that the buyers are strong.


Conclusion


We can go long on this crypto pair if it will close above the 0.000091050 yesterday’s high and we can place a stop loss below the 0.000073170 low. A valid breakout above the 61.8% level will send the rate towards the 50% line and maybe towards the median line (ml) of the ascending pitchfork.

Categories
Crypto Market Analysis

Daily Crypto Update 05.06.2018 – More Sideways Price Action


General Overview


Market Cap: $335,633,090,494

24h Vol: $15,957,362,042

BTC Dominance: 37.9%

In the last 24 hours, the cryptocurrency market cap has been decreasing from yesterdays high at 354,9 billion dollars to 335,633 billion dollars where it is currently.

The market is mostly mixed in colour, but the dominant one is definitely red with approximately a 3% decrease. Biggest losers amongst the top 100 coins are Bitcoin Private -14% and DigixDao -11%. Only Huobi Token experienced a significant increase of 14%.


News


Although there are news items in the last 24 hours that are bearing a positive tone, there aren’t any significant ones that can change the market’s bearish sentiment, as those that are positive are mostly regarding blockchain tech adoption and technology utilisation. Such stories are the following:

DHL Announces Partnership Trade Finance Platform TradeIX

DHL is partnering with blockchain trade finance platform TradeIX, according to a presentation today, June 5, at the Money20/20 conference in Amsterdam.

Crypto Tipping Added to Streamlabs App, Responsible for 15% of Twitch Streams

Broadcasters on Streamlabs, a Twitch streaming app, can now accept cryptocurrency as tips, the Steamlabs blog posted on June 1.

Our Blockchain ‘Can Run The Whole Company’, Says Mastercard Vice Chair at Money20/20

Mastercard has “built a Blockchain that can run the whole” of its network, its vice chair Ann Cairns claimed during the ongoing Money20/20 conference June 4.

As you can see, the Money20/20 conference was mentioned twice. That conference is taking place from 4-6 of June in Europe, and its a conference “Where the entire payments, fintech, and financial services industry connects”, so the positive news that is coming from there is significant.

Coinbase – leading crypto-fiat gateway exchange is expanding to the Japanese market, which may lead to an increase of cryptocurrency users, as they will get more exposure to the space.

Coinbase intends to apply for a license with the country’s financial regulator, the Financial Services Agency (FSA), “within the year,” a process that has been mandatory for all crypto exchanges operating within the country since the amendment of Japan’s Payment Services Act in April 2017.

Source: cointelegraph.com

On the flipside, there are two major news items that are negative:

Google searches for ‘bitcoin’ nosedive 75% this year as interest in struggling cryptocurrency wanes, as reported by CNBC

Searches for the term “bitcoin” have dropped more than 75 percent since the beginning of this year and roughly halved over three months, according to research from Google Trends.

Nicholas Colas, co-founder of DataTrek Research, pegged waning searches as a bad sign for prices.

“We use Google Trends to track search queries for ‘bitcoin’ as a proxy for potential new buyers,” Colas said in an email to clients Monday. “Bitcoin needs a new narrative in order to re establish global attention.”

The other piece of negative news is that Bitcoin dies for the 300 time, as Forbes said in an article entitled “Bitcoin’s Need For Electricity Is Its ‘Achilles Heel” stated:

Bitcoin’s advocates claim that it is immune from government control. ”It can’t be shut down,” they say. This might have been true in the early days, when Bitcoin could be mined on an ordinary laptop. But in these days of giant mining farms, Bitcoin desperately needs abundant cheap electricity supplies. Without access to abundant electricity, Bitcoin mining can’t continue, and without mining, Bitcoin is dead. And ultimately, electricity supply is controlled by governments.

This 300th place is according to the 99bitcoins Bitcoin obituary list.

The most significant informative headline is that Block.one’s EOS has officially been launched, after a year-long ICO stage in which they raised over 4 billion dollars. This is the moment of truth for this cryptocurrency, as it is the largest competitor of Ethereum. Now developers can build Dapps on the blockchain and we will see what the future holds for the EOS ecosystem, and reassure ourselves if the promises stated in the whitepaper are going to be met.


Analysis


BTC/USD

In the last 24 hours, the price of Bitcoin has decreased from 7715$ to 7419,2$ where it is now on a downward trajectory, which is a decrease of 3.87%.


Looking at the daily chart we can see that the price was repealed by the 0.236 Fibonacci retracement level and that yesterday’s candle ended on the support at the 7470$ level. Today’s candle started off at those levels and quickly fell below the support.


Zooming into an hourly chart we can see the interaction with the mentioned levels, and after two significant headlines being crossed – baseline support (black bold line) and prior range support (red line), the price is heading toward the triangle support (blue bold line) which is around 7000$ levels.


Market sentiment

Bitcoin is in the sell zone, as indicated by hourly chart technicals.

Oscillators are signalling neutral, and moving averages are on a strong sell.


Pivot points

S3 6942.0 
S2 7254.9 
S1 7371.6 
P 7567.8 
R1 7684.5 
R2 7880.7
R3 8193.6

NEO/USD

The price of Neo has decreased by 8.87% from yesterday’s open, dropping from 57,33$ to 52,3$ where it is now.


Looking at the daily chart we can see that the price found support at the 0.236 Fibonacci retracement level which is where the baseline support area is.


Zooming into an hourly chart we can see that nice bounce off of the Fibo level, but we can also see there’s no interaction with the baseline support. The price is still in a downward trajectory, which is why I am expecting to see the interaction with the baseline support, which would be a lower low at around 51.3$ level.


Market sentiment

Neo is in the sell zone.

Oscillators are on neutral, and moving averages are signaling a strong sell.


Pivot points

S3 43.81 
S2 49.07 
S1 51.24 
P 54.34 
R1 56.50 
R2 59.61 
R3 64.88

XRP/USD

From yesterday’s open until now, the price of Ripple has decreased by 5.13% – from 0.6931$ to 0.65751$.


Looking at the daily chart, we can see that the price found support at the 0.236 Fibonacci level, and the current candle is a doji with a bigger wick from below, which indicated buying pressure.


Zooming into an hourly chart we can see that the price action has created a cluster and the break out is soon going to happen. As the price is in an uptrend overall, I am expecting the price to break out from the upside, and potentially reach the prior range resistance at just slightly below 0.7$.


Market sentiment

Ripple is in the buy zone, as indicated by hourly chart technicals.

Oscillators are on a buy, and moving averages signal a strong buy.


Pivot points

S3 0.52206 
S2 0.59328 
S1 0.62397 
P 0.66450 
R1 0.69519 
R2 0.73572 
R3 0.80694

Conclusion


As I have said in my weekly update, I am expecting a lot of sideways movement in the following week, and that’s exactly what is happening in the markets currently. Bitcoin is falling and while some cryptos are in the same cycle as Bitcoin and are following it accordingly, some like Ripple, are in they’re different stages of corrective waves and are going to show some bullish moves, but the overall sentiment is still bearish.

Categories
Crypto Market Analysis

Weekly Crypto Update 04.06.2018 – Sideways Movement Expected (Video)

From Monday 28th May, the total cryptocurrency market cap evaluation has been rising overall, but it experienced a lot of choppy movement, as for every new high it made, a sharp downward movement occurred. That means the market sentiment is still bearish as sellers are waiting anxiously for the right price in order to sell.

In this weekly video, I am going to provide my Elliott Wave forecast and explain as to why I think we are in for more sideways movement before another large drop.


Categories
Crypto Market Analysis

Weekly Crypto Update 04.06.2018 – Sideways Movement Expected


General Overview


Market Cap: $344,628,122,166

24h Vol: $16,760,046,234

BTC Dominance: 37.8%

From Monday 28th May, the cryptocurrency market cap evaluation has been rising overall, but it experienced a lot of choppy movement, as for every new high it made, a sharp downward movement occurred. That means the market sentiment is still bearish as sellers are waiting anxiously for the right price in order to sell.

The resistance line at around 342 billion dollars has been crossed and it is now being retested for support.


News


This weeks top headlines are the following:

South Korea is in the process of lifting the ICO ban 

The National Assembly has officially made a proposal to allow domestic initial coin offerings (ICOs). As the administration is sitting on its hands after imposing a total ban on ICOs in September last year, the National Assembly has come forward with an official recommendation.

Source: http://www.businesskorea.co.kr

Major vulnerability found in the EOS blockchain days before the mainnet launch. 

China’s largest Internet security company, Qihoo 360, has found several high-risk security vulnerabilities in EOS’s blockchain platform. These vulnerabilities would enable remote attacks on all EOS nodes, Qihoo 360 claimed on Weibo Tuesday, May 29.

Crypto exchange Binance plans to create 1 billion dollar fund.

Binance, currently the world’s largest cryptocurrency exchange by trade volume, plans to create a $1 bln cryptocurrency-based fund, an executive confirmed June 1. Using only Binance’s BNB tokens as an investment vehicle, the fund will be administered through the exchange’s incubator spin-off Binance Labs.

Source: cointelegraph.com


Analysis


BTC/USD

From Mondays open, the price of Bitcoin has increased by 4.2% coming from 7294$ to 7608$ where it is currently. The rise was in the form of an upward channel/wedge.


On the daily chart, we can see that the price was at its lowest last Monday and below the baseline support (bold black line). Since then the price went above the baseline support with strong momentum, as those lows triggered buyers who have pushed the price higher. The price is currently inside the triangle again and was repealed by the triangle resistance line and 0.236 Fibonacci retracement level, so the price fell back to the baseline support again.


Market sentiment

Bitcoin daily chart technicals signal a sell.

Oscillators are on buy, but moving average signal a strong sell.


Pivot points

S3 6141.4 
S2 6800.2 
S1 7219.1
P 7459.0 
R1 7877.9
R2 8117.8 
R3 8776.6

ETH/USD

From Monday, May 28. Ethereum’s price increased by staggering 22.27% from 494$ which was the week’s low, to 605$ where it is currently sitting.


Looking at the daily chart, we can see that the price found support at the 0.236 Fibonacci retracement level and the unconfirmed support, and is currently repealed by the downward channel resistance line and is heading down to the 0.382 Fibo level. Overall last week was bullish for Ethereum, but judging by how much has the price increased and the interaction with the significant trendlines, this week may not be the same.


Market sentiment

Ethereum is in the sell zone.

Oscillators are signalling a buy, but with 8 on neutral, and moving averages are signalling a strong sell.


Pivot points

S3 343.61 
S2 452.53 
S1 521.49 
P 561.45
R1 630.41 
R2 670.37 
R3 779.29

XRP/USD

In the last 7 days, the price of Ripple has been increasing steadily from 0.544$ to 0.656$ which is a 19.54% increase overall.


On the daily chart, we can see that Monday’s opening was the weeks low. From there the price went above the 0.573 with a strong momentum as indicated by the big green candle on Tuesday. Since then the price has been steadily increasing but it was now stopped out by prior range support, which now serves as resistance at 0.699$ levels.


Market sentiment

Daily chart technicals are signalling a sell.

Oscillators are on buy, and moving averages are signalling a sell.


Pivot point

S3 0.39577 
S2 0.50453 
S1 0.57380
P 0.61329
R1 0.68256 
R2 0.72205 
R3 0.83081

LTC/USD

From last Monday’s open, the price of Litecoin has increased by 9.73% from the weeks low on Monday at 110.2$ to 121$ where it is currently.


Looking at the daily chart we can see that the price of Litecoin fell below the retracement zone which is at the 111$ level on last Monday which triggered some buying. That buying pressure was short lived as the price failed to stay above the retracement zone level at 124$ and is now back in it again.


Market sentiment

Litcoin is in the sell zone.

Oscillators are on buy but with 8 on neutral, and moving averages are signalling a strong sell.


Pivot points

S3 88.590 
S2 103.930 
S1 113.810 
P 119.270 
R1 129.150 
R2 134.610
R3 149.950

Conclusion


The market conditions are now similar to that of Jun 2014. After a strong runup, we are seeing a triangle being formed on the global chart.

Market cap chart back in 2014.

As you can see after the evaluation broke out from the triangle it halved in evaluation from the first high that was formed outside of the triangle.

So if the similar thing happens again this would be something that I would expect – a downfall to around $178B which would bring the price of Bitcoin to around 4500$ which would correlate perfectly with my Elliot Wave correction count which can be seen on the weekly update video.

In any way, I would be expecting a lot of sideways movement in the following weeks as the evaluation is clearly in a range.

Categories
Crypto Market Analysis

Daily Crypto Update 01.06.2018 – Ascending Triangles


General Overview


Market Cap: $335,204,491,129

24h Vol: $16,264,540,111

BTC Dominance: 38.6%

In the last 24 hours, cryptocurrency market capitalisation has been struggling to get past the level of around $335 billion dollars, but no new highs have been made. However, we can see that higher lows have been made as buyers are pushing the evaluation, forming an ascending triangle pattern. 

The market is showing mixed colours, with an average percentage change among the top 100 being very small. Biggest gainers are IOTA by 11%, Hshare 11,28%,  Huobi token 22%.


News


In the last 24 hours, a lot of news has came out. I have filtered out those that are most significant and could impact the market sentiment. Top stories are mostly positive in nature, however, there are some that could impact the market negatively. These are the headlines:

Polish Gov’t Invites BitBay to Join Working Group as Exchange Forced to Leave Country

Recently expatriated Polish cryptocurrency exchange BitBay tweeted yesterday, May 30, that the Polish Financial Supervision Authority (KNF) has asked them to join a Blockchain Working Group.

Tenth Largest Crypto TRON to Leave Ethereum, Launches Beta Version of Own Blockchain

TRON (TRX) launched a beta version of its independent public blockchain at 12 am UTC, today May 31, according to a press release shared with Cointelegraph. Tron is currently the tenth largest cryptocurrency by market capitalisation.

Mary Meeker’s 2018 Internet Trends Report Shows Interest in Crypto ‘Exploding’

Former Wall Street analyst Mary Meeker’s well-known annual Internet Trends report for 2018, published May 30, shows interest in cryptocurrency “exploding” since January of last year. The report also highlights that a course on Bitcoin (BTC) and cryptocurrency technologies made it into the top 10 most popular university classes in 2017.

Spain: Innovation-Aimed Crypto Regulation Wins Cross-Party Support in Congress

Draft legislation that would favourably regulate blockchain technology and cryptocurrencies has received unanimous support in the Spanish Congress, Europa Press reported yesterday, May 30.

Ripple CEO Compares Bitcoin to Napster, Says BTC’s Influence on Market Could Lessen

Brad Garlinghouse, CEO of Ripple (XRP), thinks that Bitcoin’s (BTC) influence on cryptocurrency market prices will eventually decrease, CNBC reported yesterday, May 30.

Coinbase Board Member: Crypto Ecosystem Will Not See Regulation for Years

Kathryn Haun, board member of Coinbase and HackerOne claimed that cryptocurrency and blockchain will not see regulation for years, Techcrunch reports May 31. Haun made her statements on regulation at the Code Conference in California today.

IMF Official Calls for Regulation, Tech Adoption By Banks to Fight ‘Crypto Competition’

An official from the International Monetary Fund (IMF) suggested that central banks need to make fiat currencies “more attractive for the digital age” in an article published May 31. Deputy Director of the Monetary and Capital Markets Department Dong He suggested three responses to combat potential competition to central banks from cryptocurrencies.

Norway’s Largest Bank to Explore Applications for IOTA’s Distributed Ledger Technology

DNB ASA (Den Norske Bank), Norway’s largest financial services group, and the IOTA Foundation (IOTA) have signed a memorandum of understanding (MOU), according to a press release May 31. DNB and IOTA will now reportedly co operate to explore applications of the IOTA Tangle, a “third-generation” distributed ledger (DLT).

US Crypto Exchange Signs Agreement to Offer Fiat-Crypto Trading to Corporate Clients

Seattle-based crypto exchange Bittrex has signed a banking agreement that will allow corporate investors to trade selected cryptocurrencies for fiat, Bloomberg reports today, May 31.

Source: cointelegraph.com


Analysis


BTC/USD

From yesterday’s open, the price of Bitcoin has increased by 2.37% – from 7374$ to 7535$ where it is currently sitting.


On the daily chart, things haven’t changed much. The price is still below the baseline support which now serves as strong resistance.


Zooming into the hourly chart we can see the same pattern as on the global graph for the cryptocurrency market capitalisation – an ascending triangle which is a bullish sign.


Market sentiment

Bitcoin hourly chart technicals signal a strong buy.

Oscillators are on buy and moving averages a strong one.


Pivot points

S3 6951.1 
S2 7212.8 
S1 7349.3 
P 7474.5 
R1 7611.0
R2 7736.2
R3 7997.9

ETH/USD

From yesterday’s open, the price of Ethereum has increased by 4.38% – from 560$ to 584$ where it is now.


Looking at the daily chart, we can see that the price went higher than in the previous two days but has now retraced back to the levels of yesterday’s candle high.


Zooming into the hourly chart, we can see a similar ascending triangle forming and it looks like the breakout is very close. Ascending triangles are bullish in nature, but in this case, it looks more like a rising wedge which is a bearish sign. And if we take the proximity of the 0.382 Fibonacci level which serves as resistance we conclude that the price is likely going to break out from the downside.


Market sentiment 

Ethereum is in the strong buy zone.

Oscillators are on buy, and moving averages are indicating a strong buy.


Pivot points

S3 504.05 
S2 538.11  
S1 557.55  
P 572.17  
R1 591.61 
R2 606.23
R3 640.29

XRP/USD

In the last 24 hours, the price of Ripple has increased by 4%, coming from 0.591$ to 0.614$.


On the daily chart, things haven’t changed much, the price is still in the range between the support at 0.573 and 0.236 Fibonacci retracement levels. The current candle is green but hasn’t exceeded prior two candle wicks.


On the hourly chart, we can see a familiar pattern again, as markets are strongly correlated.


Market sentiment

Ripple is in the buy, as indicated by the hourly chart technicals.

Oscillators are signaling a buy, and moving averages a strong one.


Pivot points

S3 0.54396 
S2 0.57567 
S1 0.59333 
P 0.60738 
R1 0.62504 
R2 0.63909 
R3 0.67080

Conclusion


The global charts, as well as charts from three major cryptocurrencies, are forming an ascending triangle pattern which is a bullish pattern. Technical indicators are also bullish as they are signaling a buy. We cannot conclude that the bottom is in before we see a breakout from the ascending triangle on the upside, but I am pretty sure that we have hit a temporary bottom, and I say temporary because I am expecting new lows, but first, the price needs to be pushed higher to trigger large selling. Watch carefully what happens in the next 24 hours.

Categories
Crypto Market Analysis

Daily Crypto Update 31.05.2018 – Still in a Downtrend


General Overview 


Best Crypto News Daily:

Market Cap: $330,642,822,868 
24h Vol: $15,711,067,523 
BTC Dominance: 39.0%

Best Crypto News Daily
In the last 24 hours, cryptocurrency market capitalisation has been experiencing a sideways movement. Yesterday’s open was at $329B from which the evaluation fell to $318B and is now back on the levels of yesterday’s high.

The market is mixed in colour with only a slight percentage change. The biggest change among top 100 coins is experienced by Golem who is up by 15% and Theta Token 10%.


Best Crypto News Daily


In a bear market, negative news is overblown, and the good news is short lived. That’s why even though we have seen positive news in the last couple of days, it didn’t impact the market that much. In the last 24 hours, there is no market-moving news. These are some of the most significant headlines from the crypto sphere:

Quebec Gov’t Reportedly Lifts Moratorium on Energy Sales to Crypto Miners

The government of Quebec will reportedly lift its moratorium on the sale of electricity to cryptocurrency miners, sources familiar with the matter told local news Le Journal De Montreal May 30. According to Le Journal, the Quebec government wants to “avoid missing the ship” on cryptocurrency, and as such is moving ahead to lift the moratorium.

Central Bank Of Russia: Crypto Assets Do Not Pose Risk to Global Financial Stability

The Central Bank of Russia released a report May 30, stating that crypto assets do not currently threaten global financial stability as the global volume of crypto transactions is very low. The research paper states that instead of the term “cryptocurrency,” the Financial Stability Board proposes to use the term “crypto asset,” which can be considered a financial asset based on the application of cryptography and distributed ledger technology.

Low Capitalization, Institutional Exposure Make Crypto Low Risk, Says Dutch Gov’t Report

A branch of the Dutch government has recently released an economic risk report, claiming that cryptocurrencies present a low risk to financial stability in the country, according a report published on May 29. The report was prepared and published by the Netherlands Bureau for Economic Policy Analysis (CPB).

Ethereum Classic Upgrades Network Protocol to Ensure Mining Remains Viable

Ethereum Classic (ETC) has now successfully implemented a protocol upgrade that will ensure that mining remains viable in future, according to ETC Block Explorer data yesterday, May 29.

BlockShow in Berlin Sets New Record With Largest Turnout Yet

The BlockShow Europe 2018 conference ended yesterday, May 29, after two days of panels and speakers, including Wikipedia founder Jimmy Wales and BTCC co-founder Bobby Lee. Speaking about the conference, Bobby Lee told Cointelegraph:

“I think conferences are important to get the word out there, to educate people and help them learn about cryptocurrency and blockchain. This is how we get the next billion people on-board.”


Analysis


BTC/USD

From yesterday’s open, the price of Bitcoin has increased by 1% so the price hasn’t changed much. The price fell to around 7300$ and is now back to the levels of yesterday’s high at 7530$.


On the daily chart, we can see that the price is still below the baseline support (bold black line) which serves as resistance but above the intermediate support at 7470$.


On the hourly chart, we can see what happened yesterday after the cluster, the price fell below the support line with one candle on the hourly chart. Currently, we can see another cluster being formed bearly above yesterday’s high, on the ‘below the baseline support’ as there’s a strong resistance on these levels.


Market sentiment

Hourly chart technicals signal a strong buy.

Oscillators are on buy, and moving averages a strong one.


Pivot points

S3 6822.9 
S2 7112.4 
S1 7243.7 
P 7401.9 
R1 7533.2 
R2 7691.4 
R3 7980.9

ETH/USD

From yesterday, the price of Ethereum fell from 573$ to 544$ and is now back at the levels of yesterday’s open.


Looking at the daily chart we can see that the current candle is green, but hasn’t exceeded yesterday’s candle wick and two prior candles highs as well.


Zooming into the hourly chart we can see that the price is again above this intermediate uptrend support line, but there’s now higher high which is a bearish sign.


Market sentiment

Hourly chart technicals signal a buy.

Oscillators are on buy, and moving averages on a strong one.


Pivot points

S3 474.37 
S2 517.91 
S1 537.46
P 561.45 
R1 581.00 
R2 604.99 
R3 648.53

XRP/USD

The price of Ripple is on the same levels as yesterday’s open which is at 0.6$. The price fell further below to around 0.587$ but is now again on the same levels as yesterday.


On the daily chart, we can see that the current candle hasn’t exceeded the previous five candles highs which is a bearish sign.


On the hourly chart, we can see that the price is currently above the downward channel resistance line. But that doesn’t act as a bullish sign, as this also happened in the past, and still, the price fell further below.


Market sentiment 

Ripple is in the buy zone, as indicated by hourly chart technicals.

Oscillators are on buy, and moving averages are signalling a strong buy.


Pivot points

S3 0.51319 
S2 0.55858
S1 0.57956 
P 0.60397 
R1 0.62495 
R2 0.64936 
R3 0.69475

Conclusion


Best Crypto News Daily: The prices of three major cryptos haven’t exceeded the prior high, even though we have seen a lot of buying in the last 24 hours. This means we are still in a downtrend. Indicators are bullish as they are lagging behind, but charts and price action paint a clear bearish picture.

Categories
Crypto Market Analysis

Daily crypto update 30.05.2018 – Buying Has Been Triggered, But Who Has More Power?


General overview


Market Cap: $328,089,417,655

24h Vol: $18,528,052,314

BTC Dominance: 39.0%

From yesterday’s low at 303,340,000,000$, cryptocurrency market cap evaluation has increased to 334,675,000,000$ which is the today’s high for now and has since retraced back to around $327 billion dollars.

Crypto Market Daily NewsThe market is currently in green, with an average increase of 7-10% among top 100 coins. Biggest gainers are Bytecoin +26%, 0x +17%,  Theta Token +31%.


Crypto Market Daily News


The top story that came out in the last 24 hours is about South Korea changing the direction with relation to cryptocurrency in a more acceptive way. These are some of the significant headlines:

S. Korea: Financial Regulator ‘Sympathizes’ With Demands to End Crypto-Blockchain Regulatory Split

A South Korean blockchain researcher has criticized the government’s approach to regulation of the technology at the 2018 Seoul Financial Forum, local media reported May 29. Addressing the head of South Korean regulator the Financial Supervisory Service (FSS) Lee Geun-woo, Park Sung-joon, head of the Blockchain Research Center at Dongguk University, said adopting different approaches to cryptocurrency and blockchain was futile. One, he argued, cannot exist meaningfully without the other:

“In the digital asset trading market, virtual currency and blockchains can not be separated because they need the appropriate means of payment.”

Lee Geun-woo responded by saying:

“I sympathize with the words of Park Chan-hee, and I will pass on his suggestions to the financial authorities.”

South Korea: Government Committee Plans to Make ICOs Legal Again

South Korea plans to pursue the road to re-legalizing initial coin offerings (ICOs), local news media reported May 29, citing government officials. According to Business Korea, a National Assembly committee dedicated to studying the so-called ‘Fourth Industrial Revolution’ said it would seek to enhance the legal “basis” of cryptocurrency in the country, part of which would be reversing the ICO ban which the government enacted in September 2017.

$14.5 Bln South African Investment Firm to Launch Crypto Exchange

Sygnia Asset Management, a major South African investment firm with 180 bln rand ($14.5 bln) under management, has revealed that it will launch a cryptocurrency exchange later this year, BusinessTech reported May 25.

Survey: Three out of Ten Germans Are Considering Crypto Investing

Twenty nine percent of Germans are interested in cryptocurrencies as a form of investment, Cointelegraph auf Deutsch reported Tuesday, May 29. German bank Postbank came to this conclusion after a survey of 3,100 Germans, which was conducted from the end of February to the end of March 2018.

Source: cointelegraph.com


Analysis


BTC/USD

In the last 24 hours, the price of Bitcoin has increased by 5,2% – from 7104$ to 7481$ where it is now.


Looking at the daily chart we can see that the price almost went to the triangle support (blue bold line), but hasn’t interacted with it. Currently, price action is forming a cluster below the baseline support (bold black line), which serves as resistance.


If we zoom into the hourly chart, we can see that the cluster has a form of a rising wedge, which is a bearish sign. If we consider that the baseline support serves as resistance, the most likely scenario would be that the price is heading down from here, probably to the triangle support for a proper test.


Market sentiment

Bitcoin is in the buy zone, as indicated by hourly chart technicals.

Oscillators are on buy, and moving averages are on a buy.


Pivot points

S3 6355.1 
S2 6851.1 
S1 7158.1 
P 7347.1 
R1 7654.1 
R2 7843.1 
R3 8339.1

ETH/USD

From yesterday’s opening till now, the price of Ethereum has increased by 10,89% – from 511$ to 567$ where it is now sitting.


As you can see from this daily chart yesterday’s candle showed a strong momentum that was needed to break above the resistance line at 539,5. Today’s candle body is bearly noticeable, and as you can see from the upper wick the price went higher buy was repealed by a fair amount of selling pressure.


If we zoom into the hourly chart we can see that today’s price action is in an upward channel which hight bearly exceeded the prior high levels.


Market sentiment 

Ethereum’s hourly chart technicals indicate a buy.

Oscillators are signaling a buy, and moving averages a strong one.


Pivot points

S3 422.51 
S2 486.39 
S1 526.69 
P 550.27 
R1 590.57 
R2 614.15 
R3 678.03

XRP/USD

From yesterday’s open till now, the price of Ripple has increased by 12,3% – from 0,547$ to 0,614$.


Looking at the daily chart, we can see that the price rose strongly above the resistance line at  0,573$ but was stopped out by 0,236 Fibonacci level which serves as resistance.


Zooming into the hourly chart we can see that the price is currently breaking out from the bull flag, and is on an upward trajectory. The Fibonacci level is very close, so we will see what happens at these levels.


Market sentiment 

Ripple is in the buy zone.

Oscillators are on neutral, and moving averages signal a strong buy.


Pivot points

S3 0.45320 
S2 0.51892 
S1 0.55954 
P 0.58464 
R1 0.62526 
R2 0.65036 
R3 0.71608 

Conclusion


Crypto Market Daily News: As I have said yesterday the lows can trigger some buying, and that’s exactly what happened – we are seeing new buying pressure arising in the markets. The question is how powerful are the buyers? Can they push the prices up to prior levels, and then exceed prior highs? I think not. I think that as soon as the price is pushed a bit higher, which would mean a better price for sellers, they are going to start selling again. They did not want to continue selling on the month’s lows, as they were hesitant to make a mistake losing their bitcoin if the prices go higher, and people who were waiting to get into the bandwagon have entered the market. We will see what happens but for now, I am still bearish.

Categories
Crypto Market Analysis

Daily Crypto Update 28.05.2018 – Major Support Has Been Broken


General Overview


Market Cap: $312,693,245,353
24h Vol: $15,021,077,612 
BTC Dominance: 39.3%

Over the weekend, cryptocurrency market capitalisation has been bouncing in a range from $325B to $336B, and weeks low has at around 321 billion dollars. This morning the market cap has dropped below what seems as support level at $325B, in a straightforward manner.

Crypto Market NewsThe market is currently in red, with approximately 4-8% decrease among top 100 cryptocurrencies. Biggest losers are Augur -10%, Fusion 14.23% and Centrality 10.86%. There are some in green like All Sports +25% and MyBit Token +24%, but they are newly introduced coins to the market.


Crypto Market News


There aren’t any significant stories that came out over the weekend and in the last 24 hours. As the market plummets, many are analytical in nature and have a bearish tone. These are some of most notable headlines:

Bitcoin and Crypto on Continuous Decline: Major Factors and Trends

Analyst Says Bitcoin May Drop to $5,500 Before New Upside In Q3/Q4 2018

Spanish Central Bank Governor Perceives Cryptocurrency Risks, Distributed Ledger Technology Potential

Buy Bitcoin, Sell Your Altcoins, Says Pioneering Wall Street Blockchain Analyst


Analysis


BTC/USD

In the last 24 hours, the price of Bitcoin has dropped by 1.56% coming from 7326$ to 7212$ where it is currently sitting.


The most significant thing that we see on the daily chart is that the price has fallen below the baseline support, and is now heading to the second one which intersects the ending point 0 of the Fibonacci retracement.


Zooming into an hourly chart we can see the interaction with the baseline support. The price oscillated above and below it, struggling to find stable support, and the wedge prior support served as stronger resistance which repealed the price and pushed it lower.


Market sentiment

  • Bitcoin hourly chart technicals signal a sell.
  • Oscillators are on neutral, and moving averages on a strong sell.

Pivot points 

S3 6896.8
S2 7111.1 
S1 7225.4 
P 7325.4 
R1 7439.7 
R2 7539.7 
R3 7754.0 

ETH/USD

From yesterdays open until now, the price of Ethreum has decreased by 8.94%, and that’s not the lowest its been. The price went from 585$ to 503$ but quickly bounced from there to 532$ where it is currently sitting.


Looking at the daily chart we can see that the price went to touch the 0.236 Fibonacci level and left a wick below it which is the mentioned drop to 503$.


Looking at the hourly chart, we can see the interaction with the support at 539.5$. The price is currently on an upward trajectory heading back to that support for a retest.


Market sentiment

  • Ethereum is in the sell zone, as hourly chart technicals signal a sell.
  • Oscillators are on neutral, and moving averages on a strong sell.

Pivot points

S3 492.75
S2 532.10
S1 550.55
P 571.45
R1 589.90
R2 610.80
R3 650.15


XRP/USD

In the last 24 hours, the price of Ripple has dropped by 5.64% coming from 0.608$ to 0.57495$ where it is now sitting.


On the daily chart, we can see that the price is below the 0.236 Fibonacci level and is currently sitting on the support which was the prior range resistance.


Zooming into the hourly chart we can see the interaction with the support level, and judging by the momentum behind the down move, the price is likely to be heading down further.


Market sentiment 

Ripple is a sell, as hourly chart technicals signal.

Oscillators are on buy, and moving averages on a strong sell.


Pivot points

S3 0.57247 
S2 0.58842 
S1 0.59624 
P 0.60437 
R1 0.61219
R2 0.62032 
R3 0.63627

Conclusion


Crypto Market News: As seen on the charts, major support lines have been crossed below and the prices are now heading even further down as the strong momentum behind the down move has to find strong buying pressure in order to see a trend reversal.