While most of the top cryptocurrencies took the day to consolidate or advance slightly, Ethereum tokens were the most volatile and moved up or down with much more intensity. Bitcoin is currently trading for $11,835, which represents an increase of 0.56% on the day. Meanwhile, Ethereum gained 1.39% on the day, while XRP gained 1.01%.
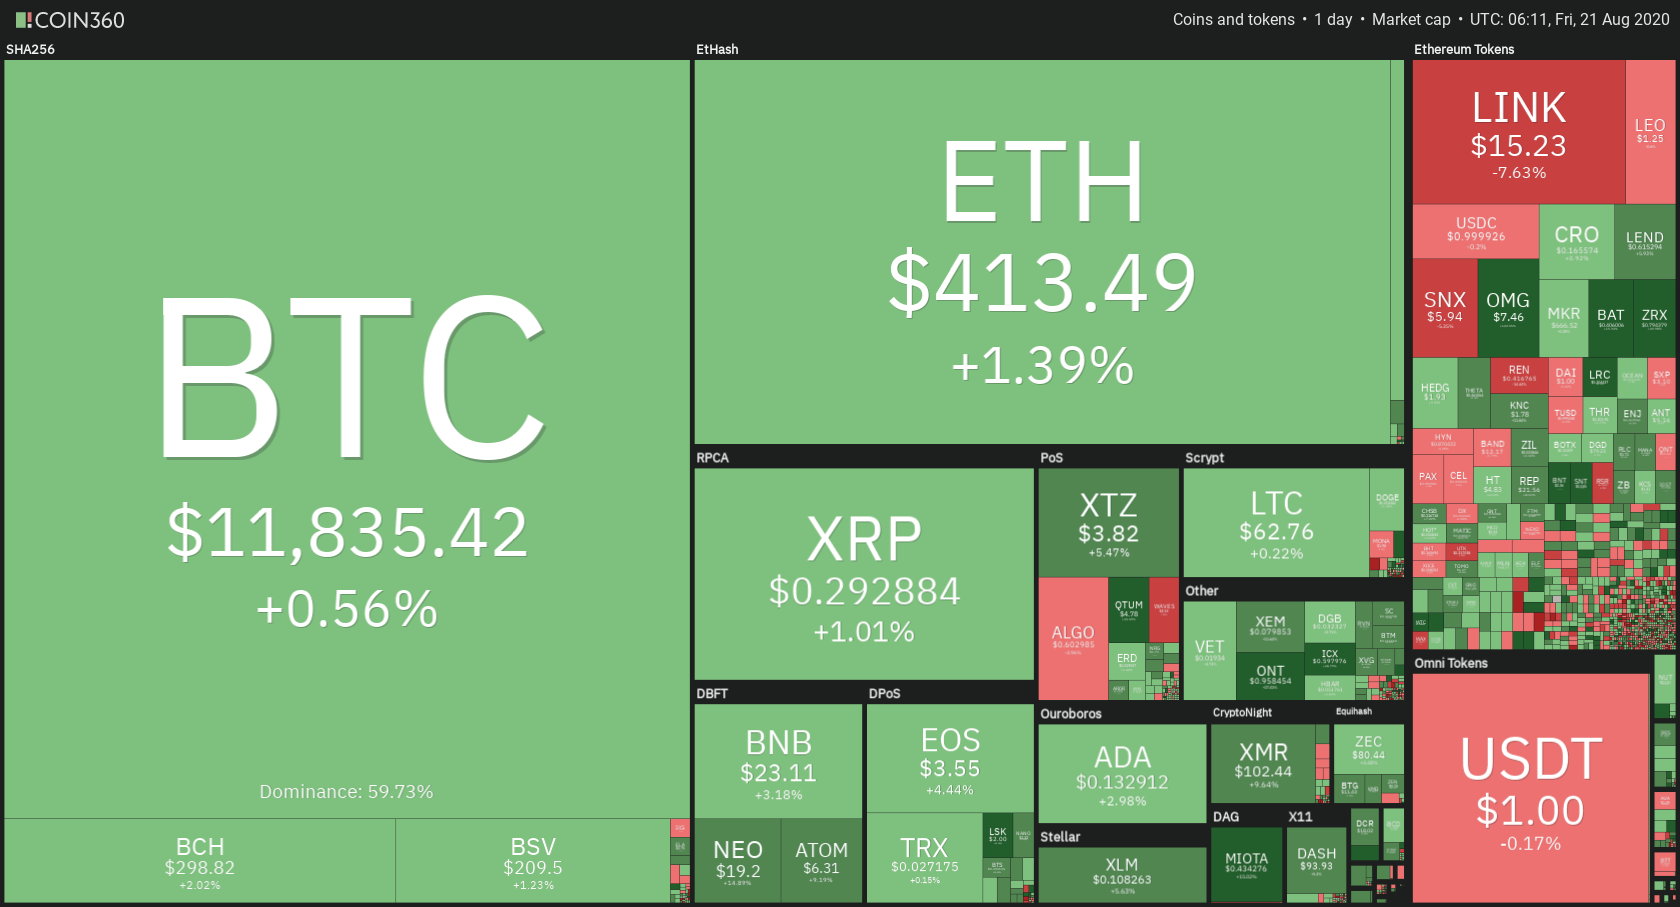
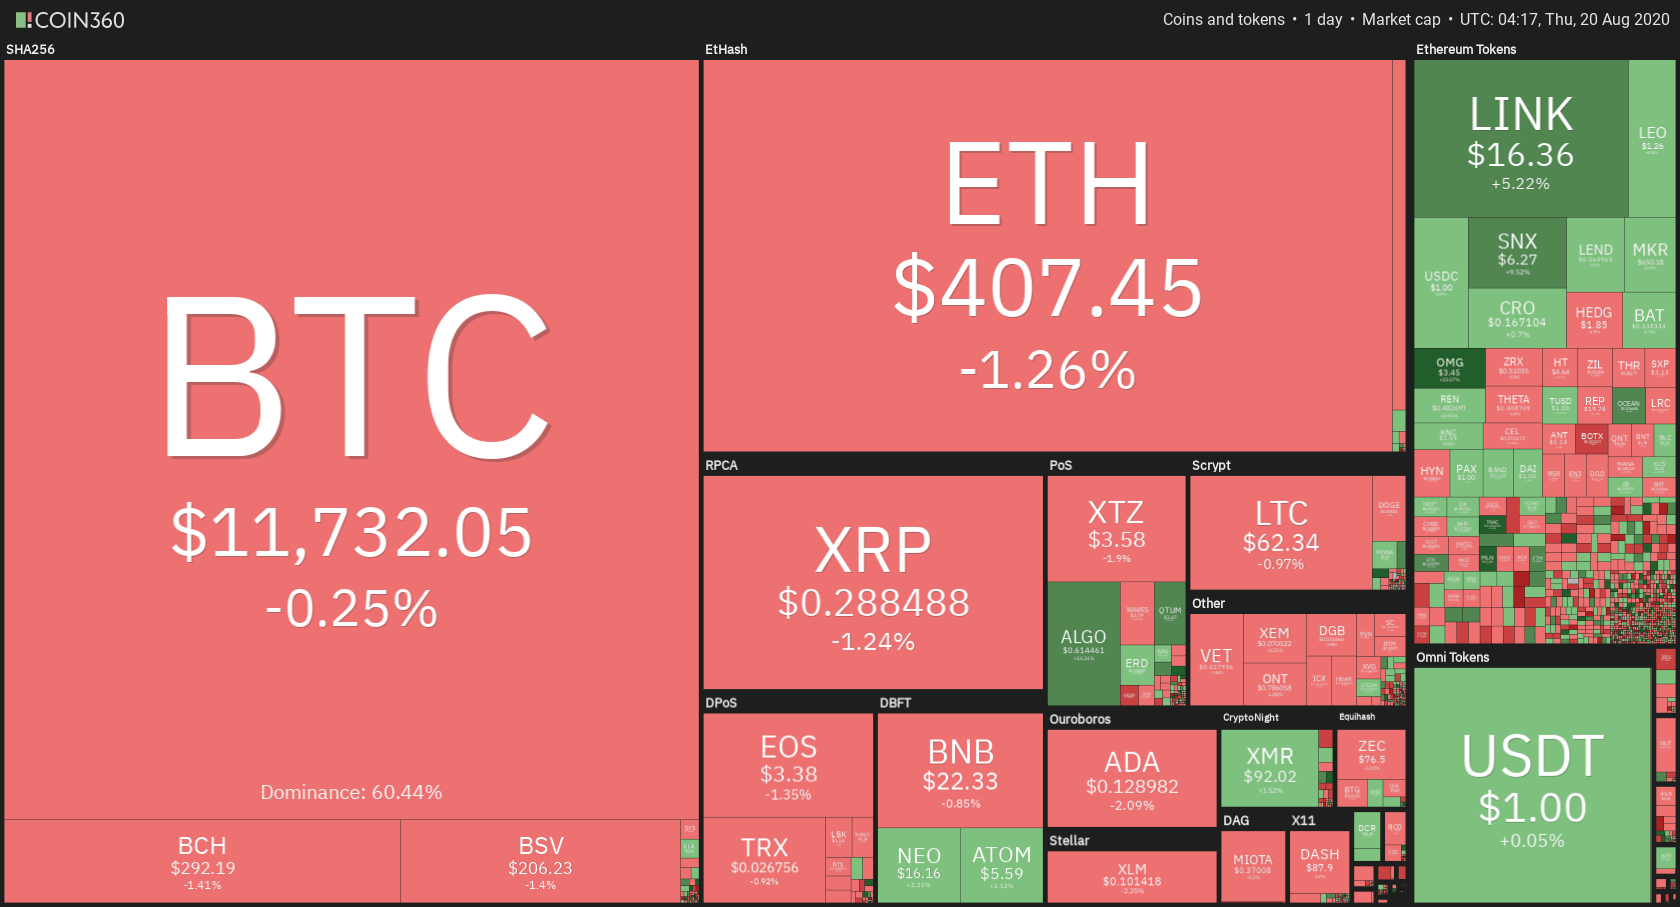
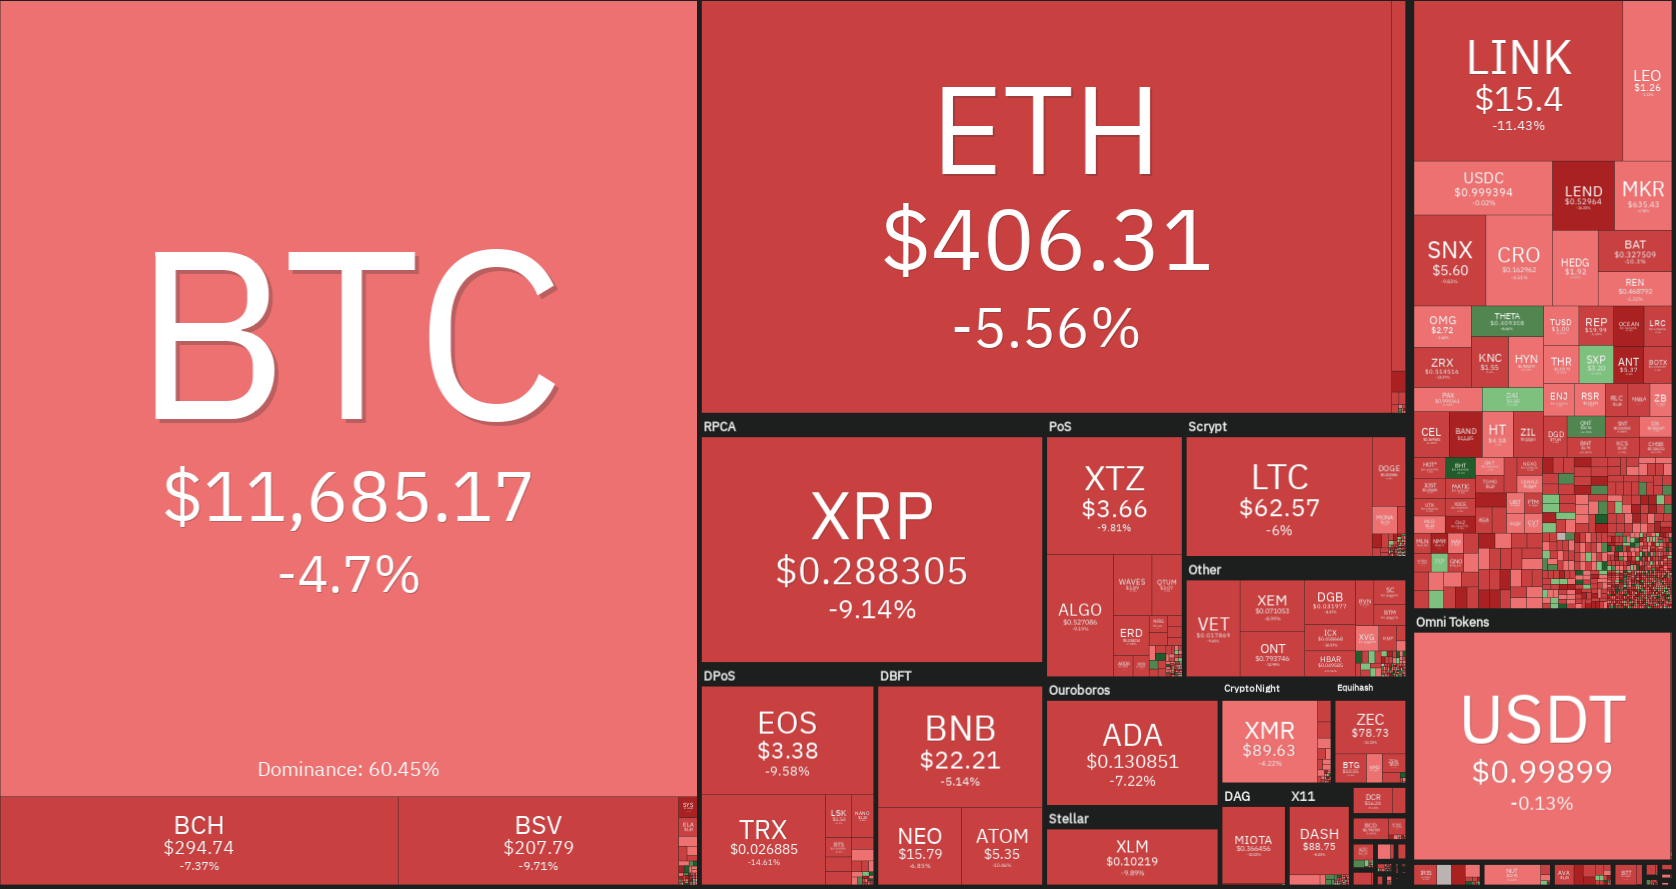
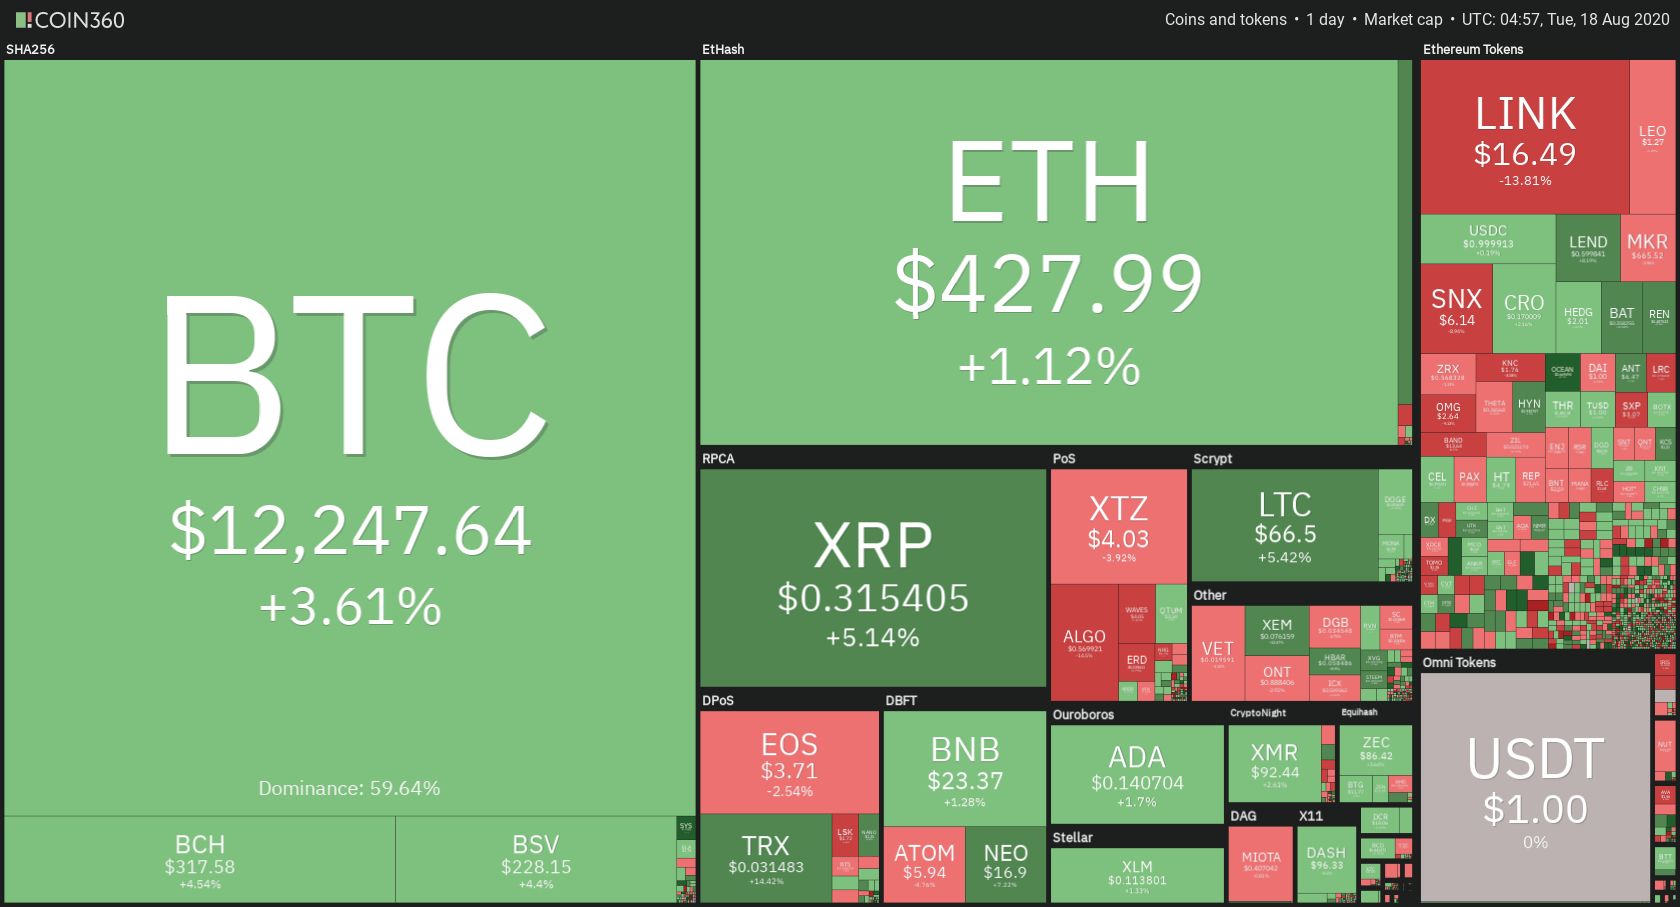
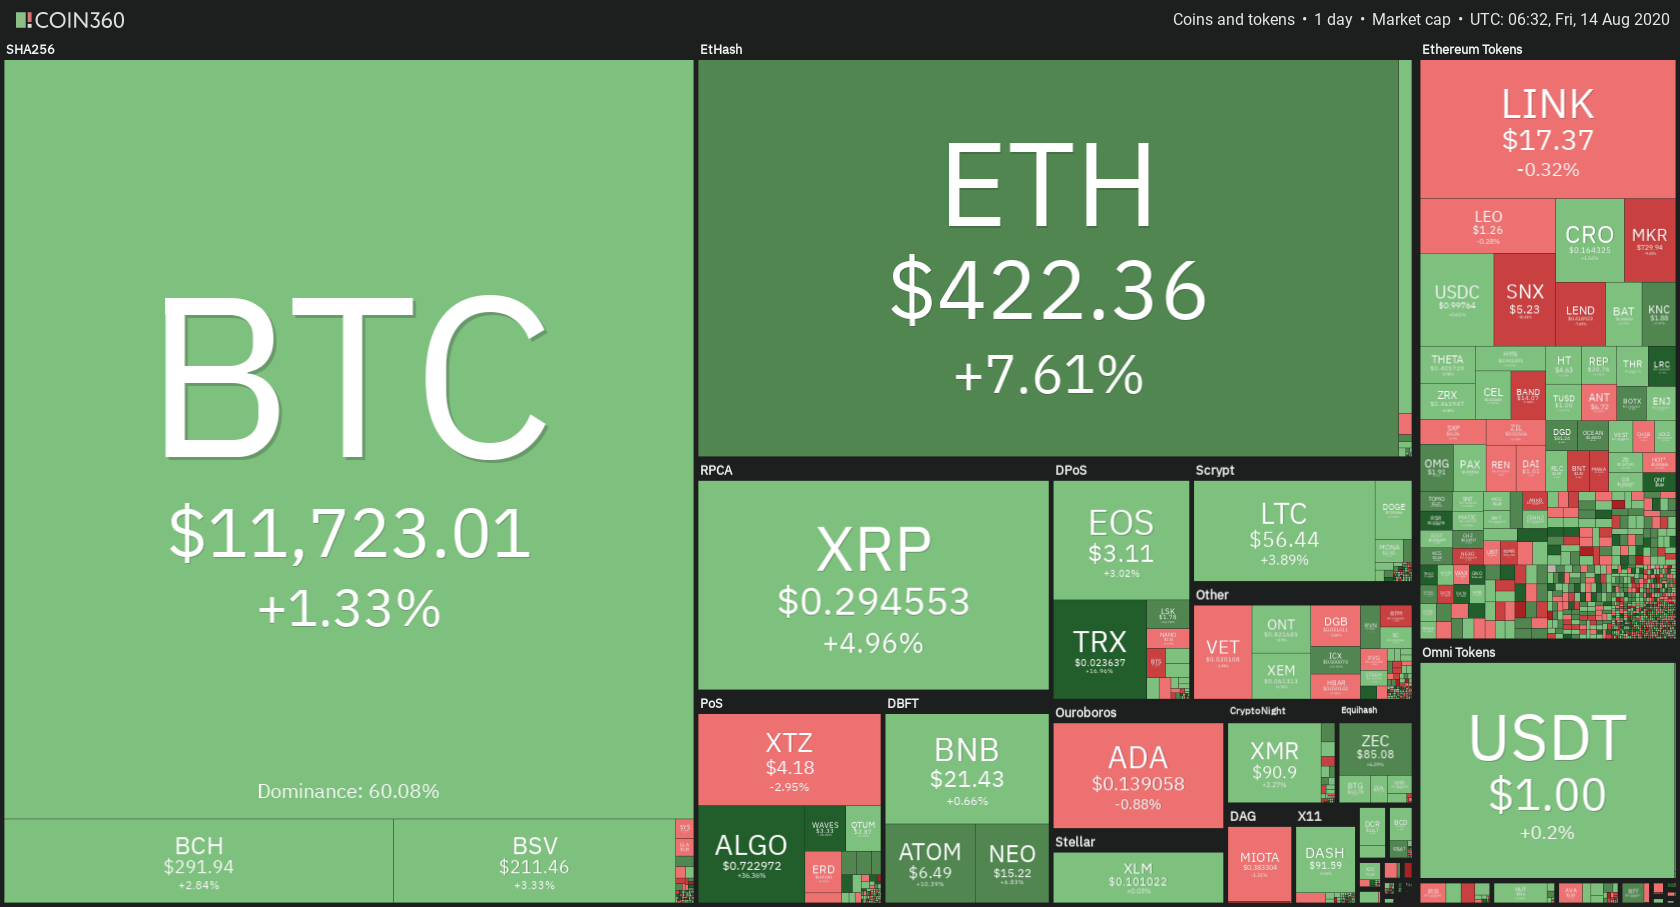
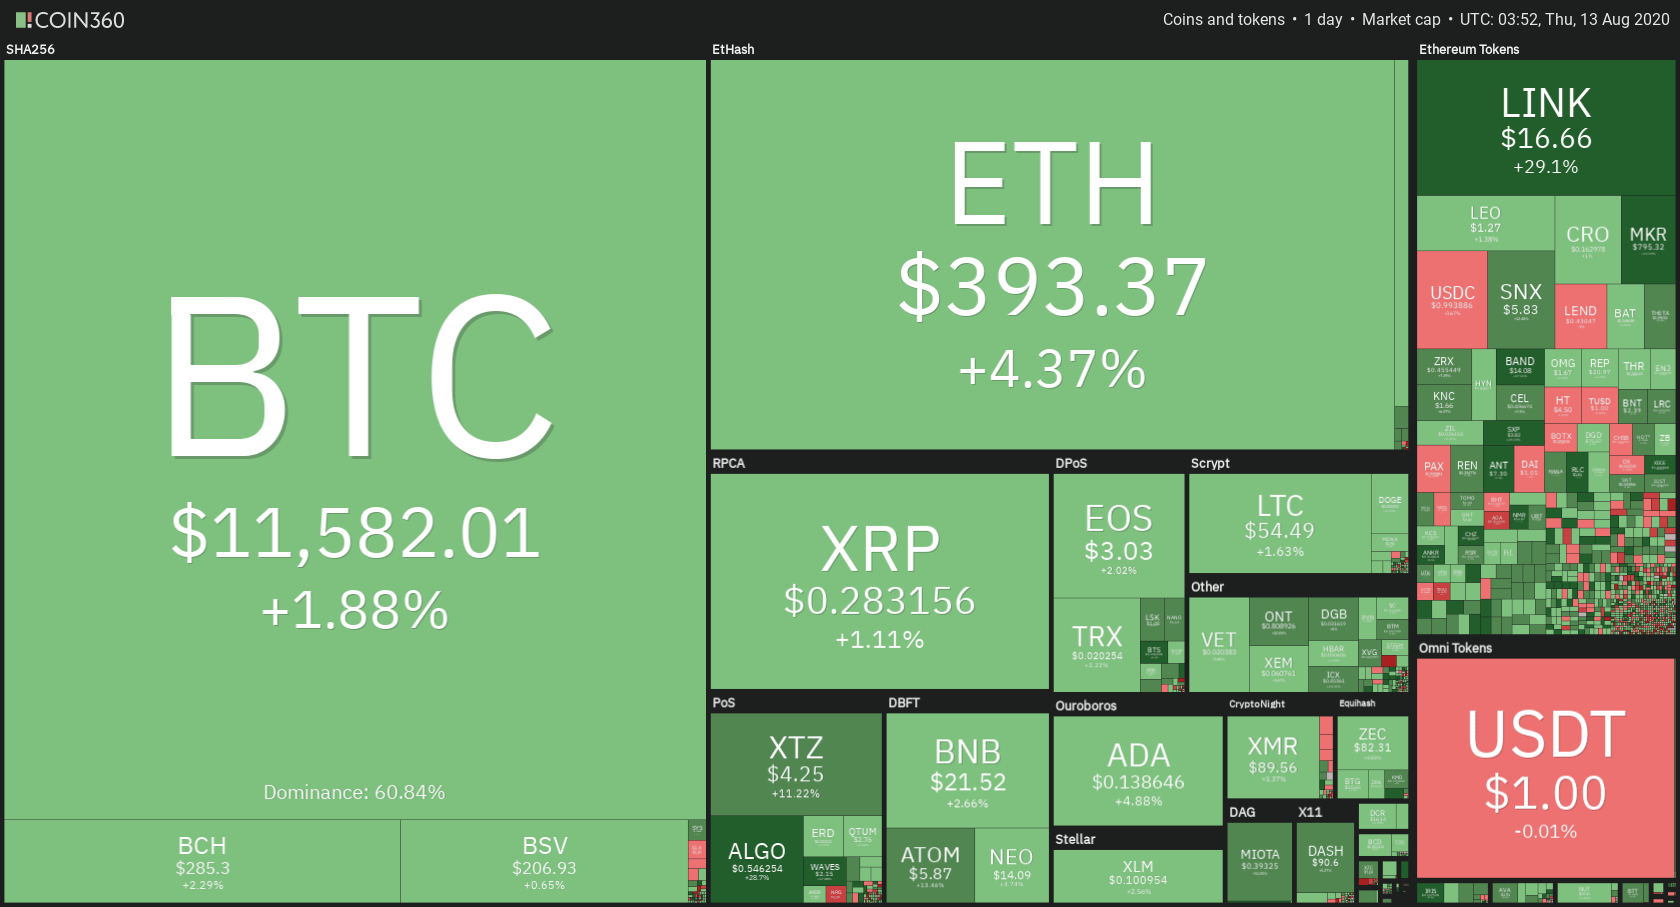
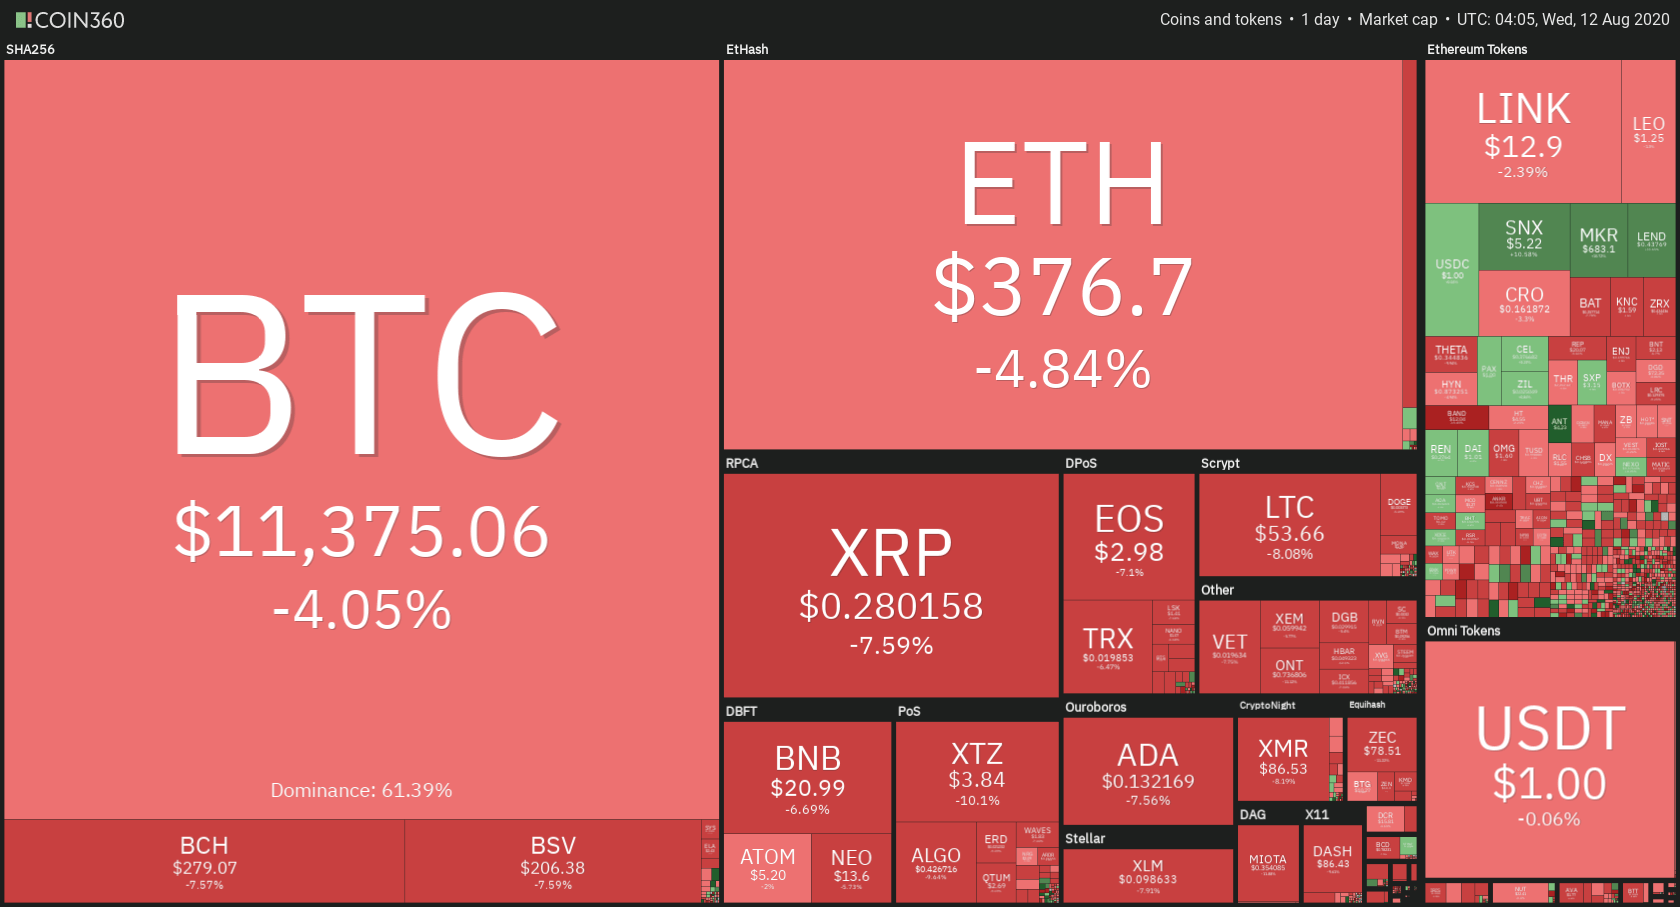
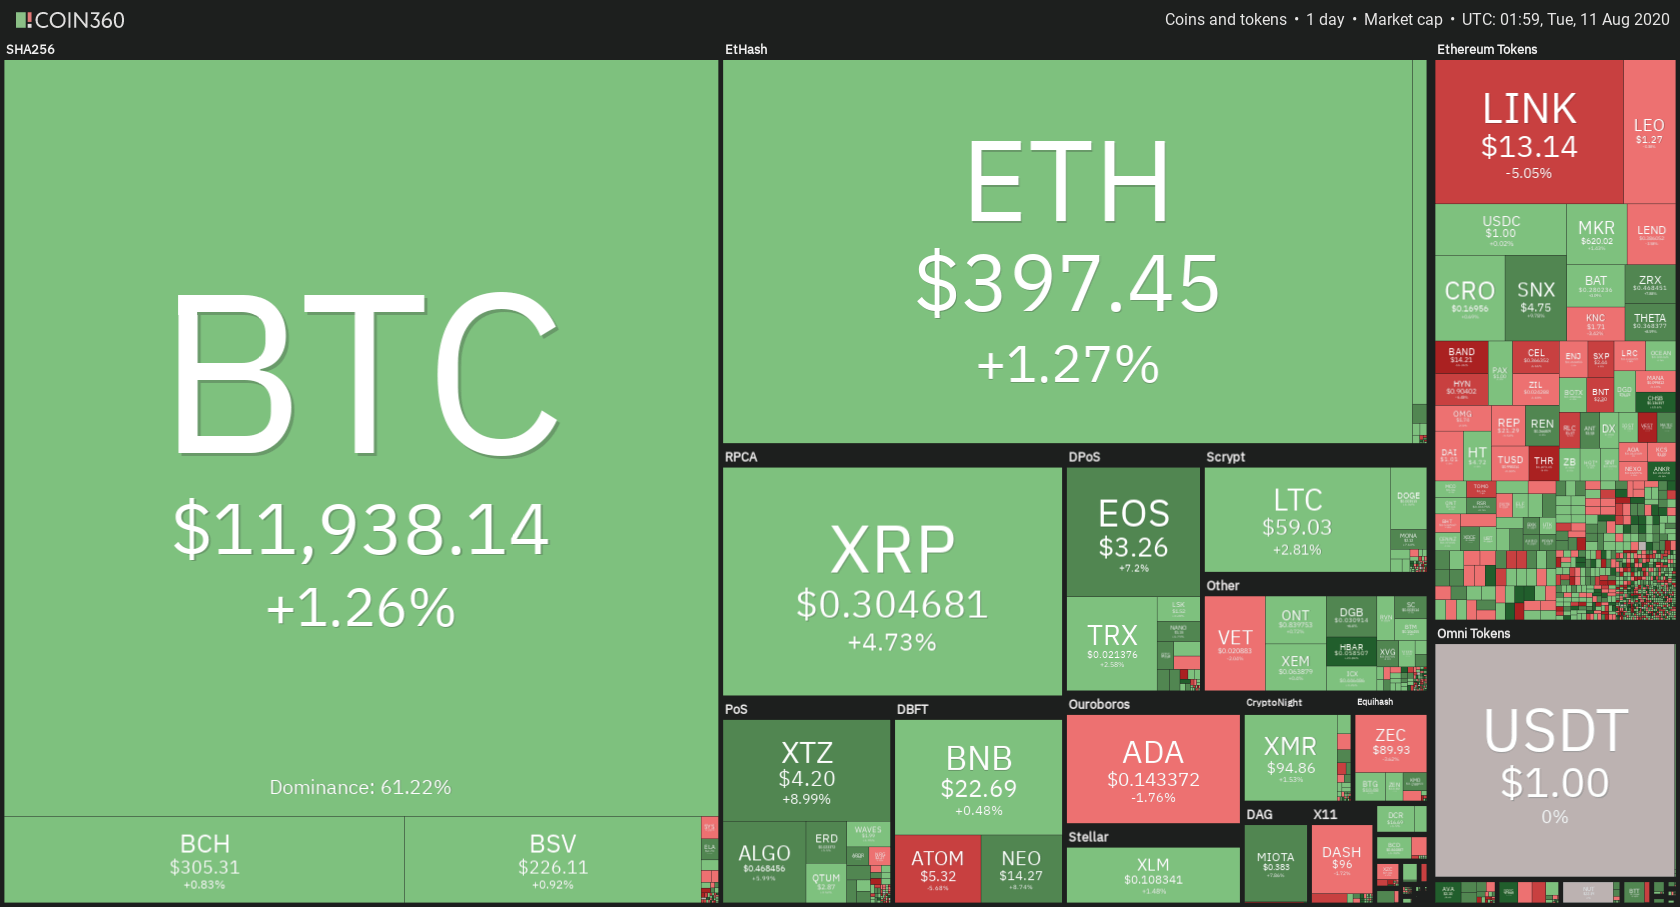
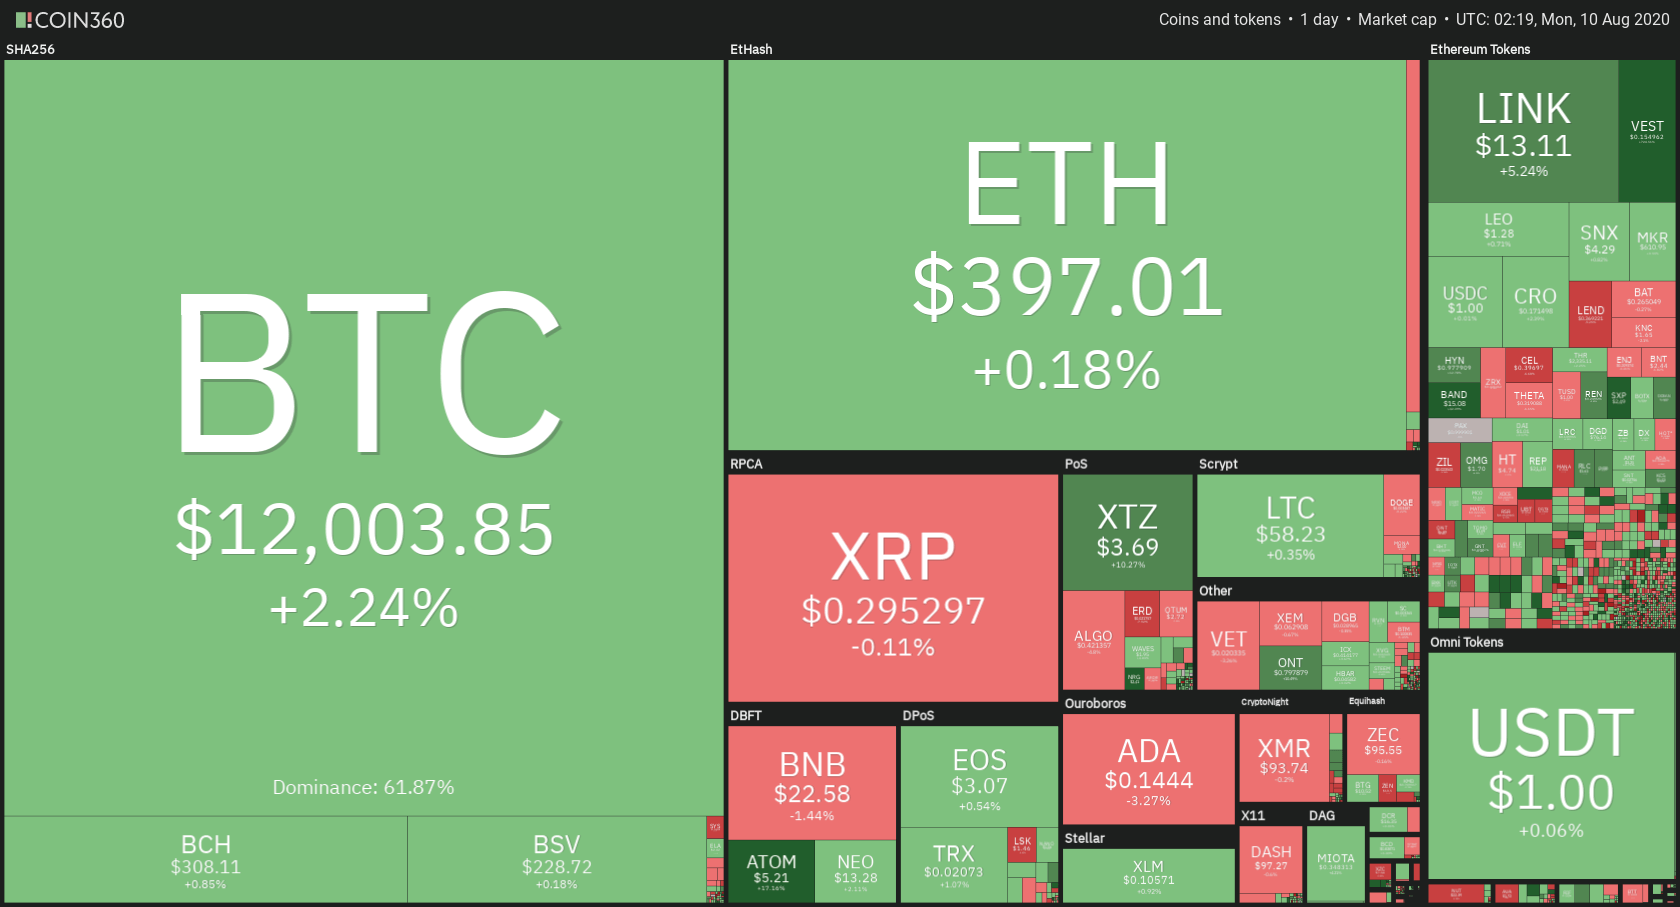
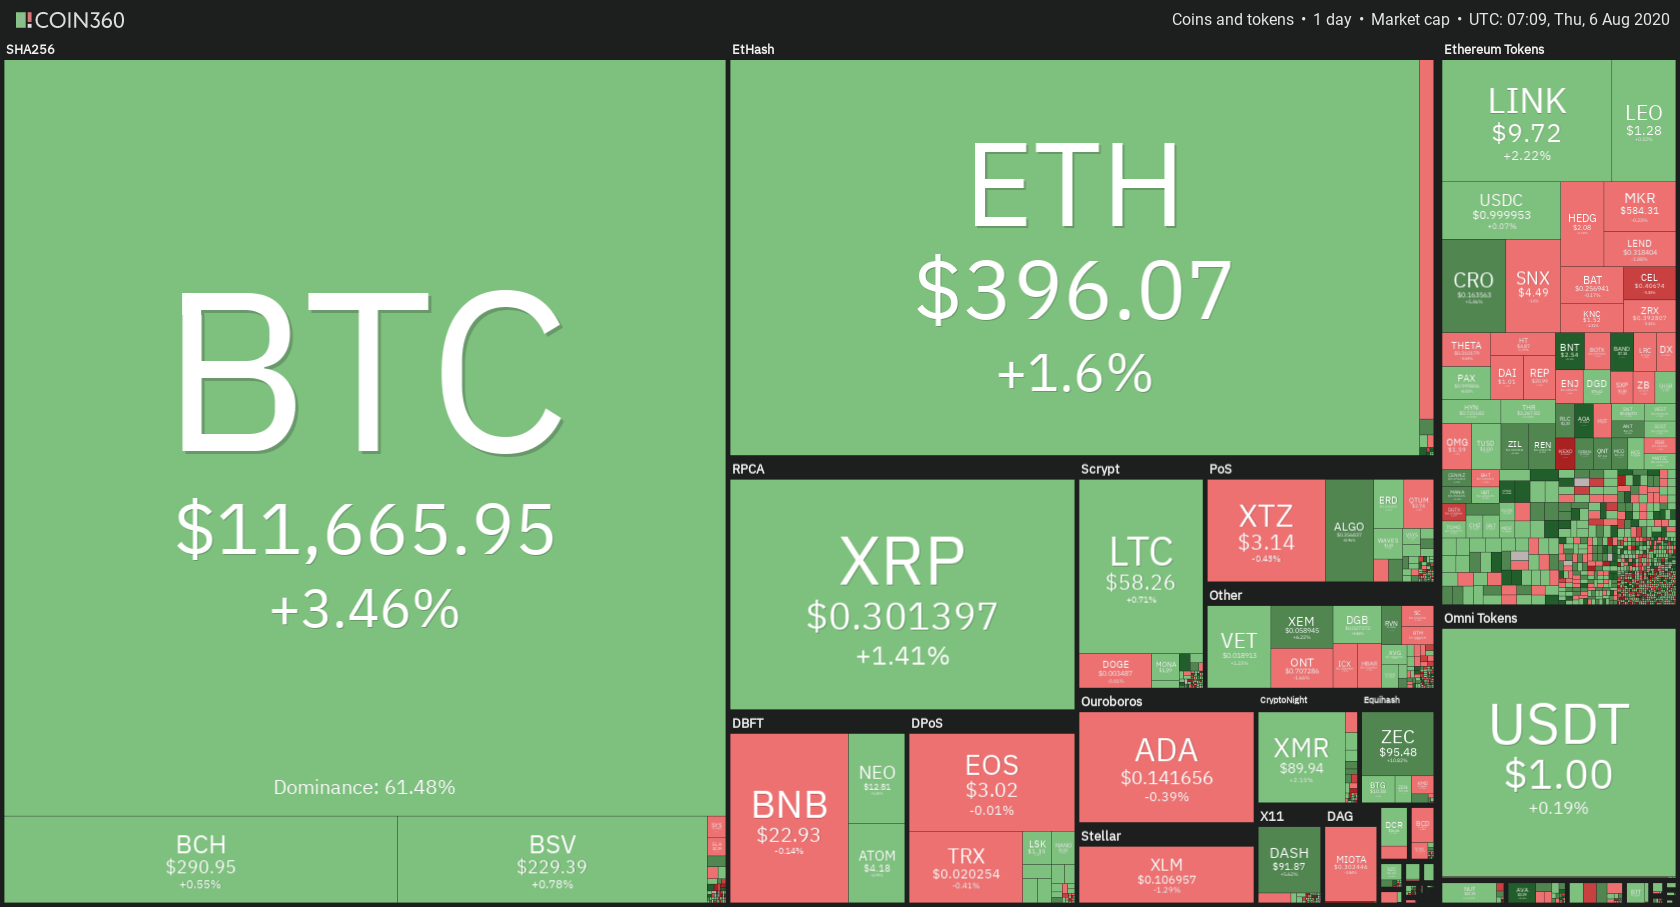
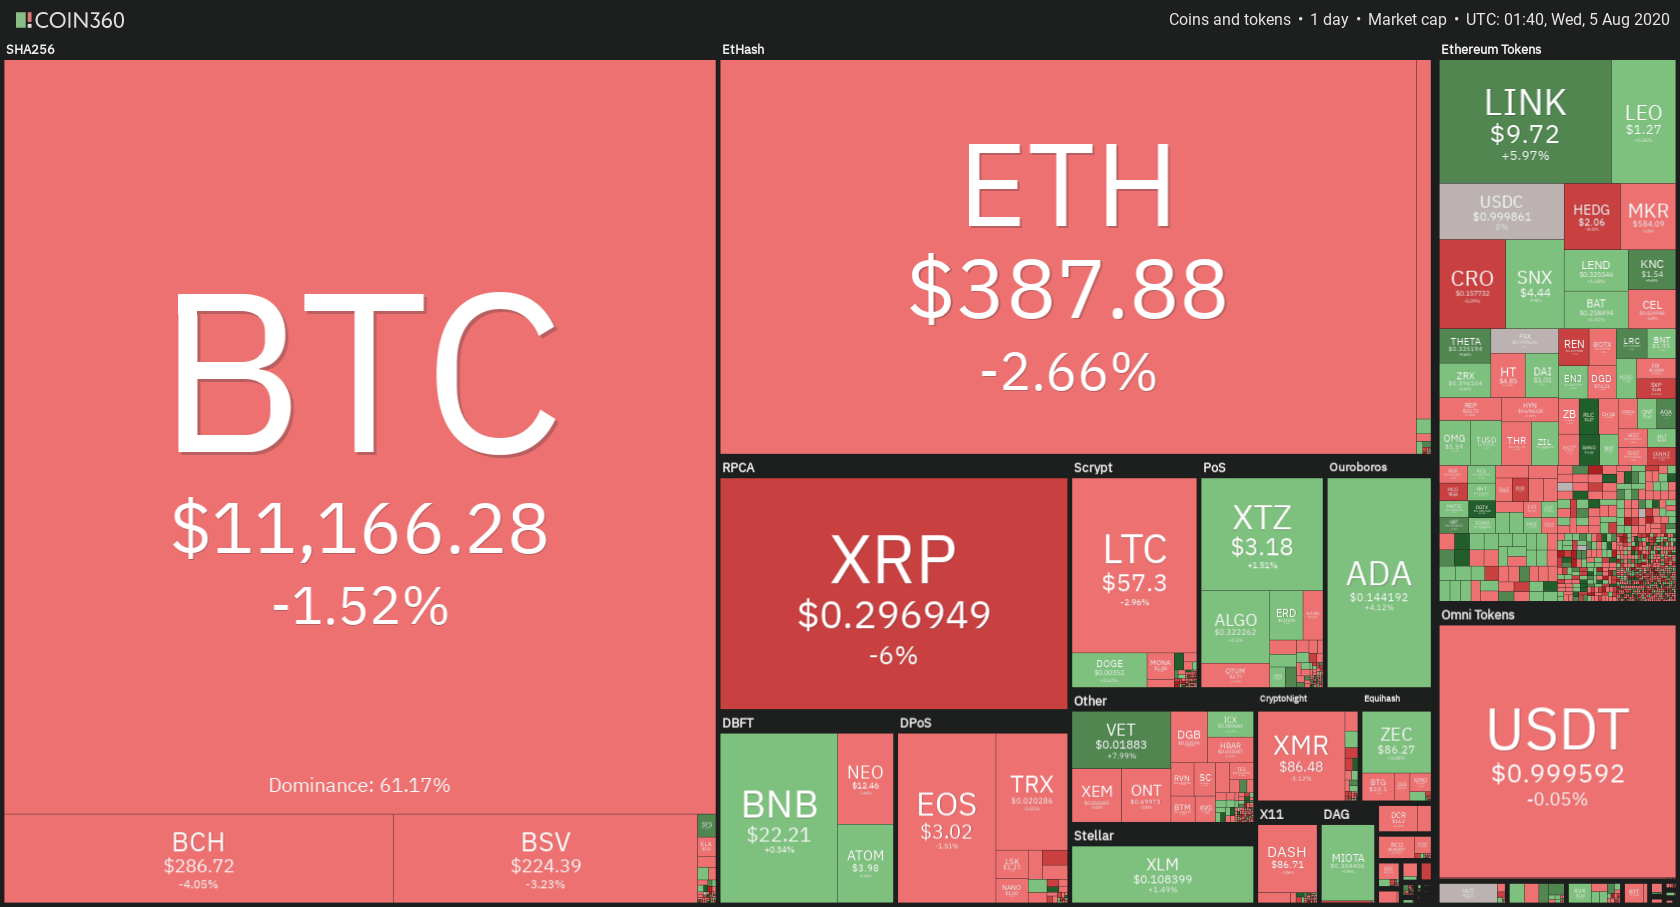
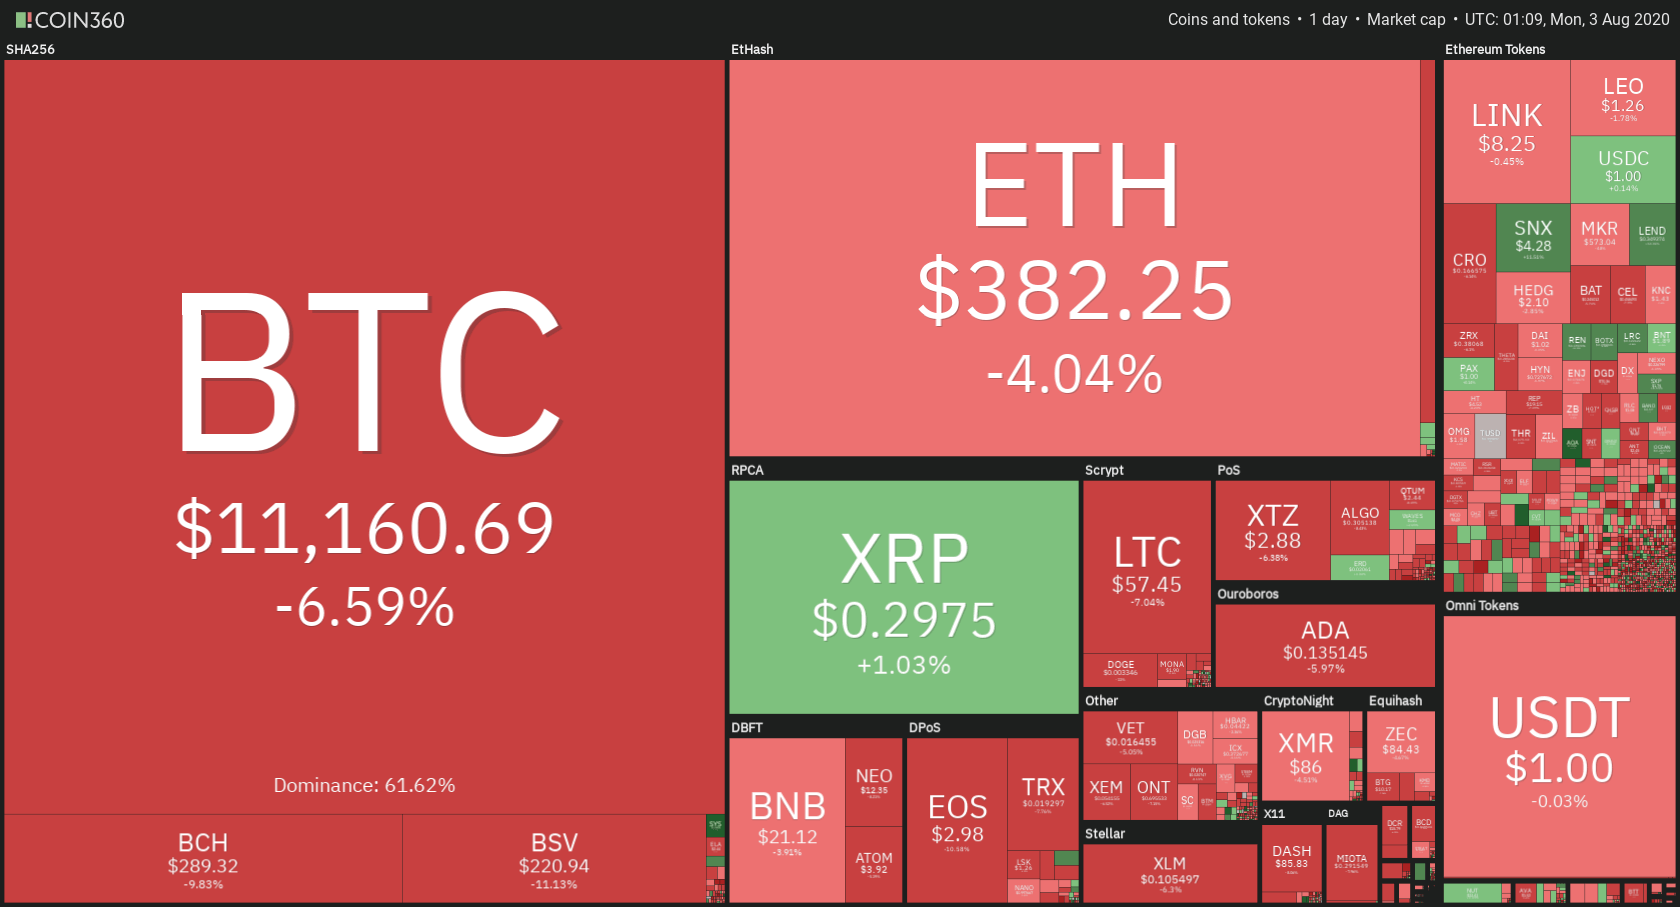
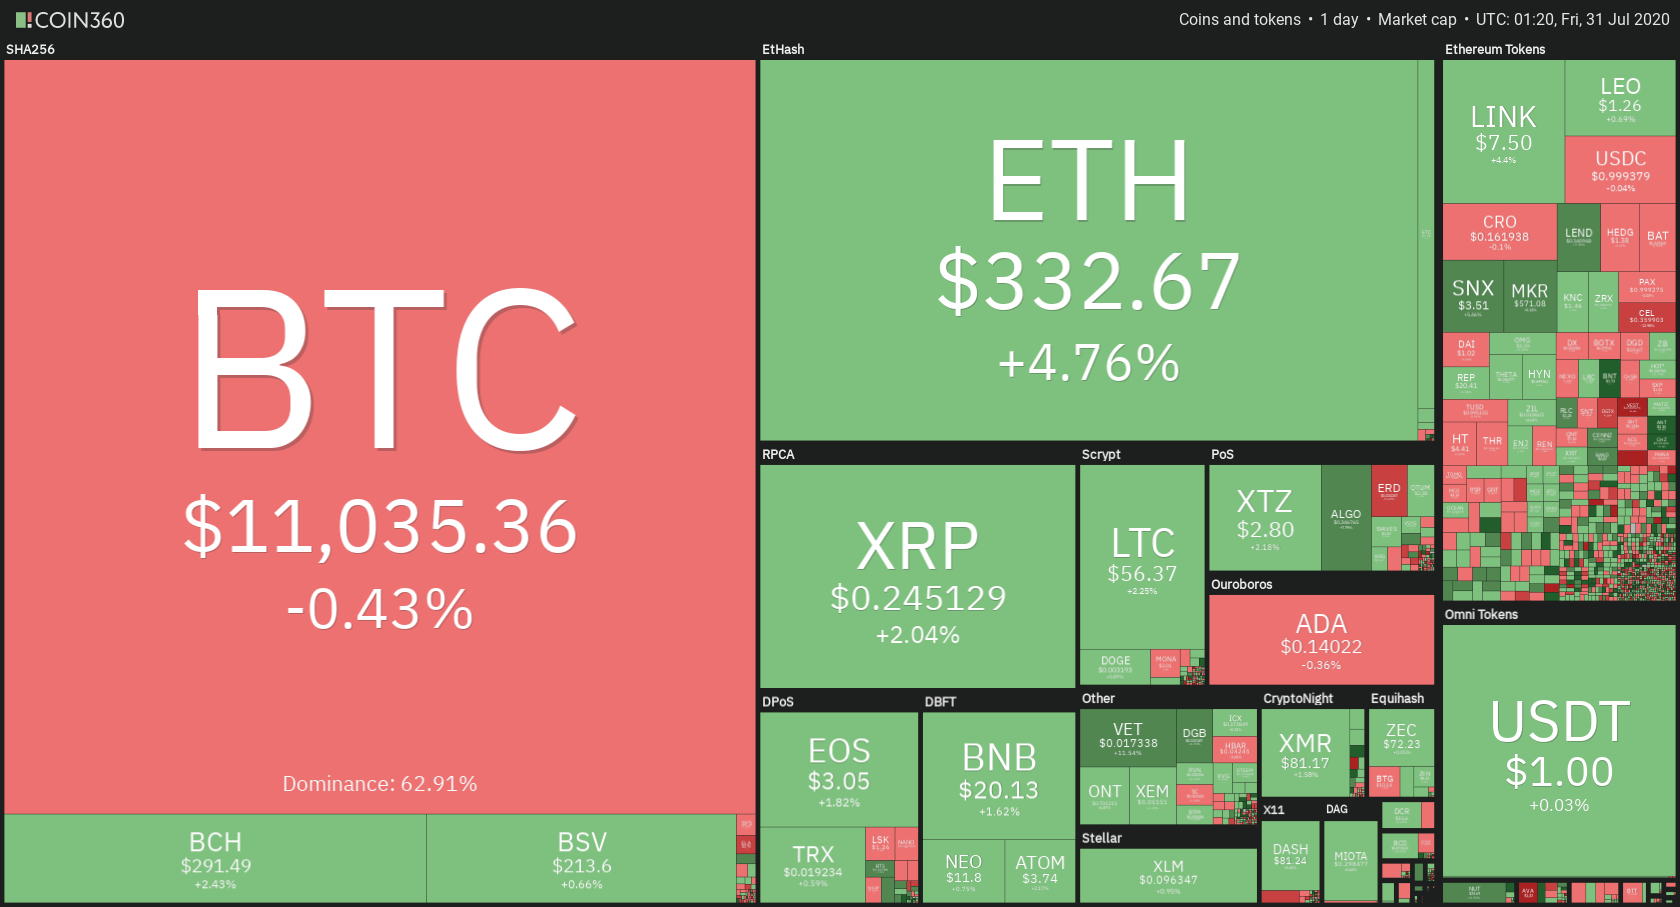
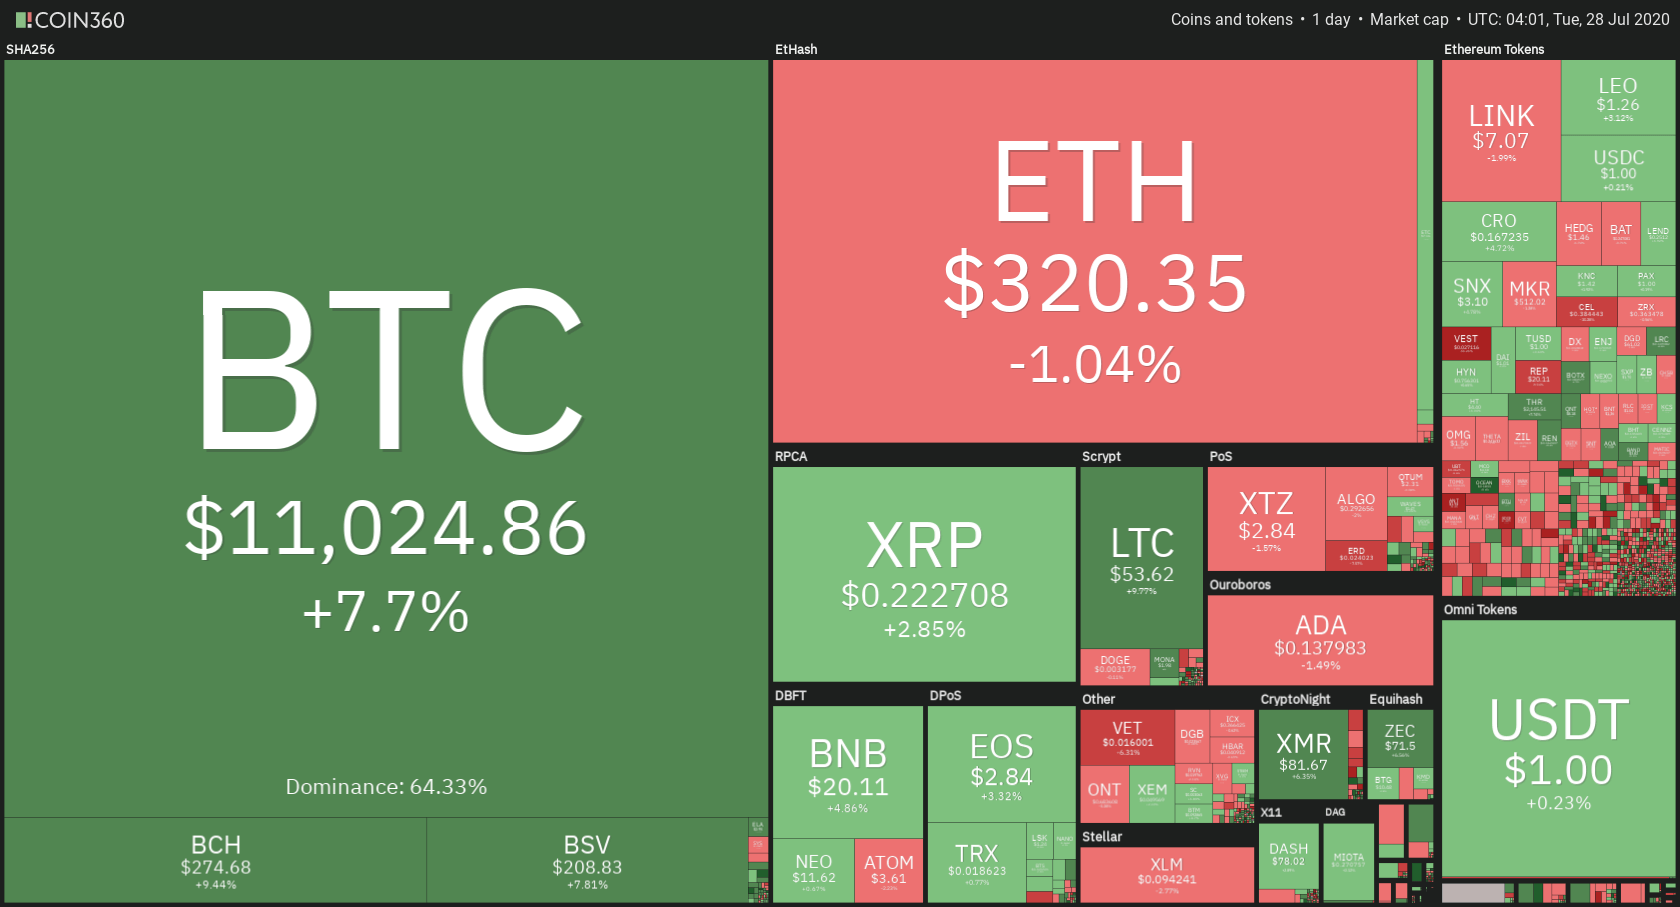
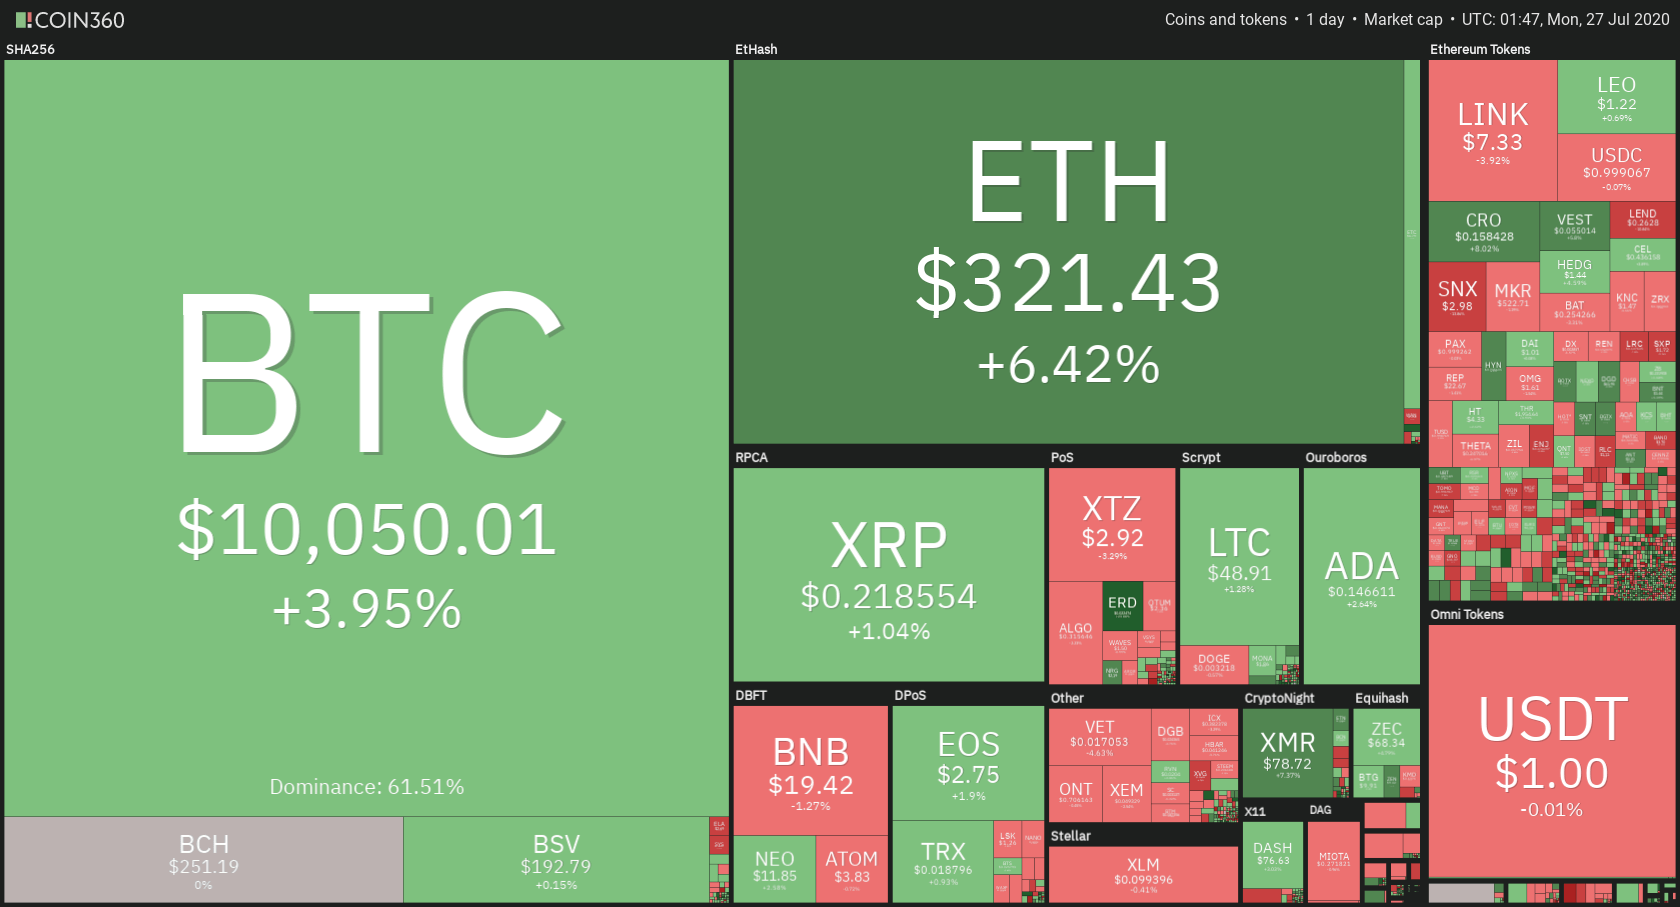
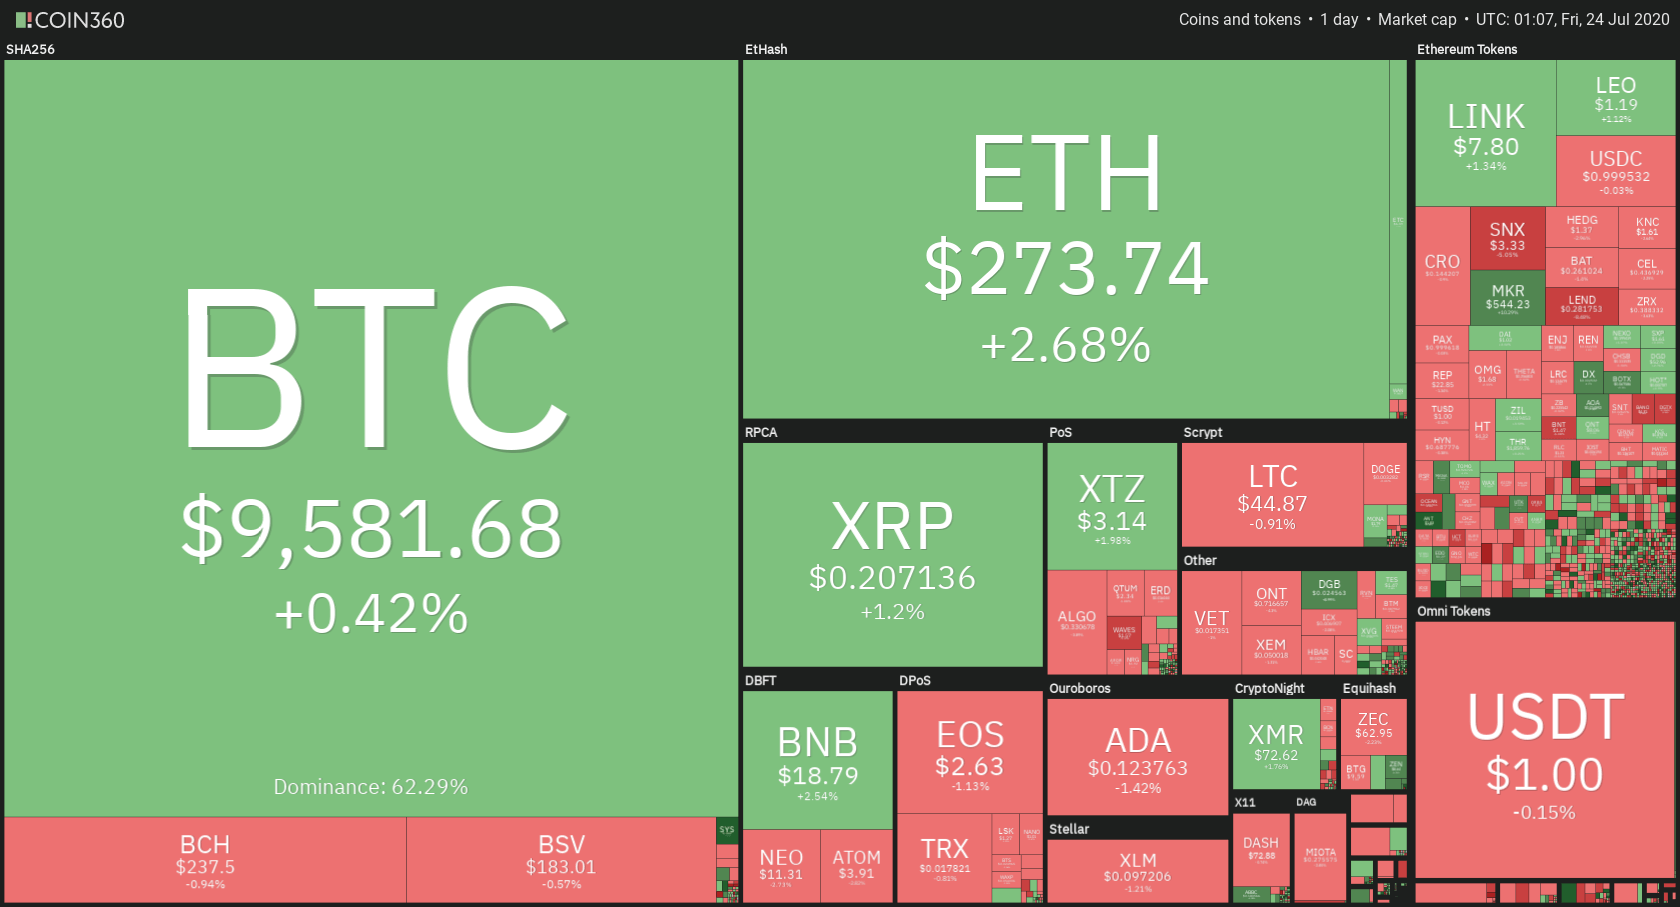
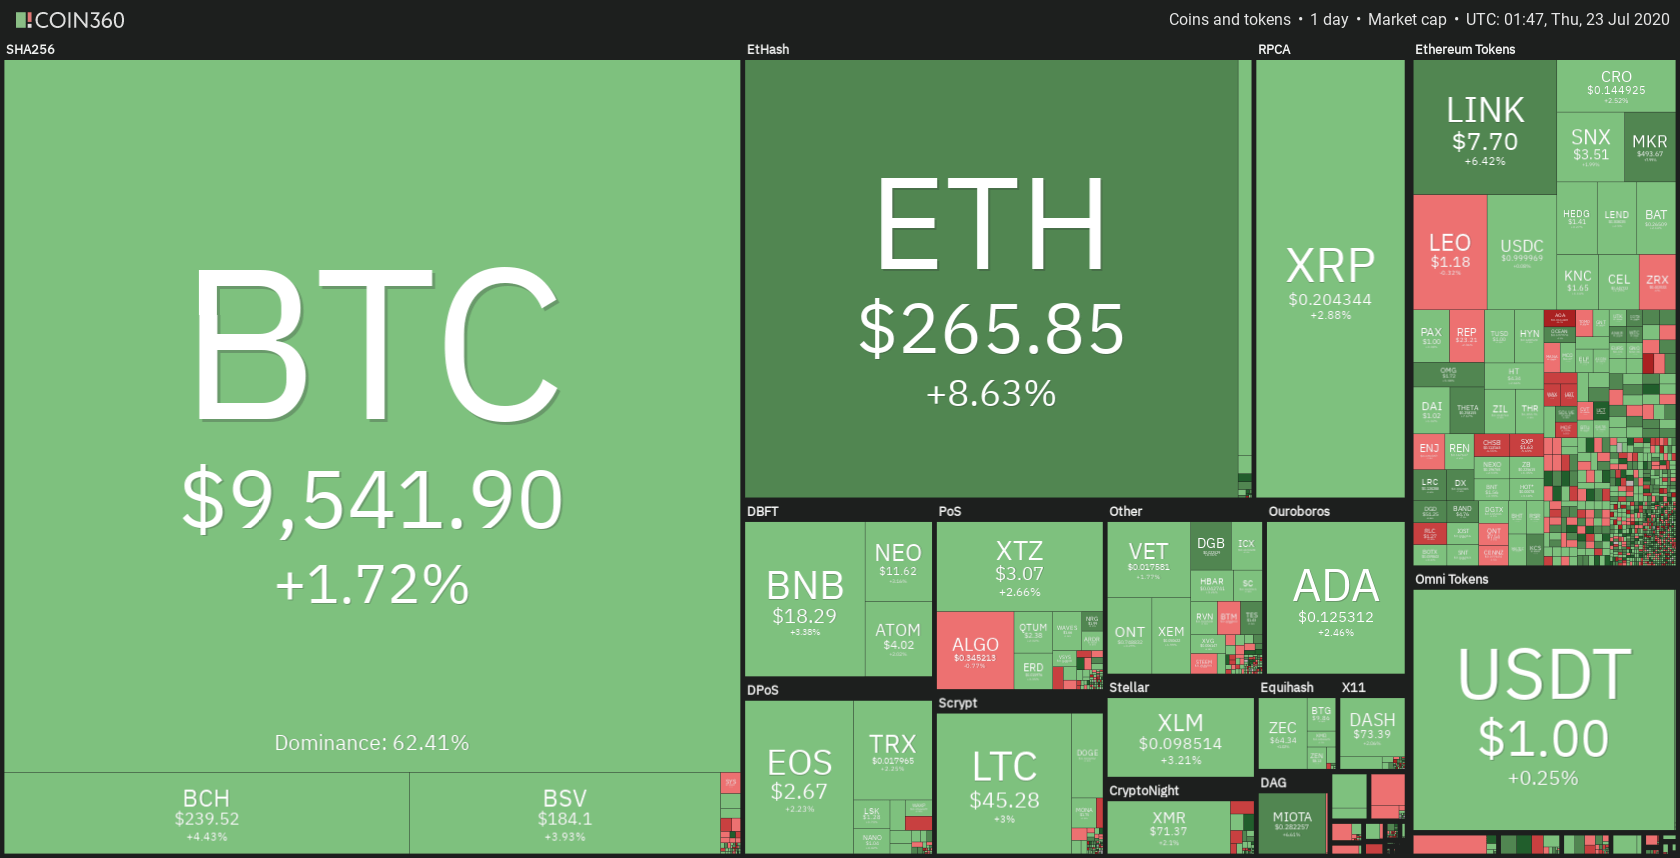
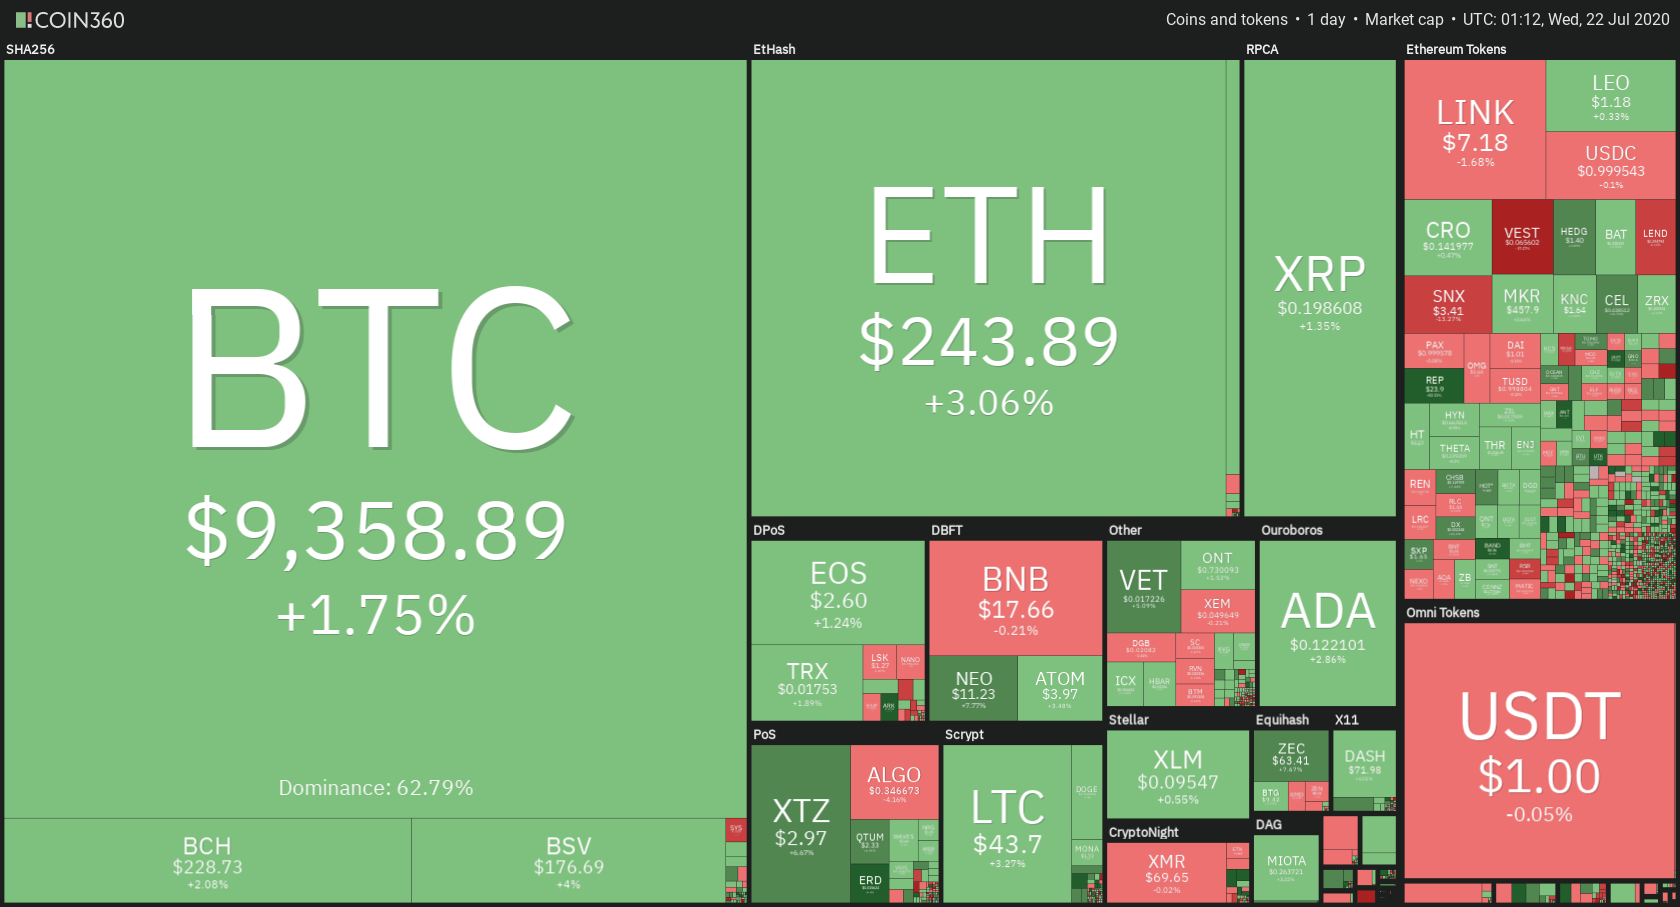
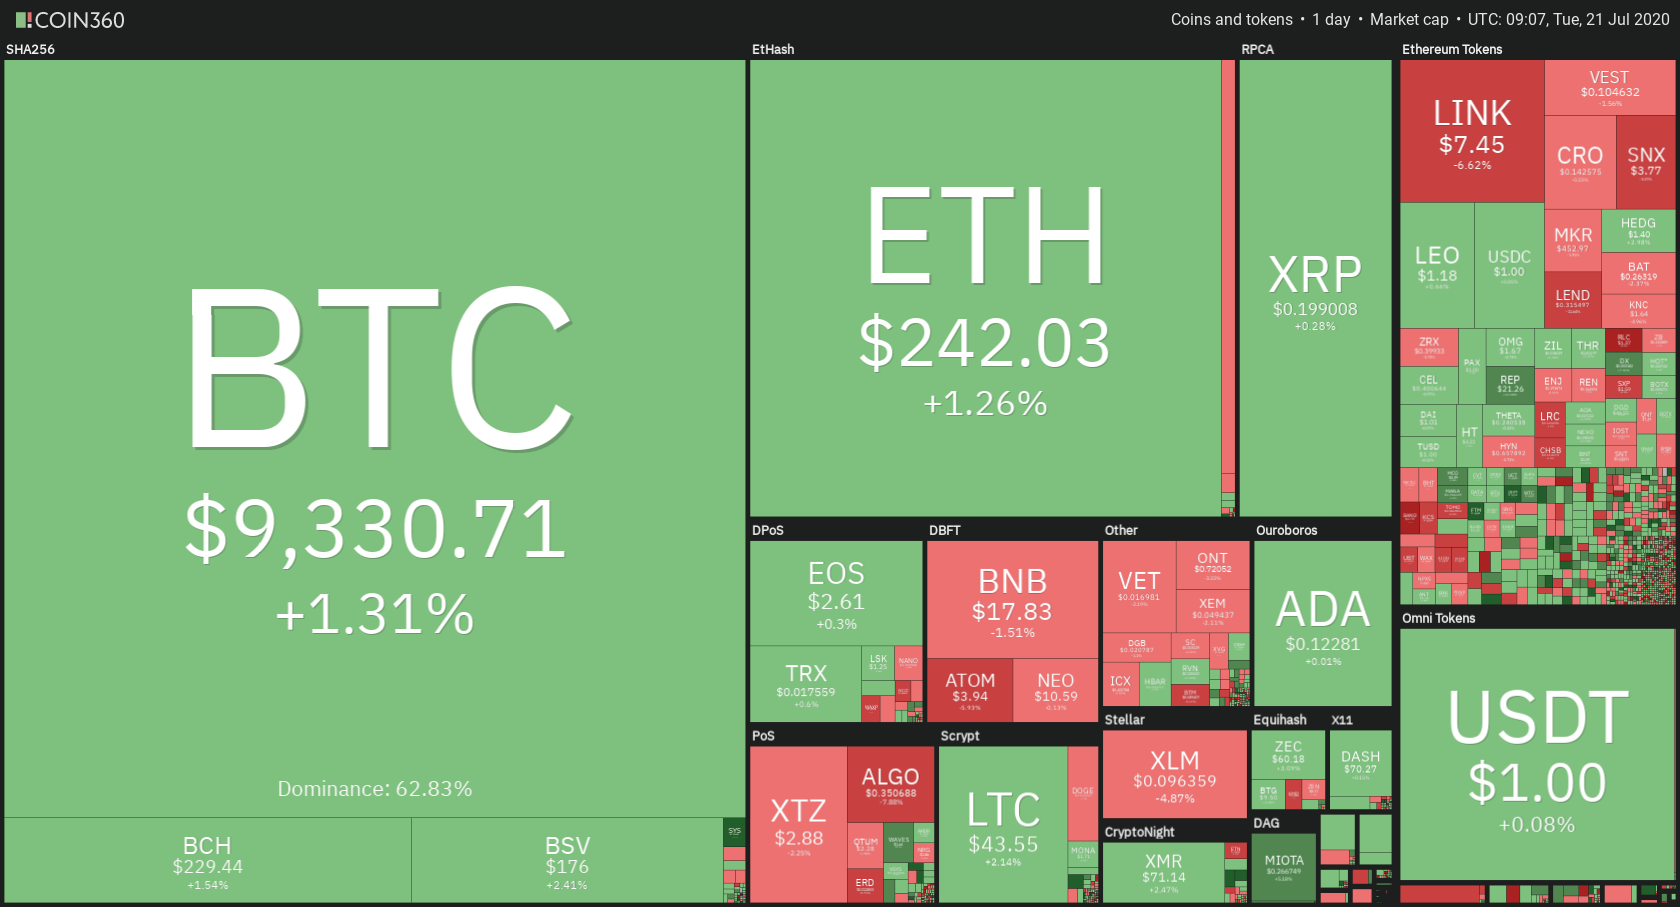
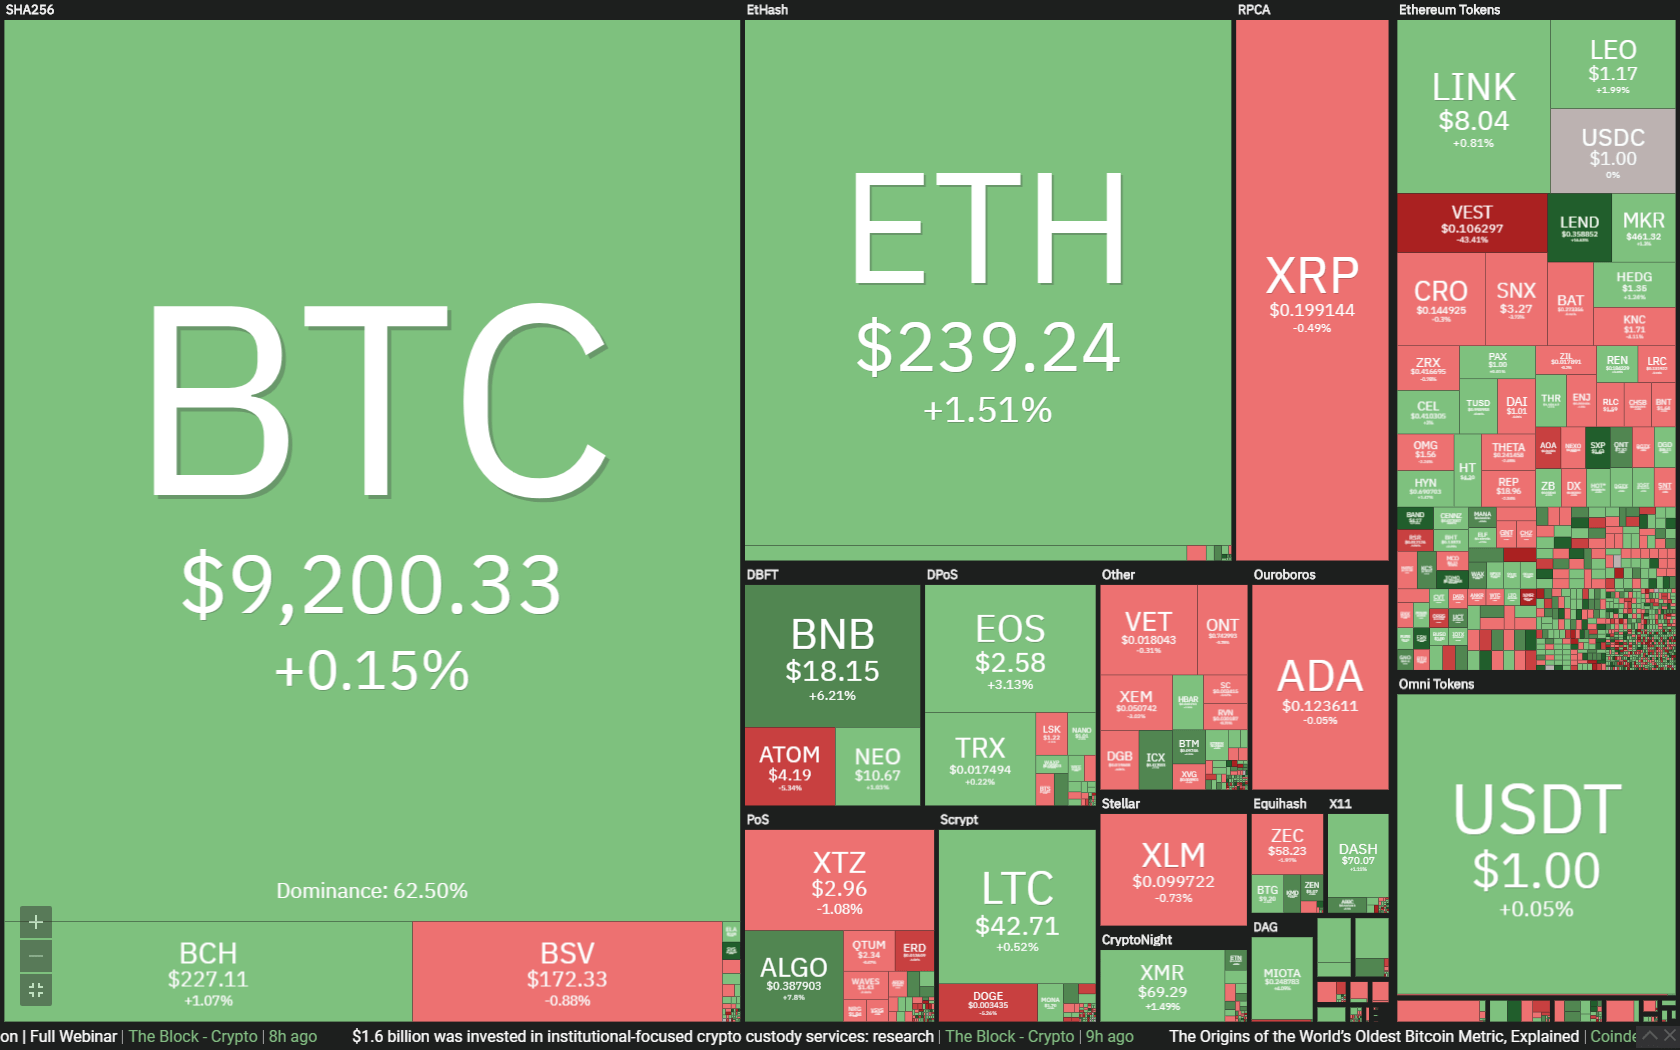
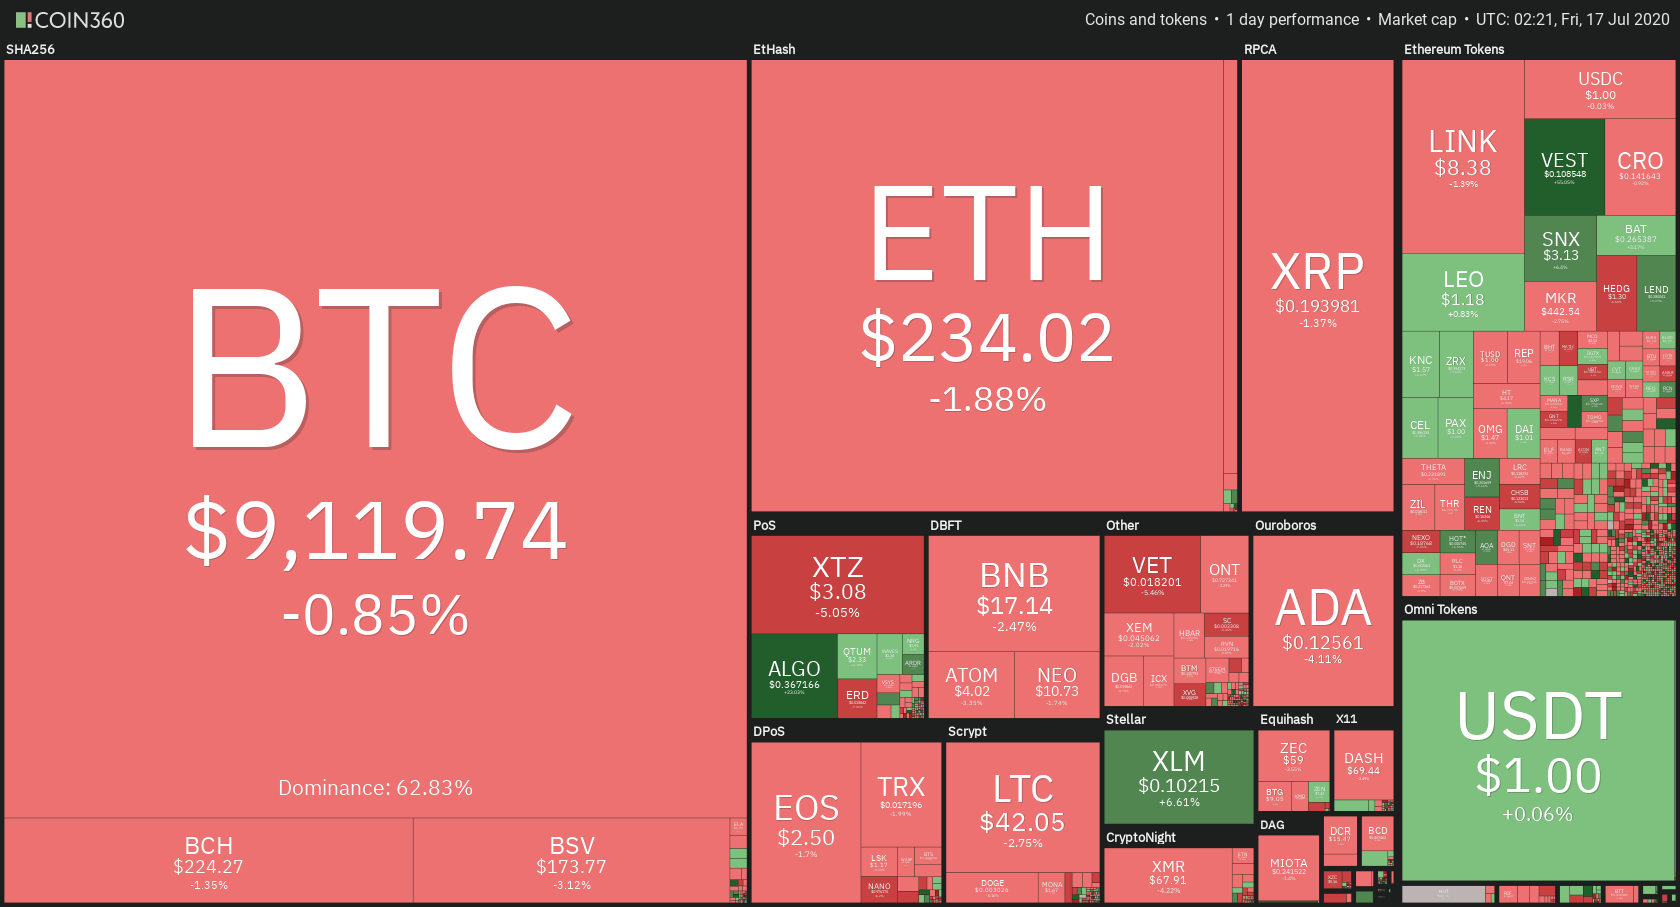
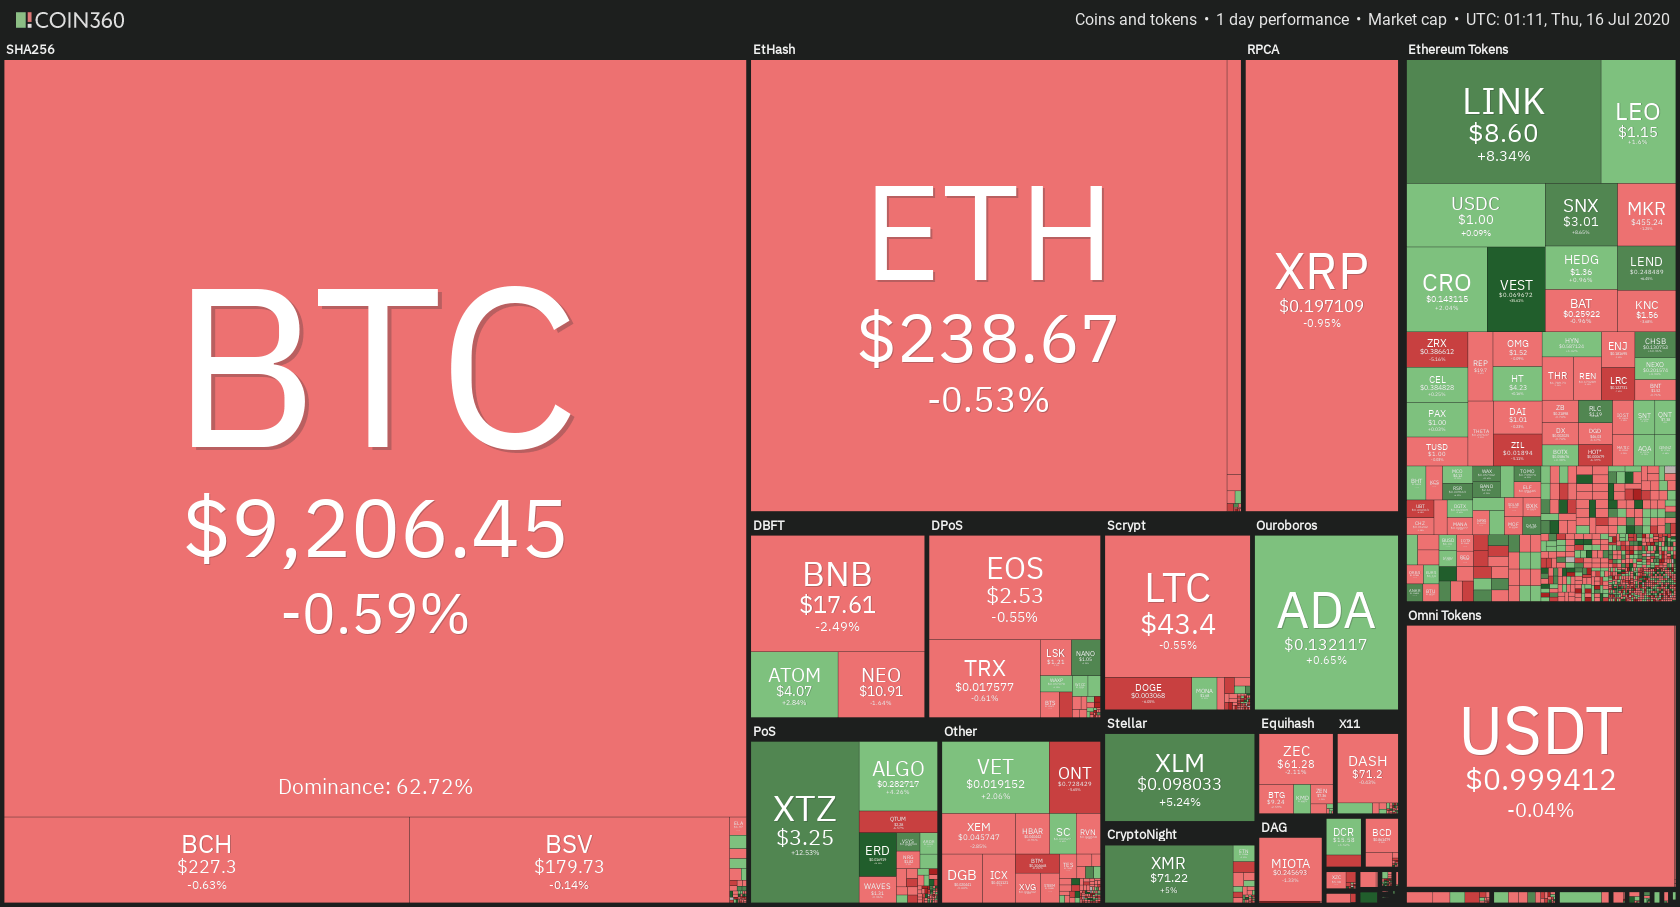
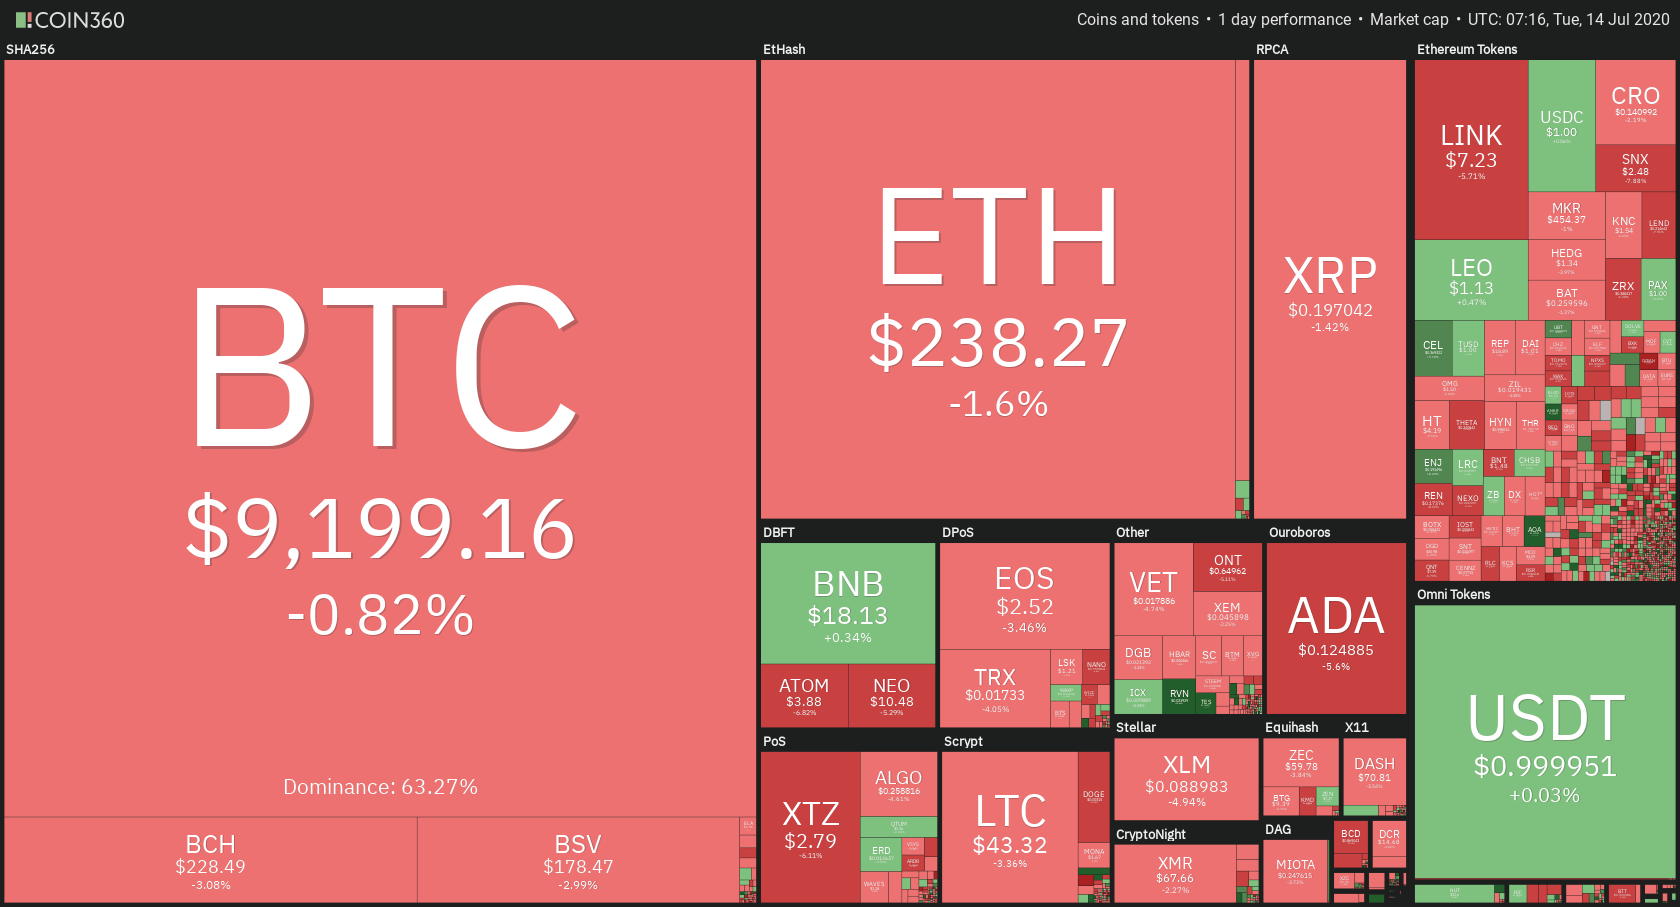
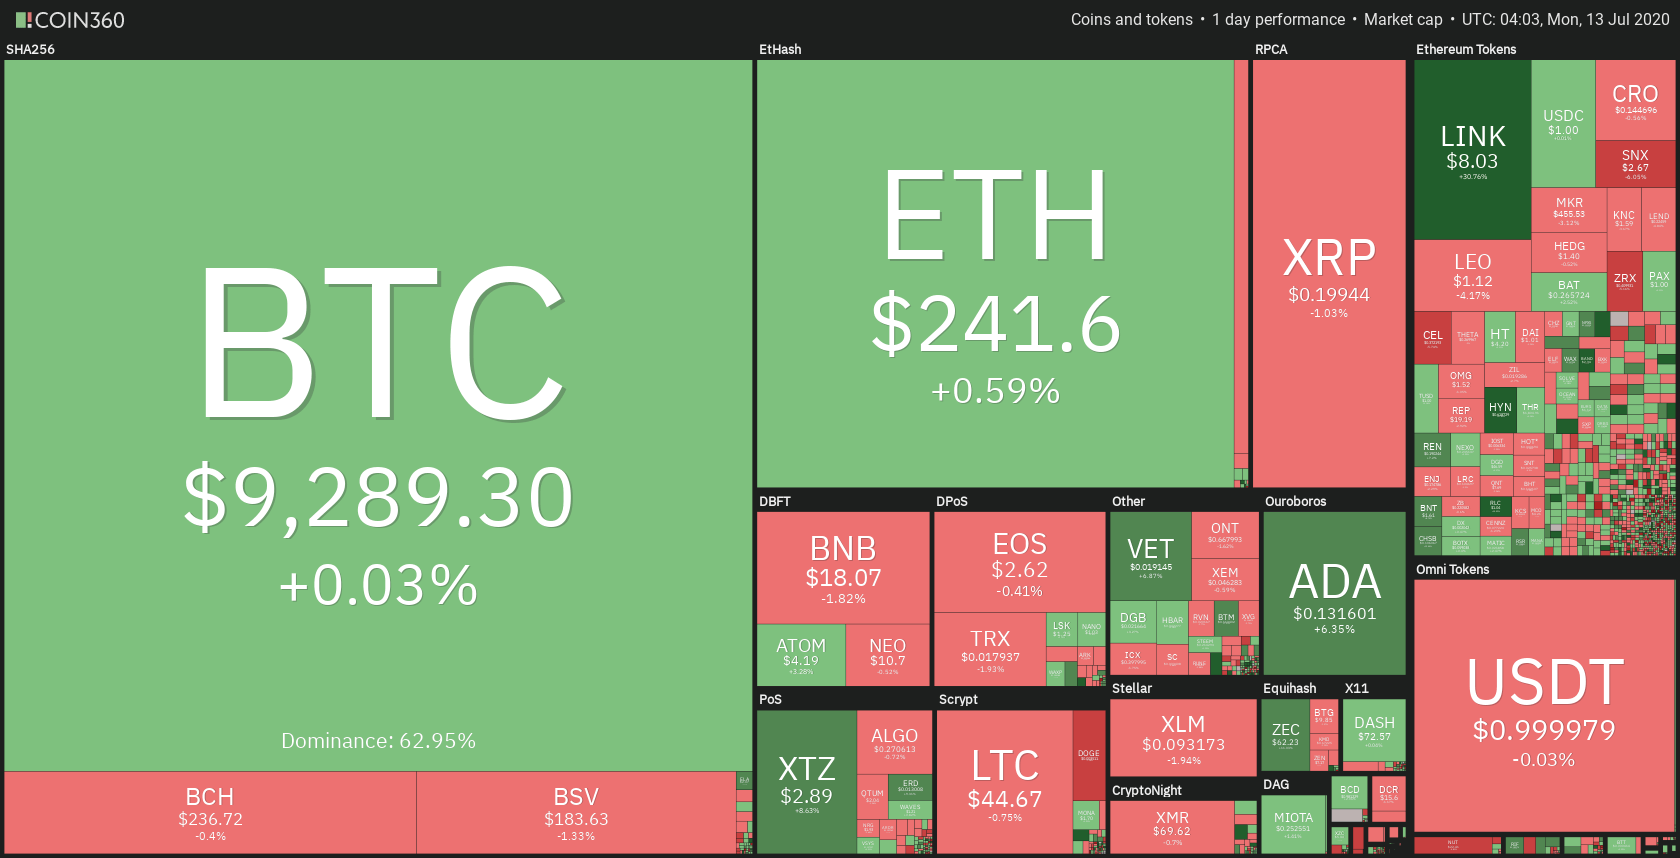
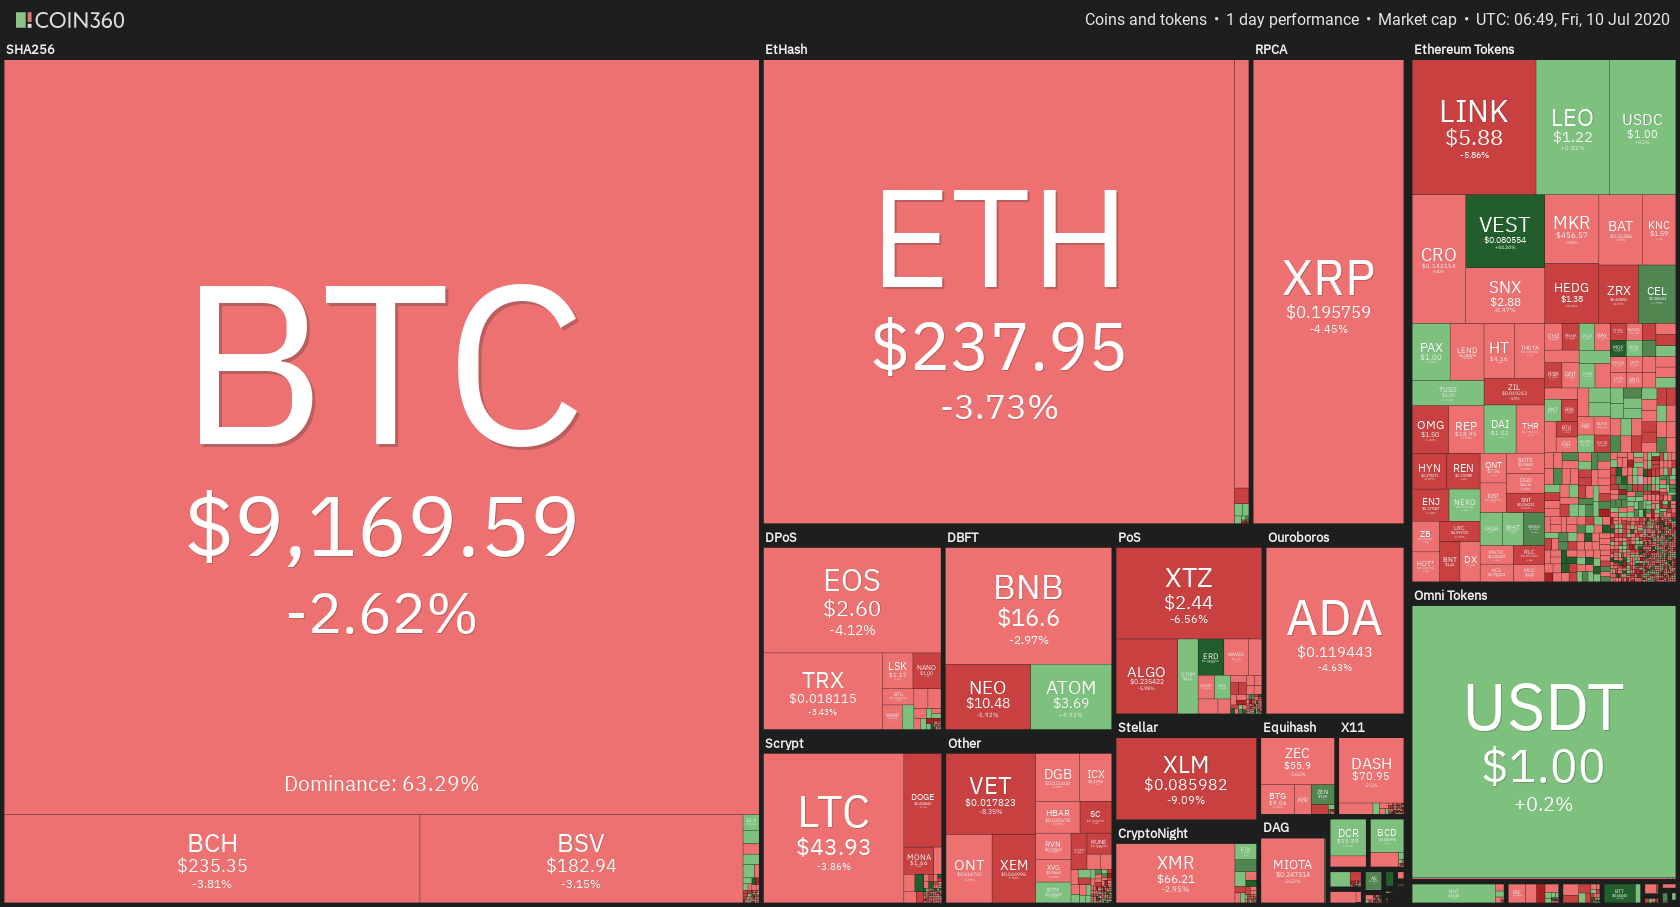
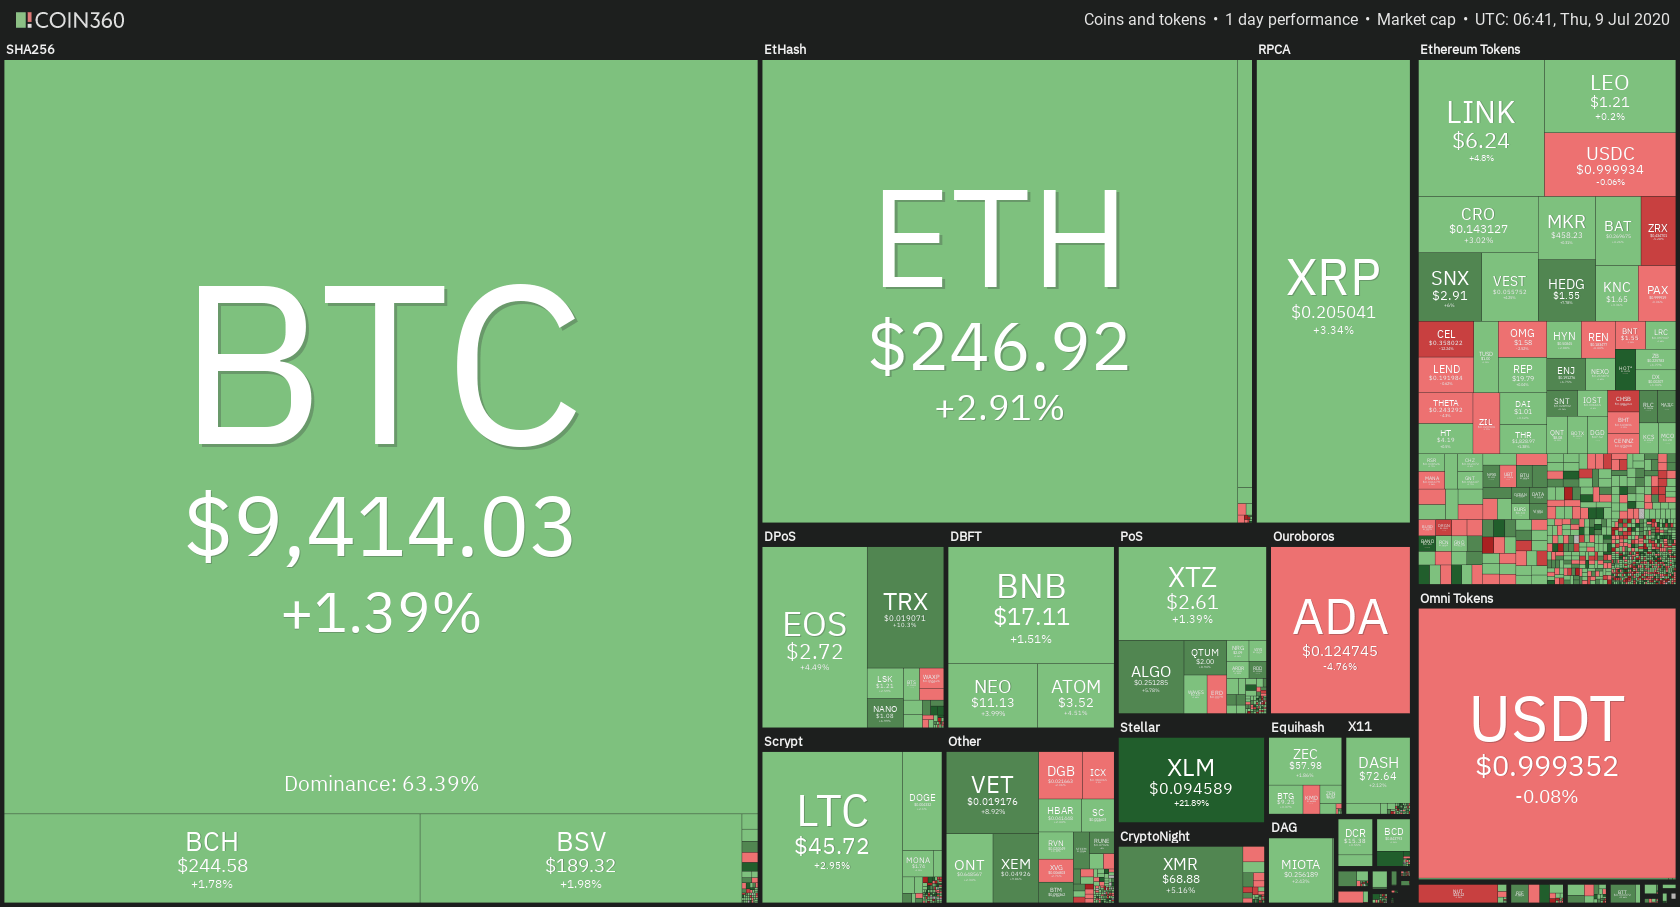
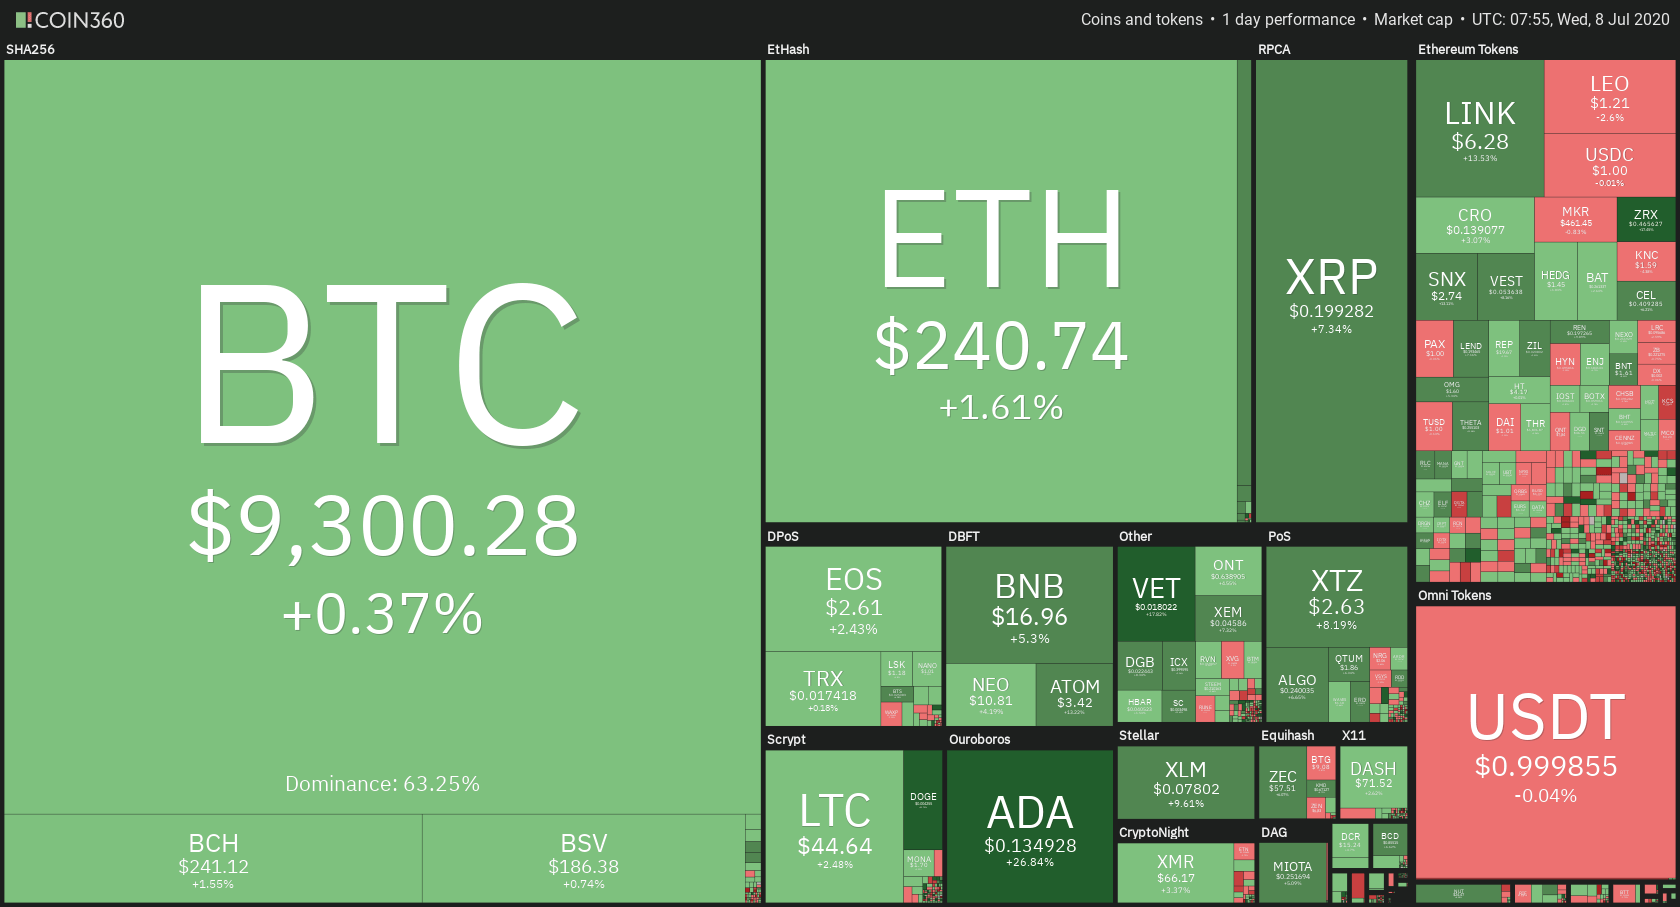
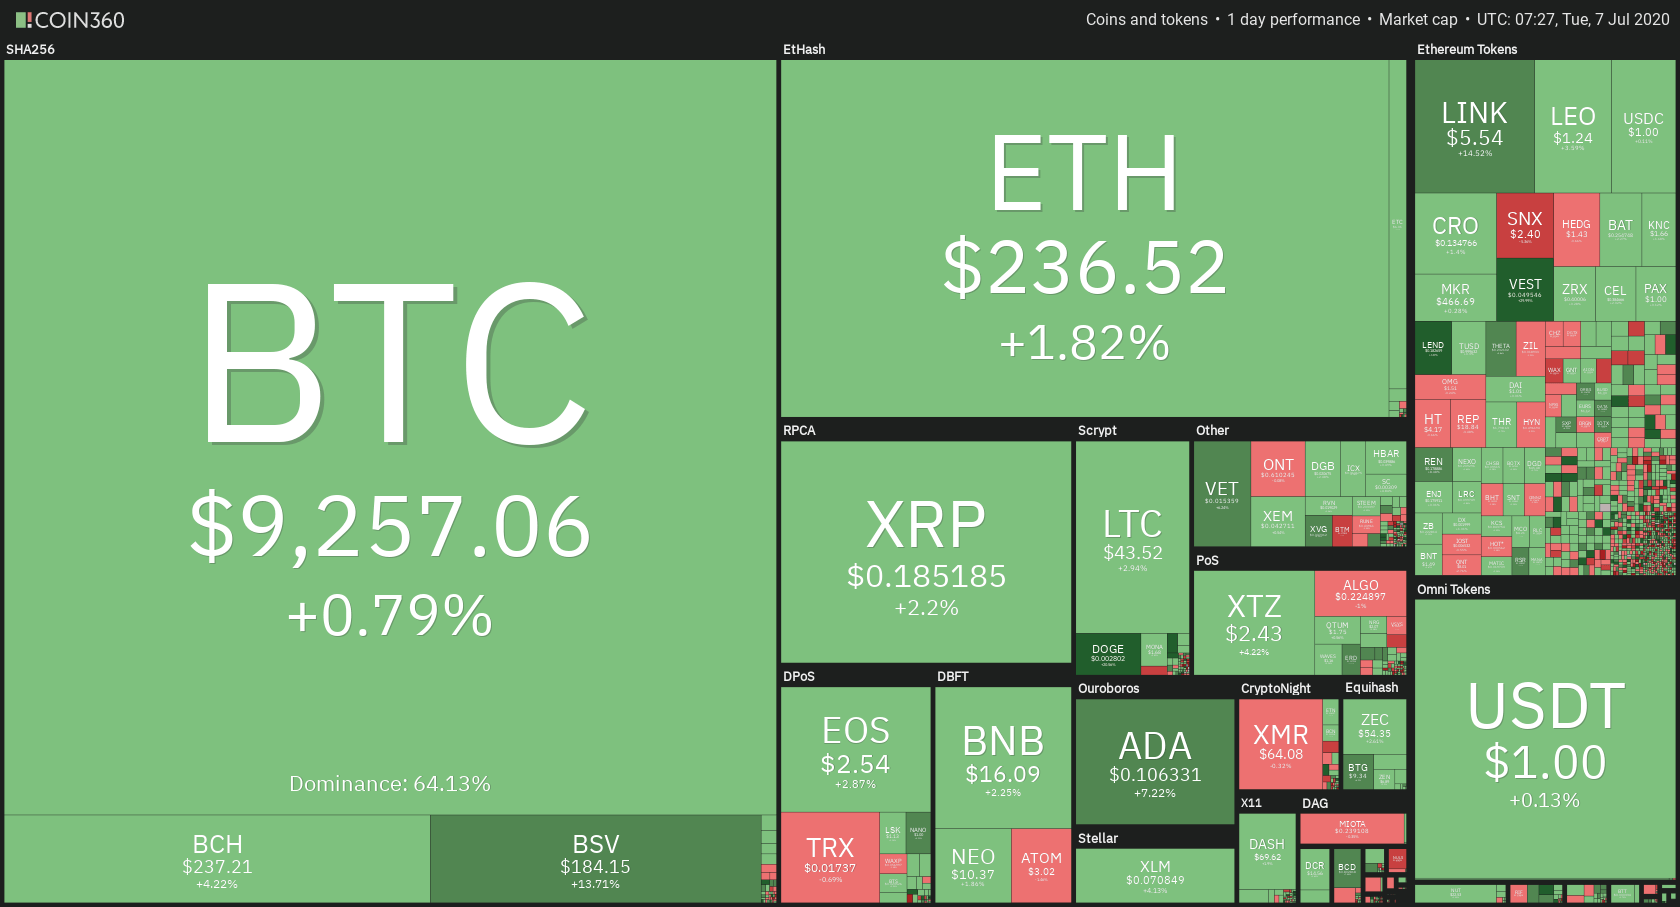
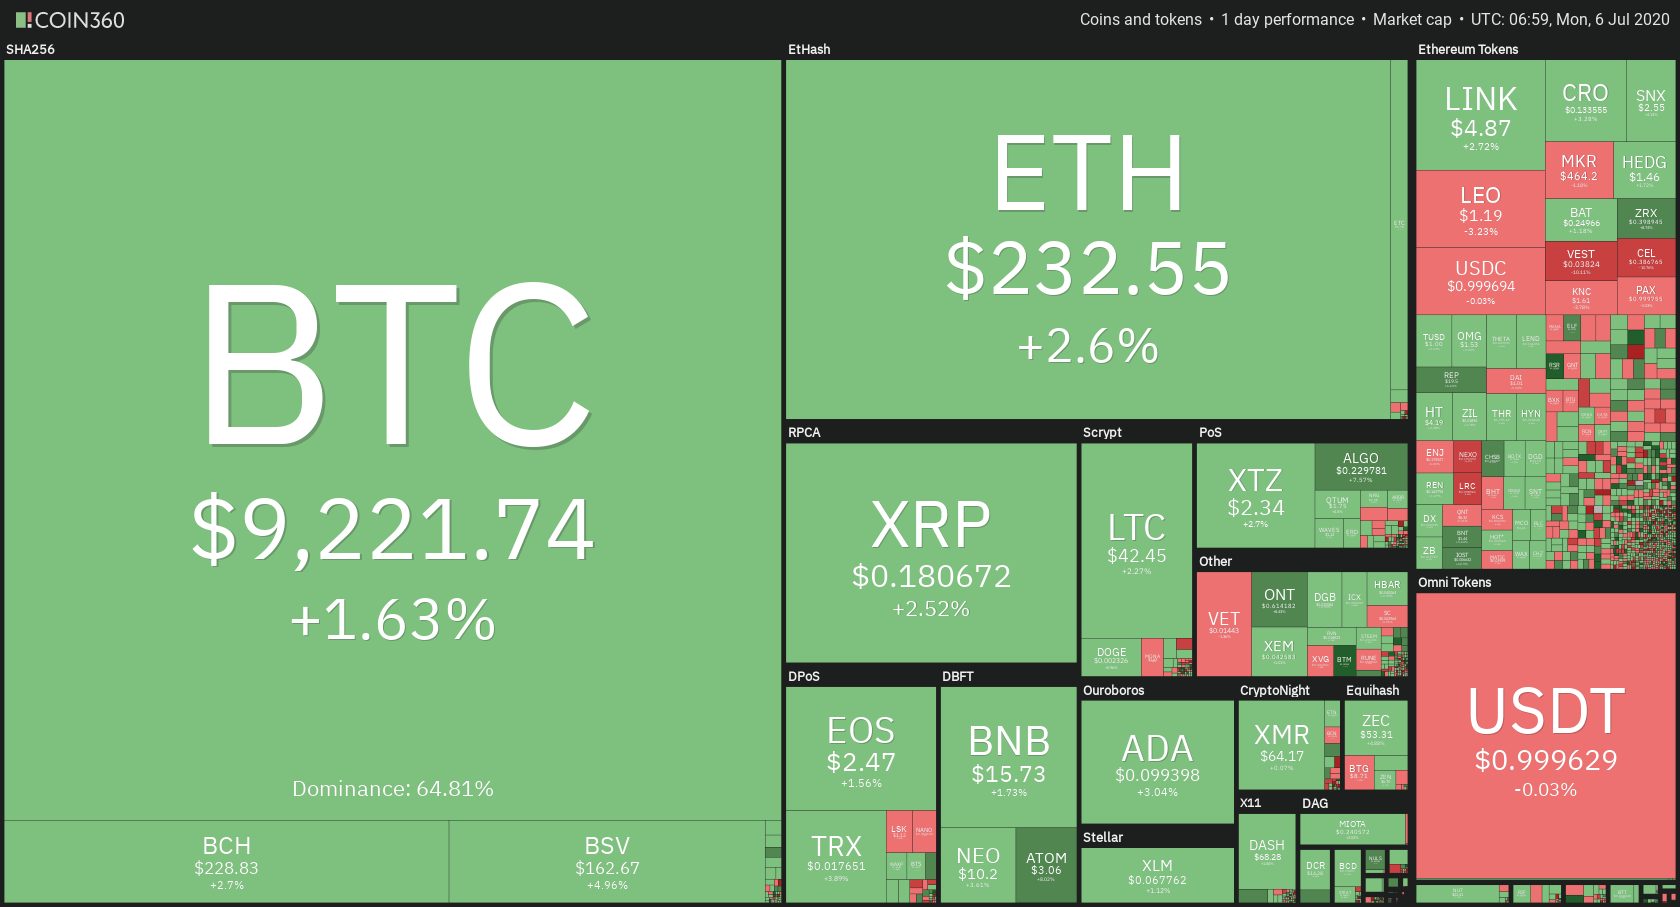
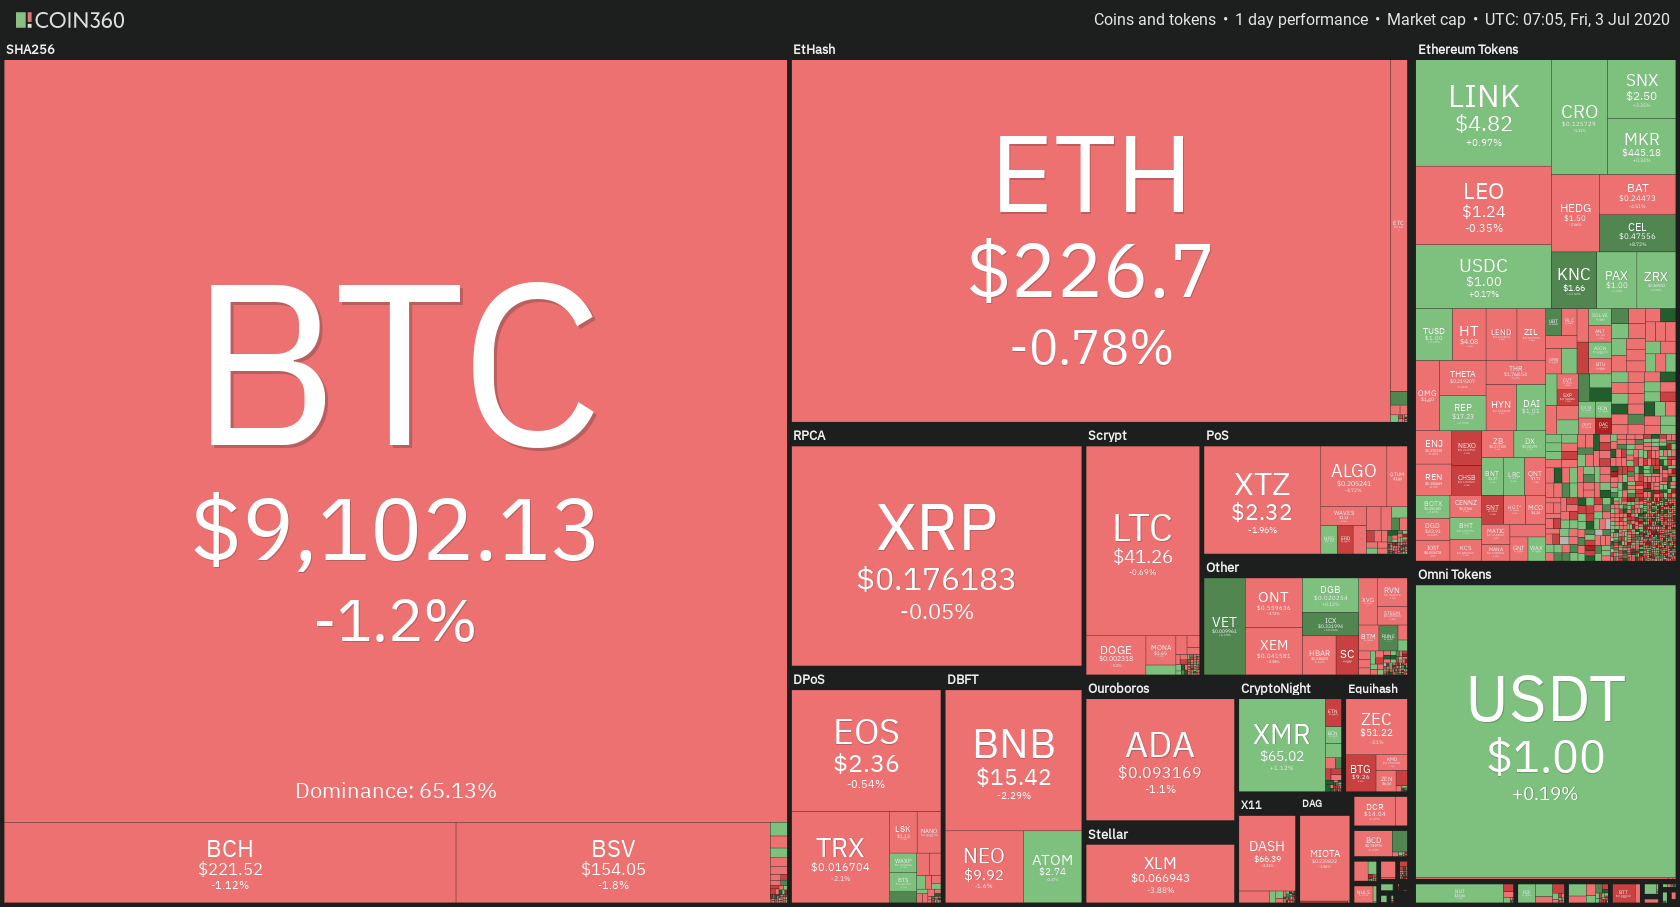
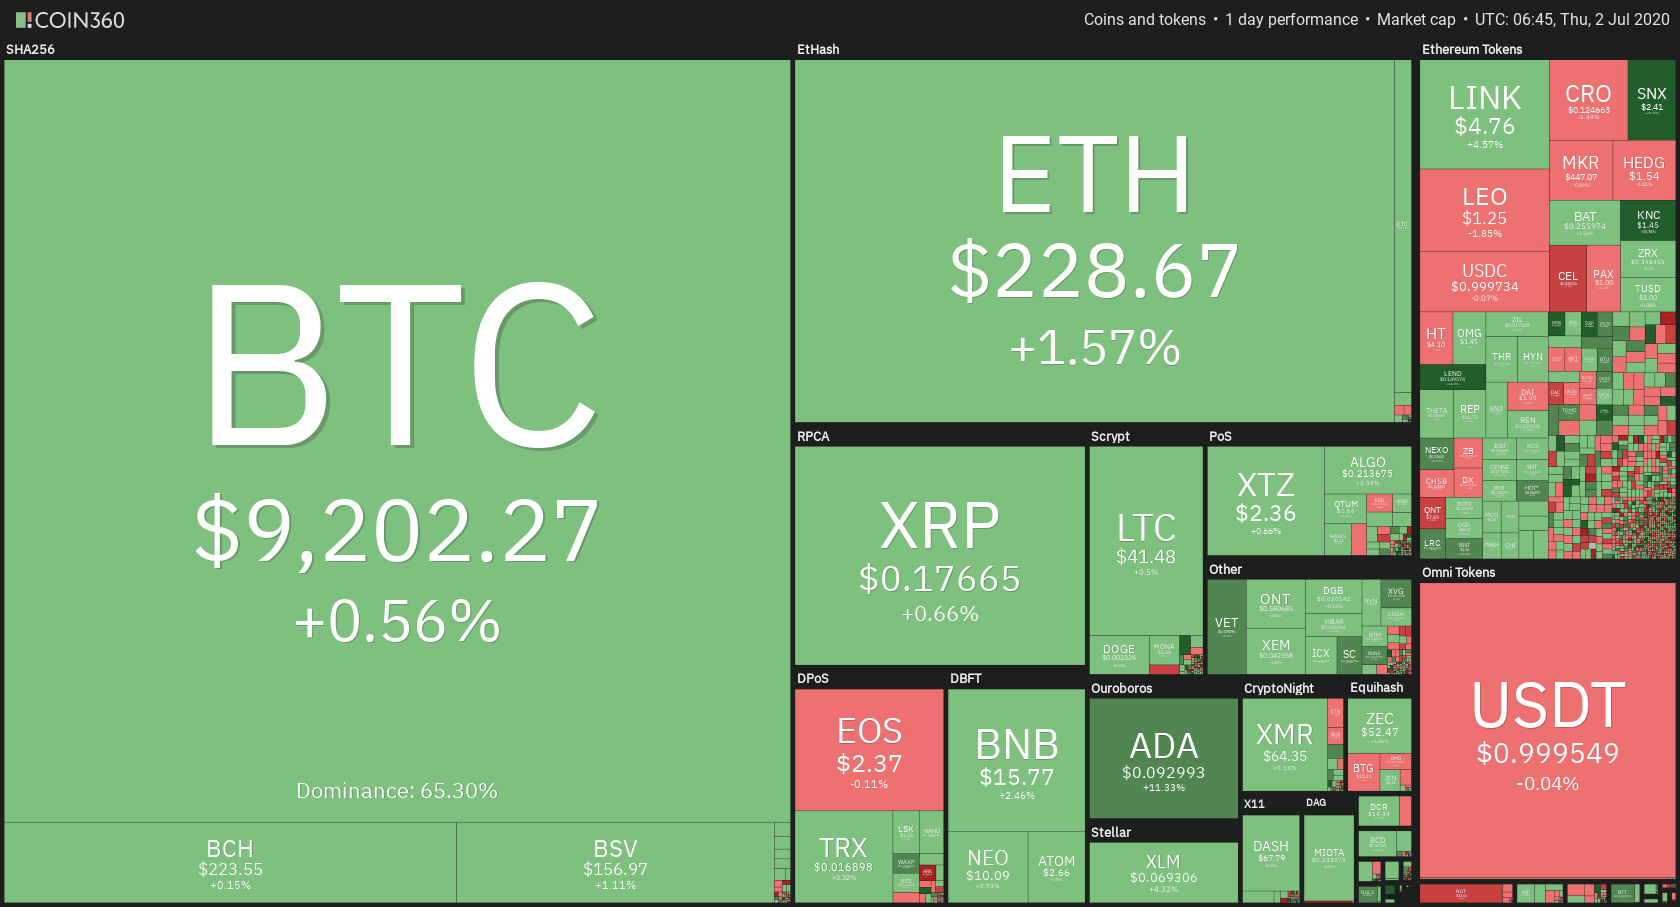
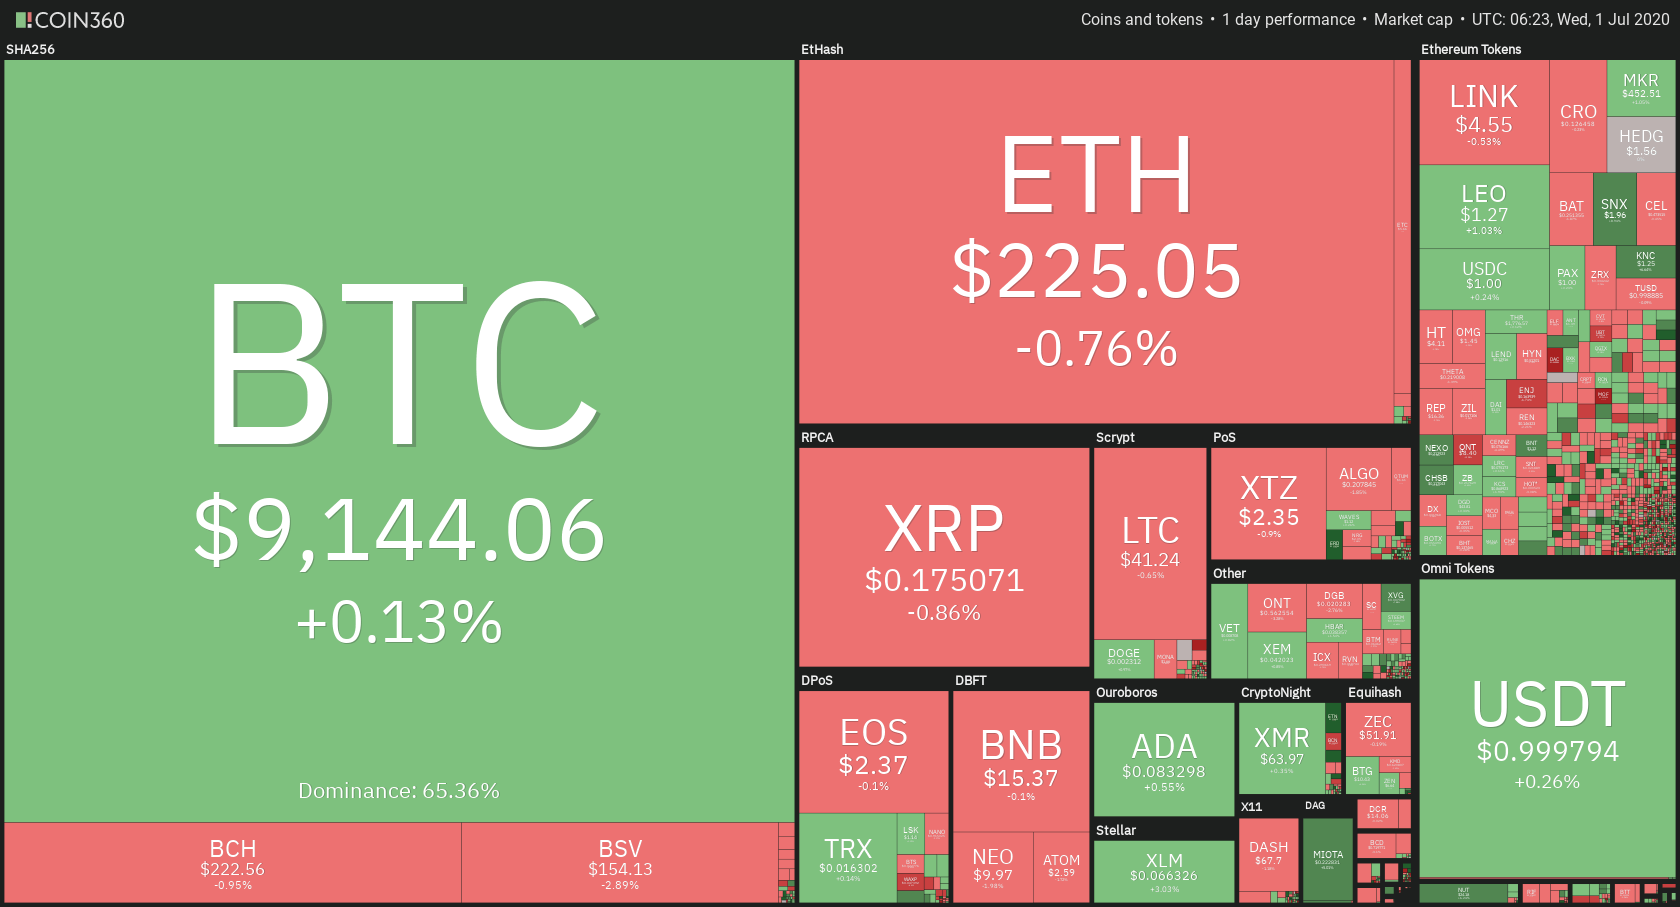
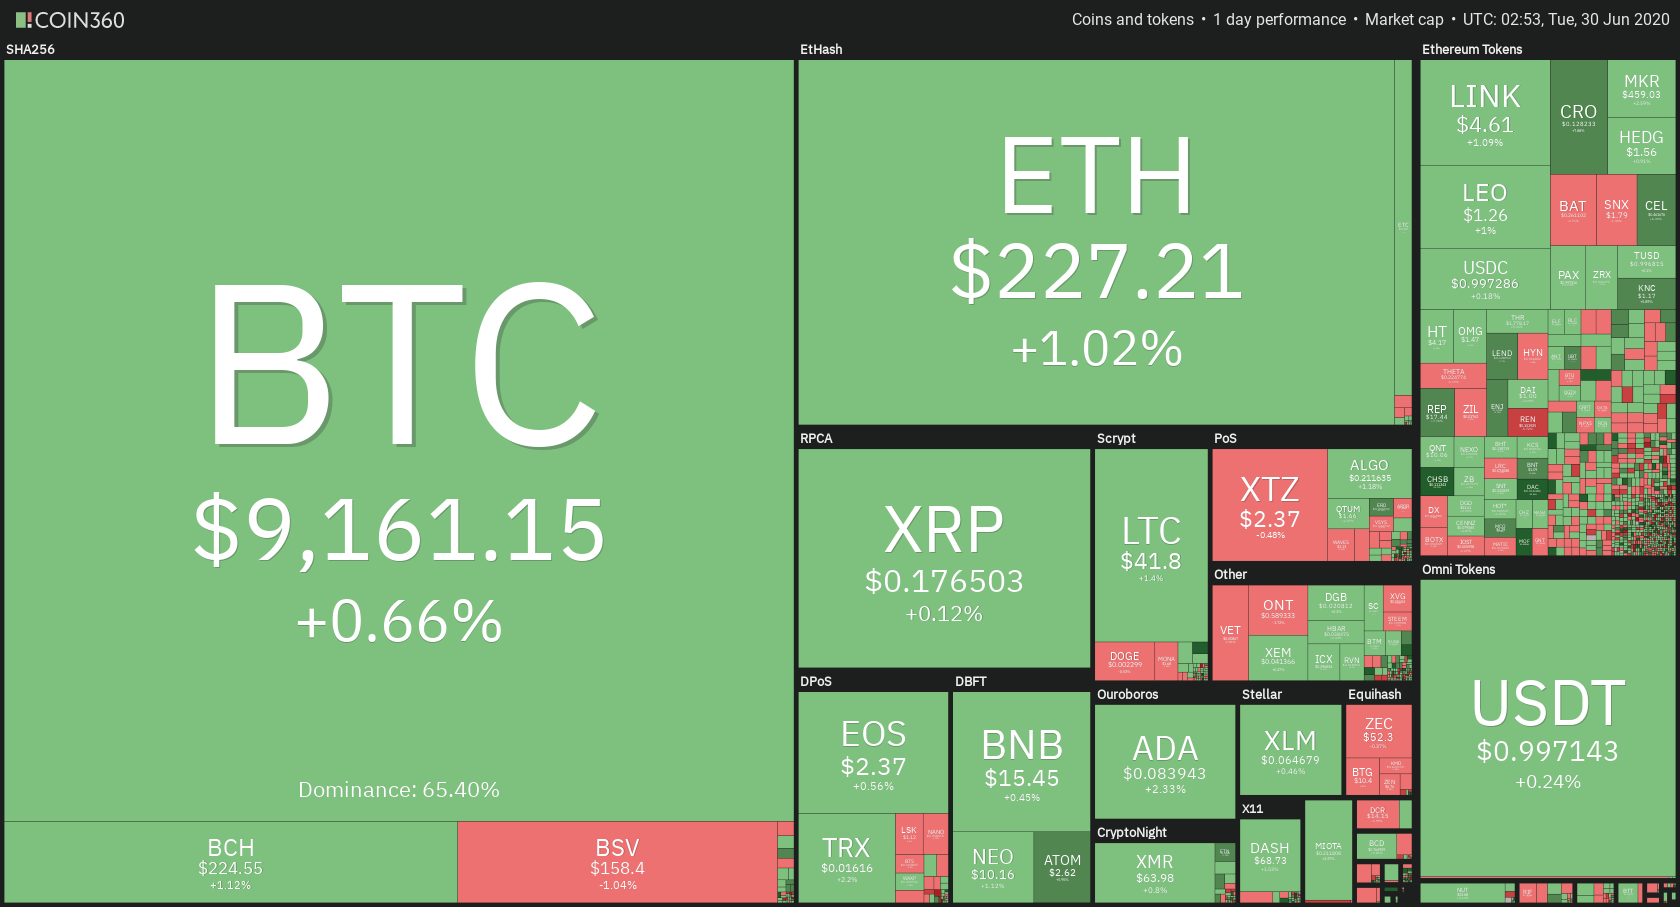
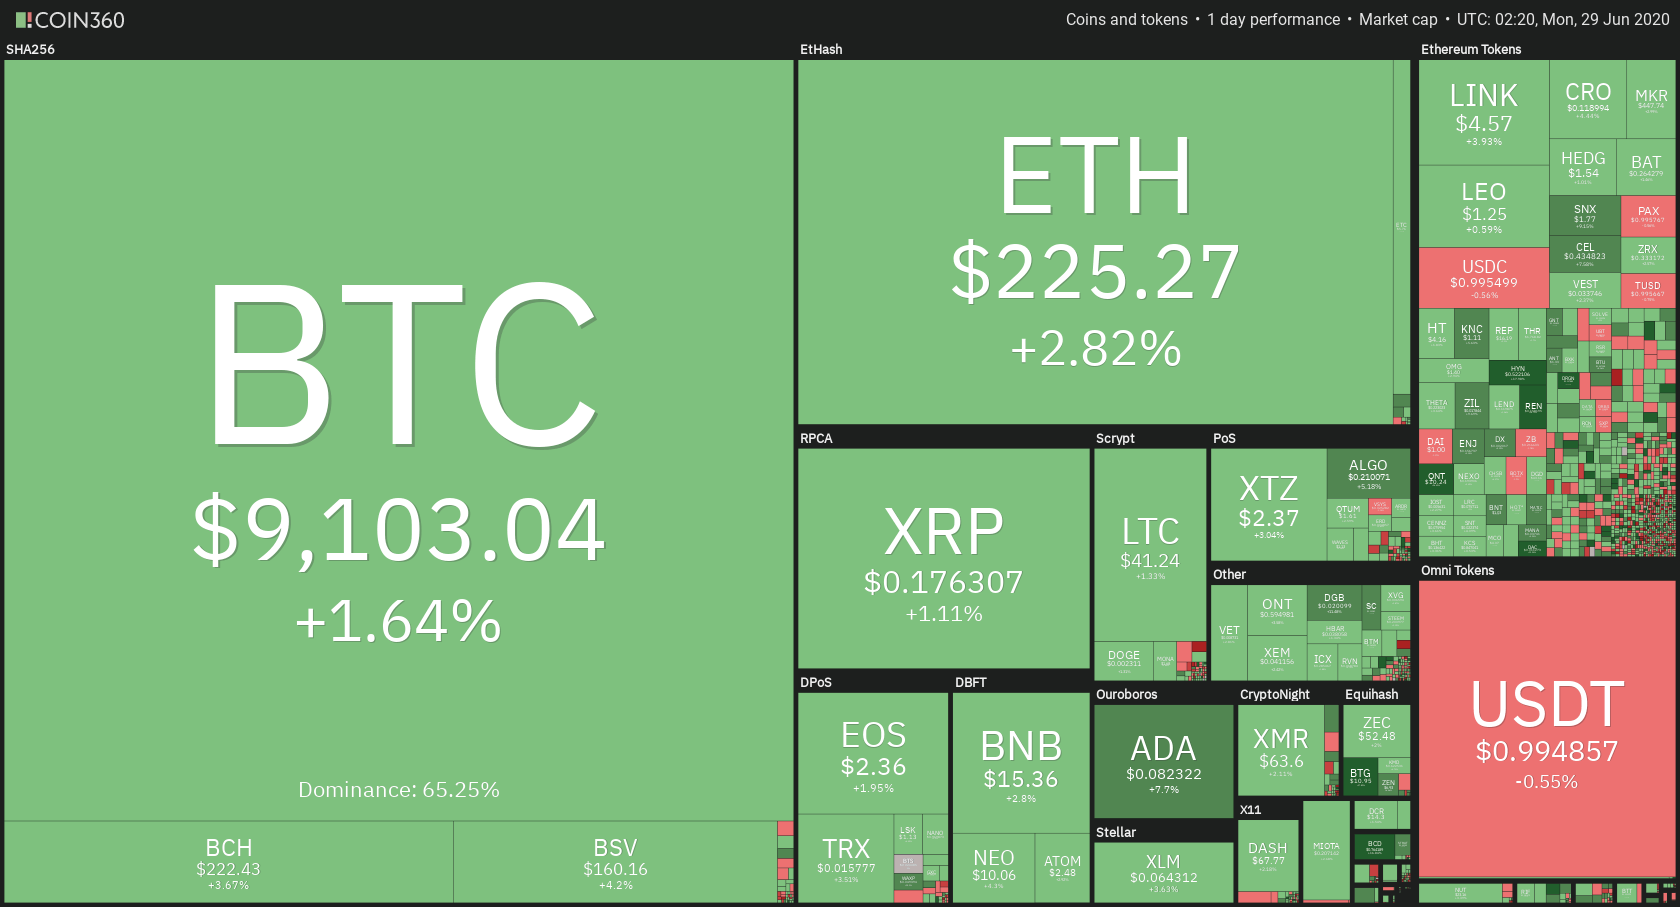
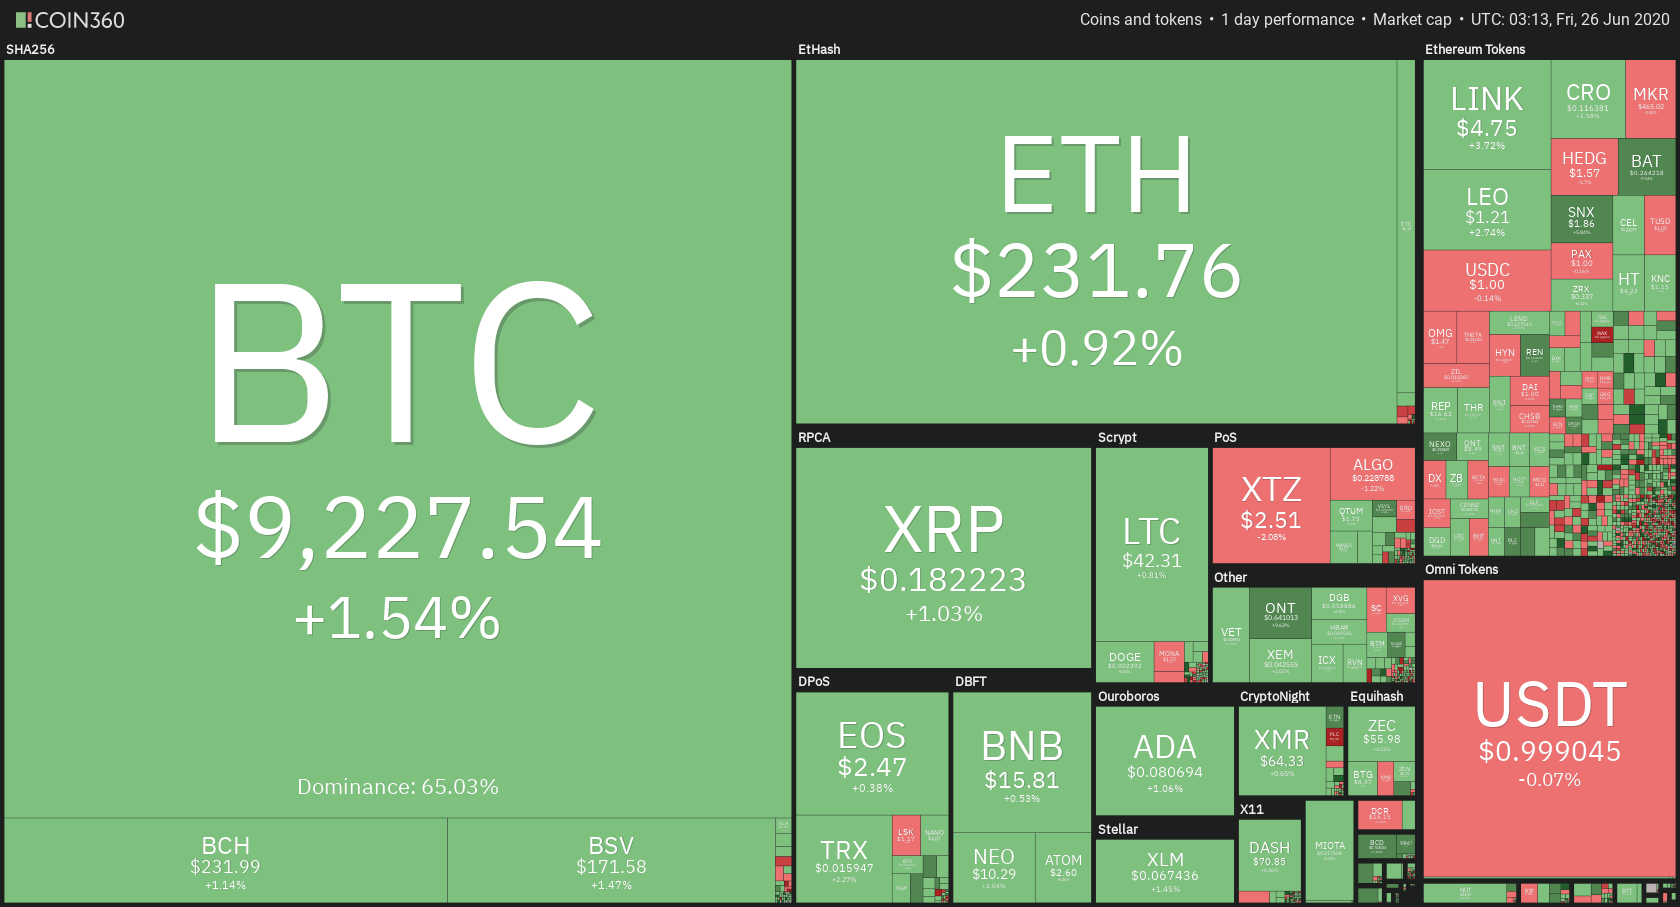
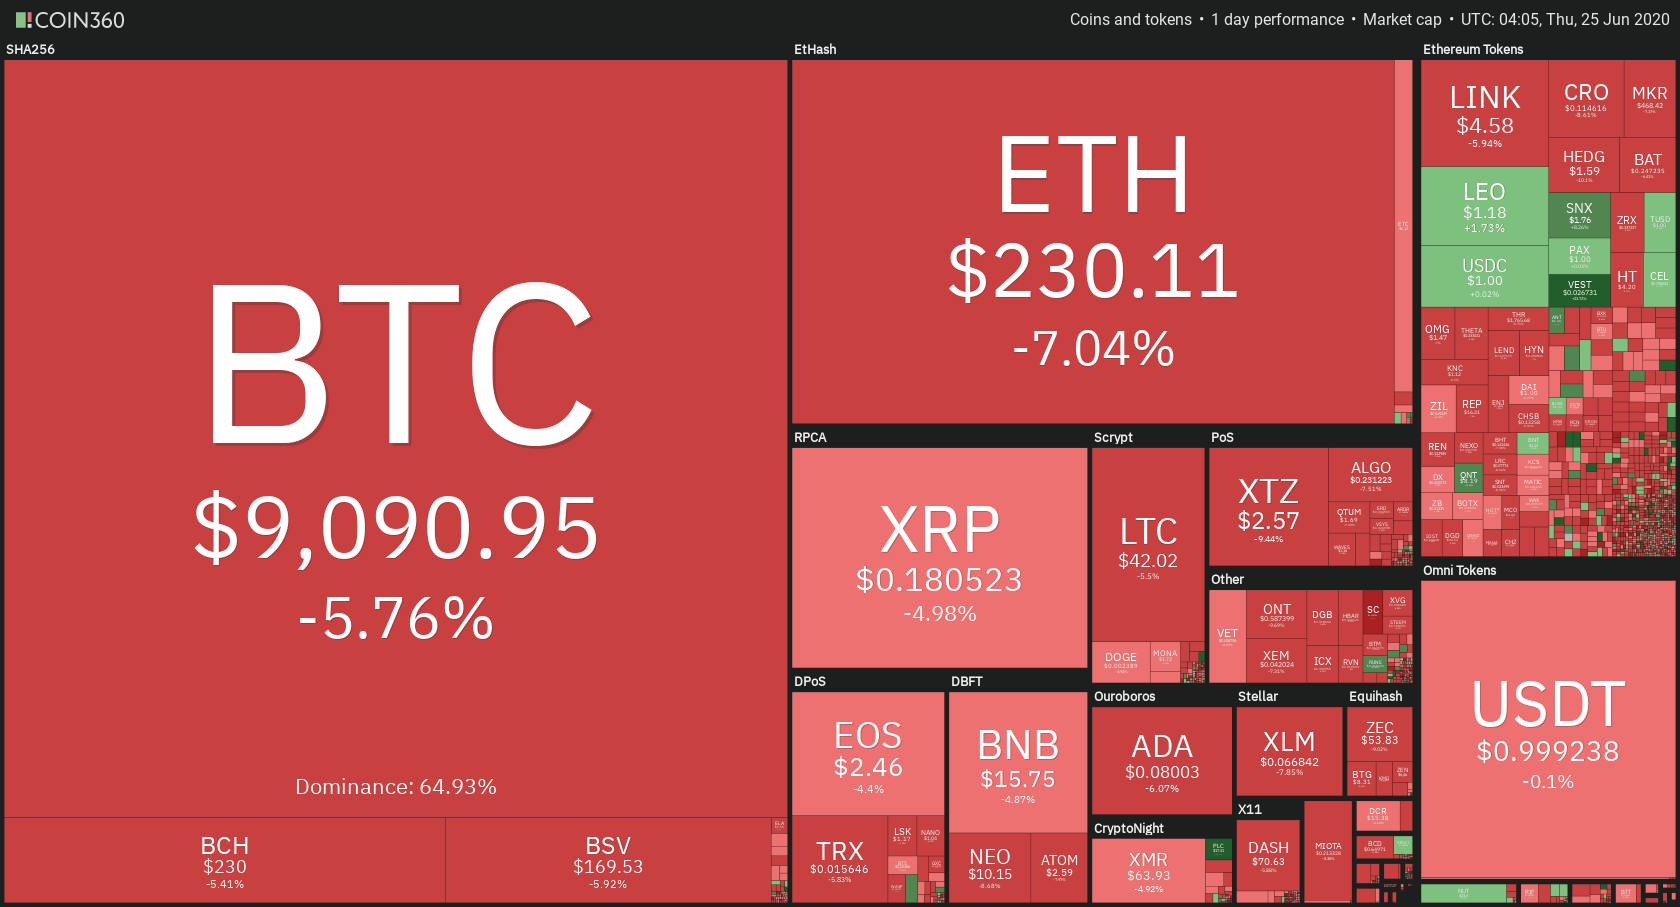
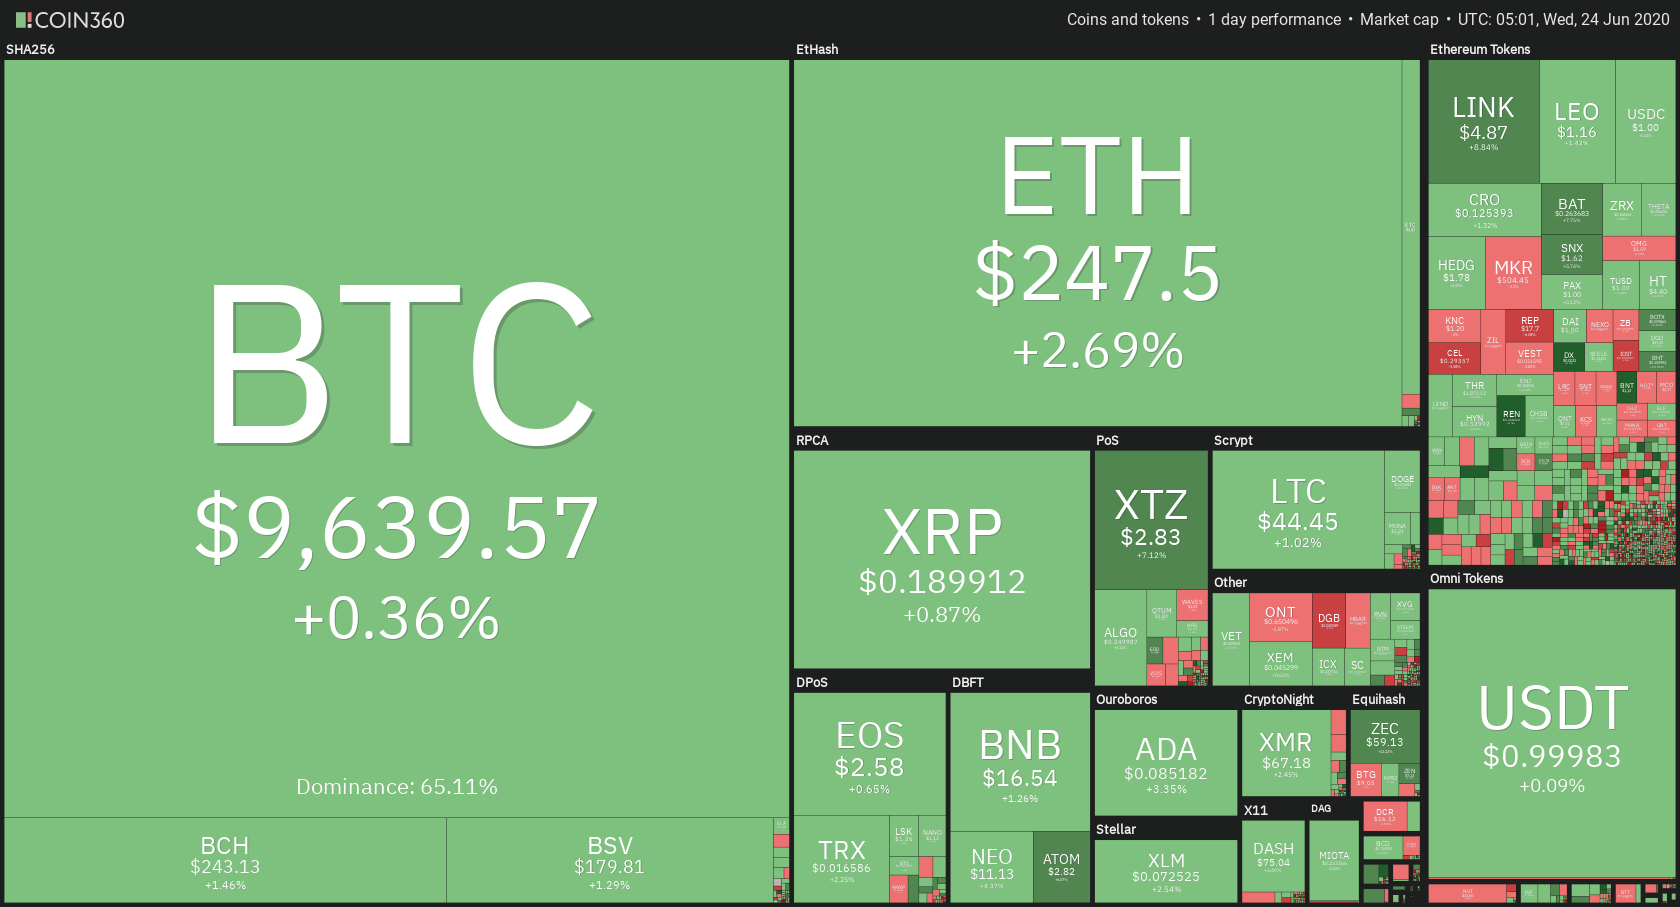
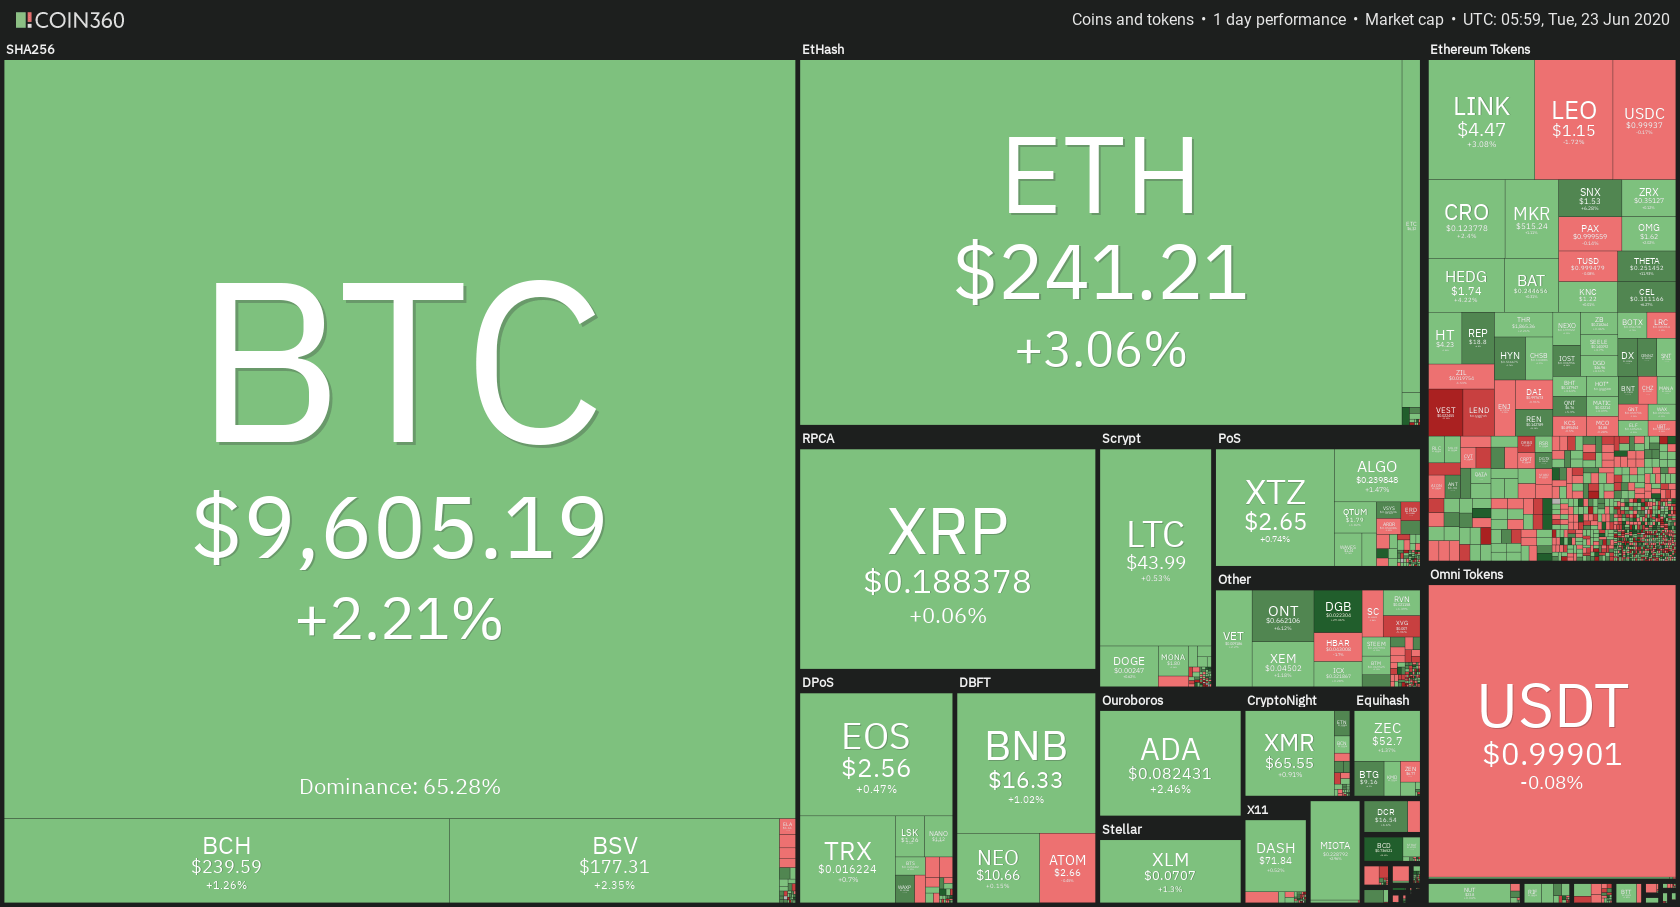
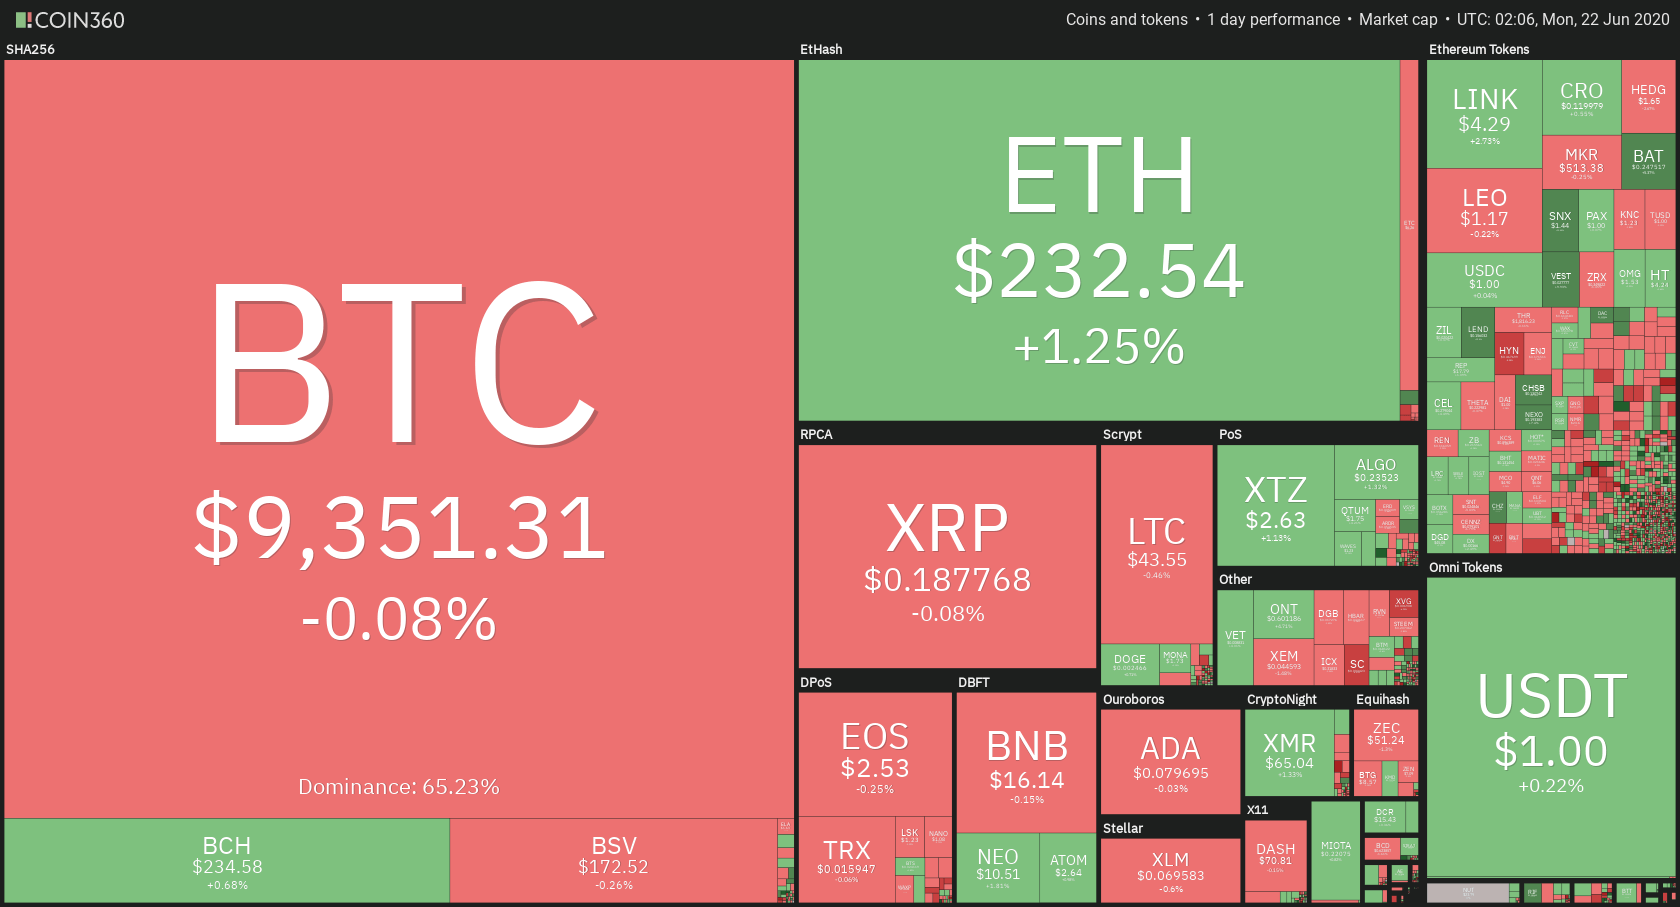
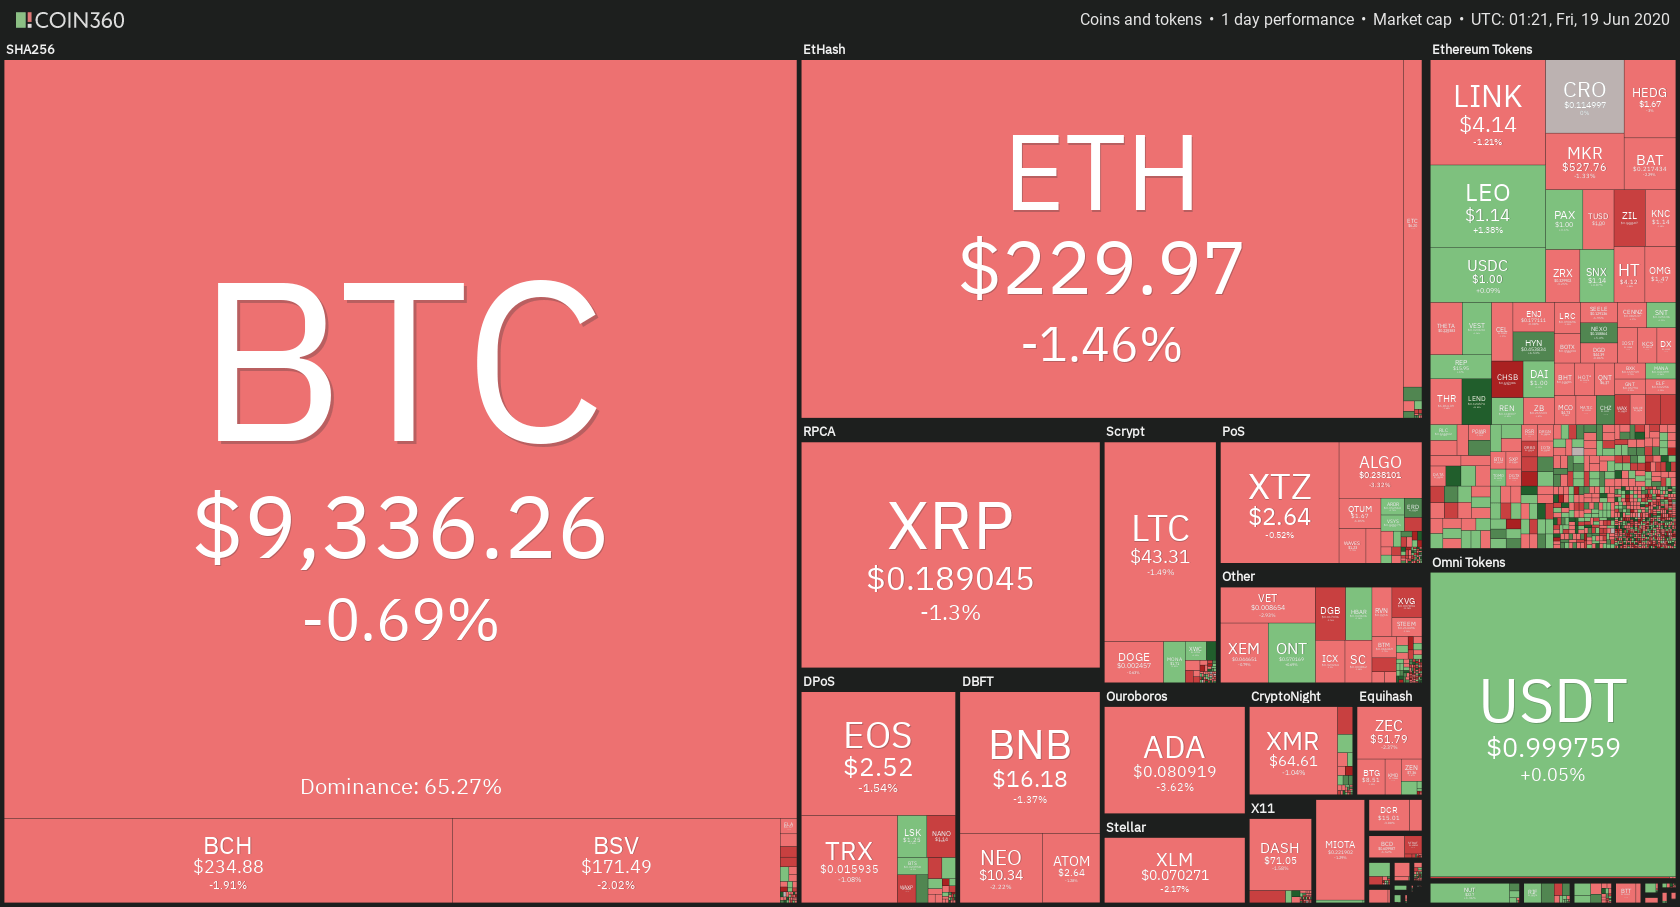
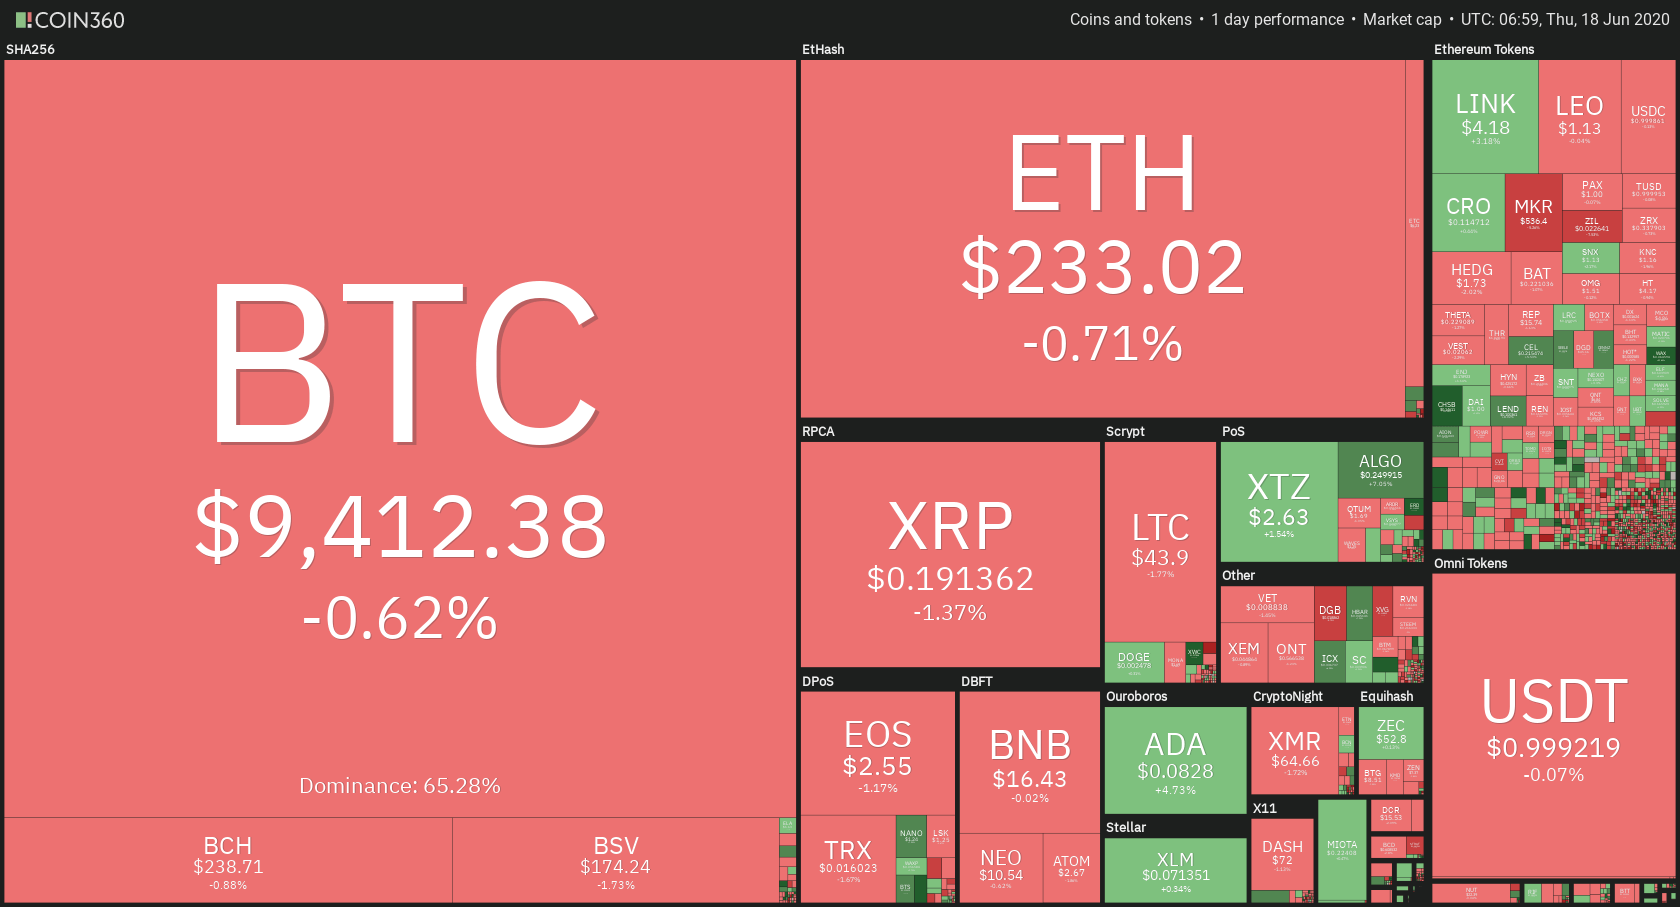
Daily Crypto Sector Heat Map
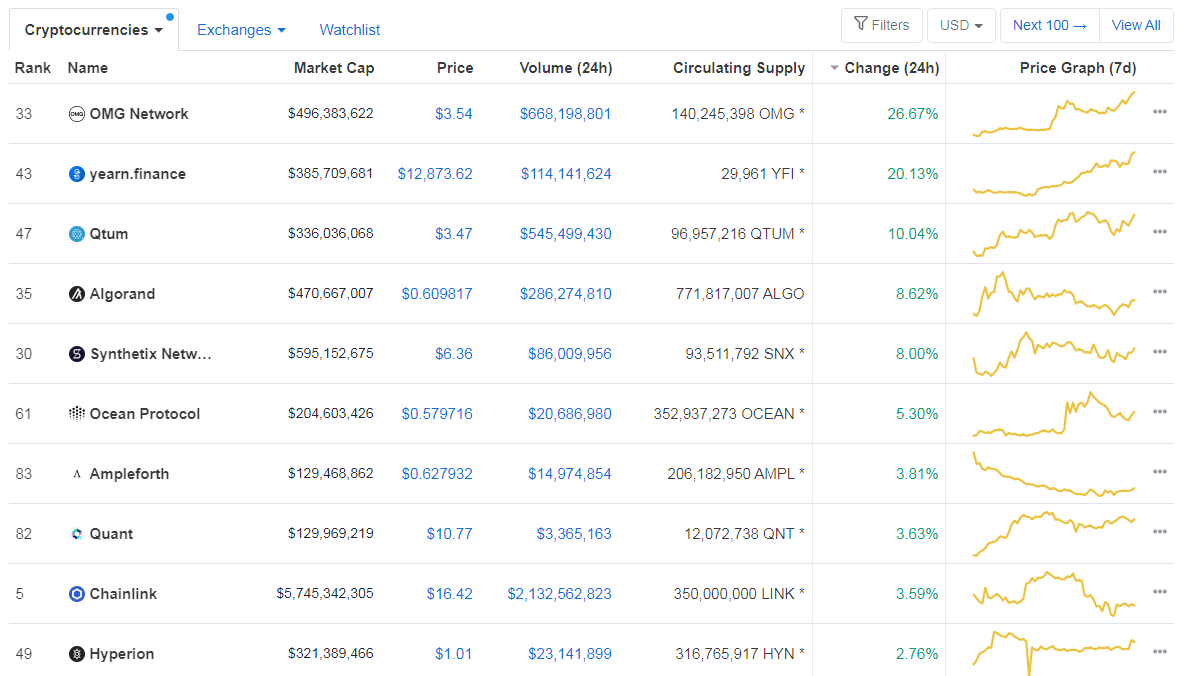
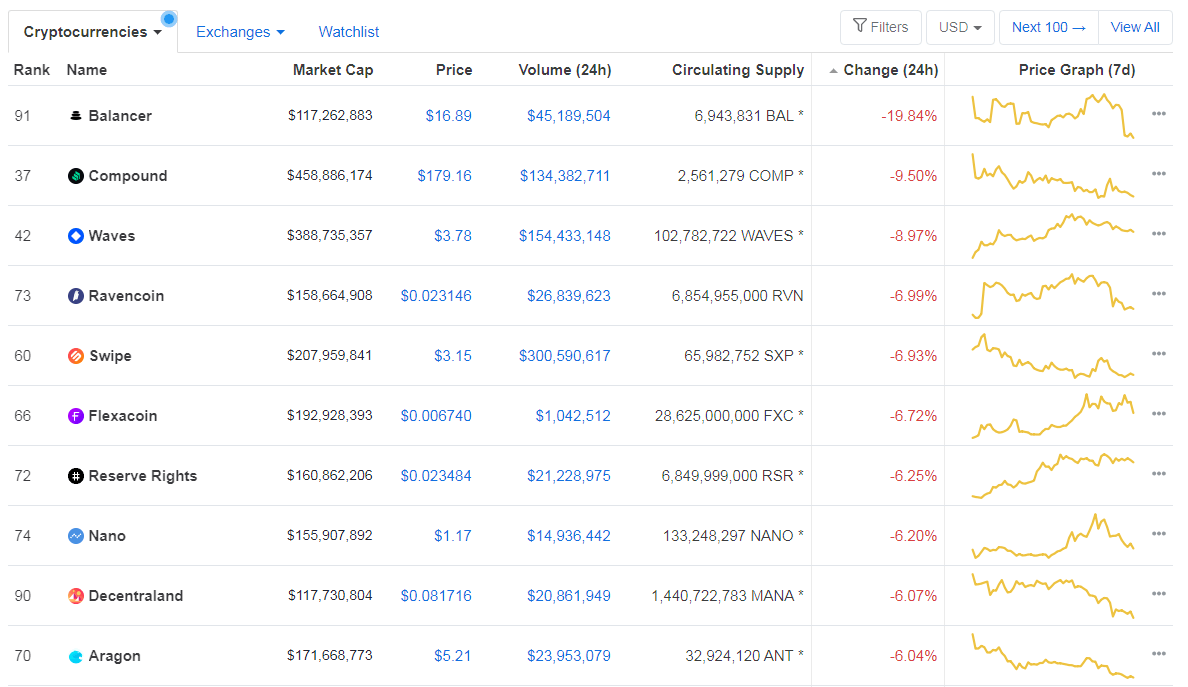
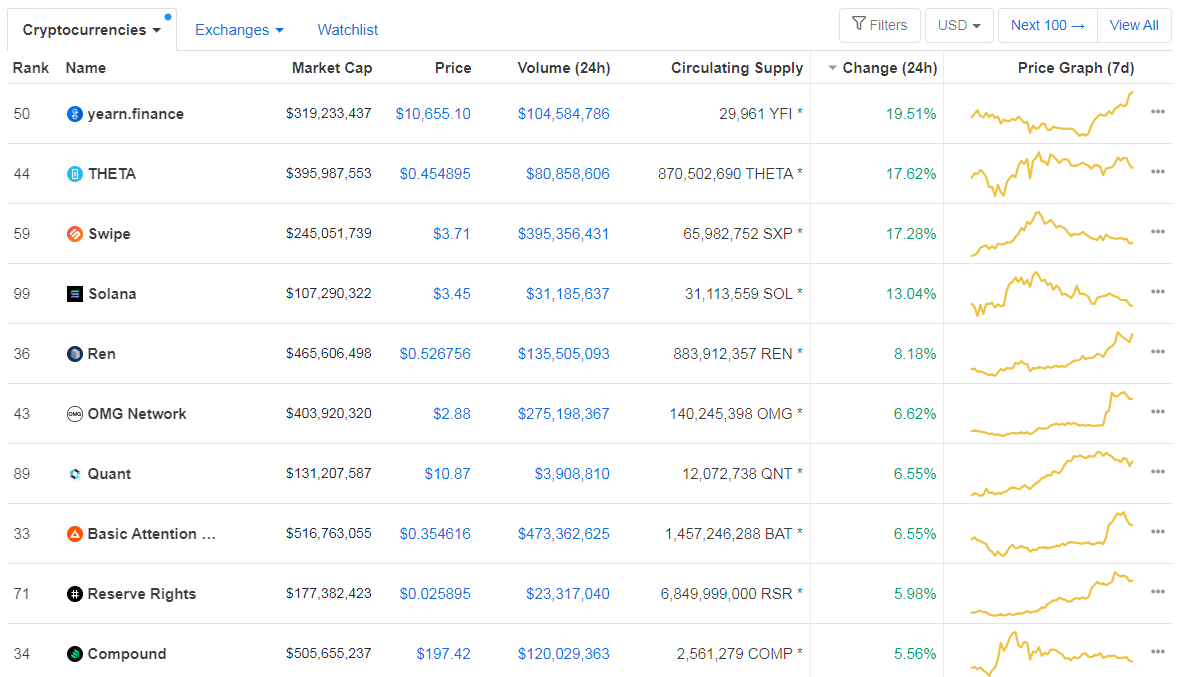
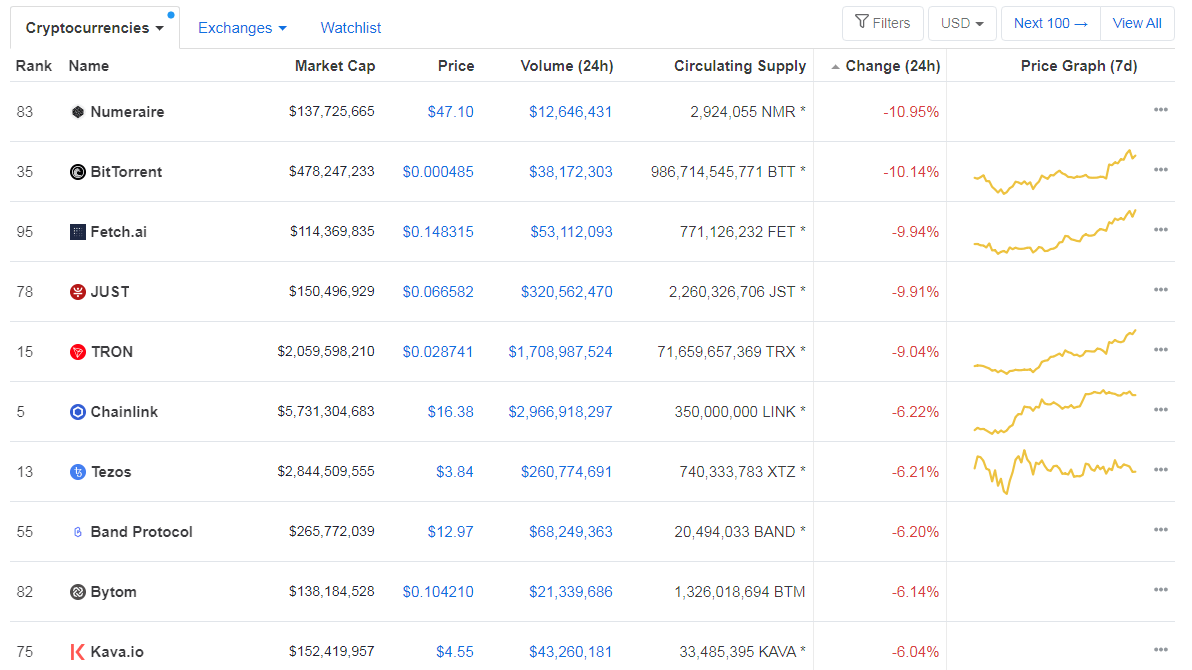
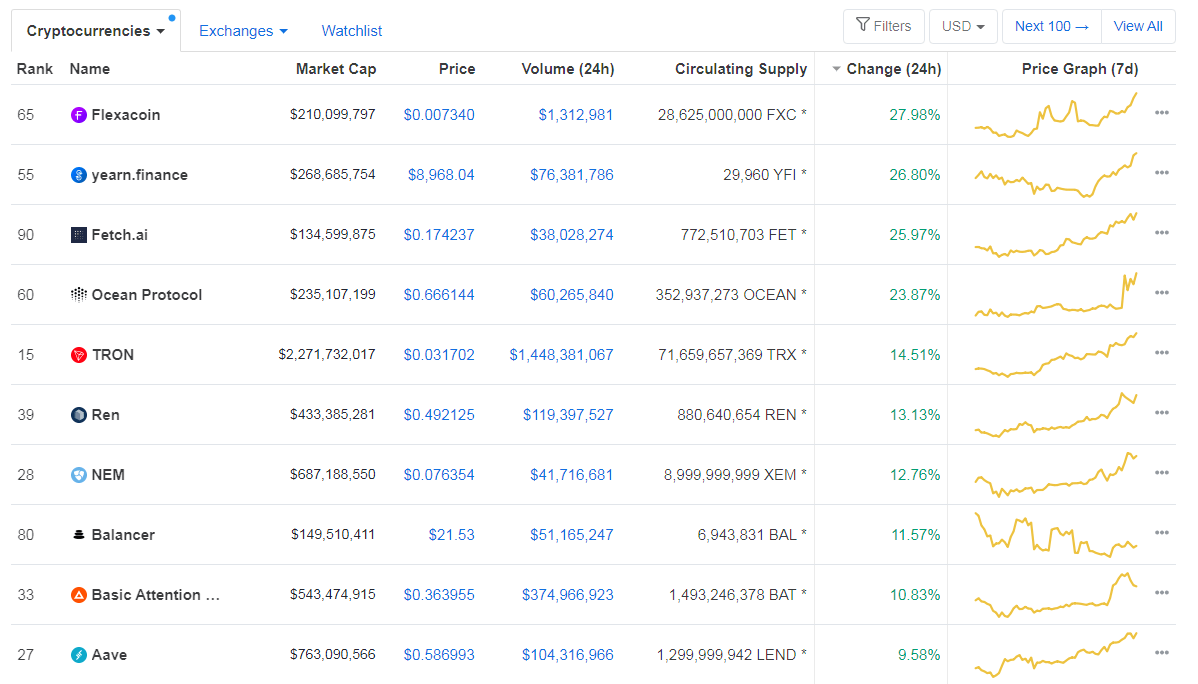
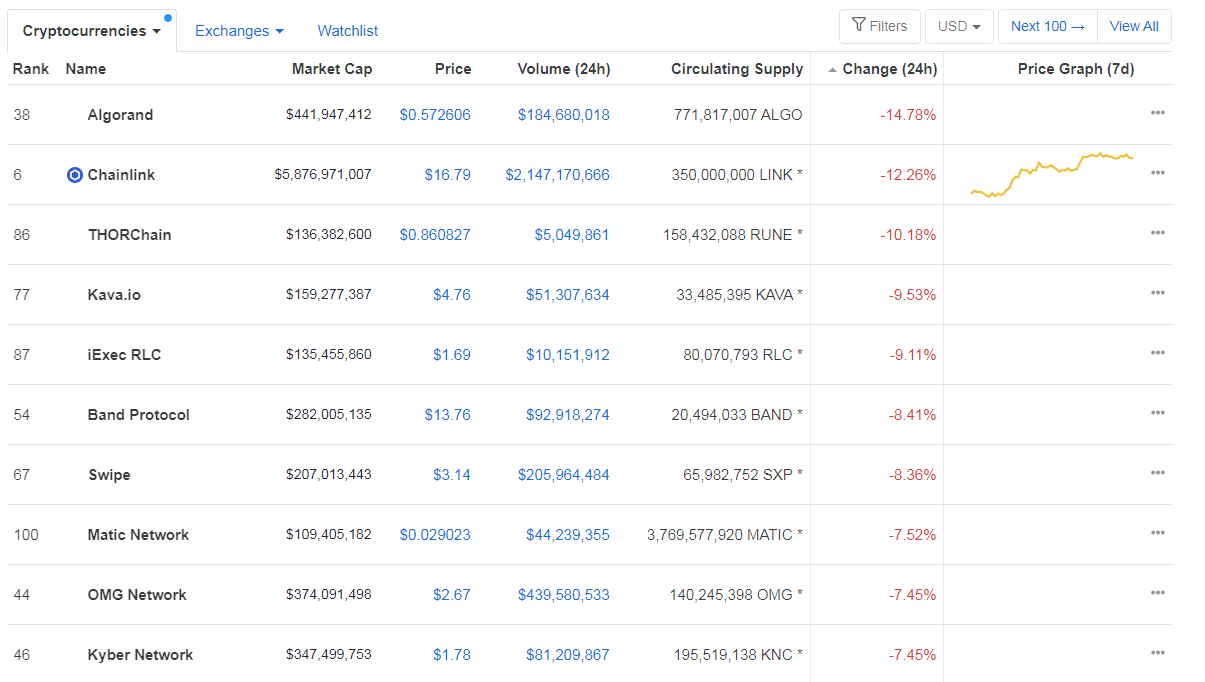
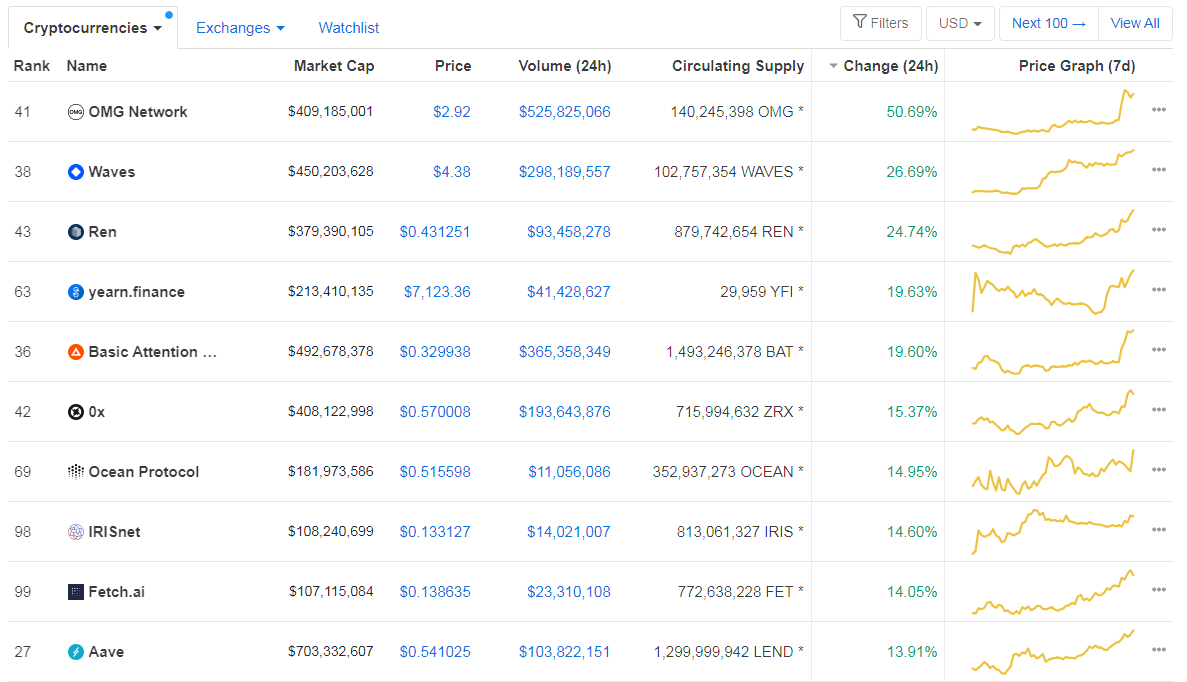
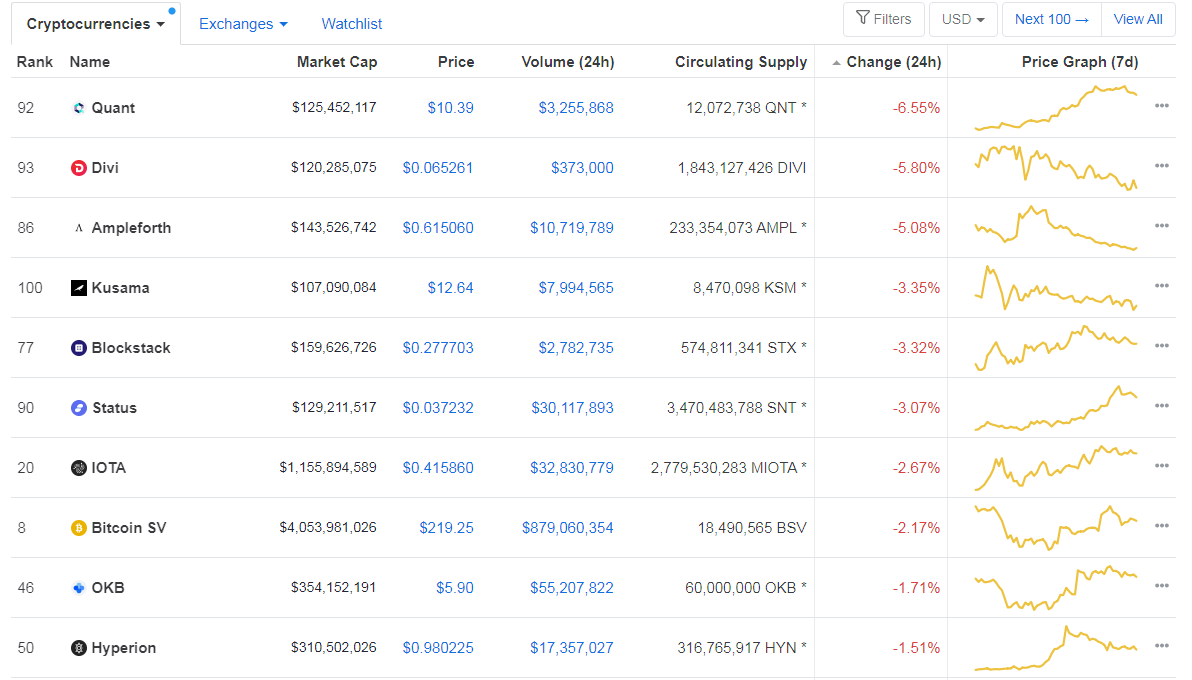
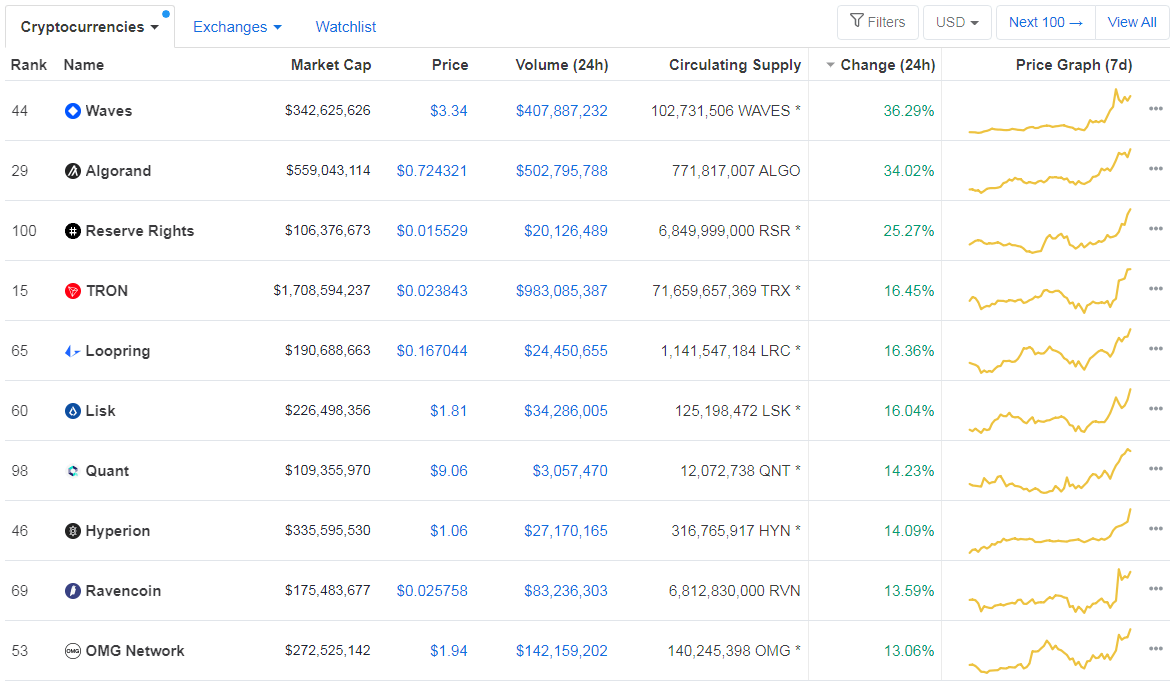
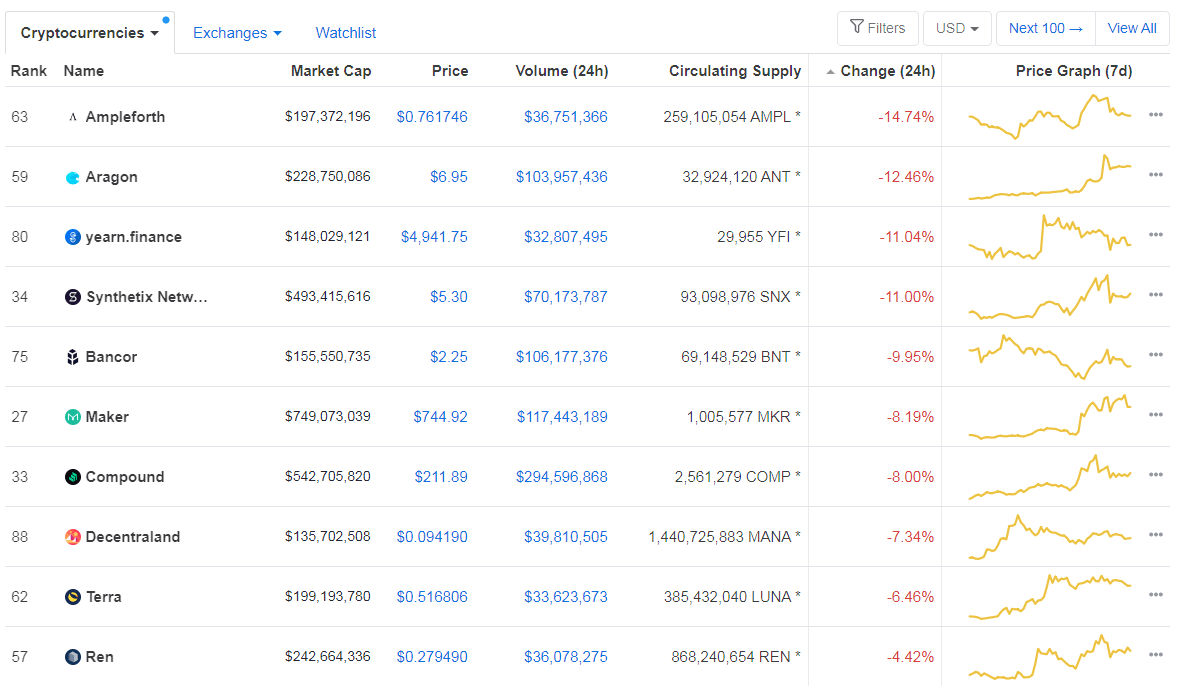
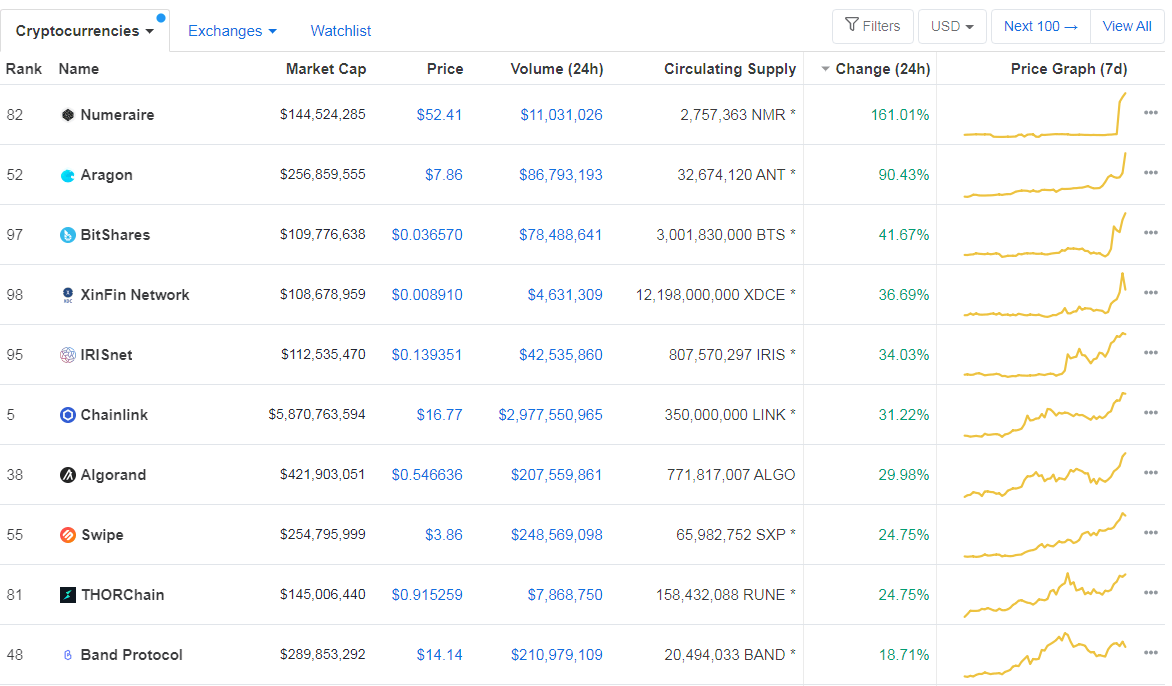
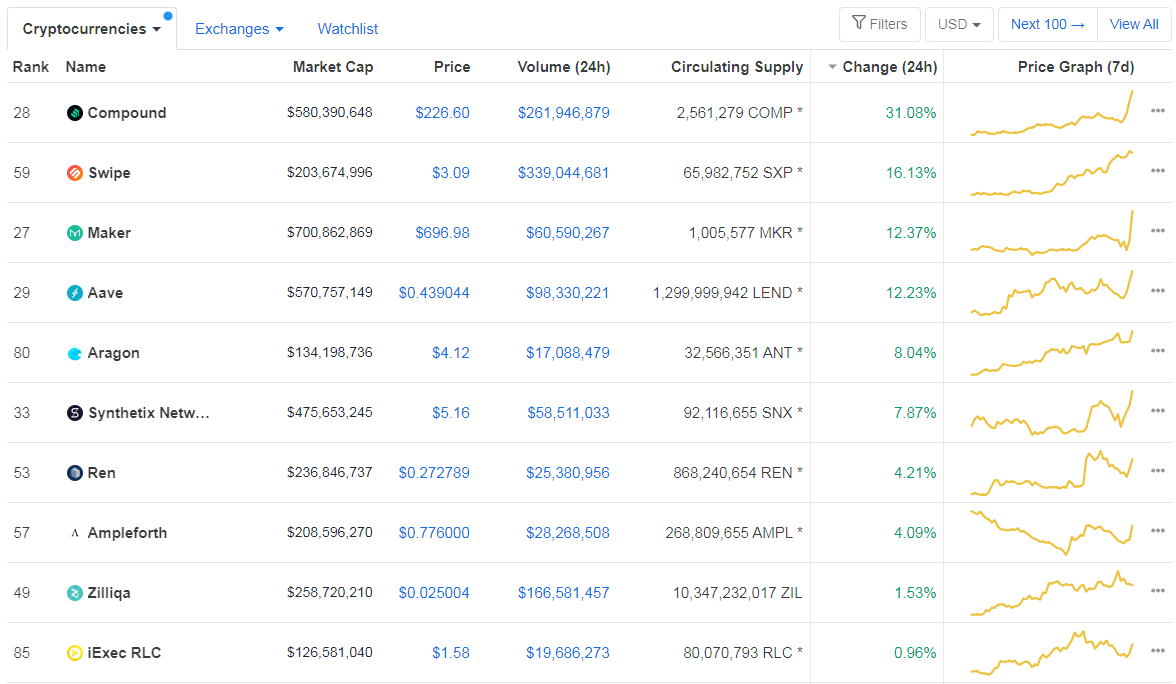
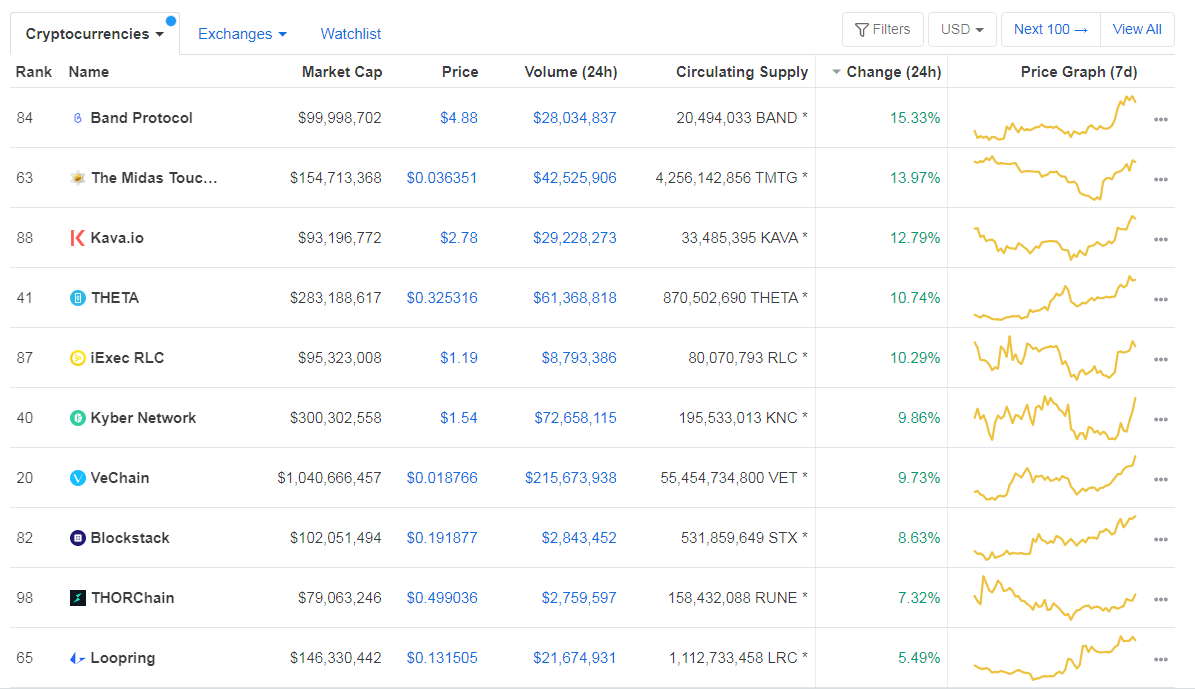
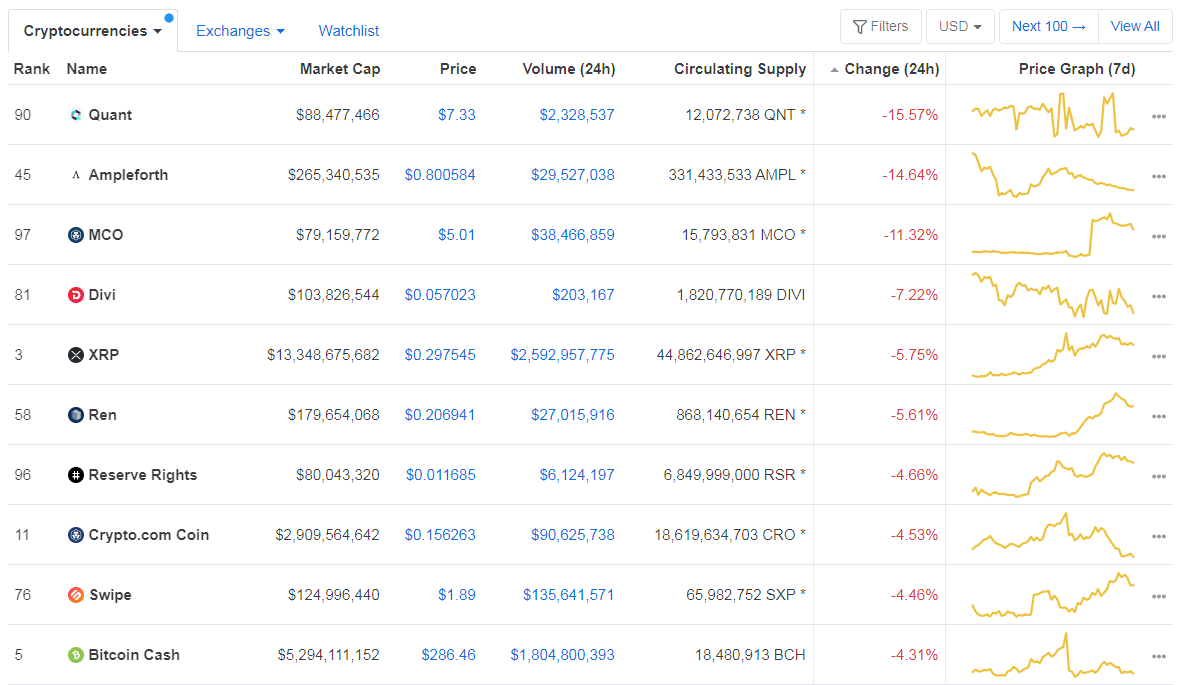
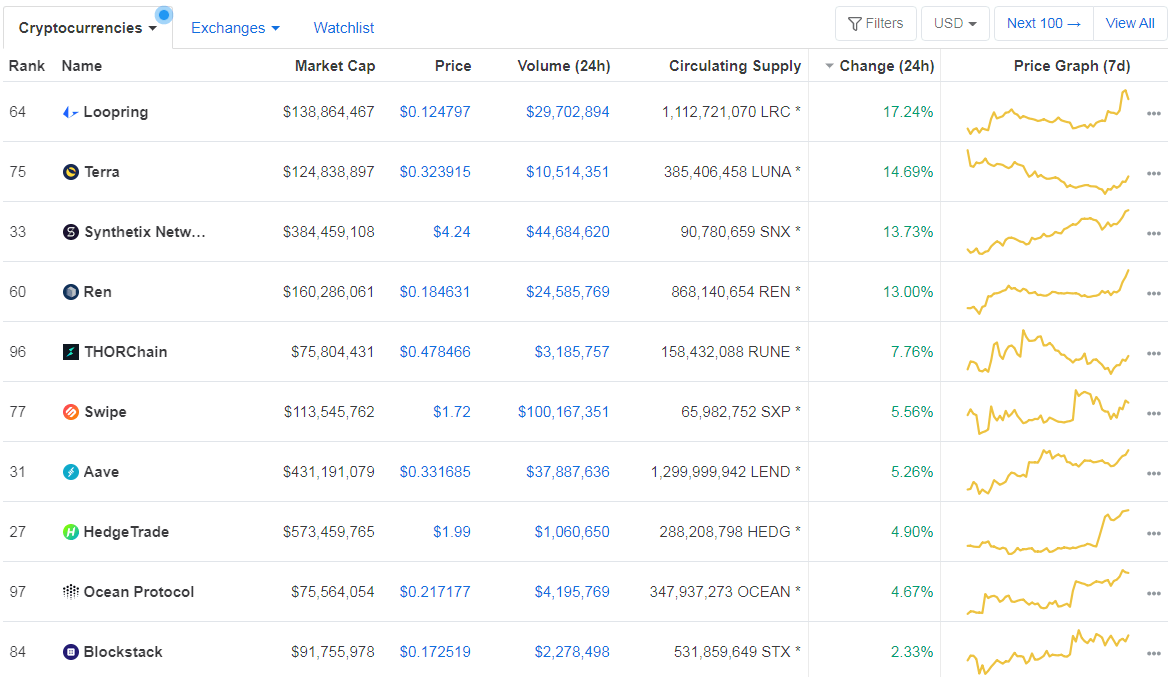
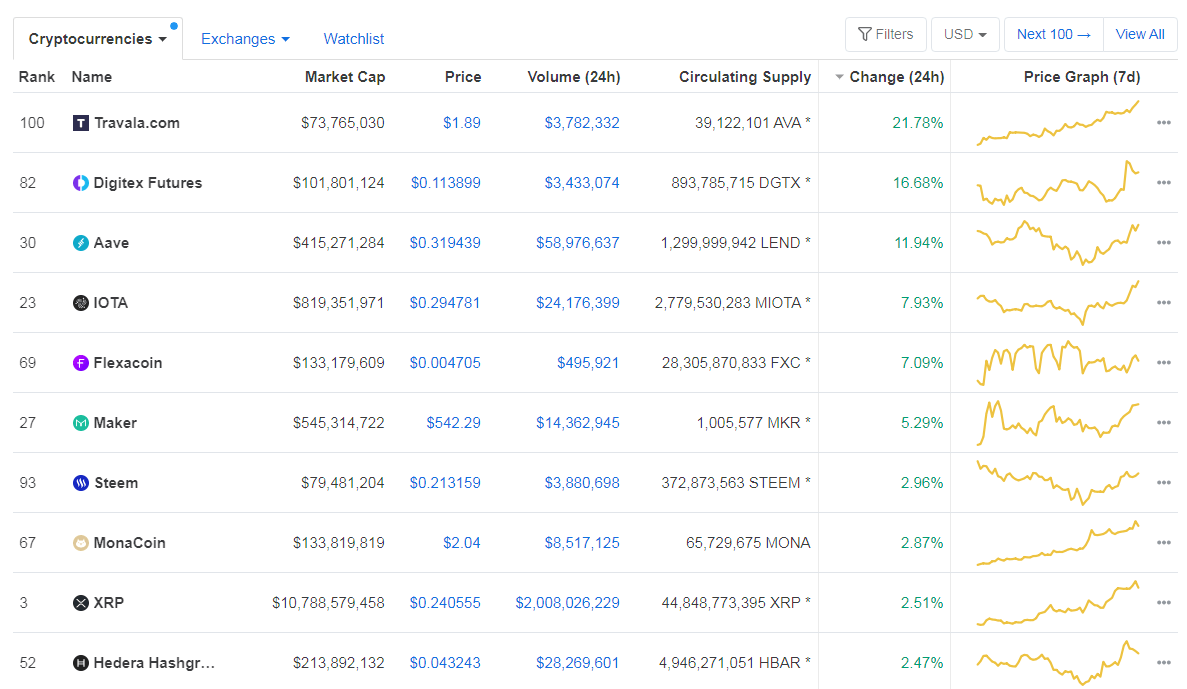
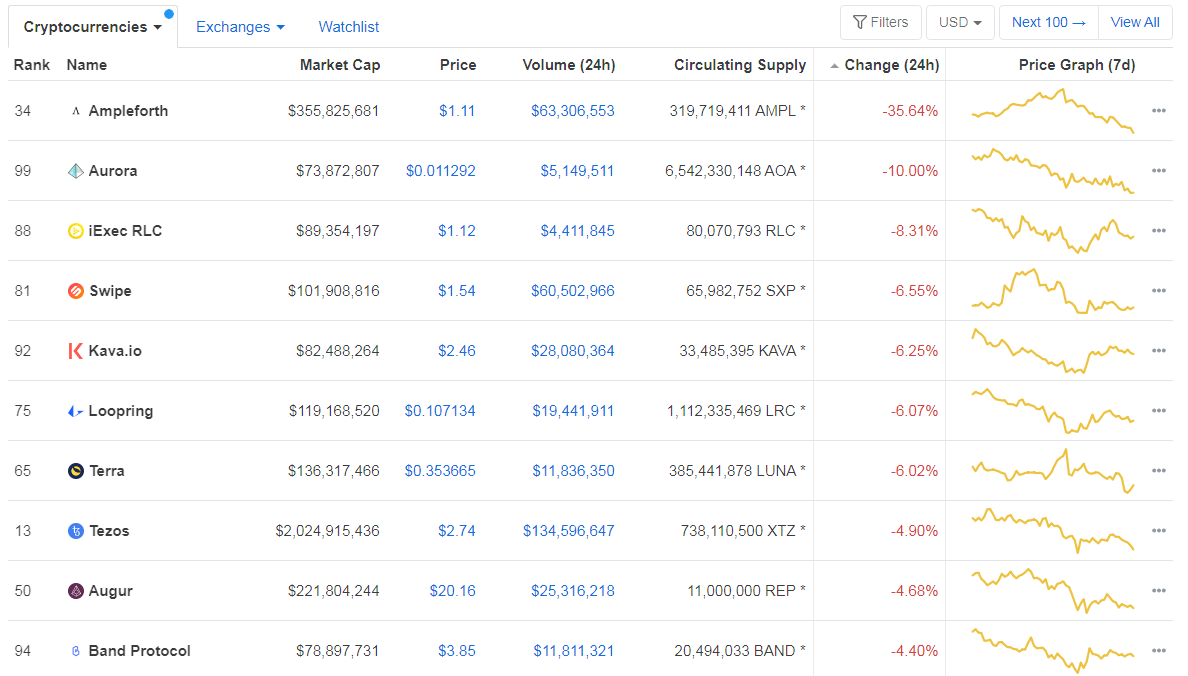
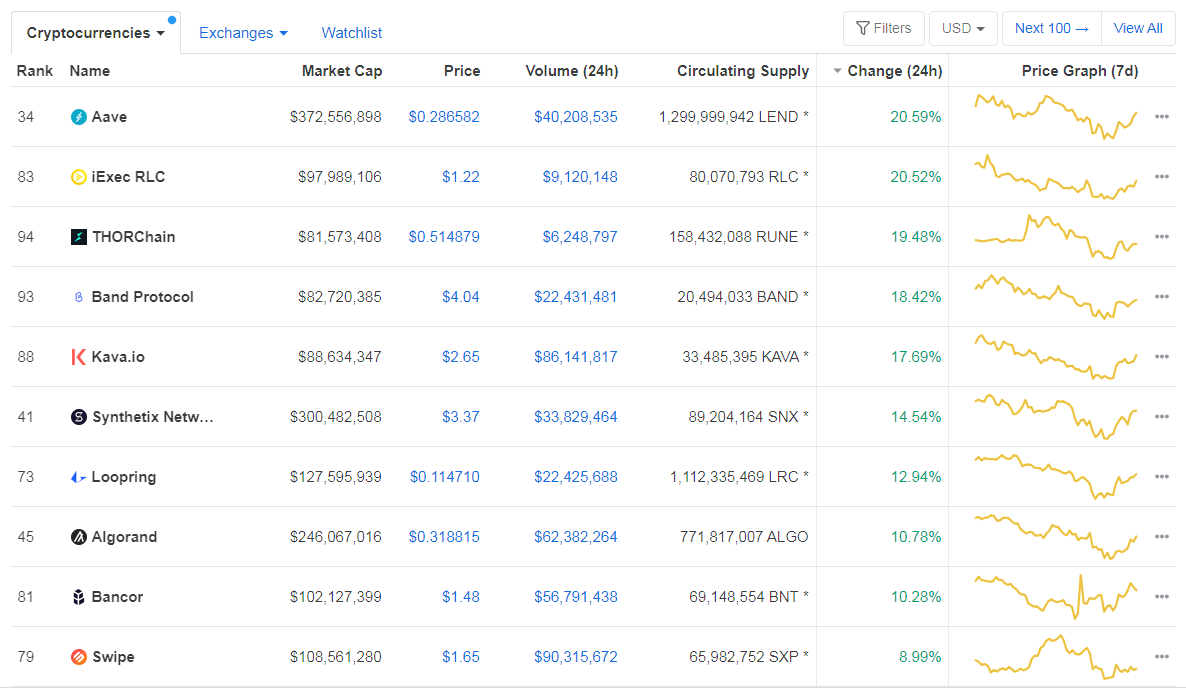
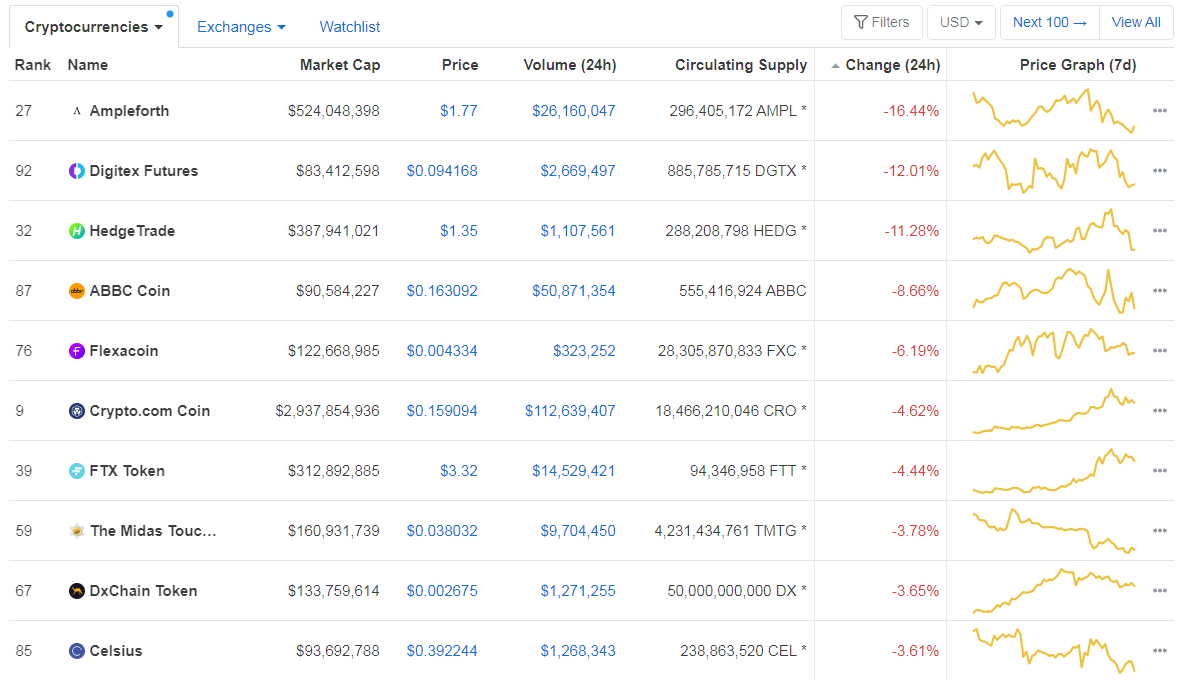
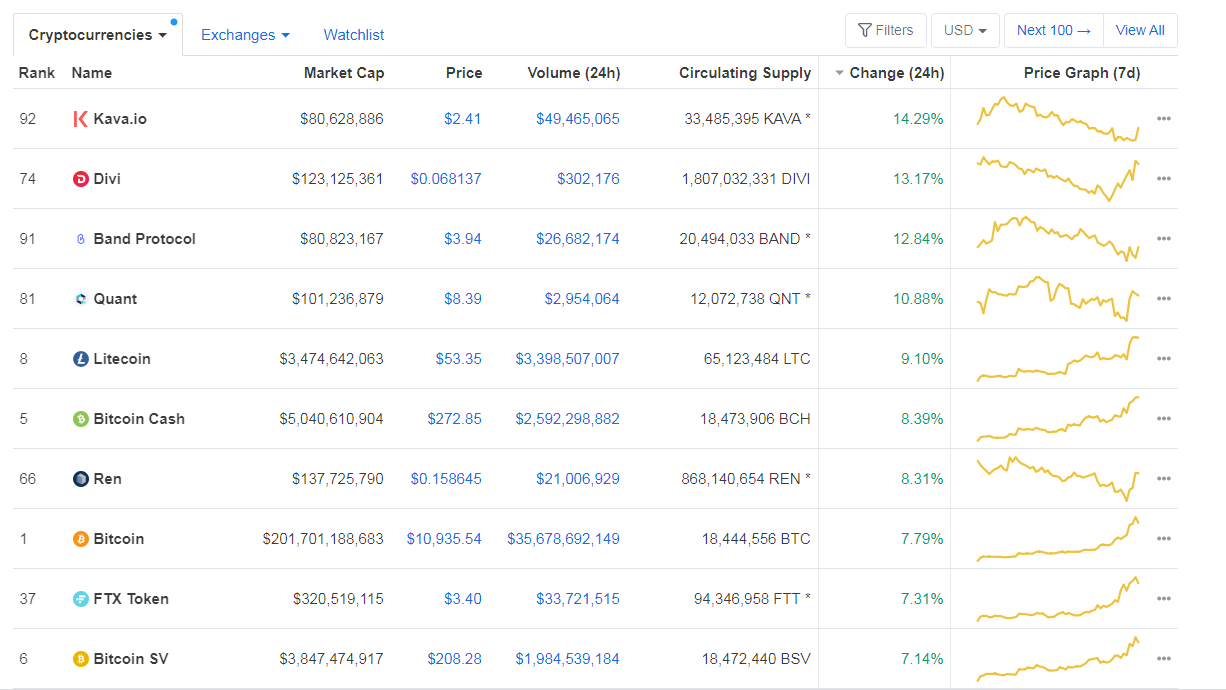
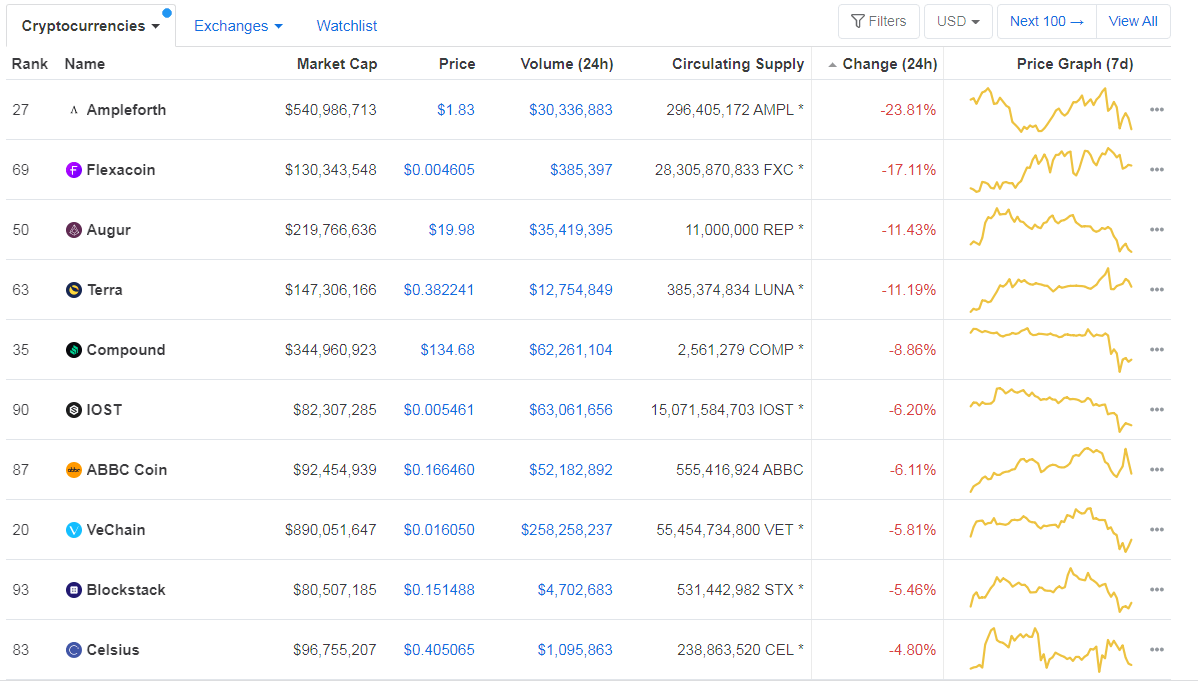
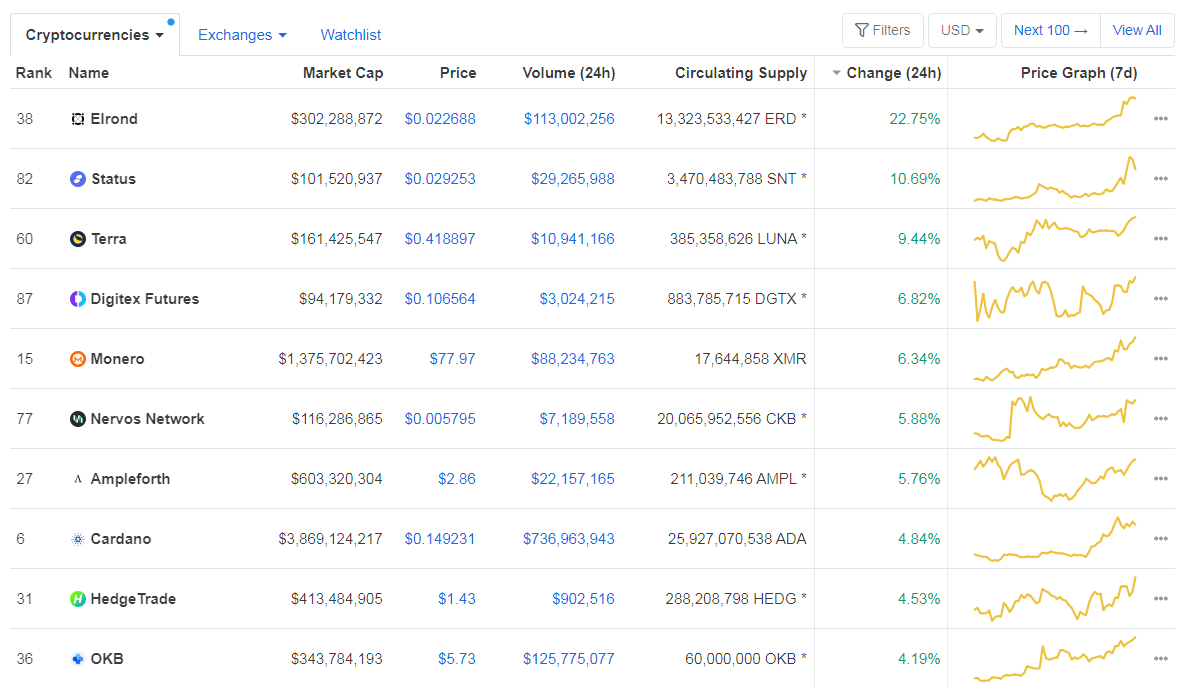
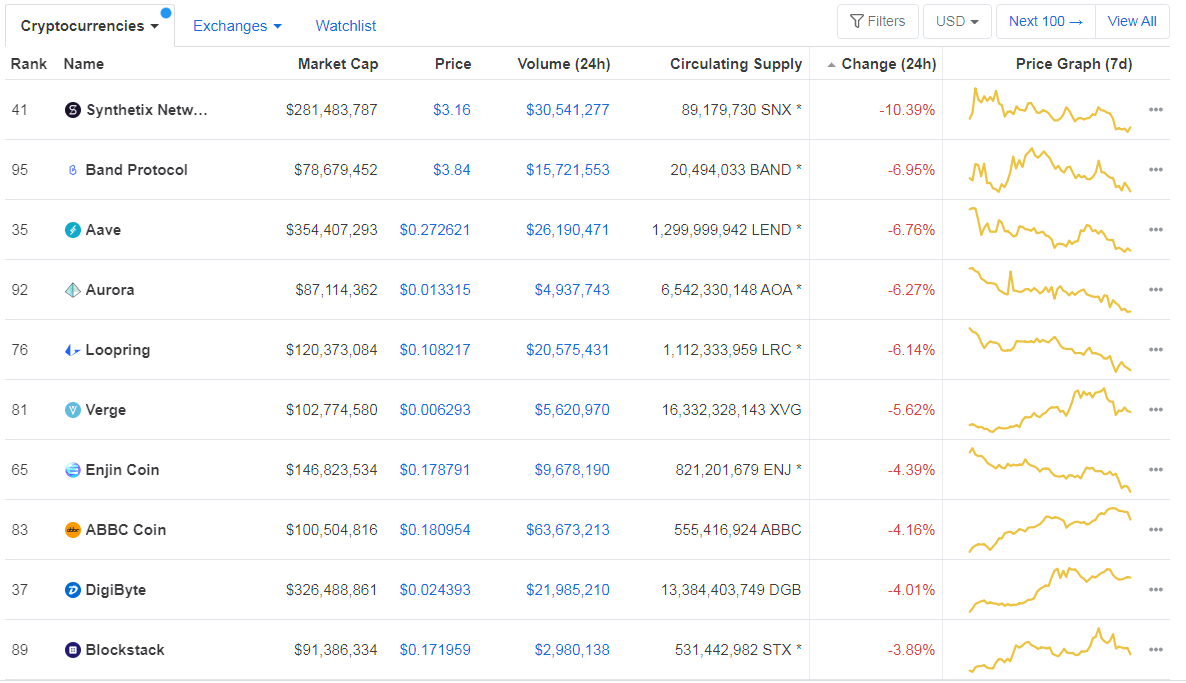
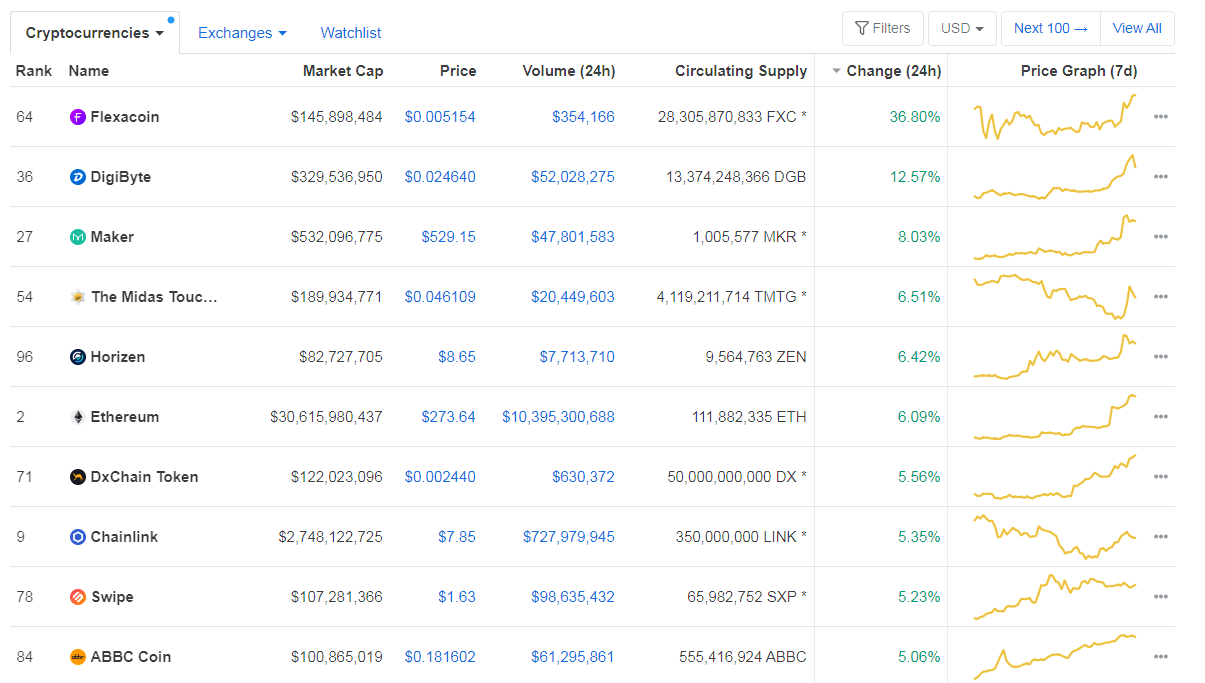
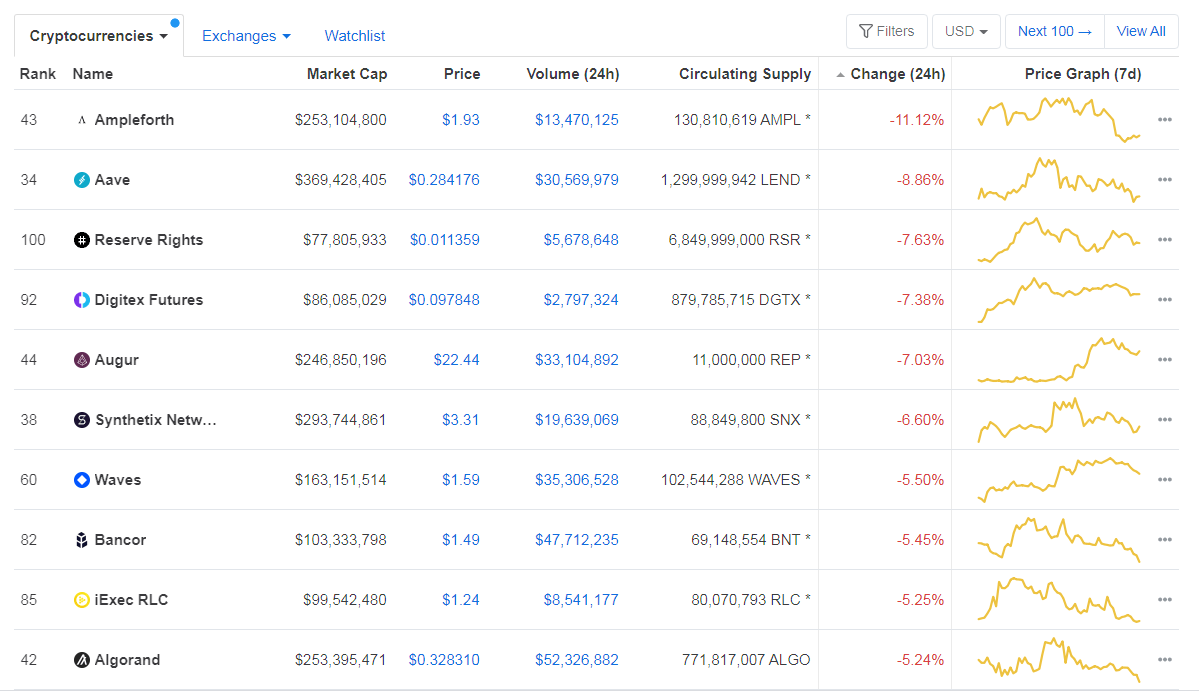
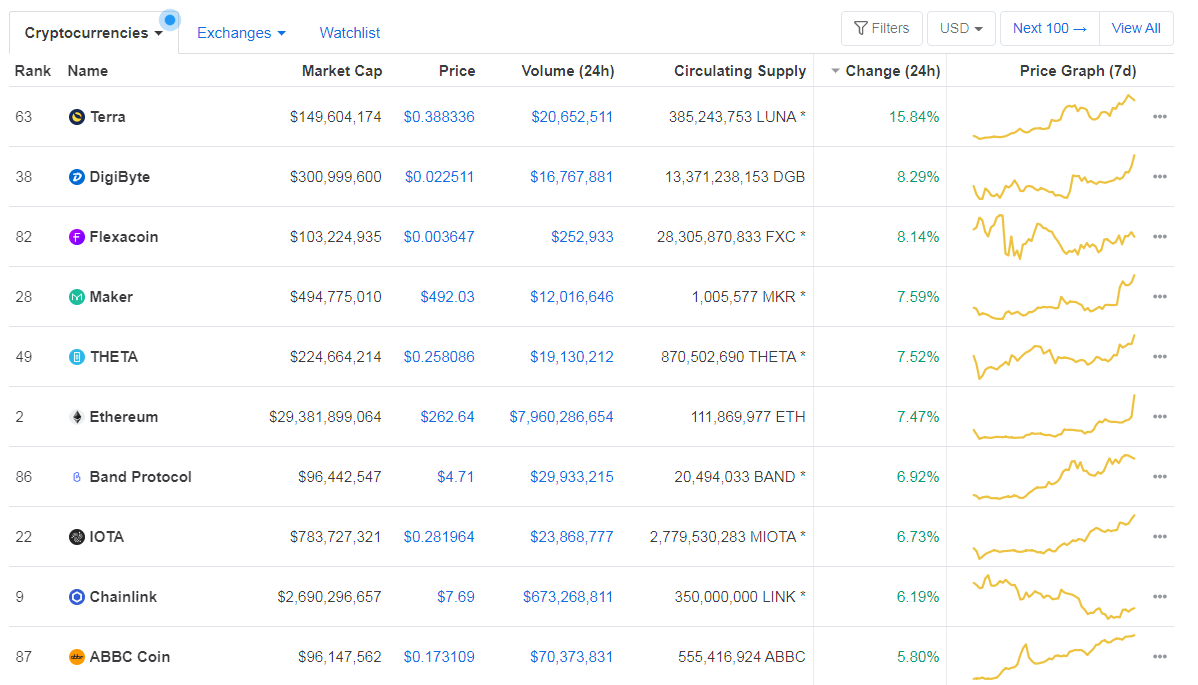
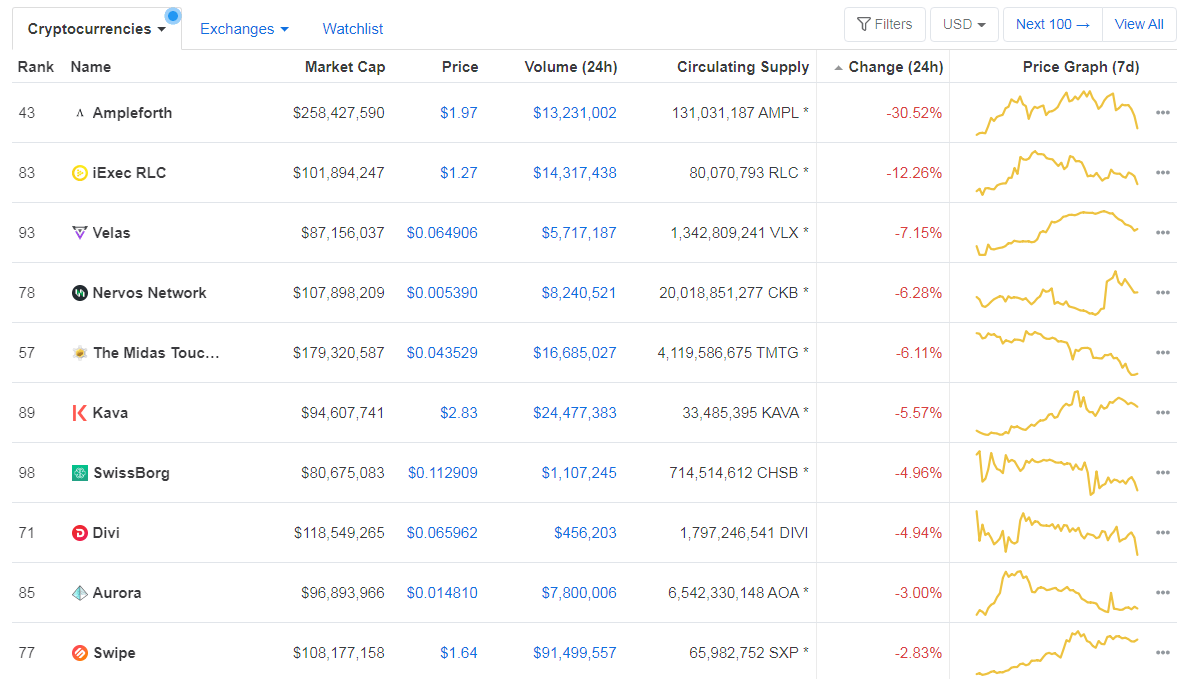
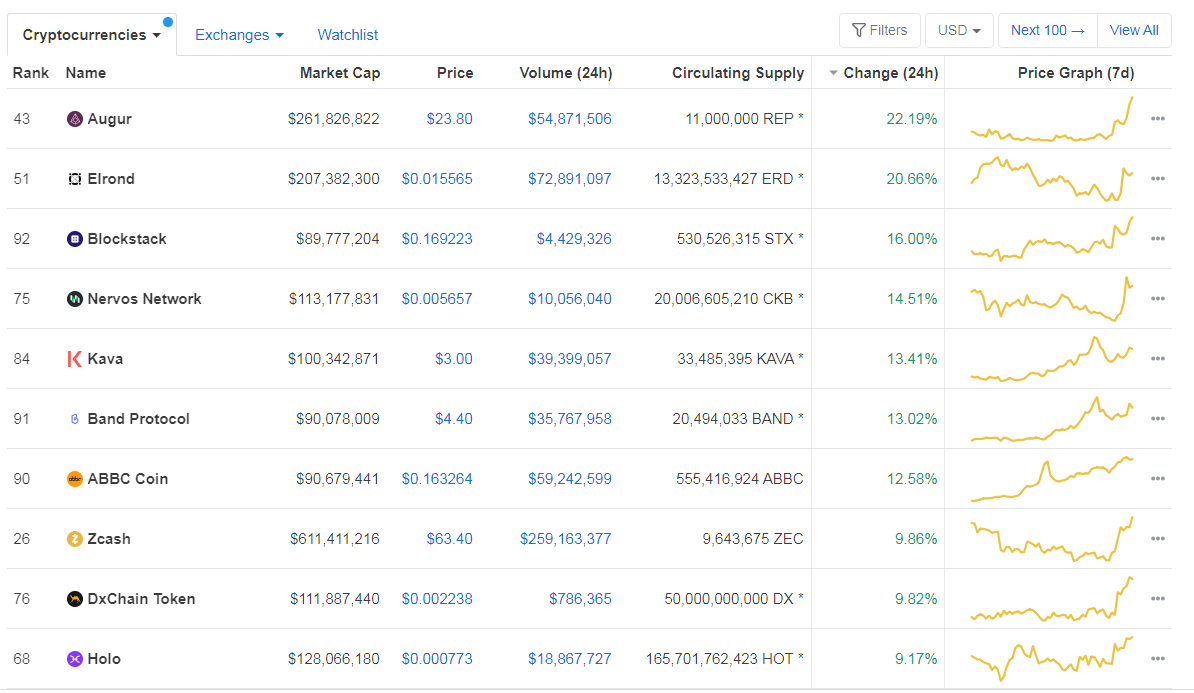
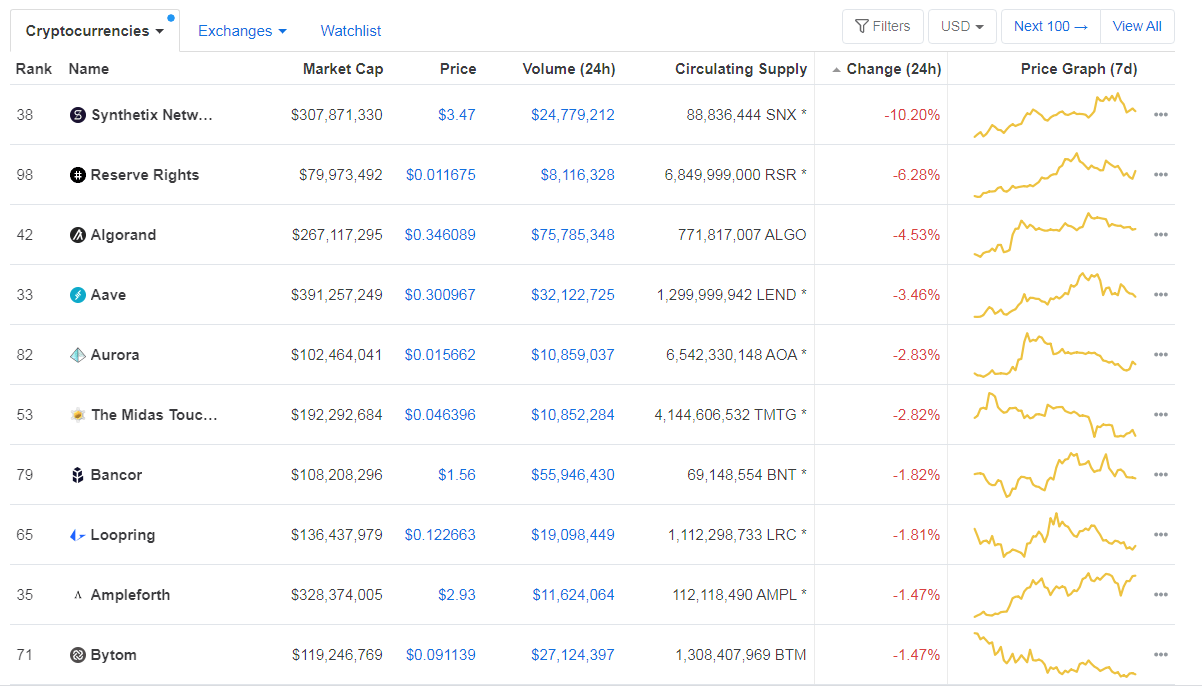
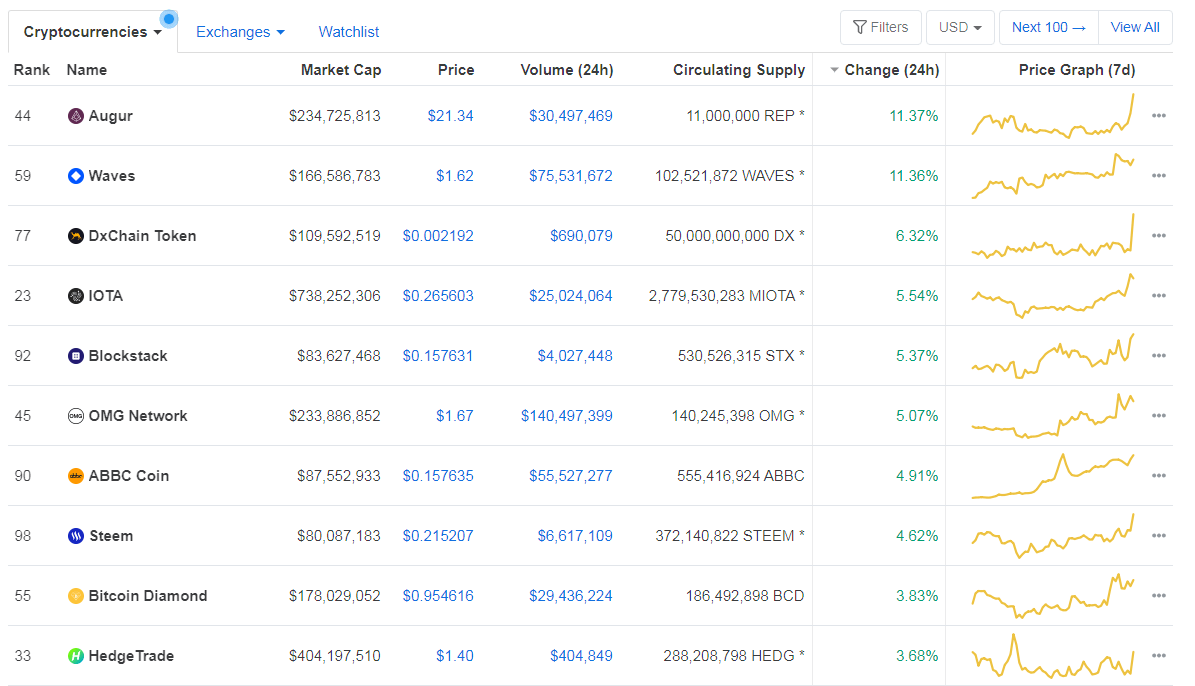
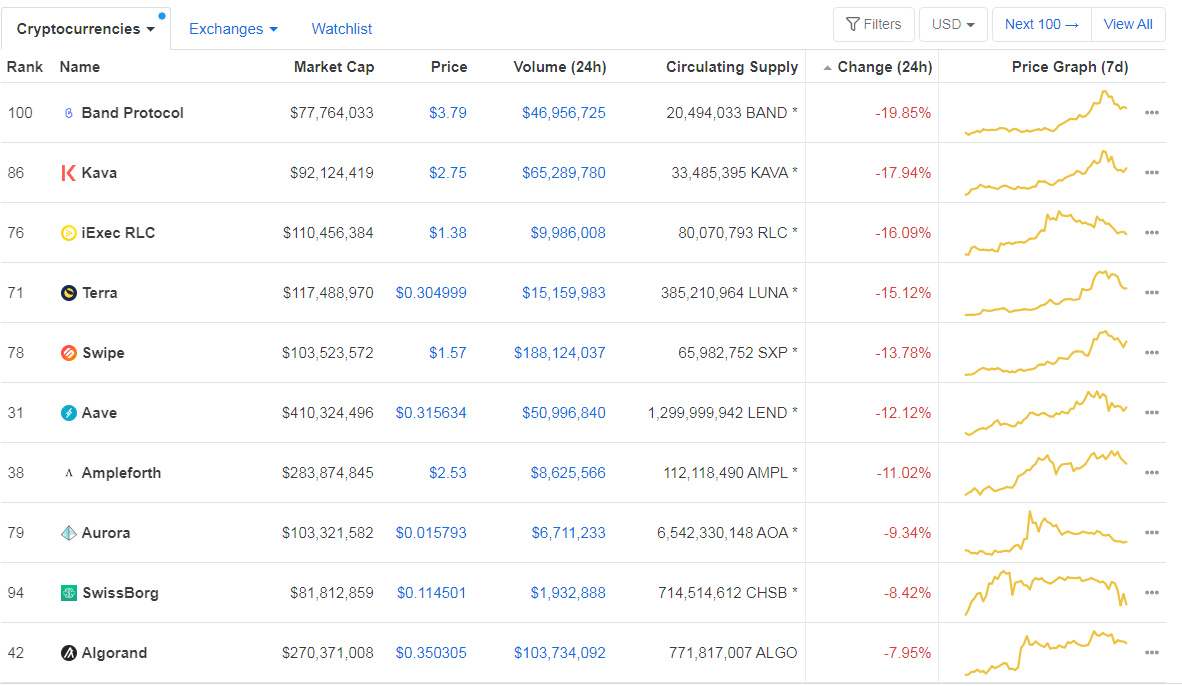
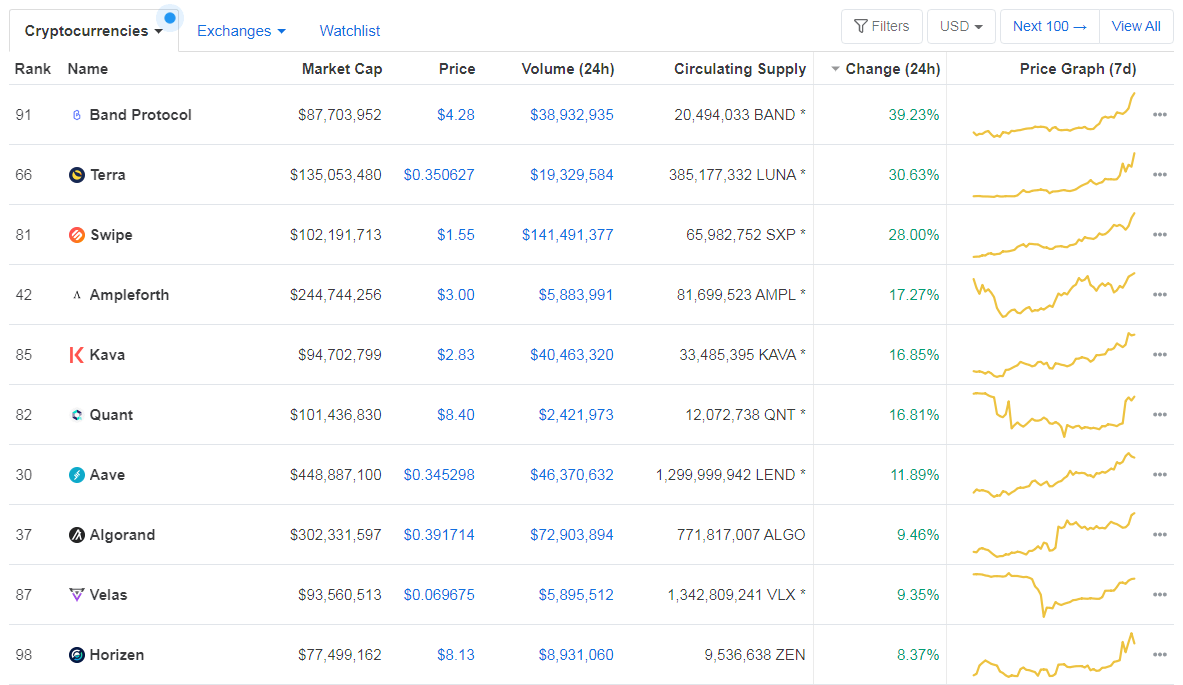
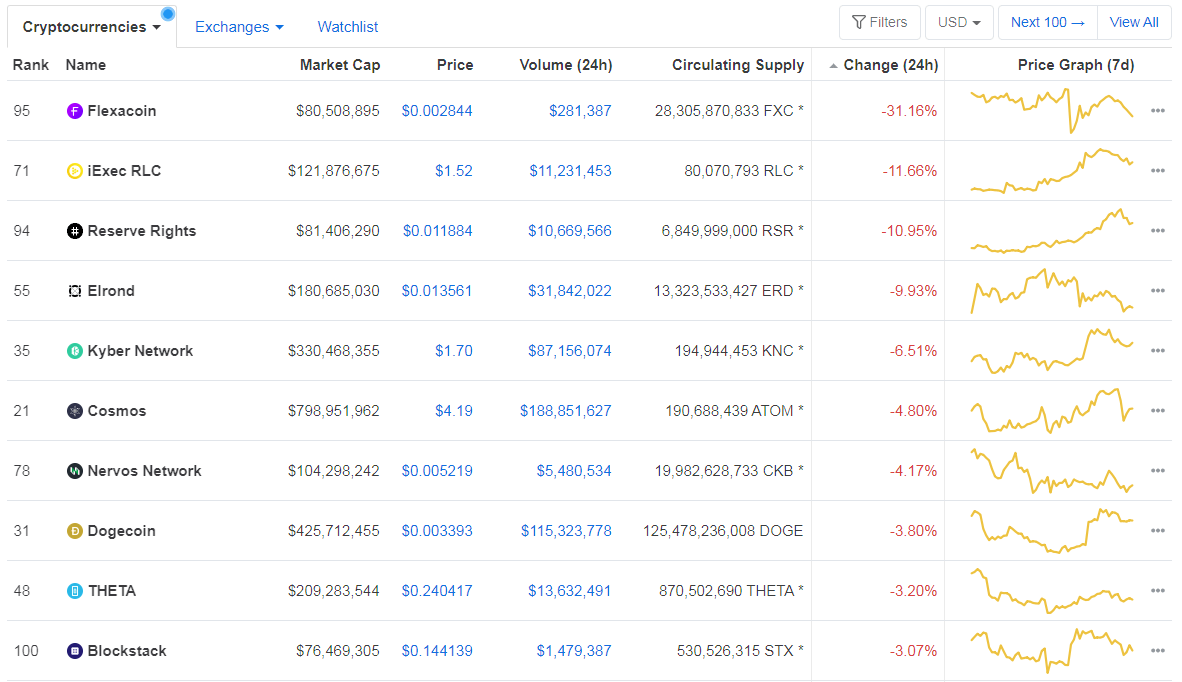
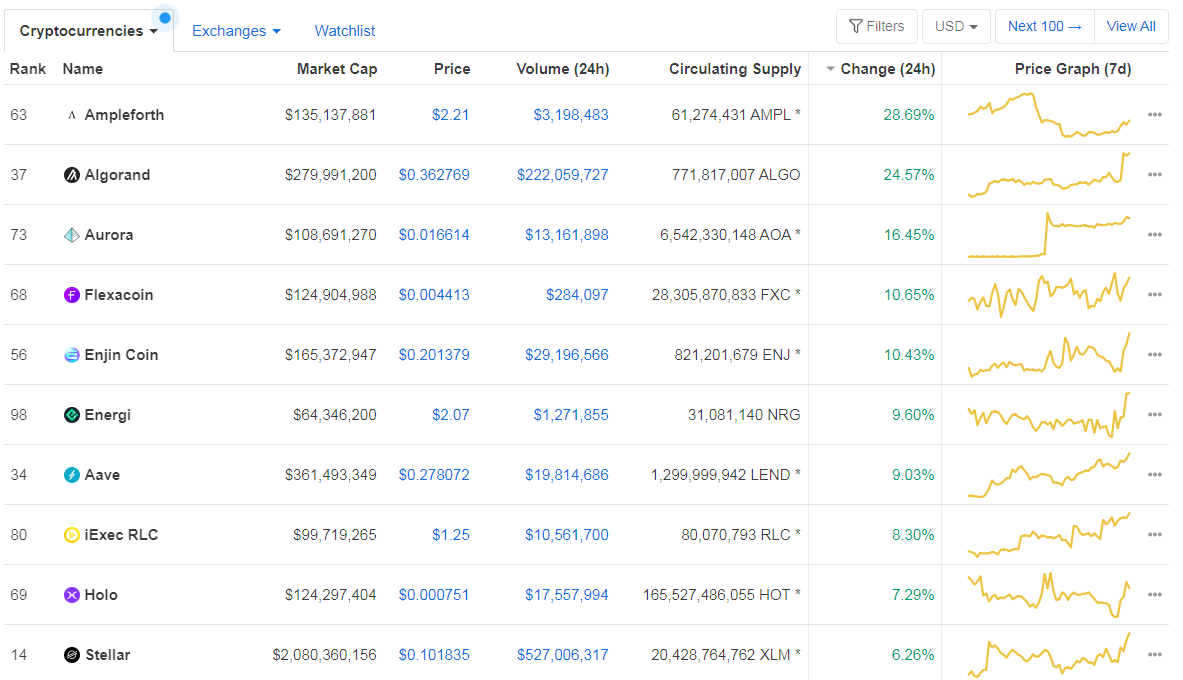
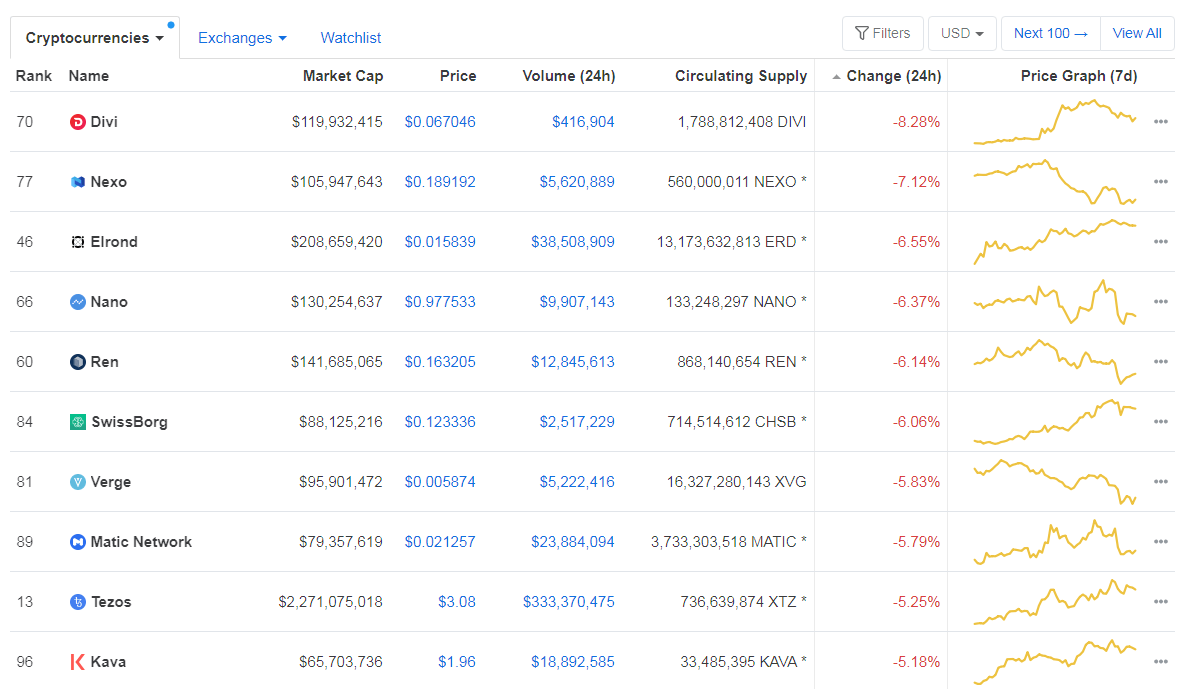
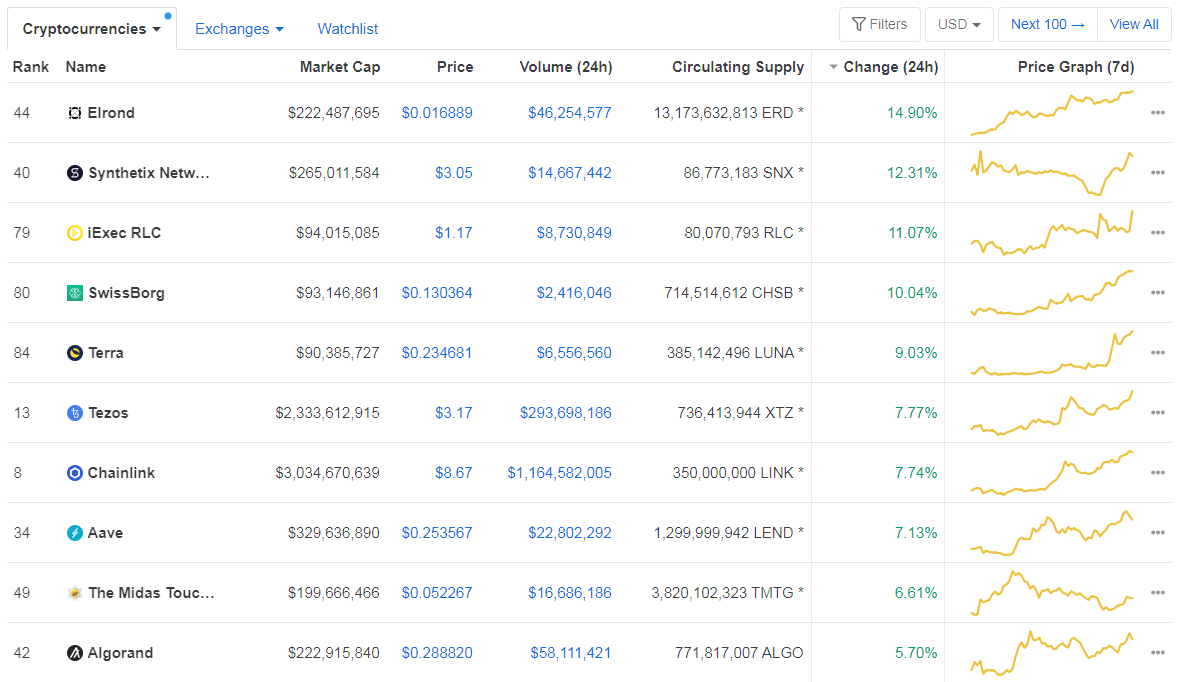
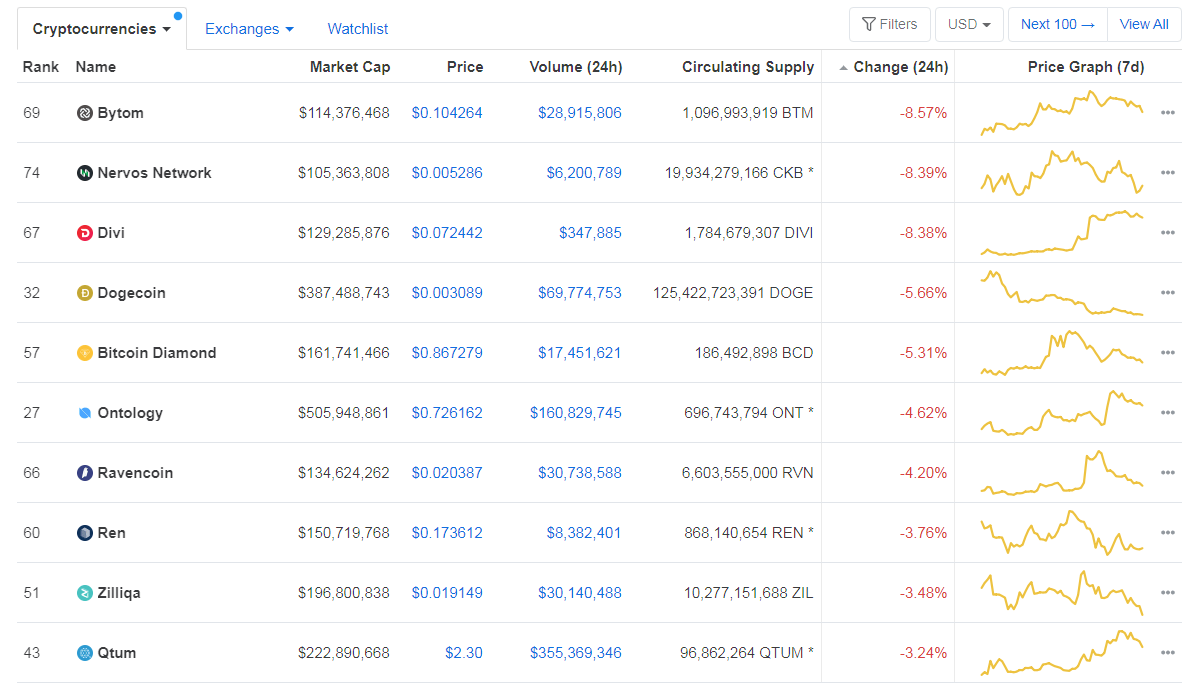
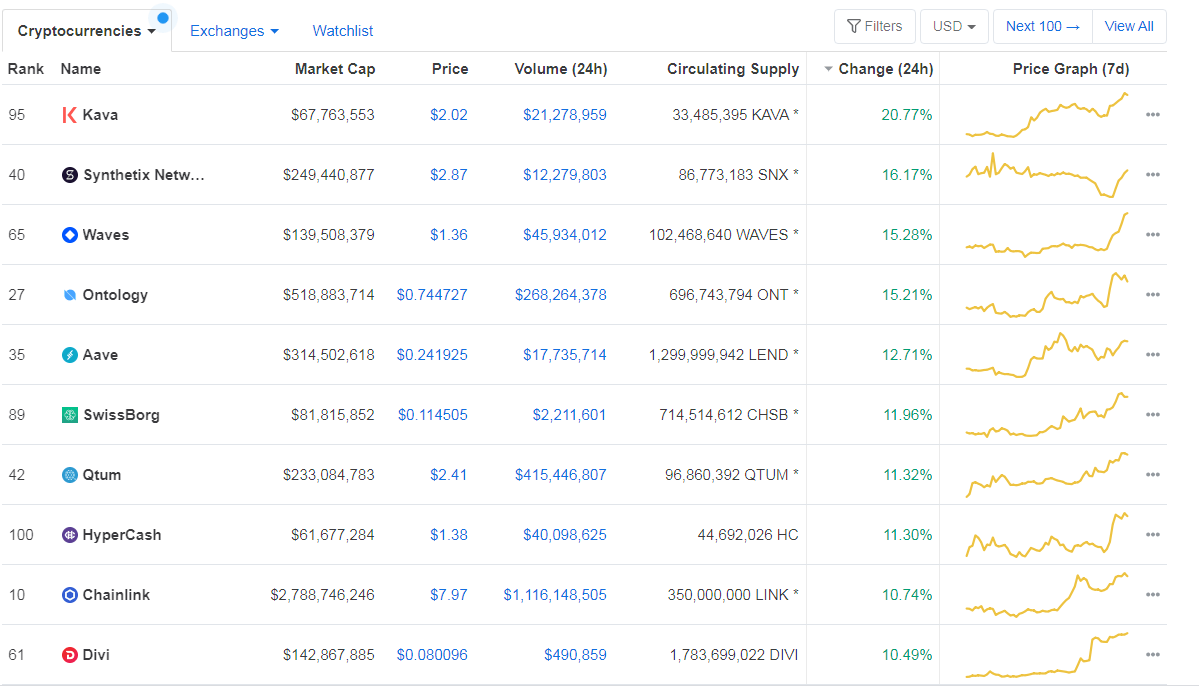
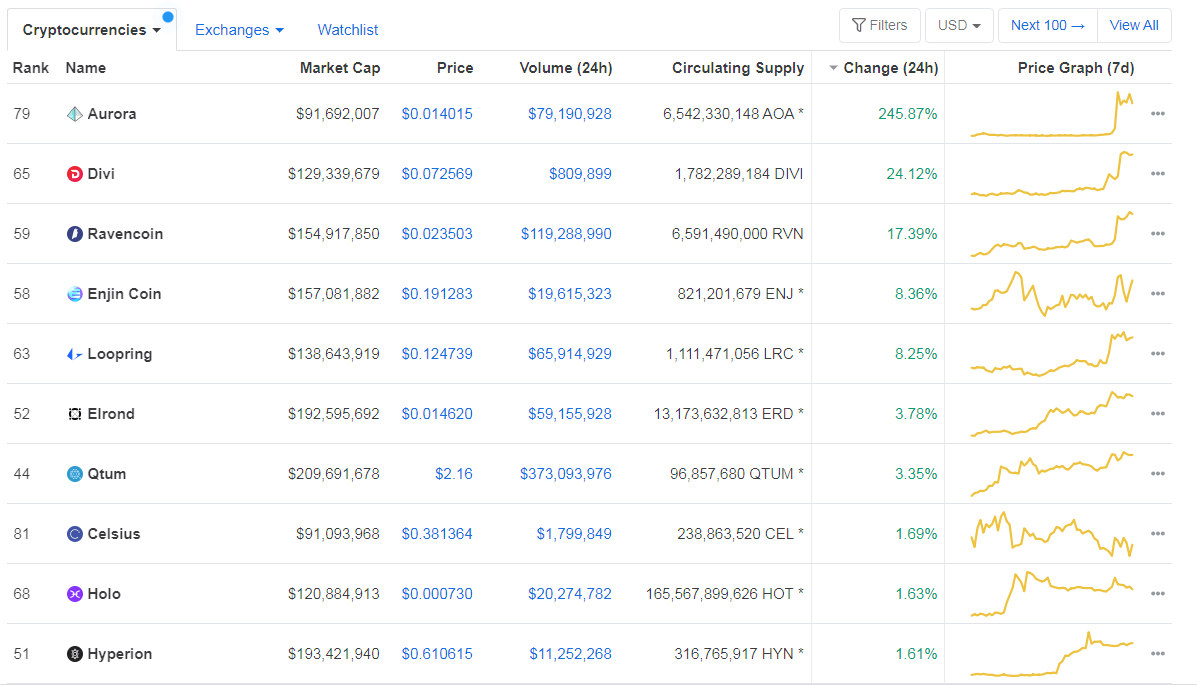
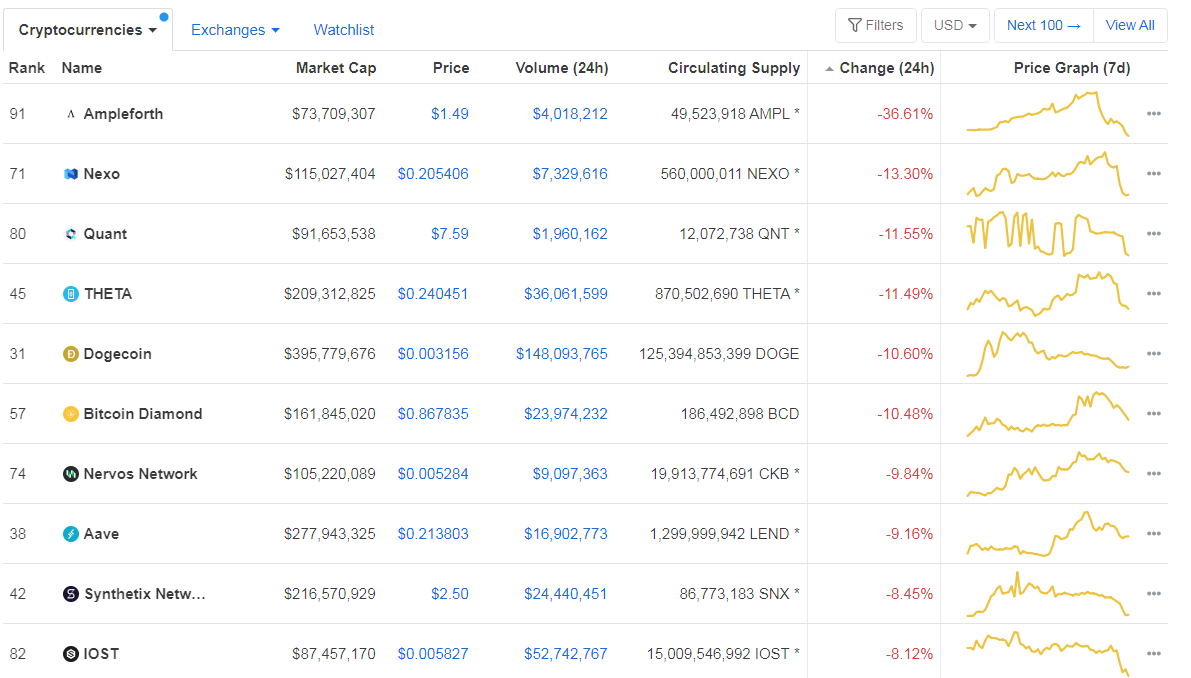
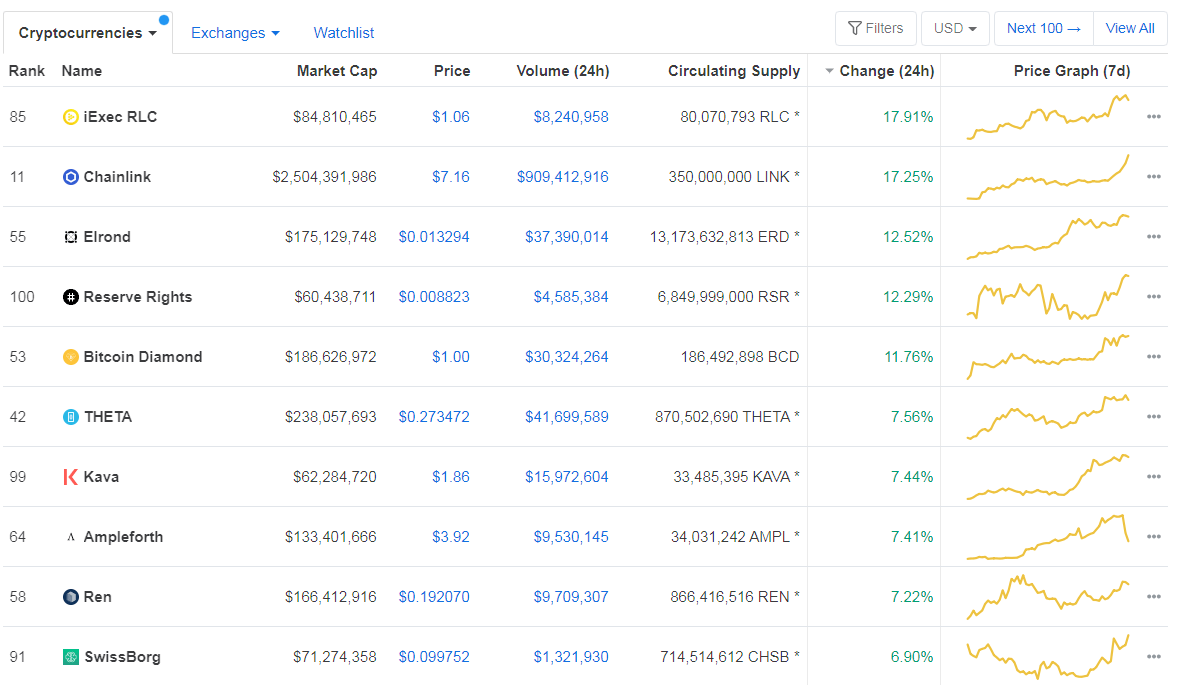
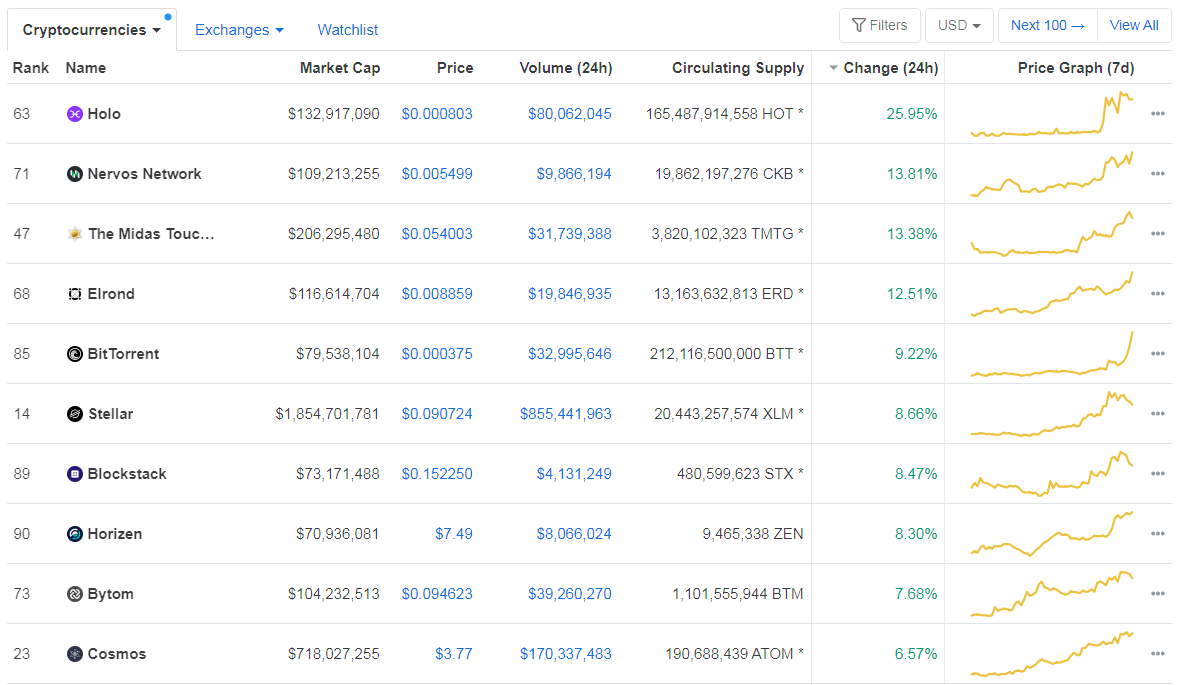
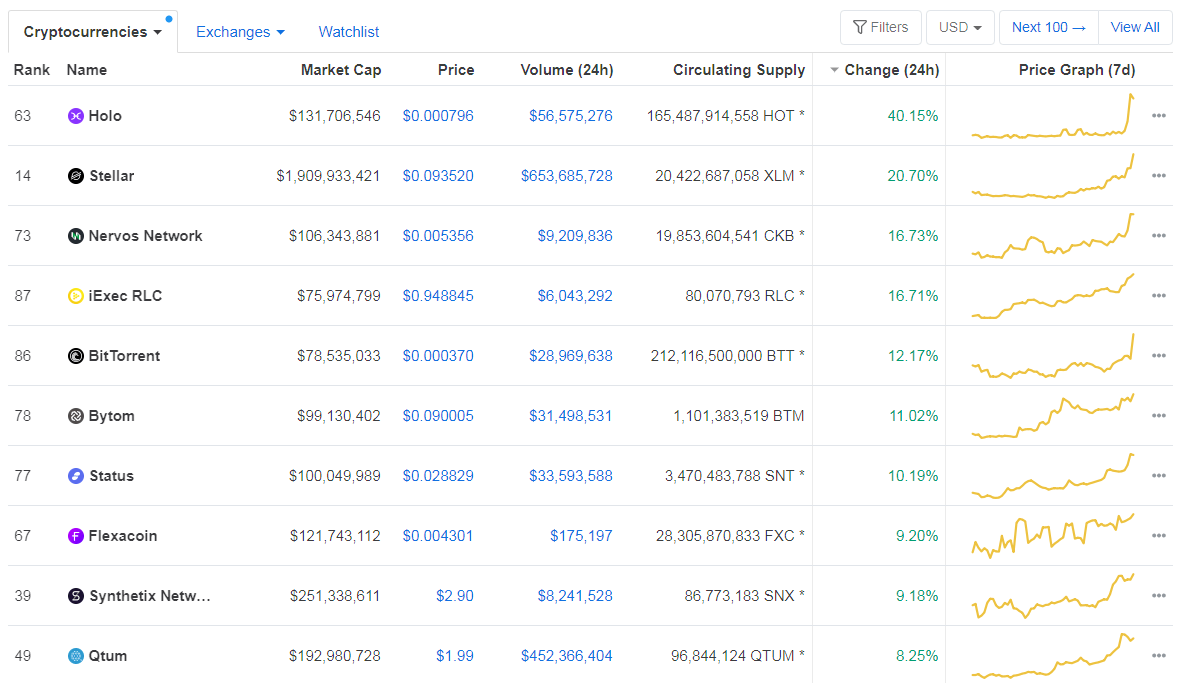
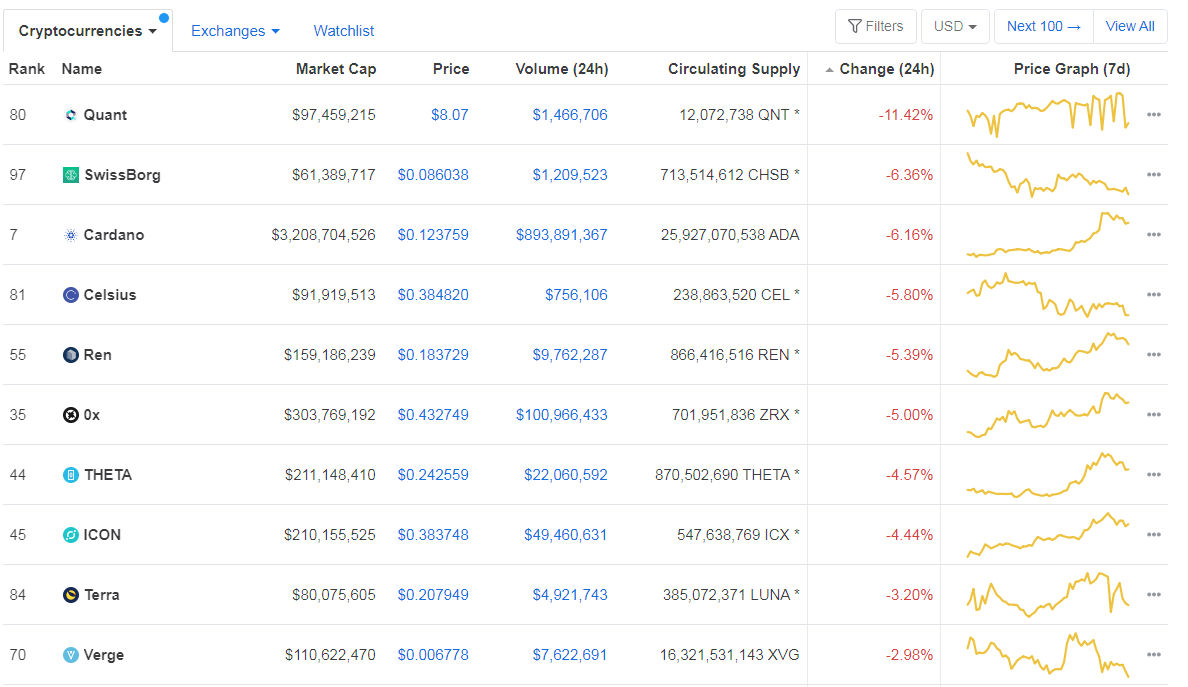
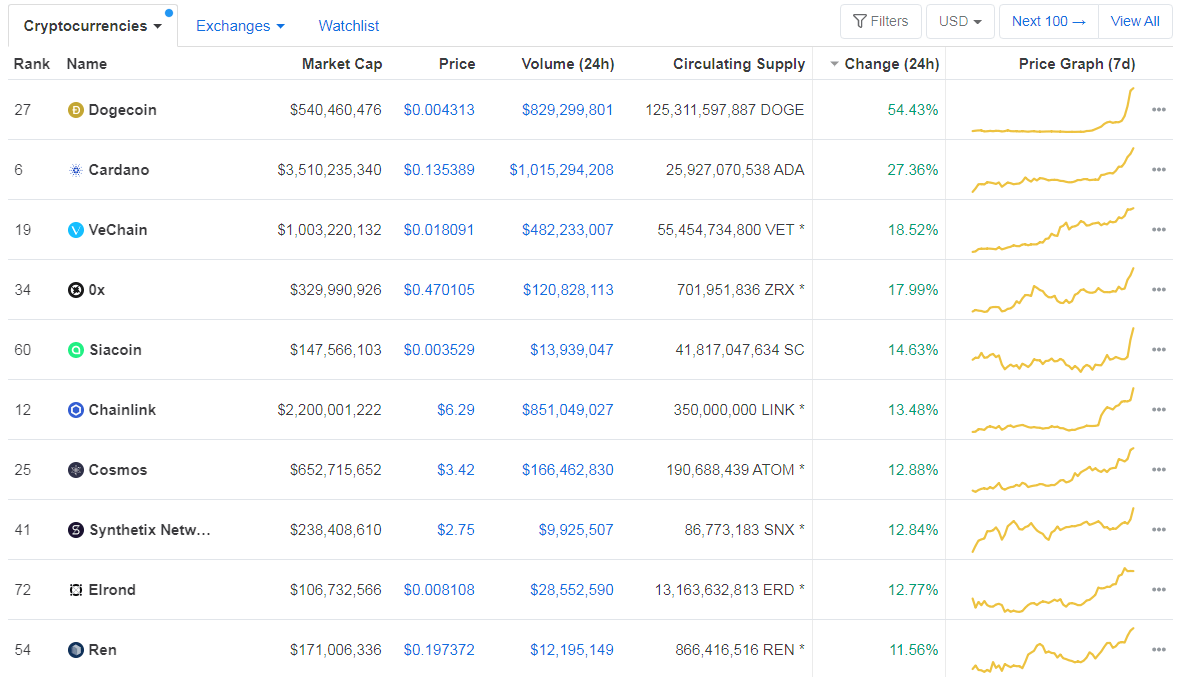
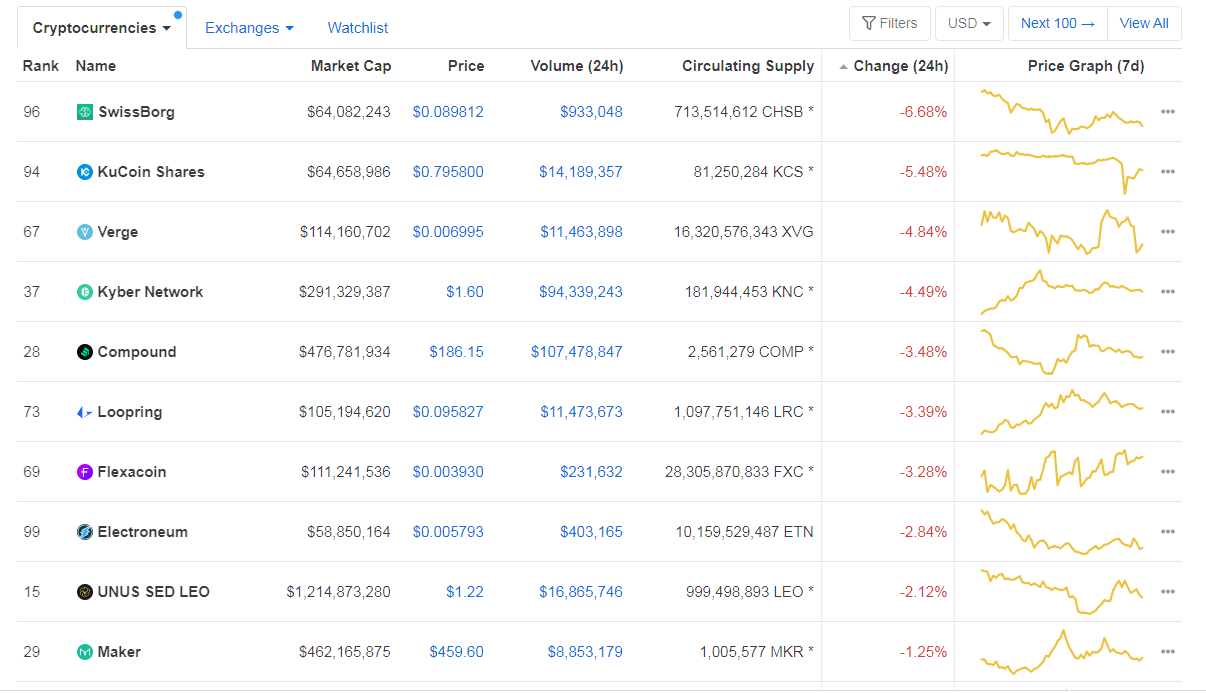
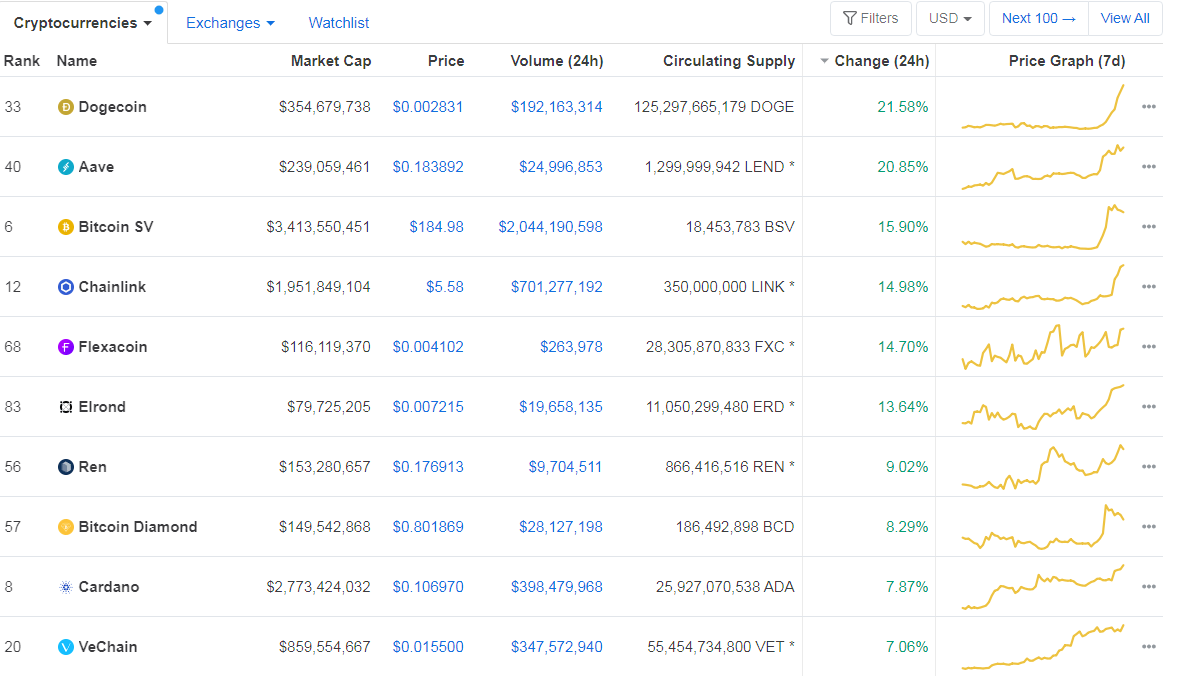
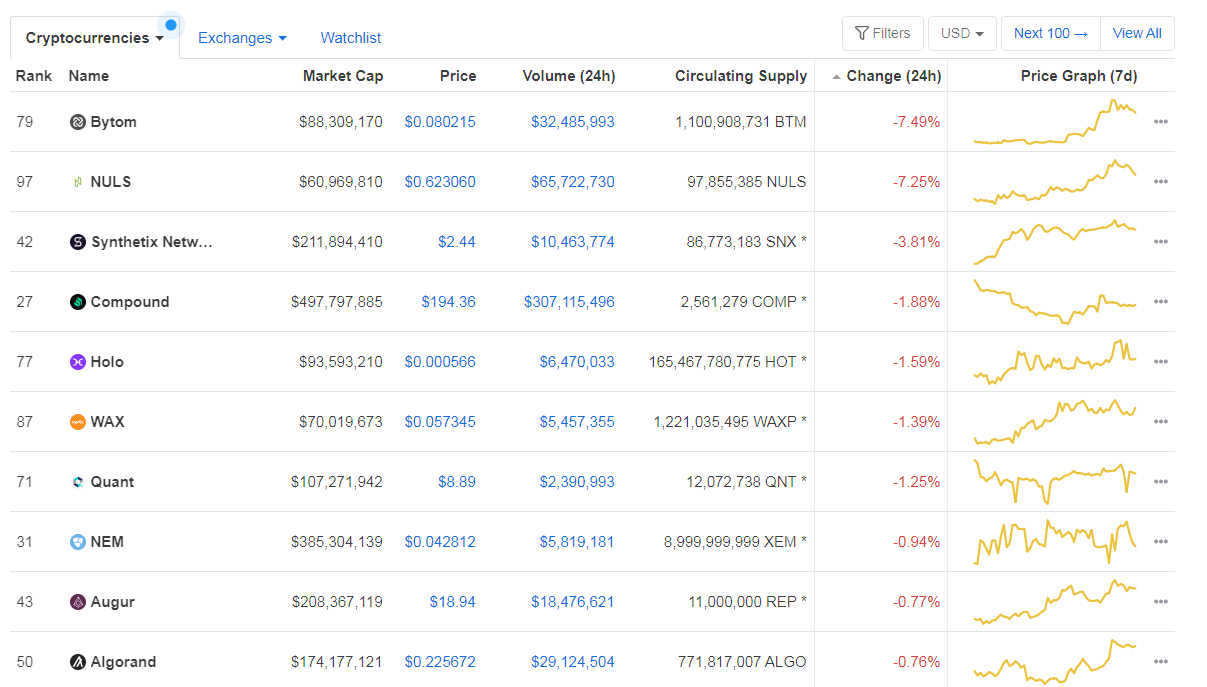
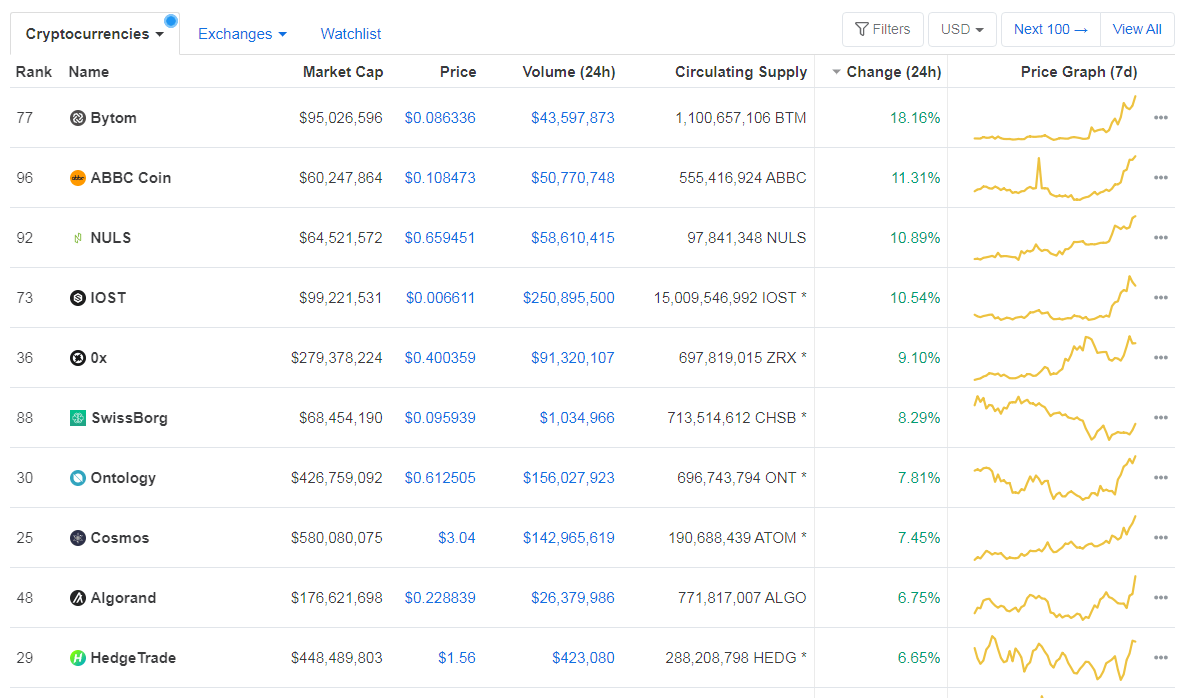
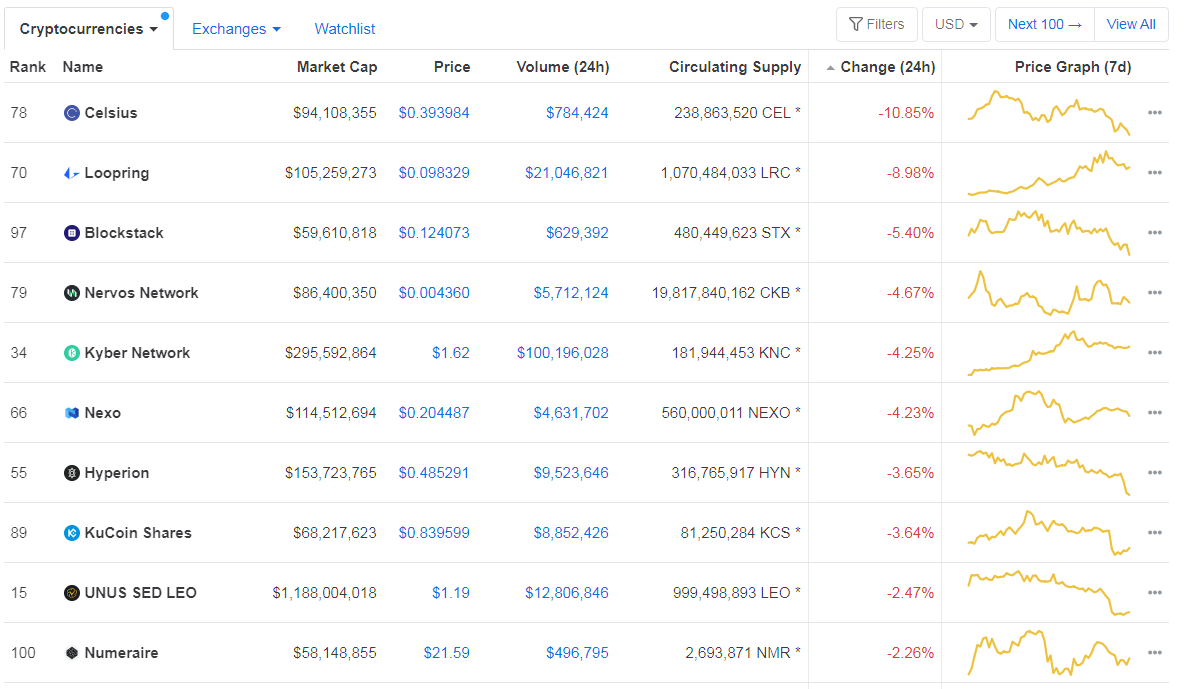
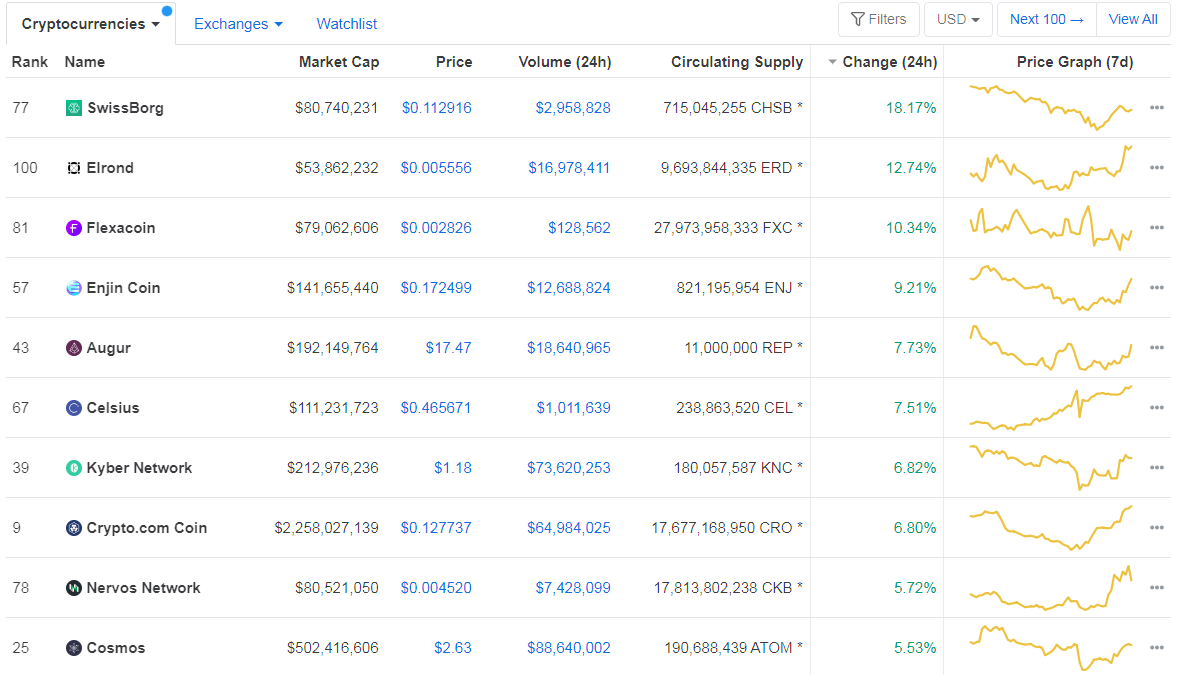
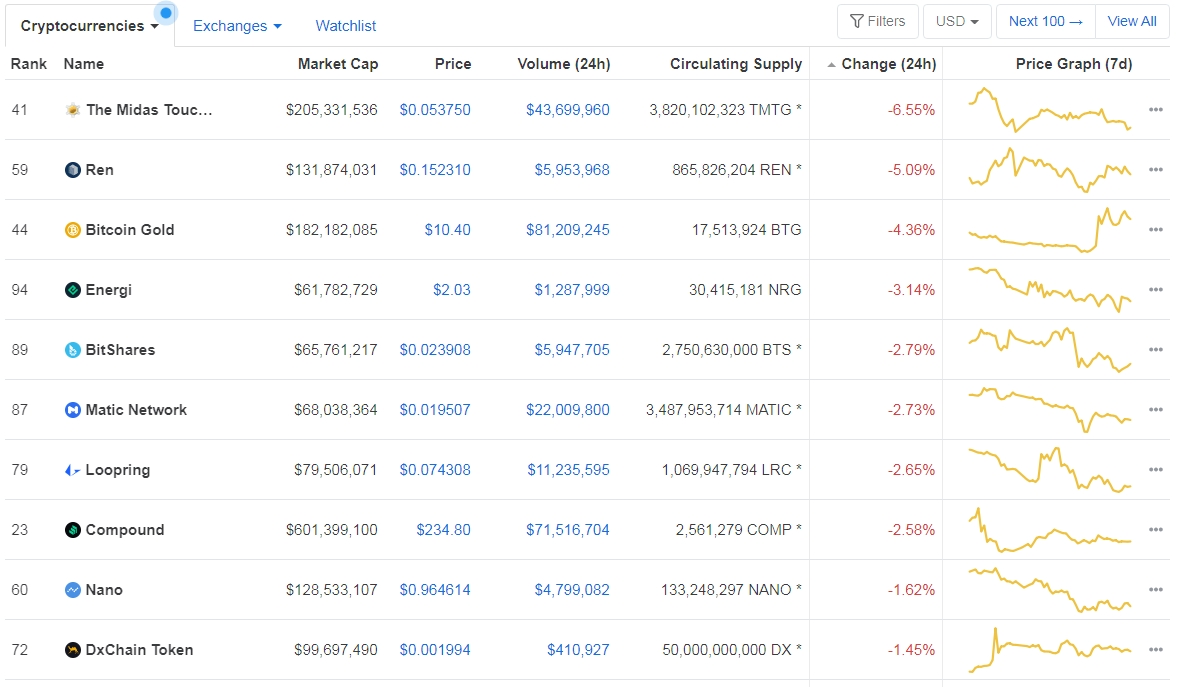
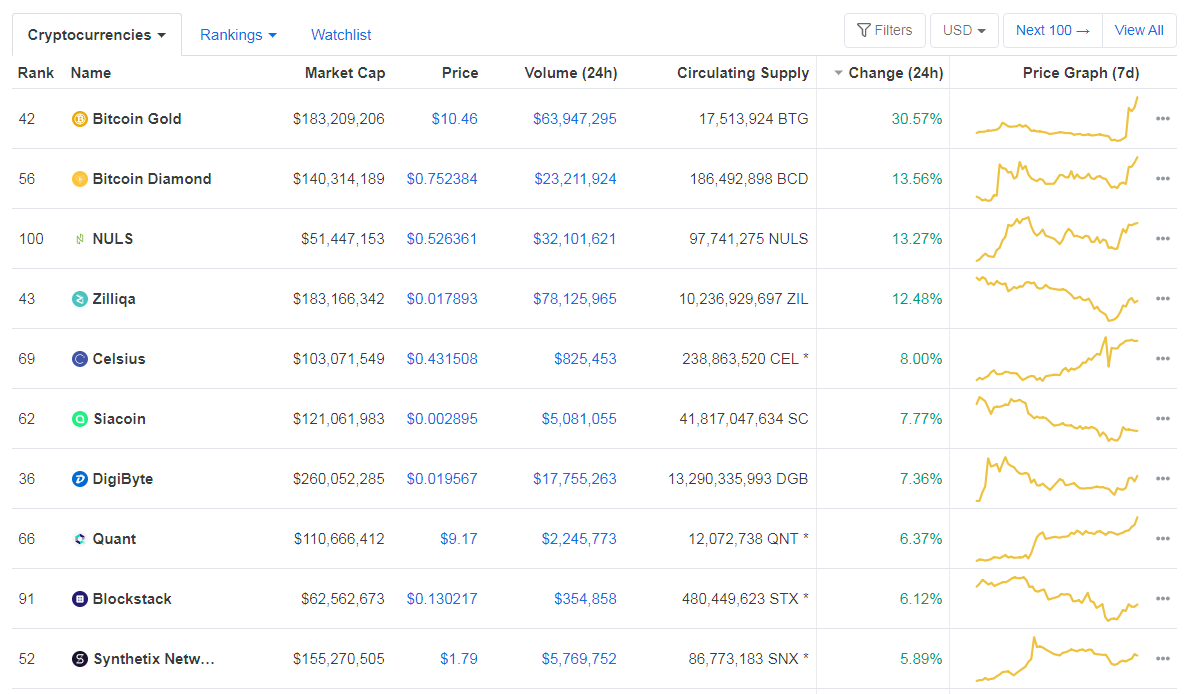
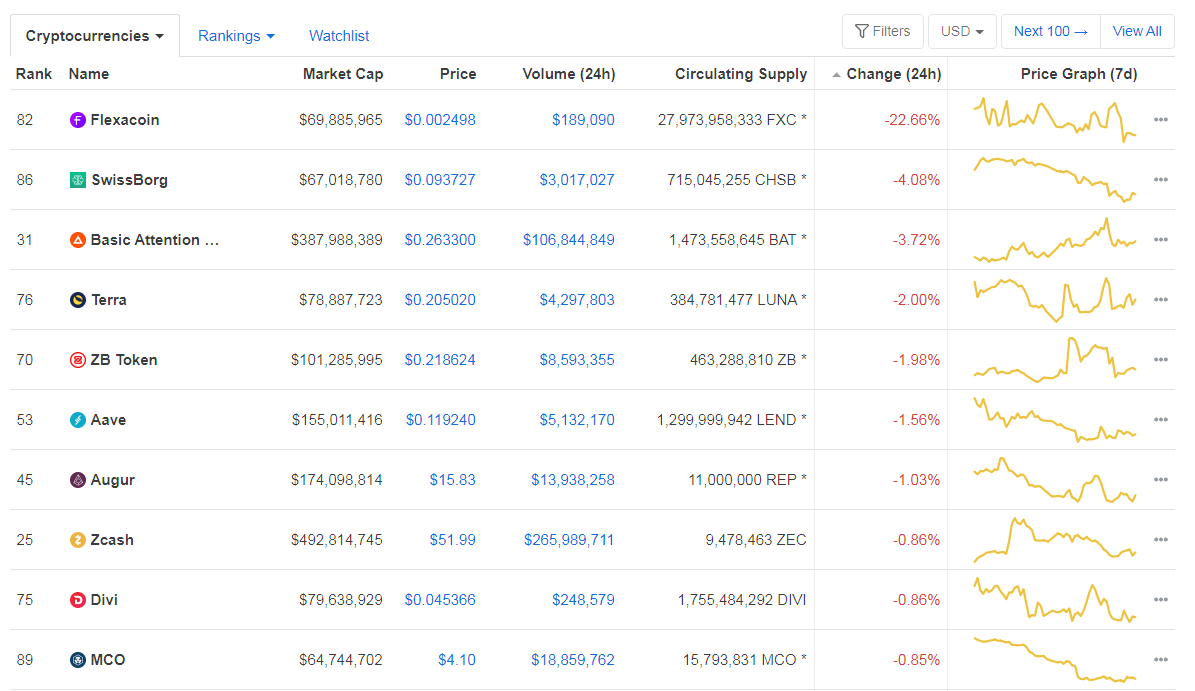
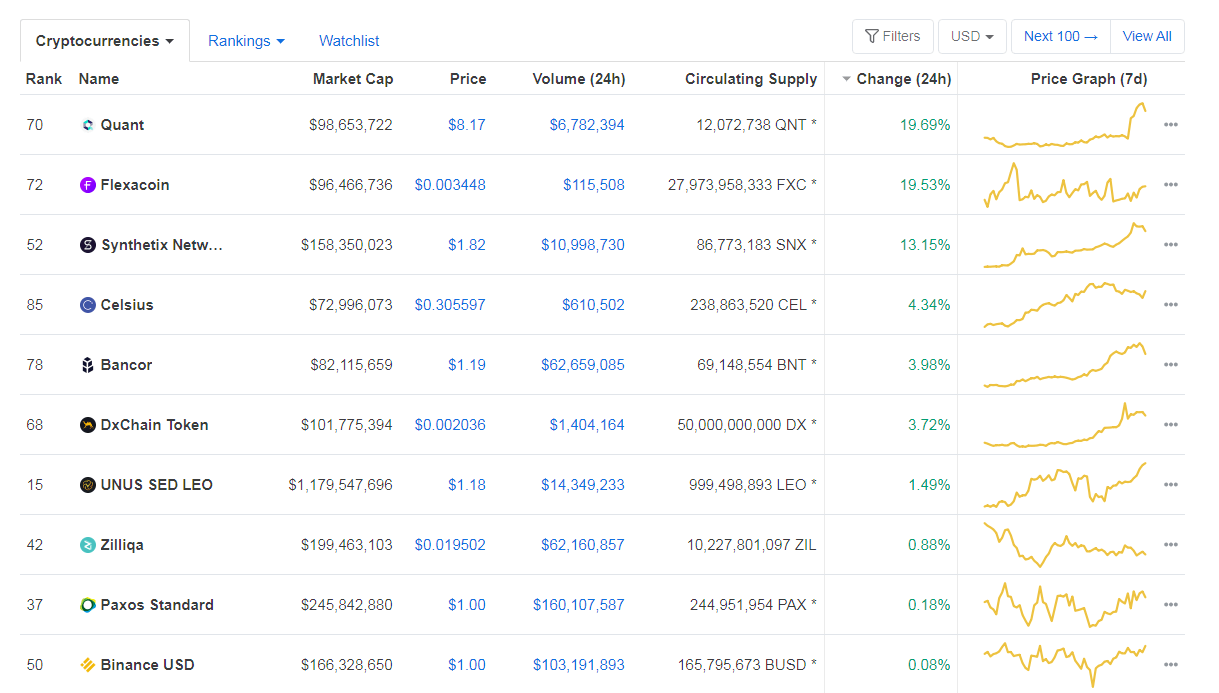
When taking a look at top100 cryptocurrencies, OMG Network gained 106.88% on the day, making it the most prominent daily gainer. 0x (48.58%) and Flexacoin (42.15%) also did great. On the other hand, Ren lost 14.05%, making it the most prominent daily loser. It is followed by Reserve Rights’ loss of 7.07% and Waves’ drop of 6.93%.
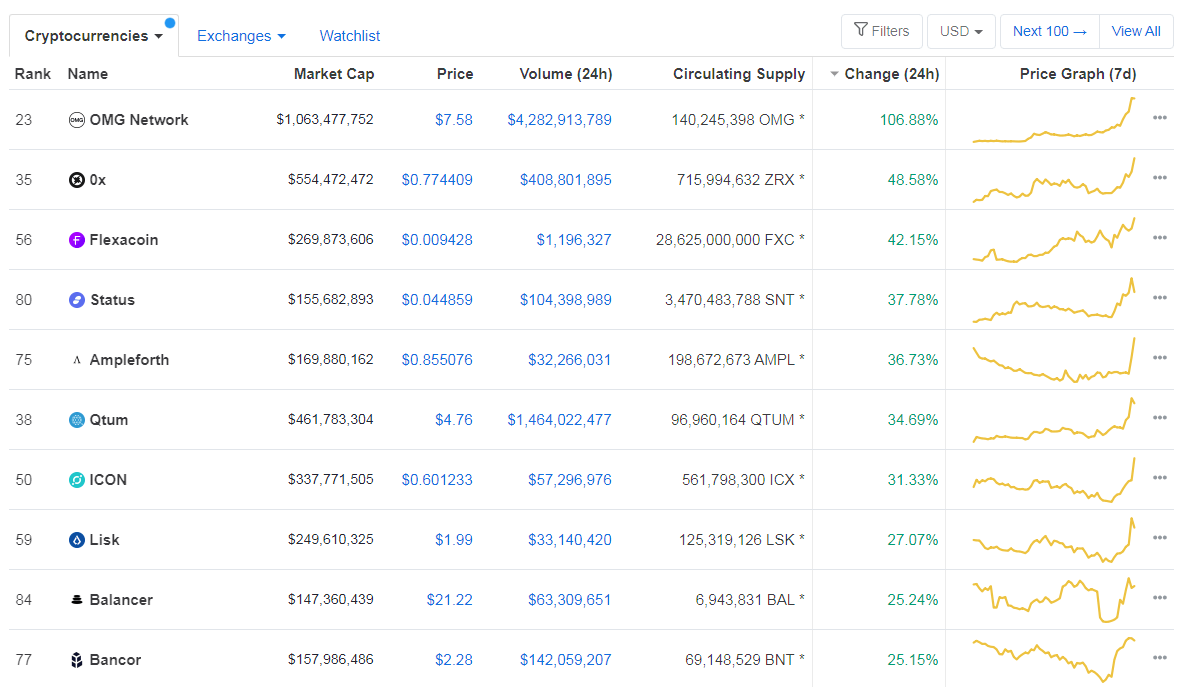
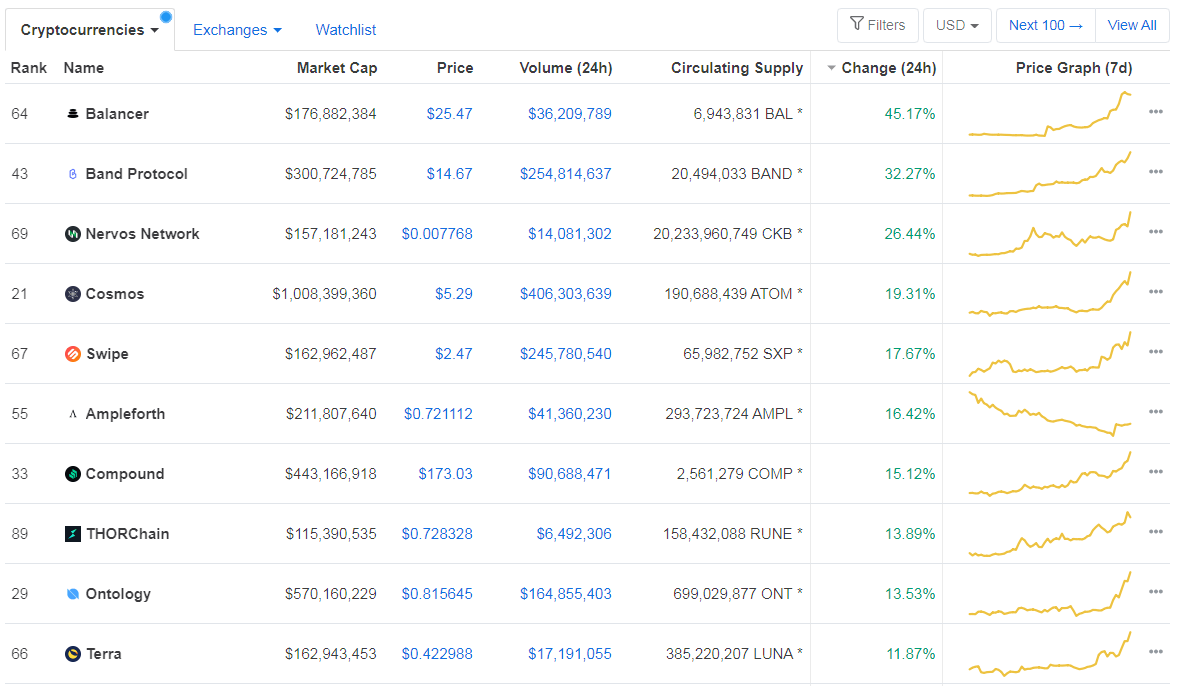
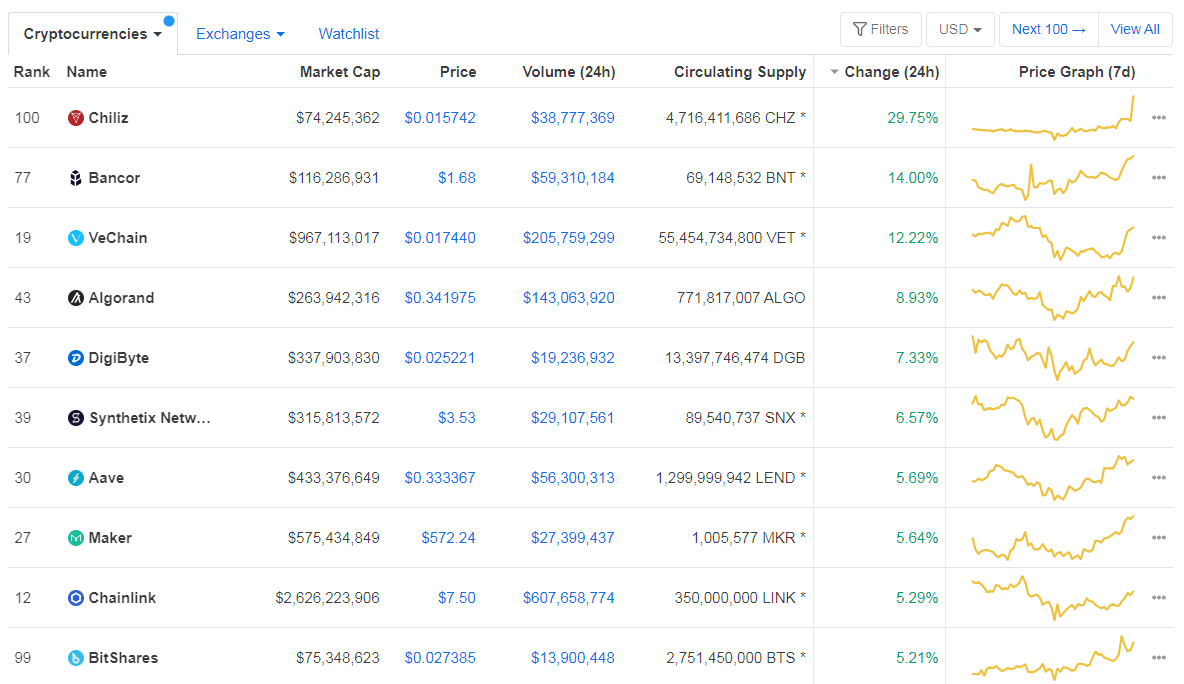
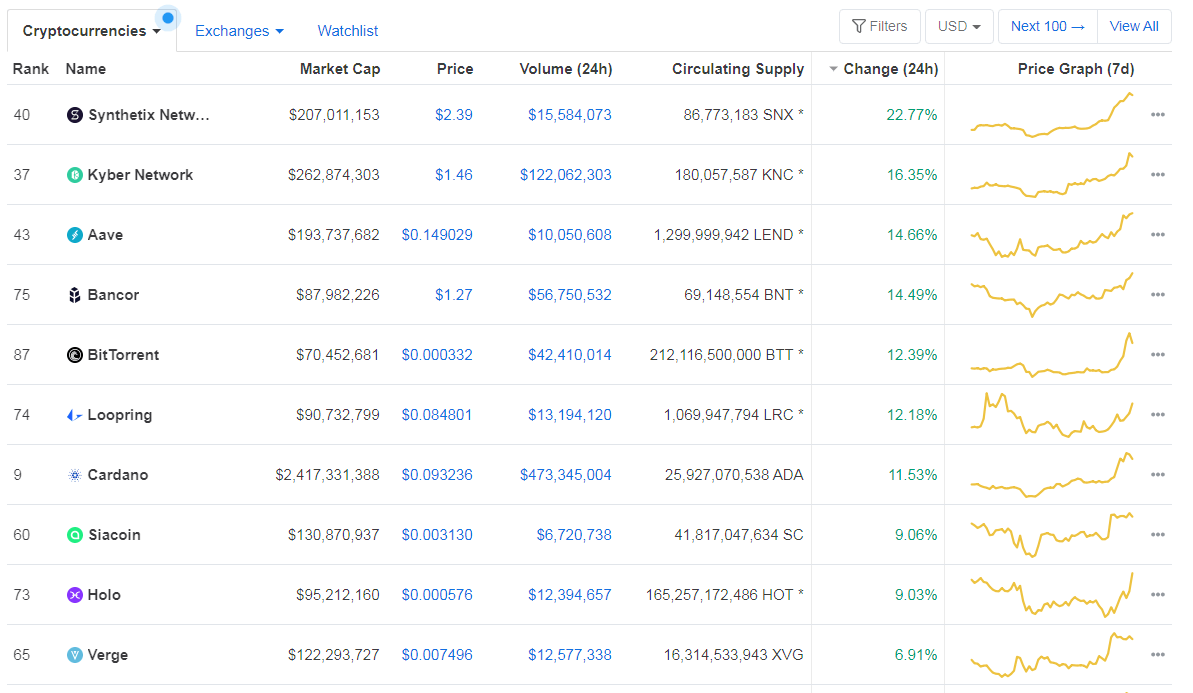
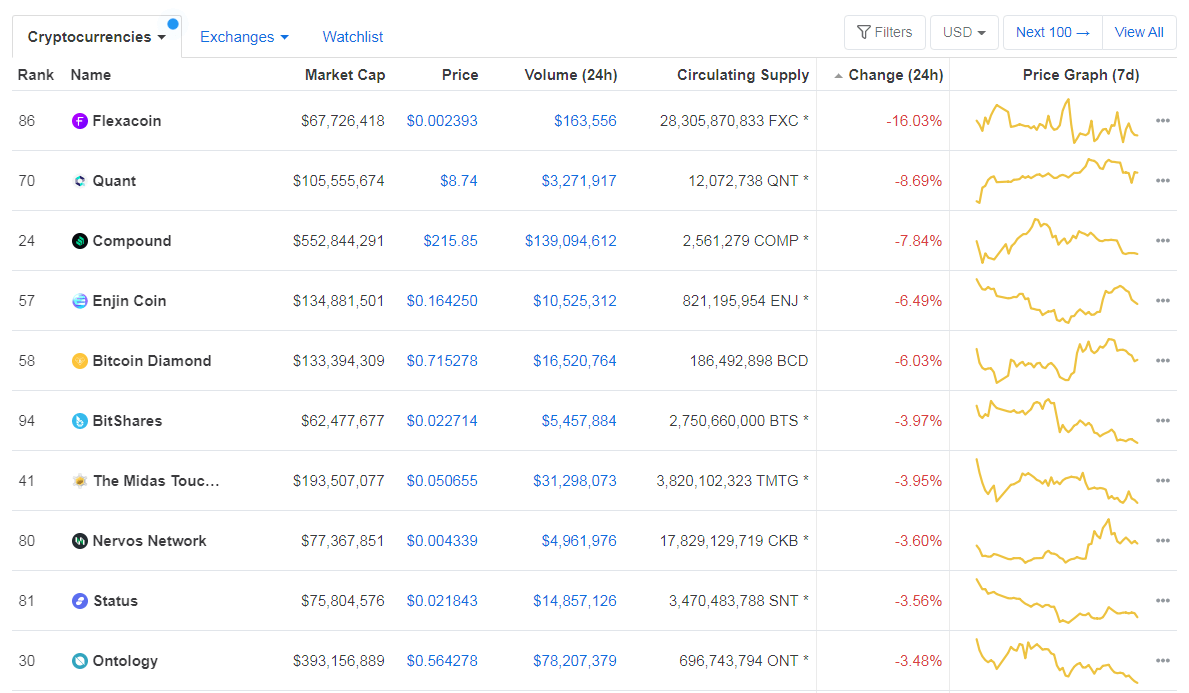
Top 10 24-hour Performers (Click to enlarge)
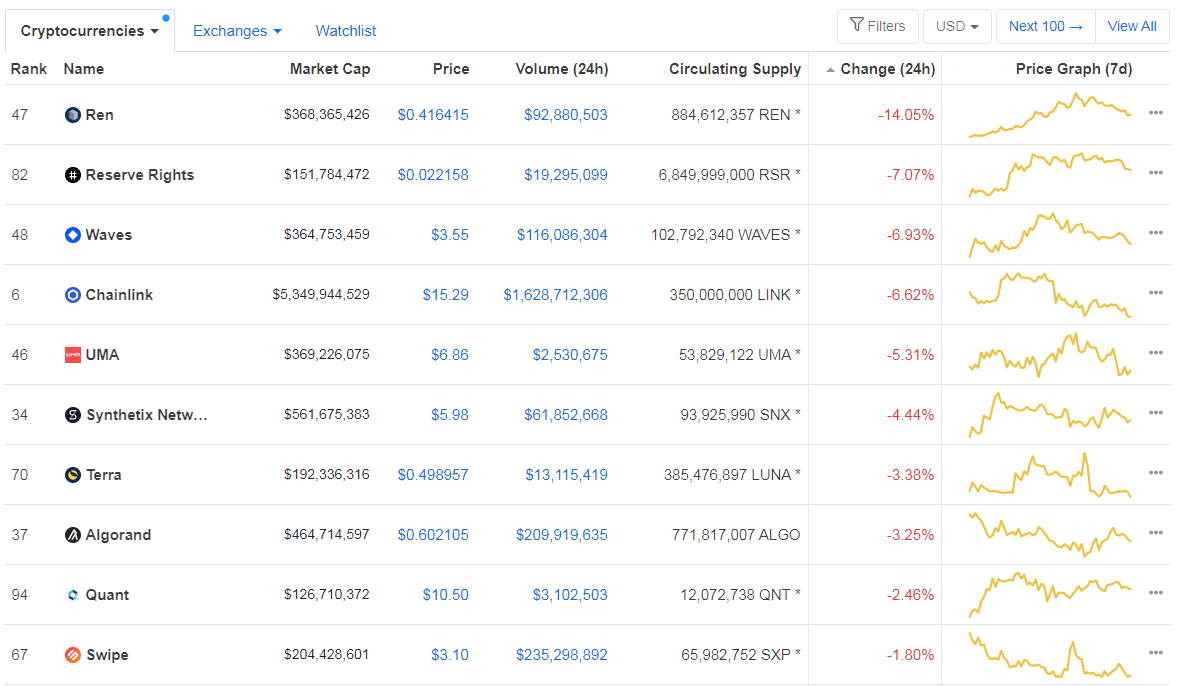
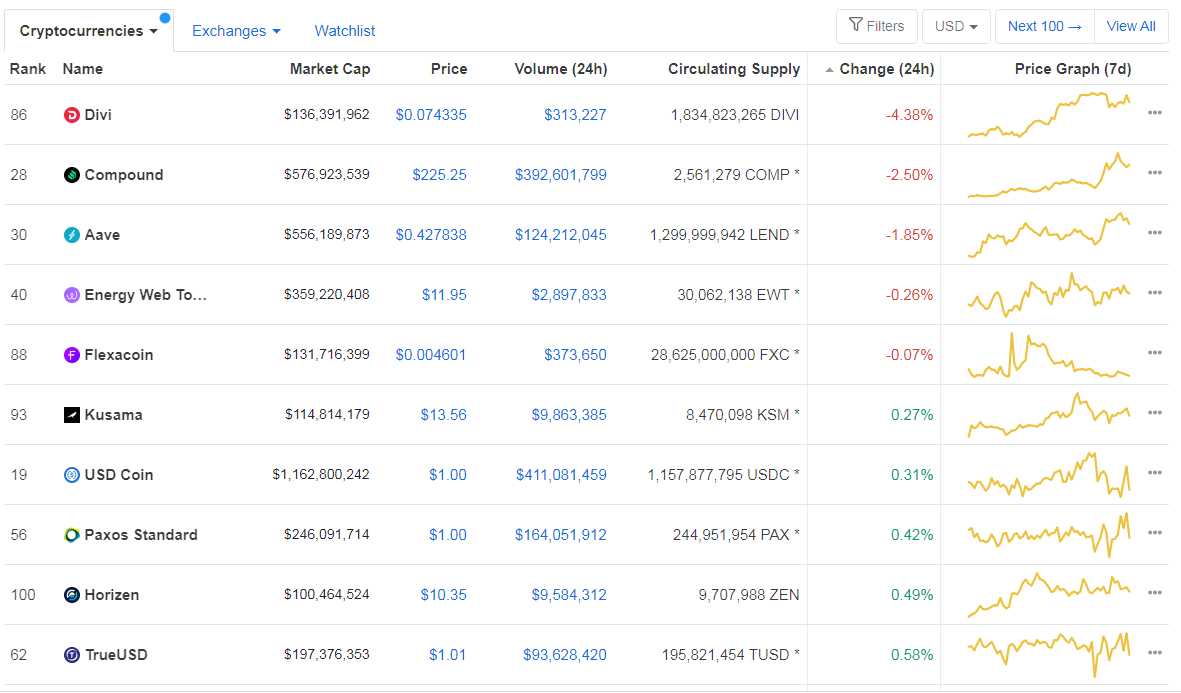
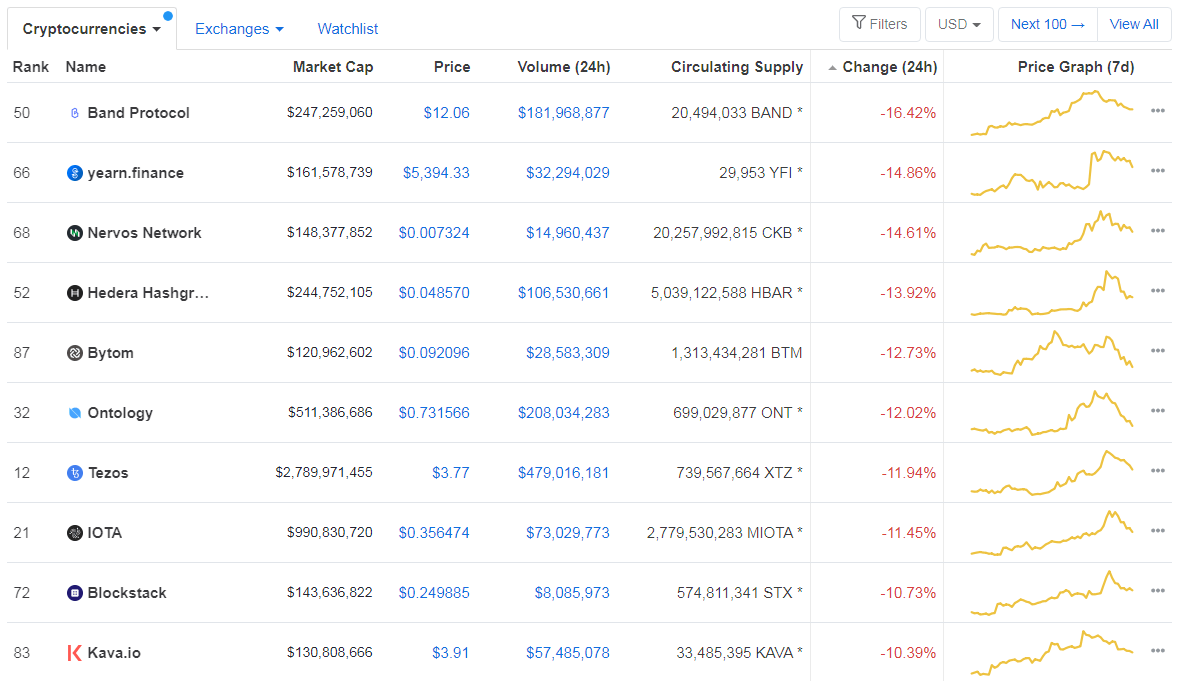
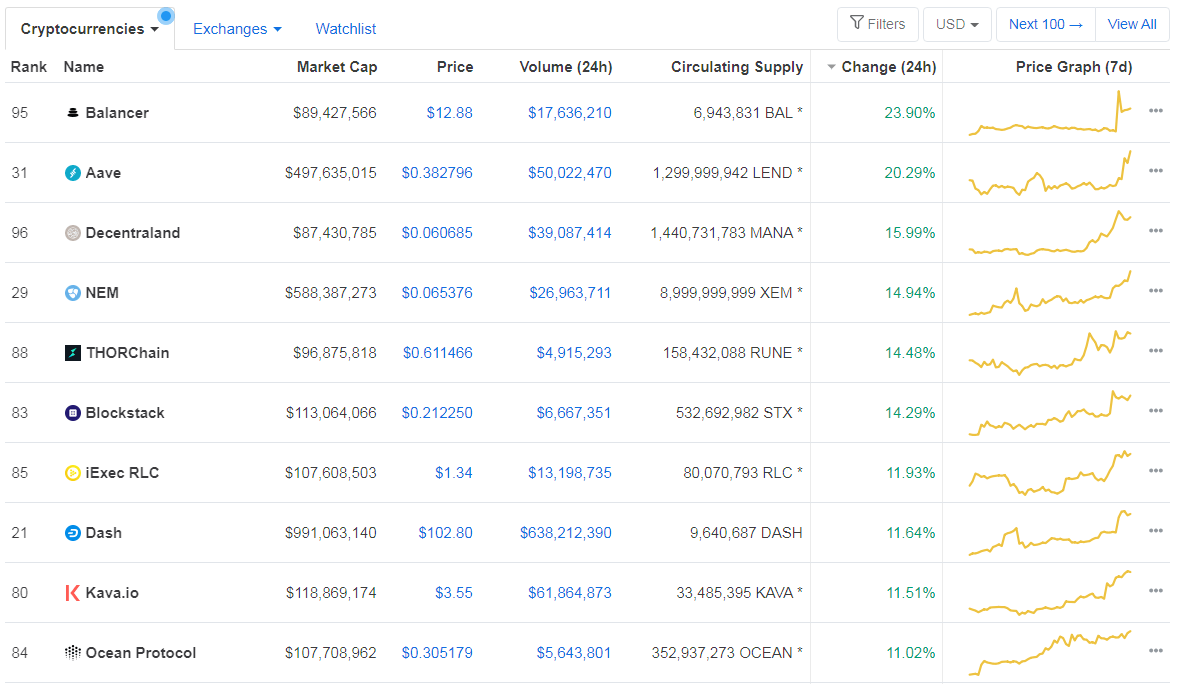
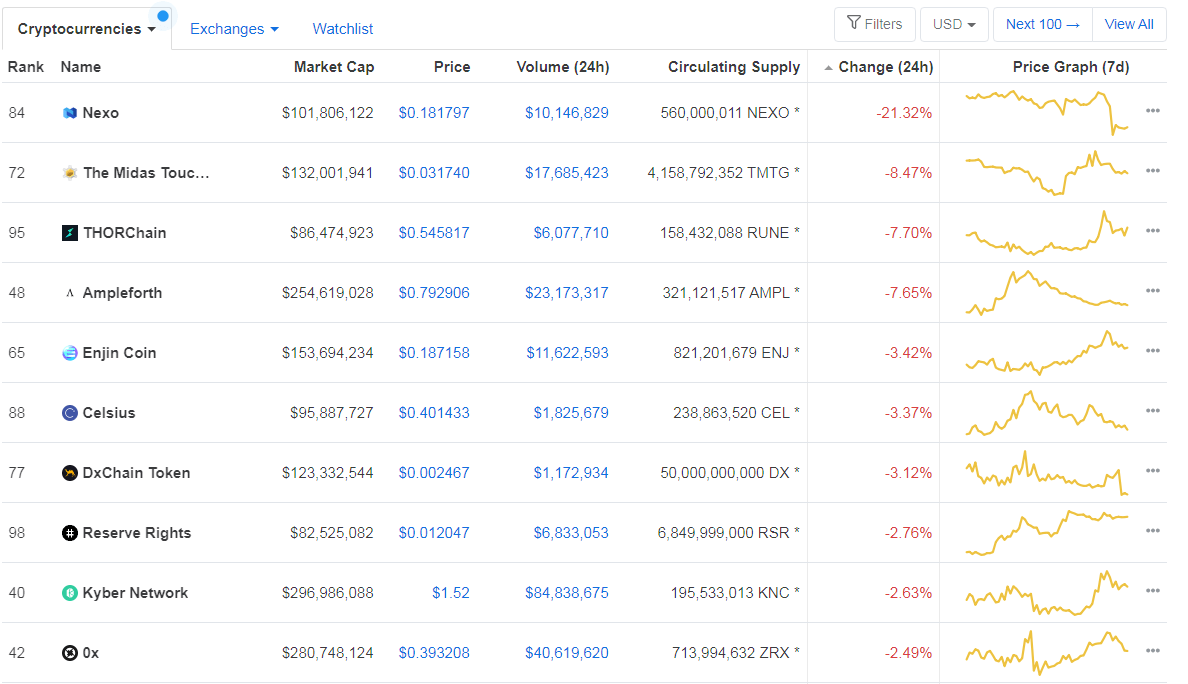
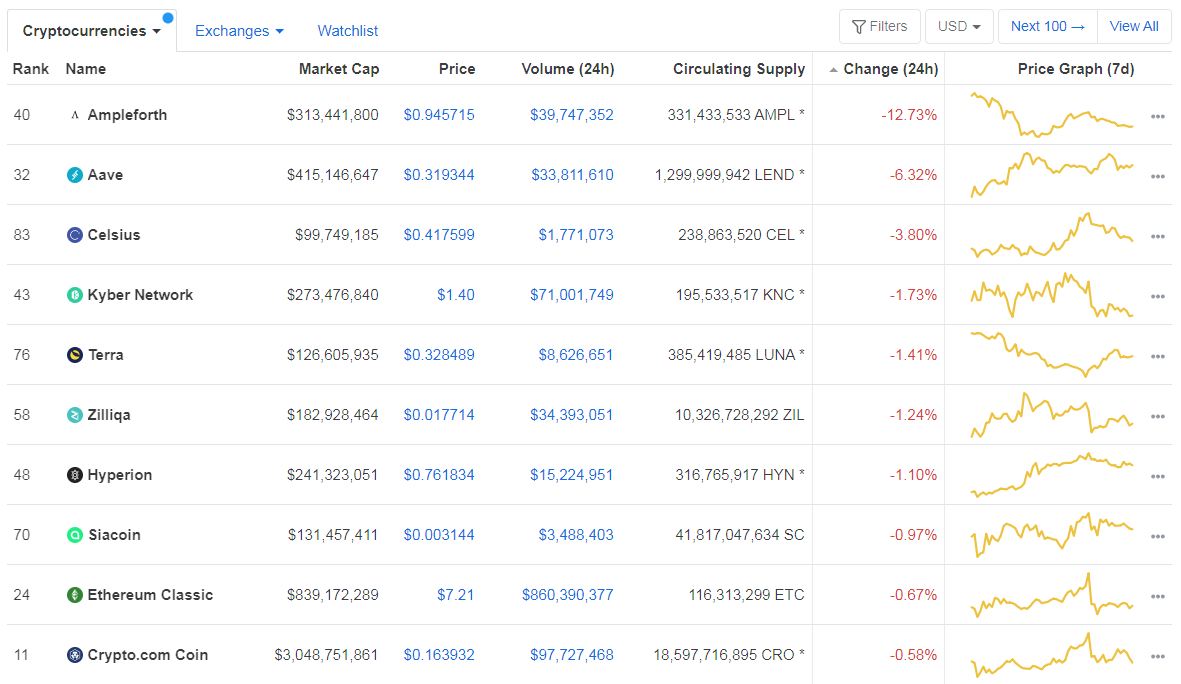
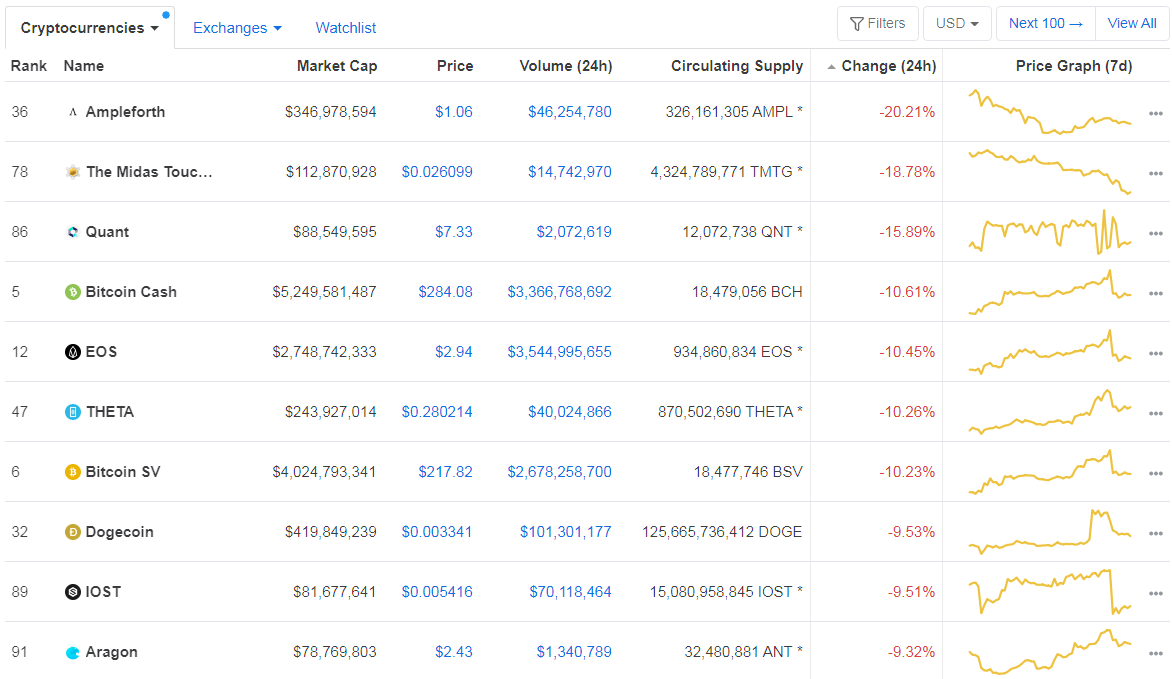
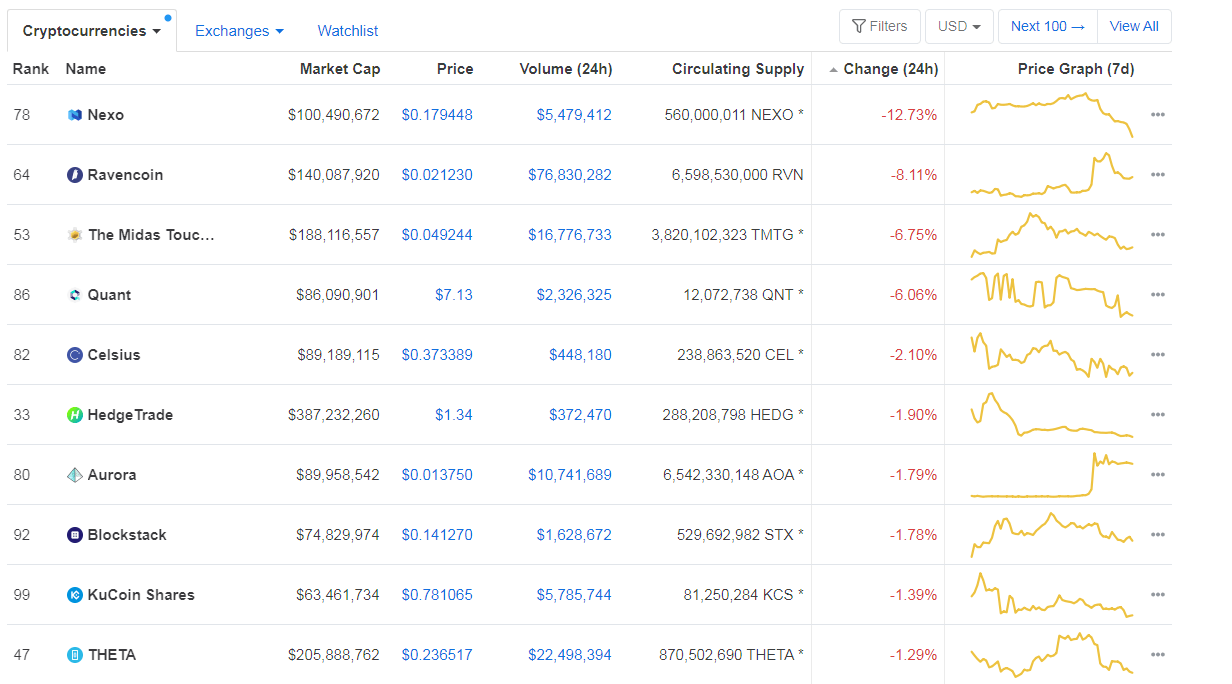
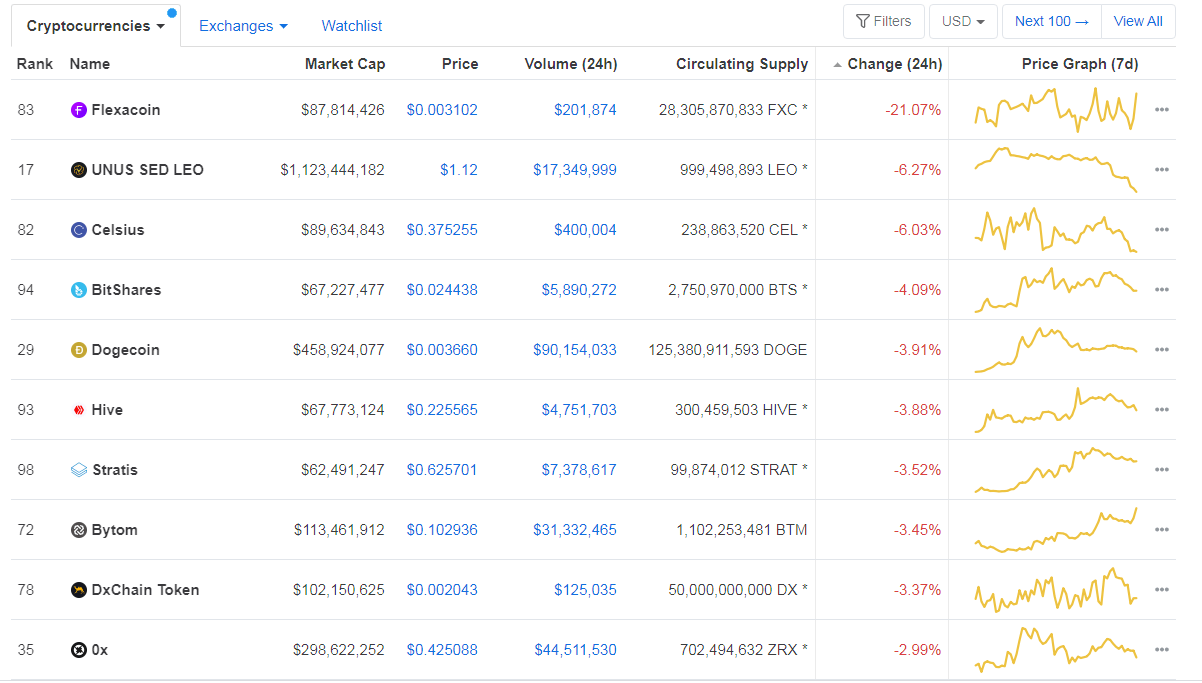
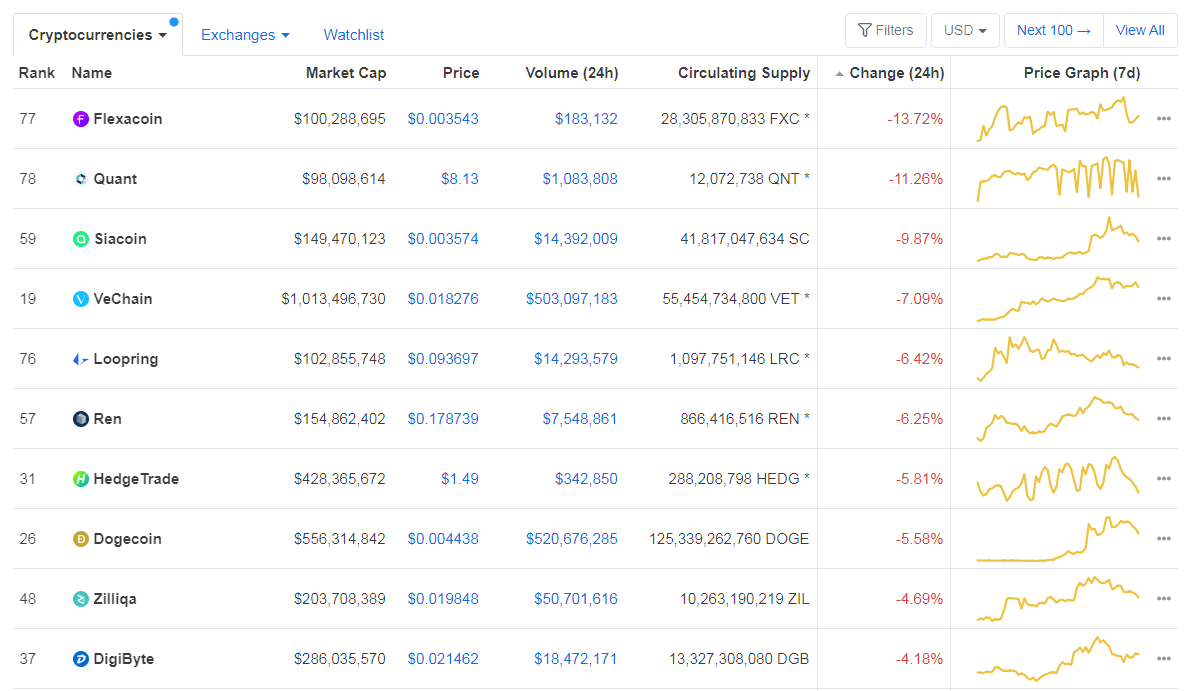
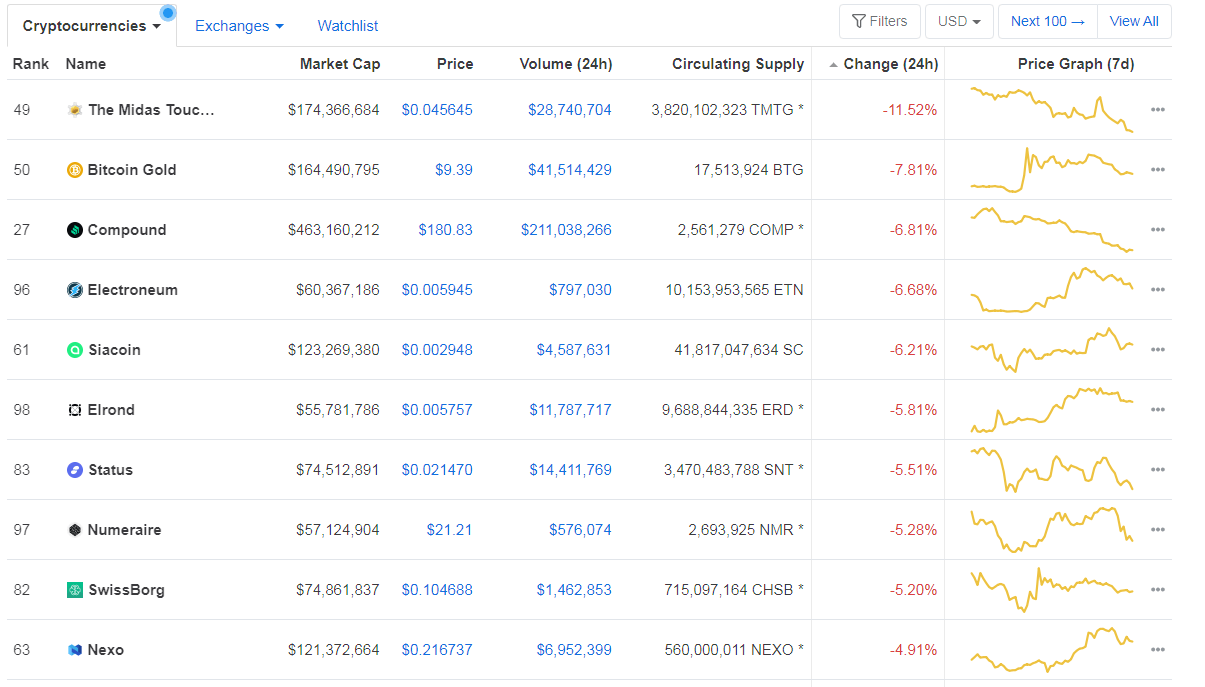
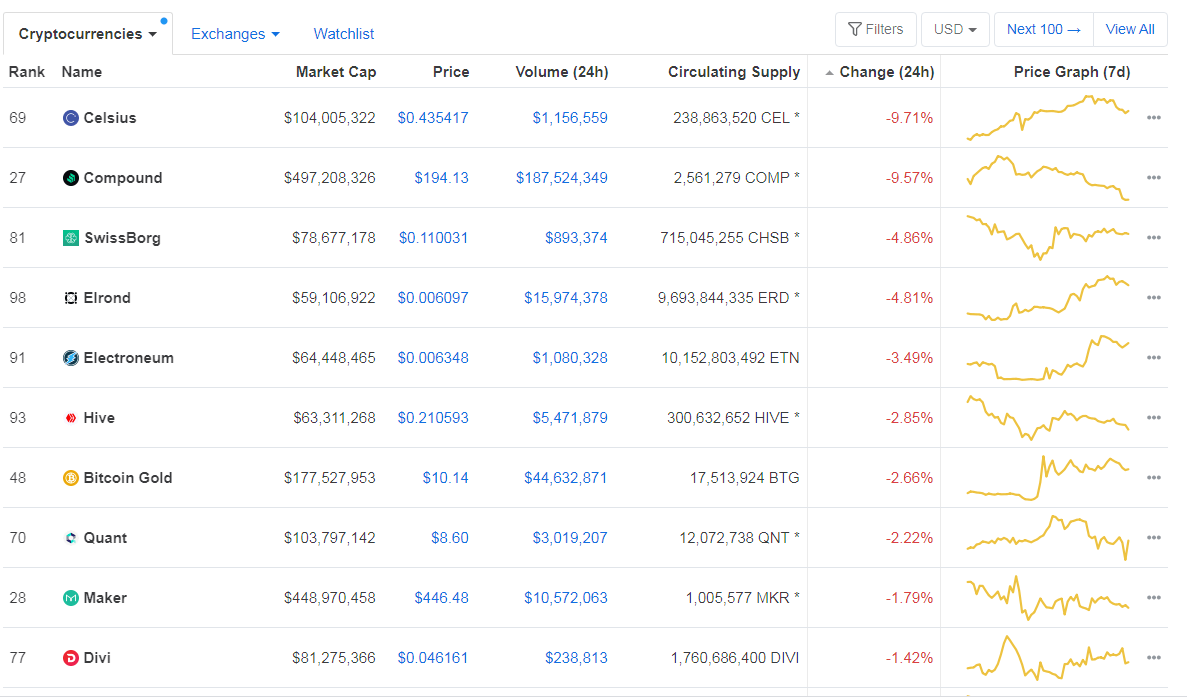
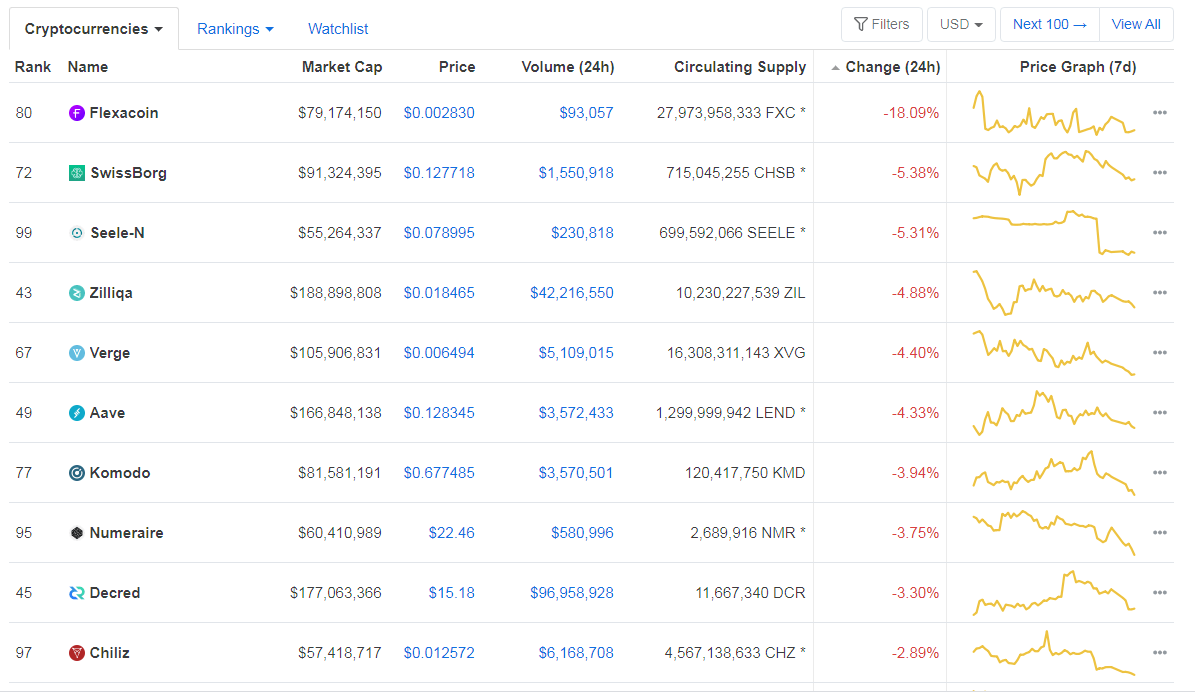
Bottom 10 24-hour Performers (Click to enlarge)
Bitcoin’s dominance level has decreased slightly and went under the 60% mark yet again, with its value currently at 59.74%. This value represents a 0.7% difference to the downside when compared to our last report.
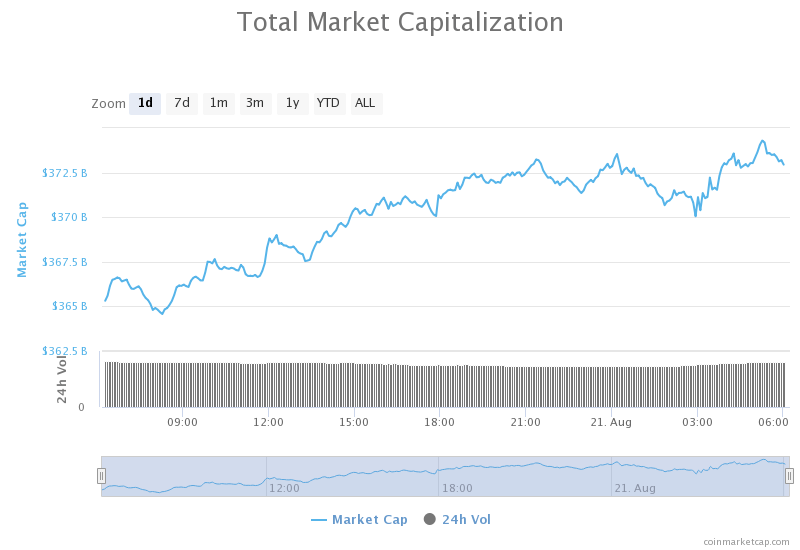
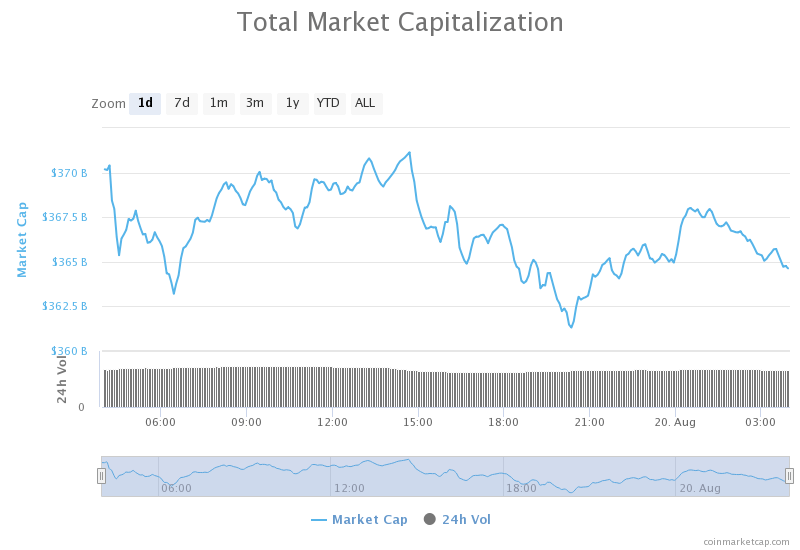
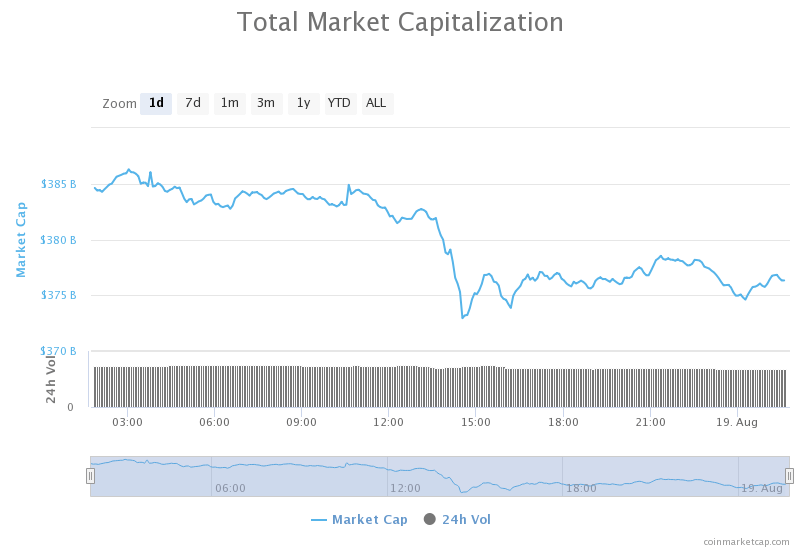
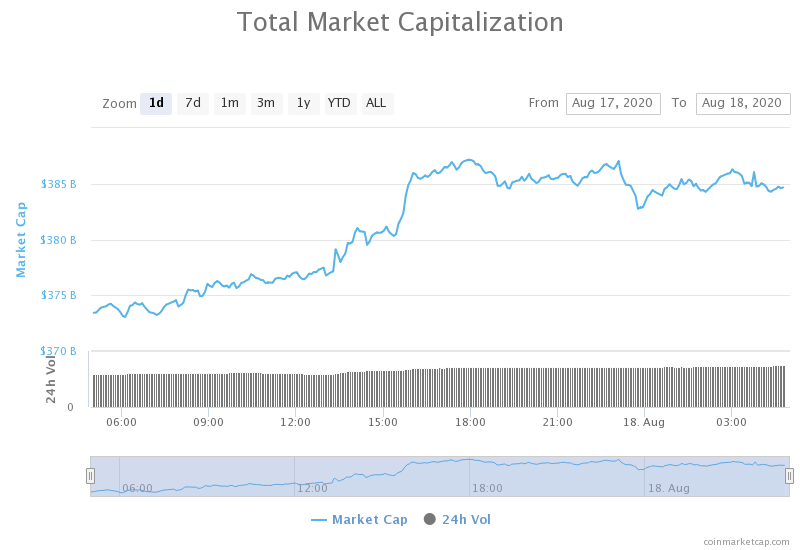
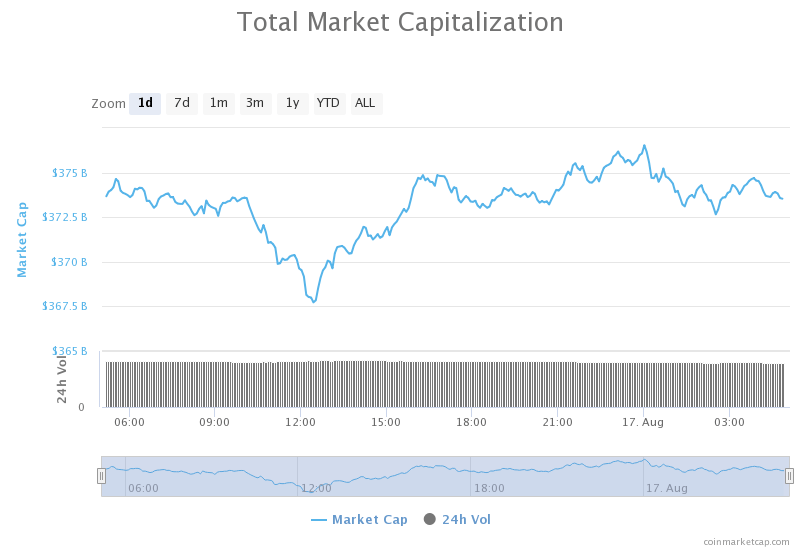
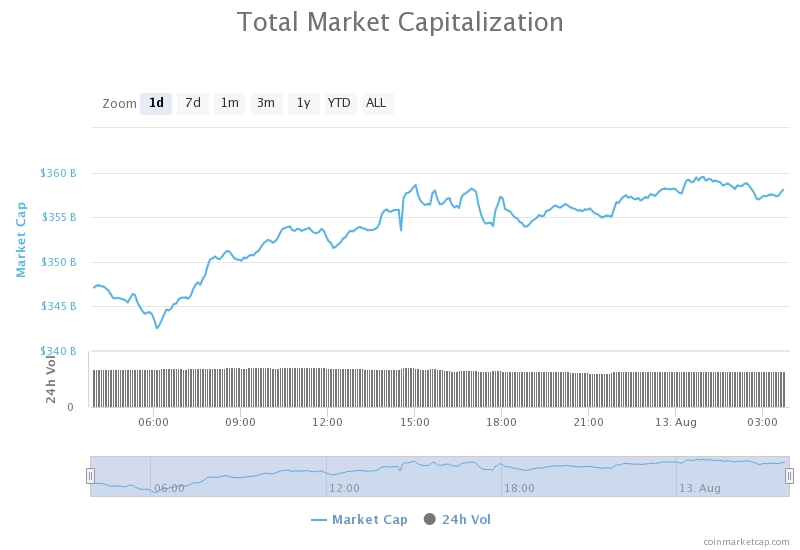
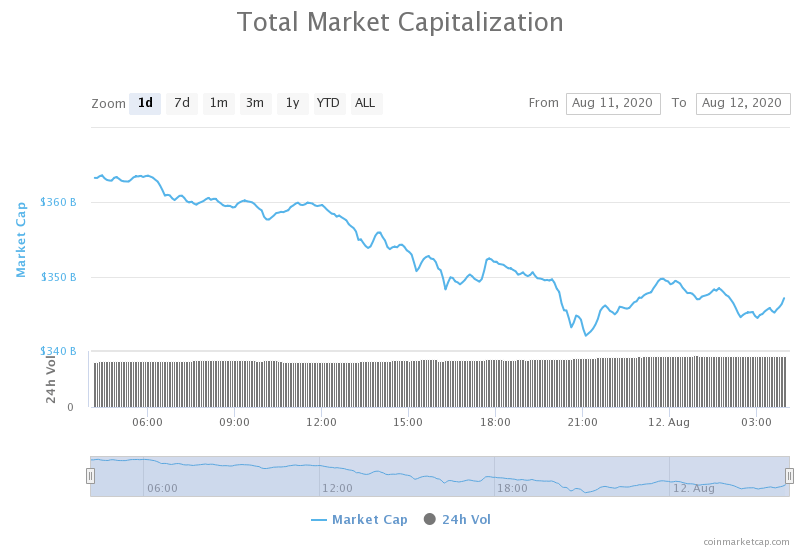
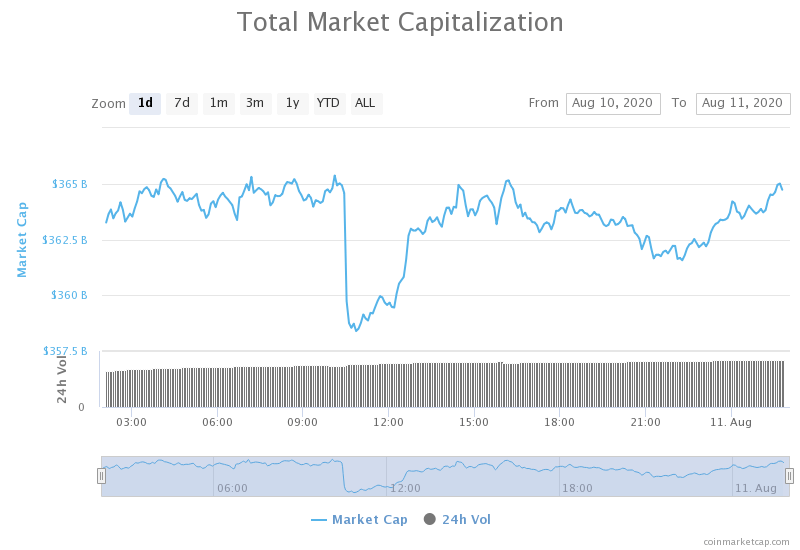
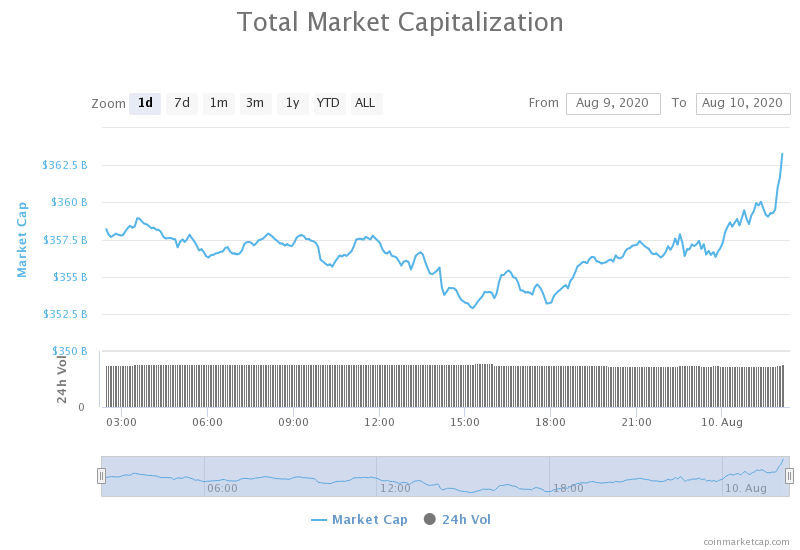
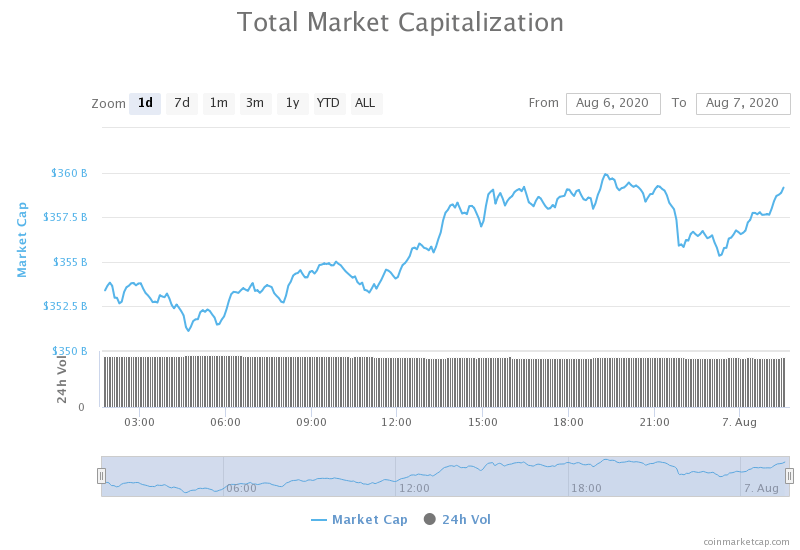
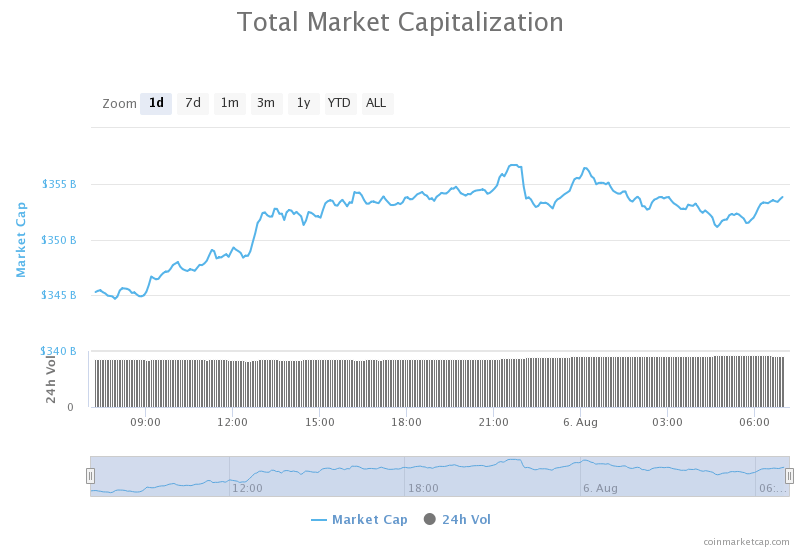
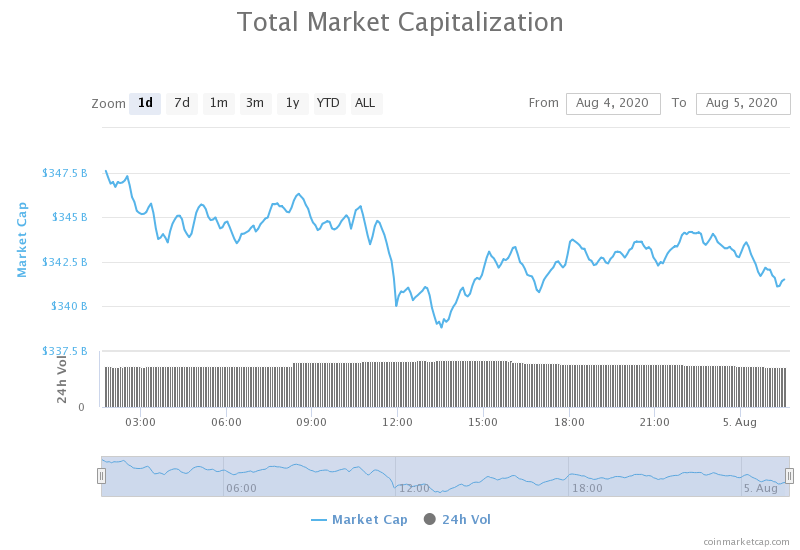
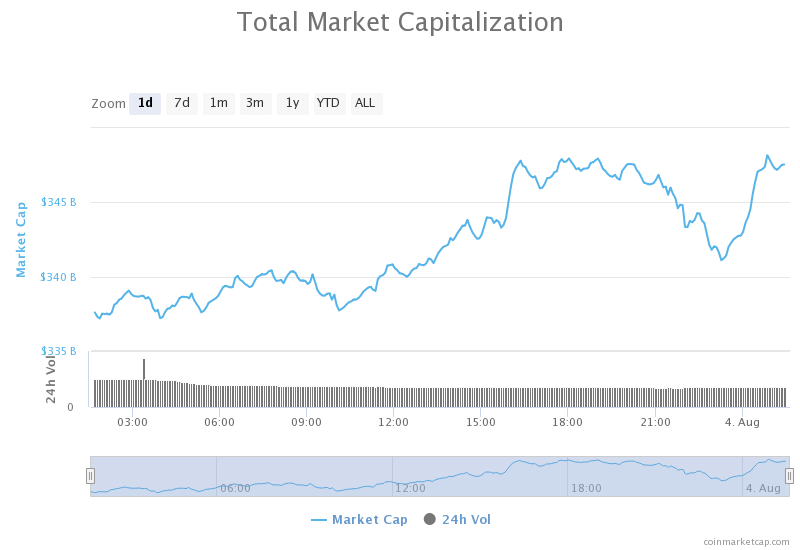
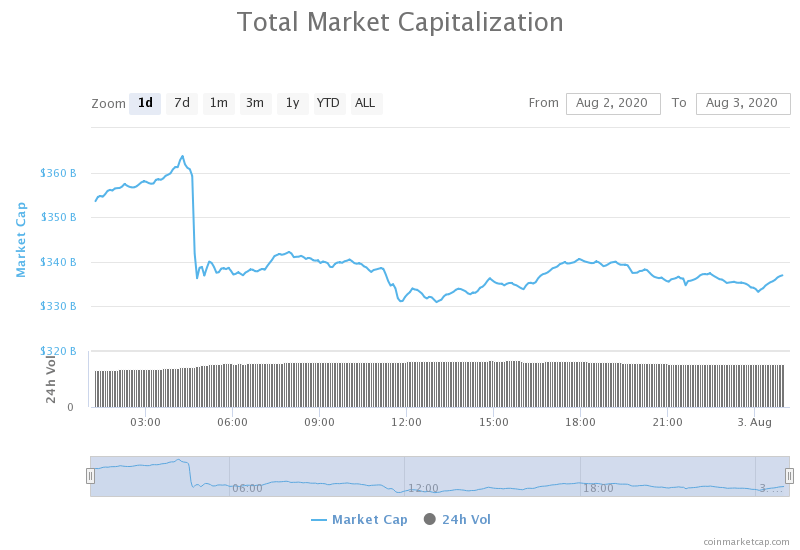
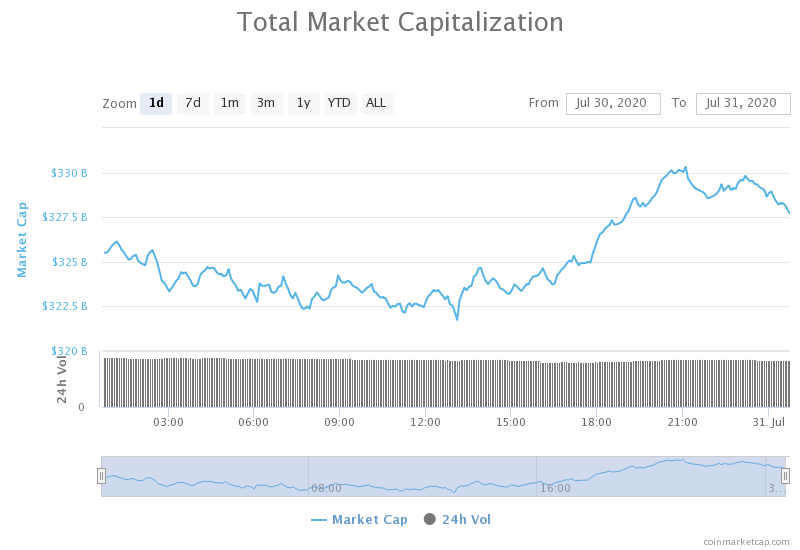
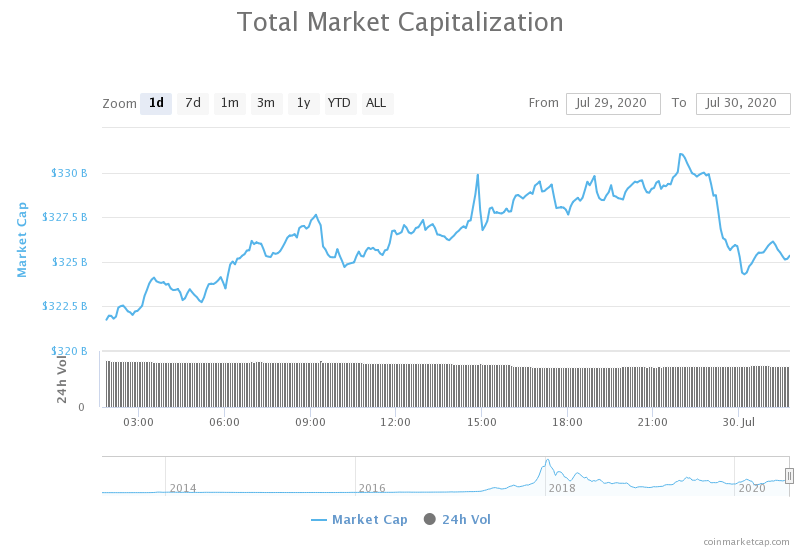
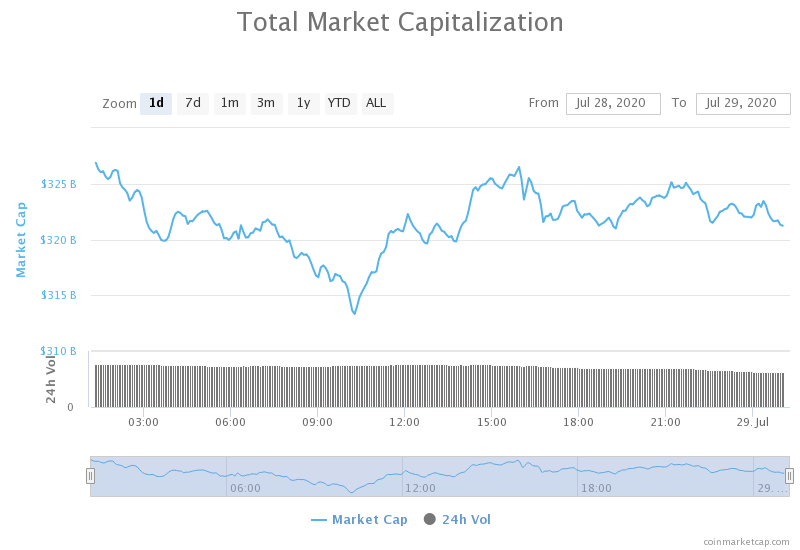
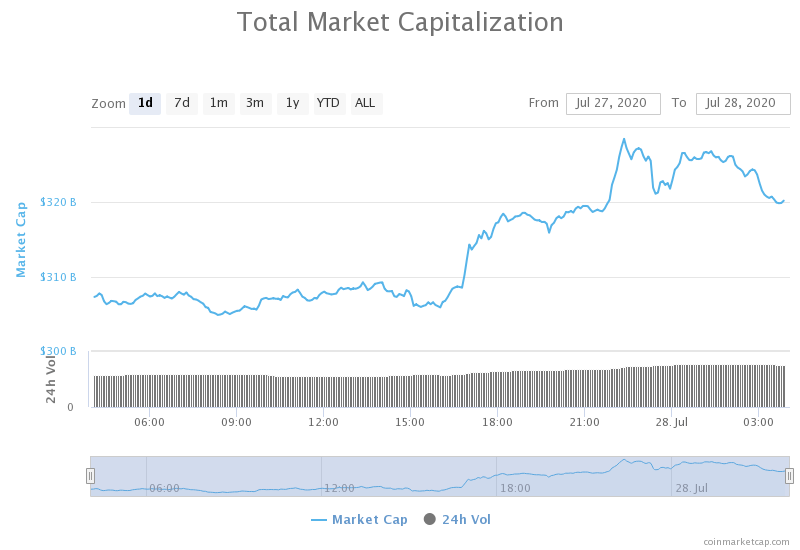
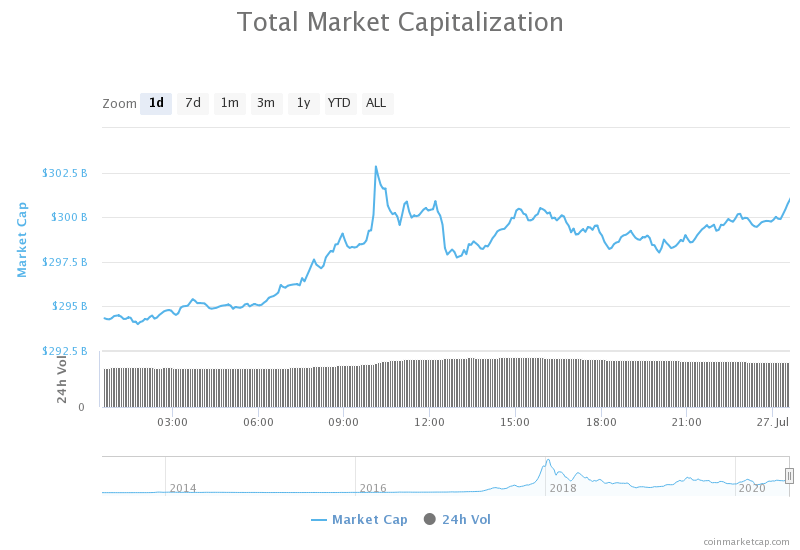
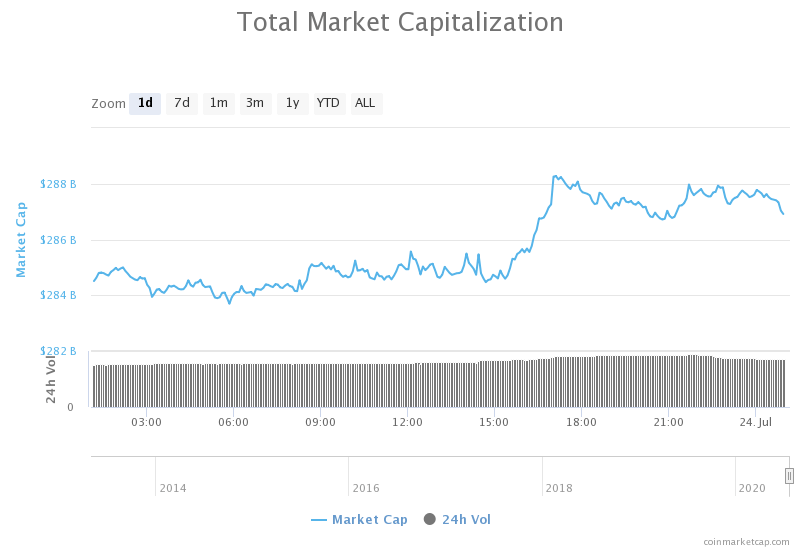
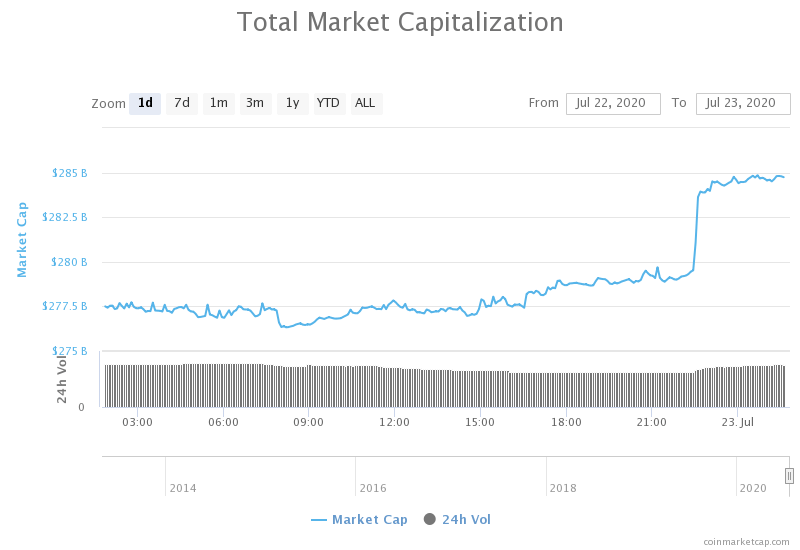
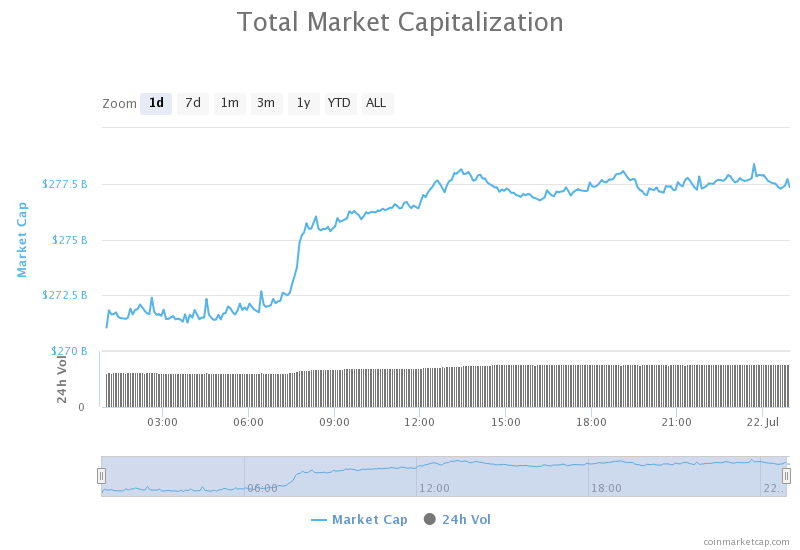
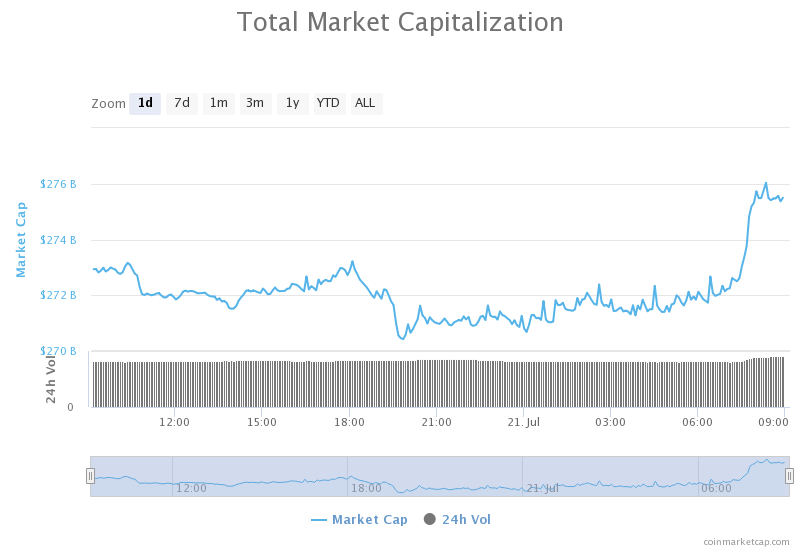
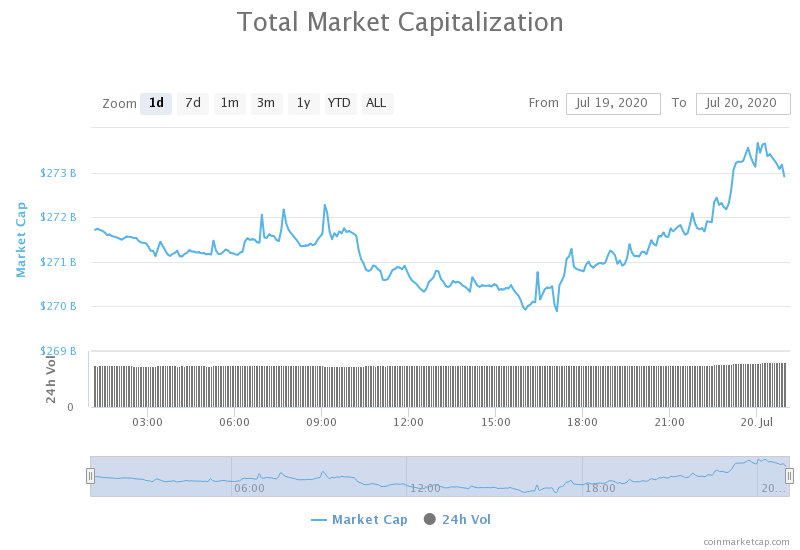
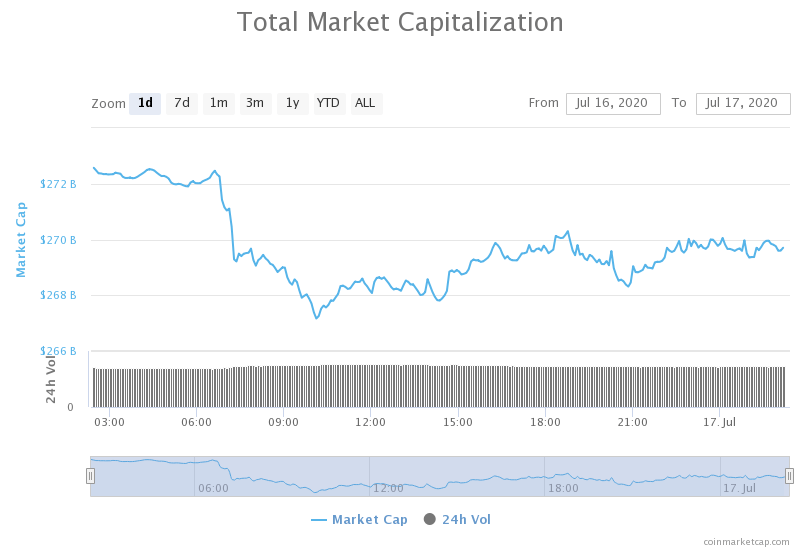
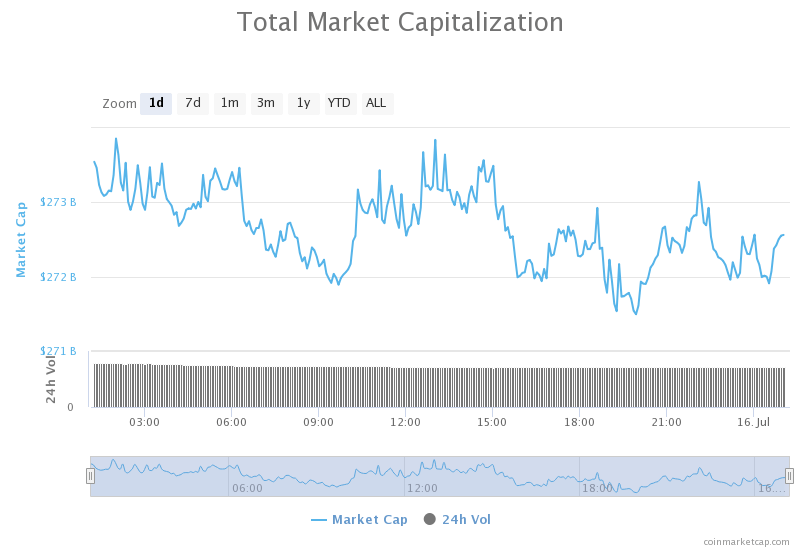
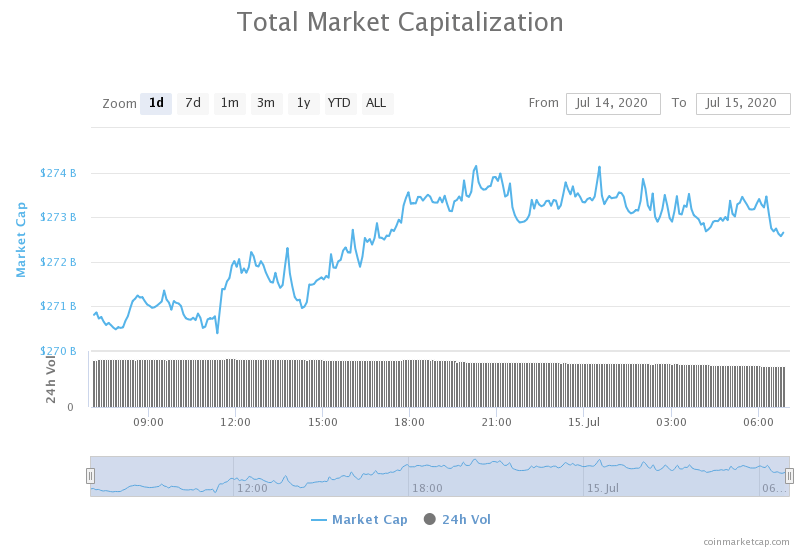
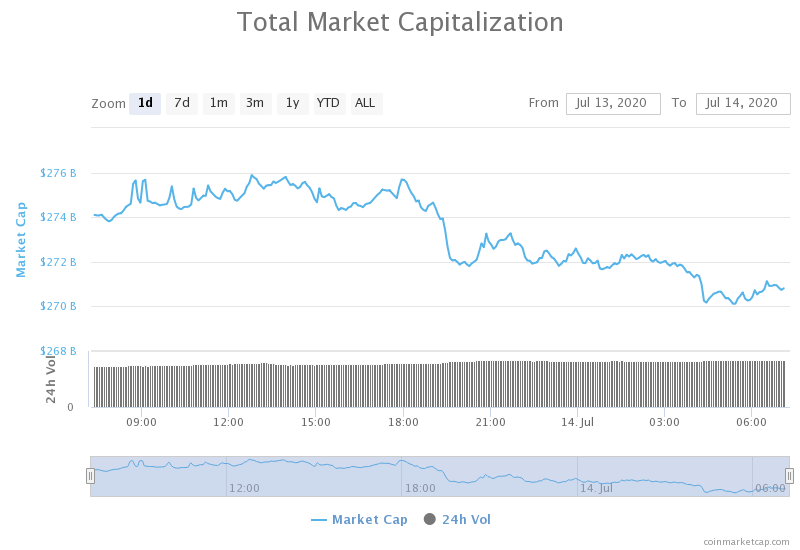
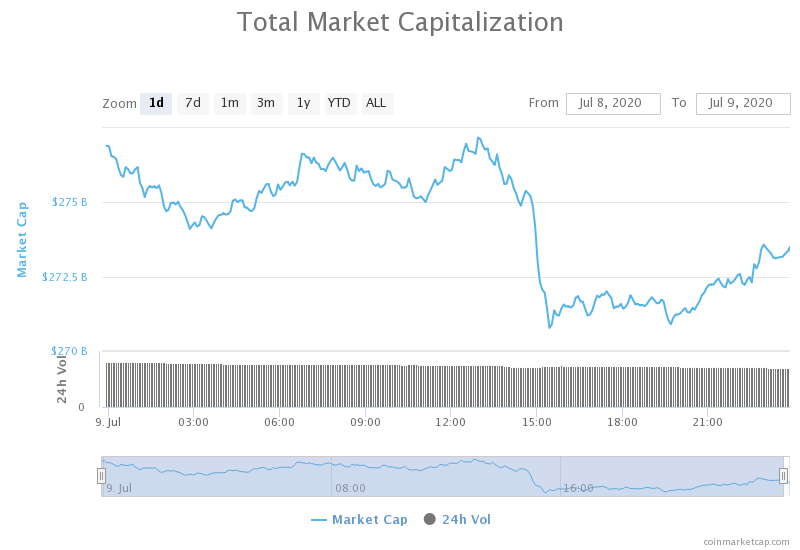
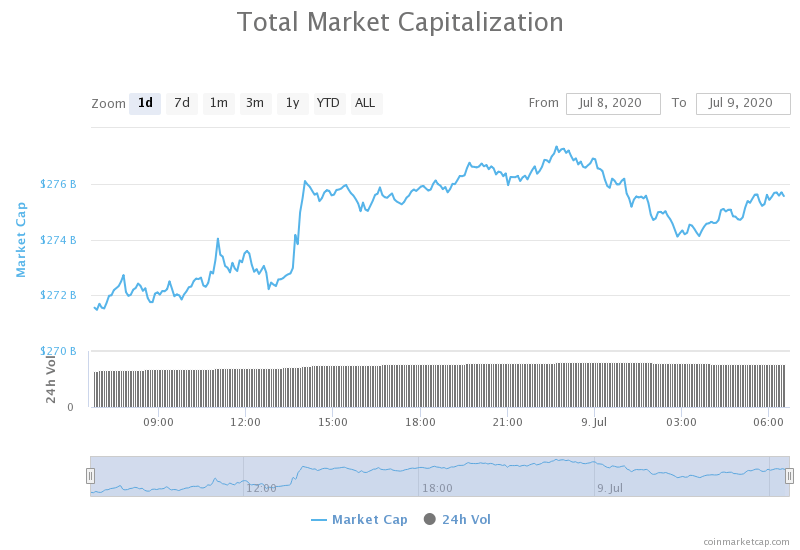
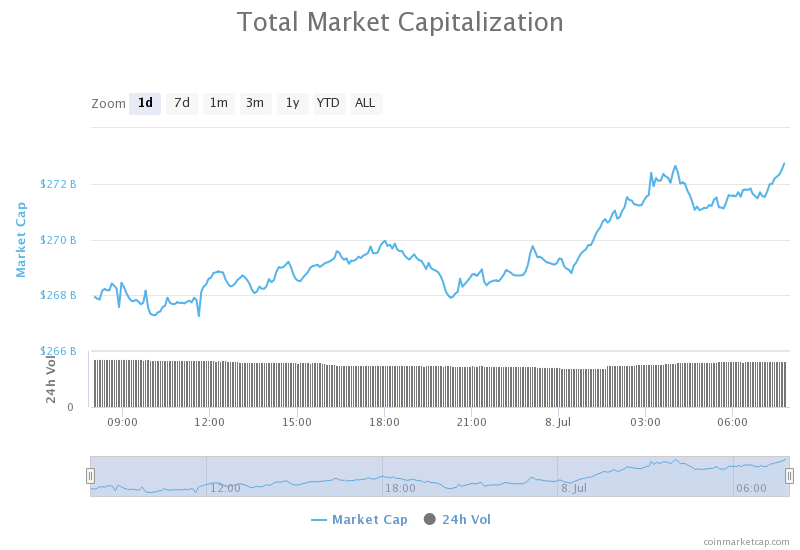
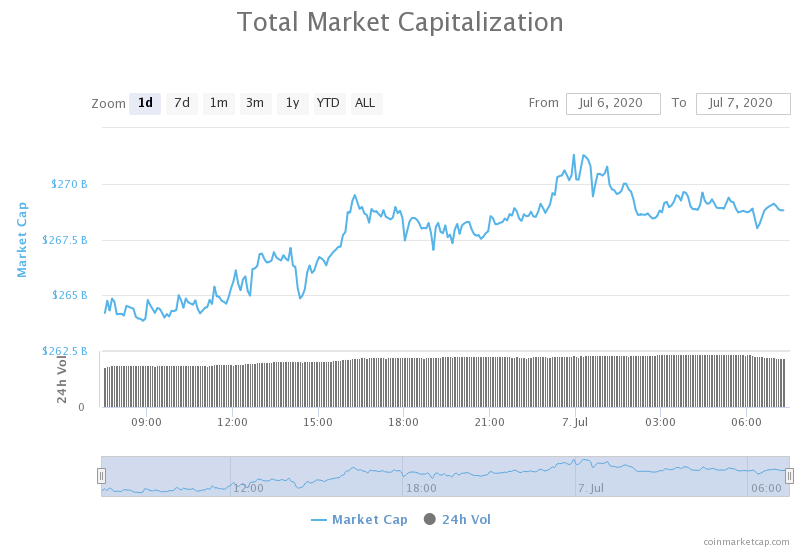
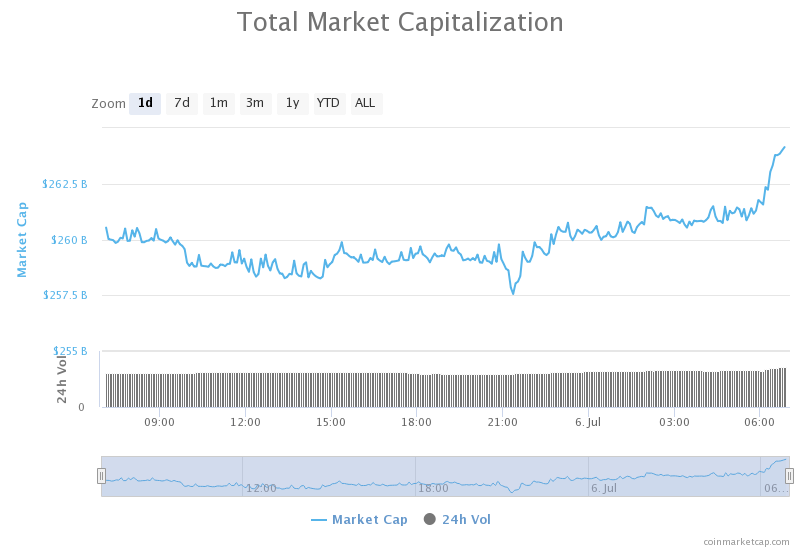
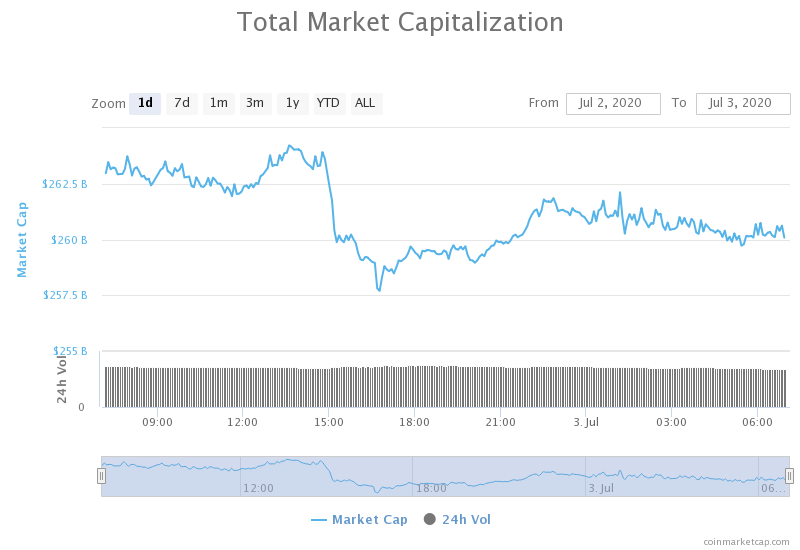
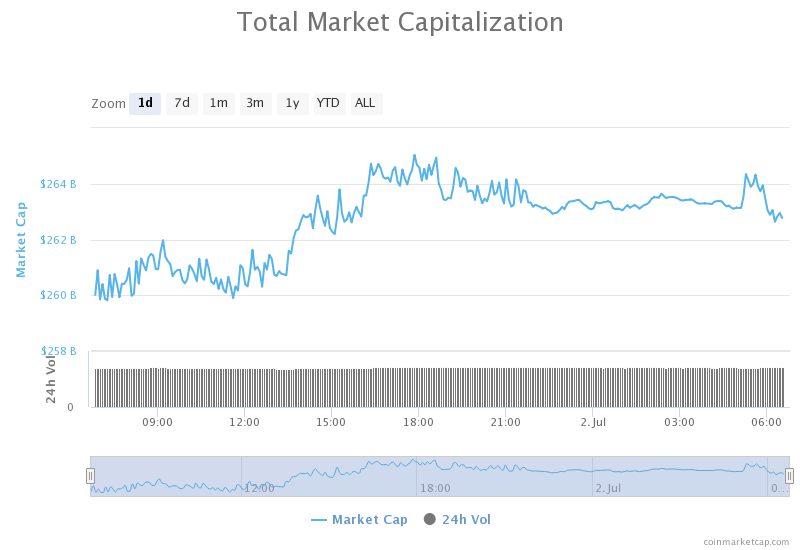
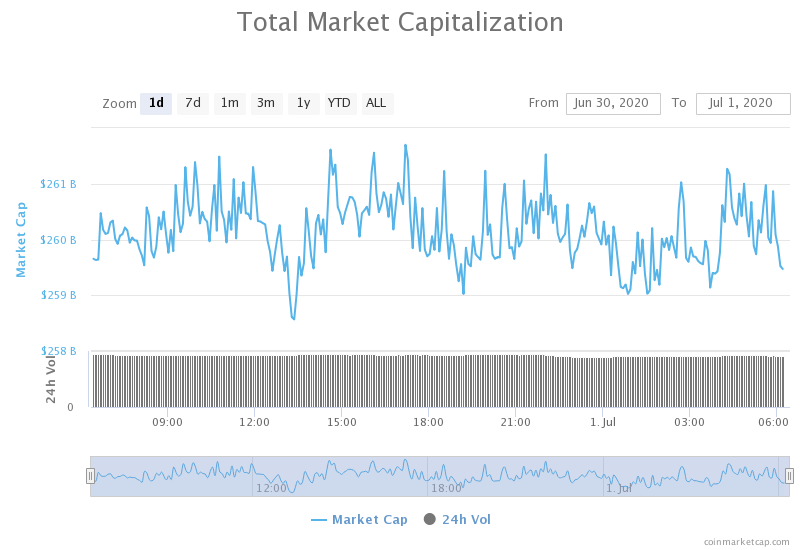
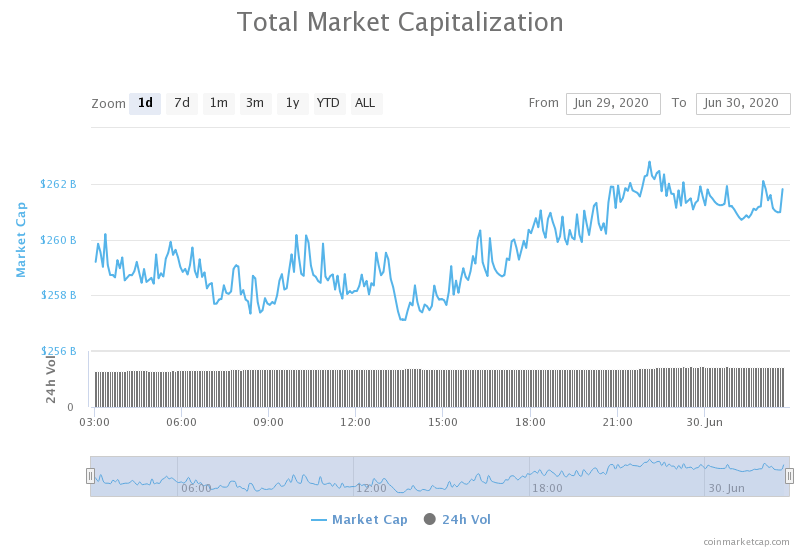
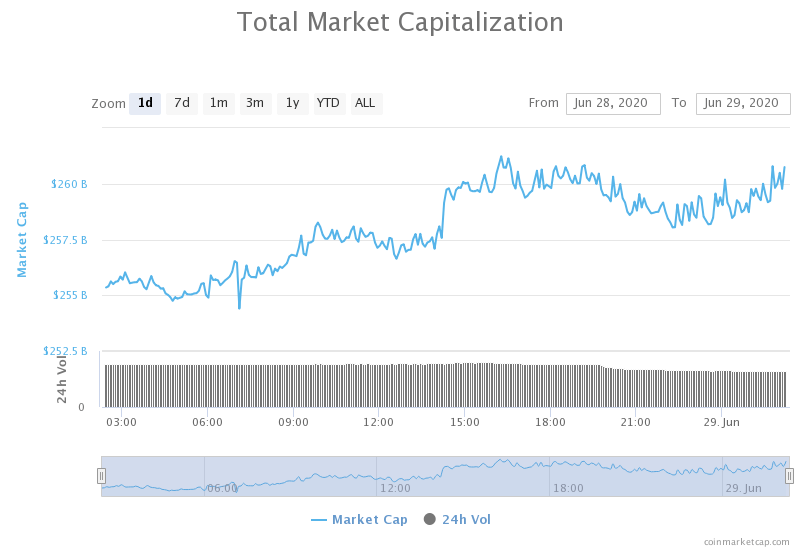
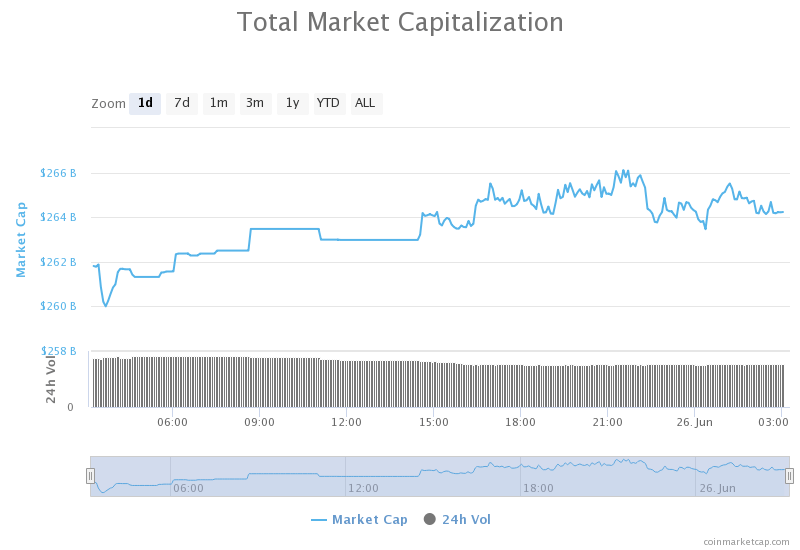
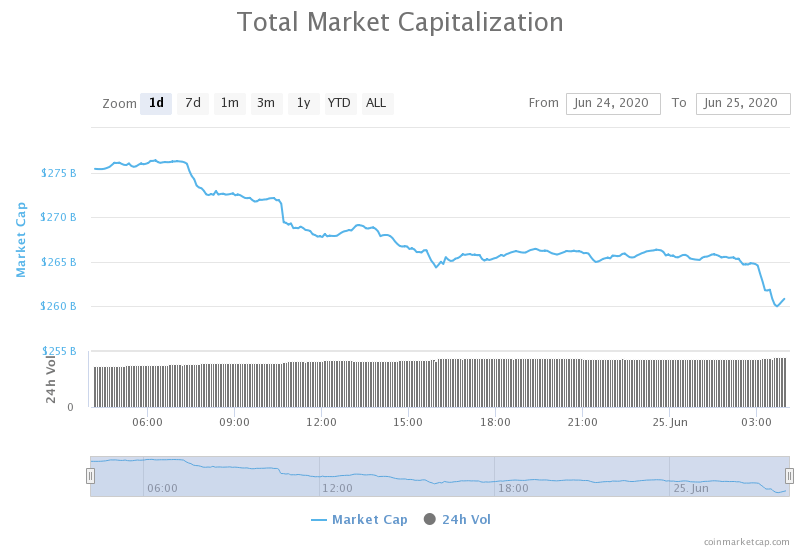
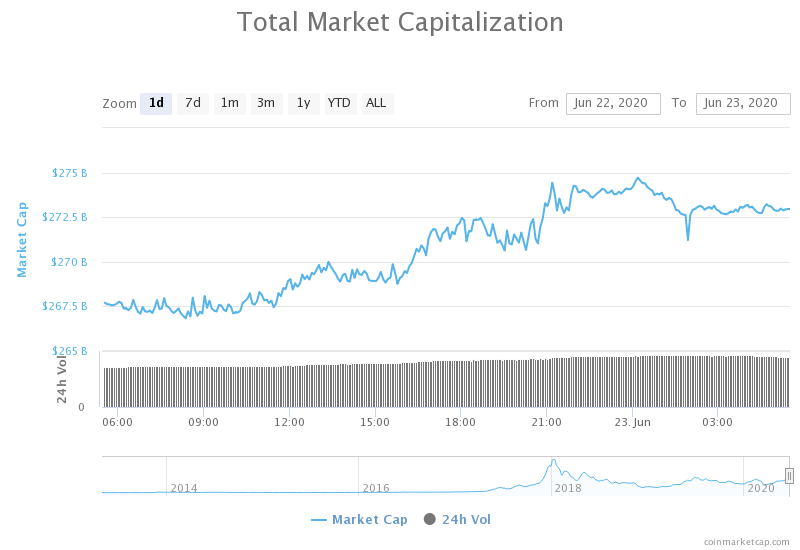
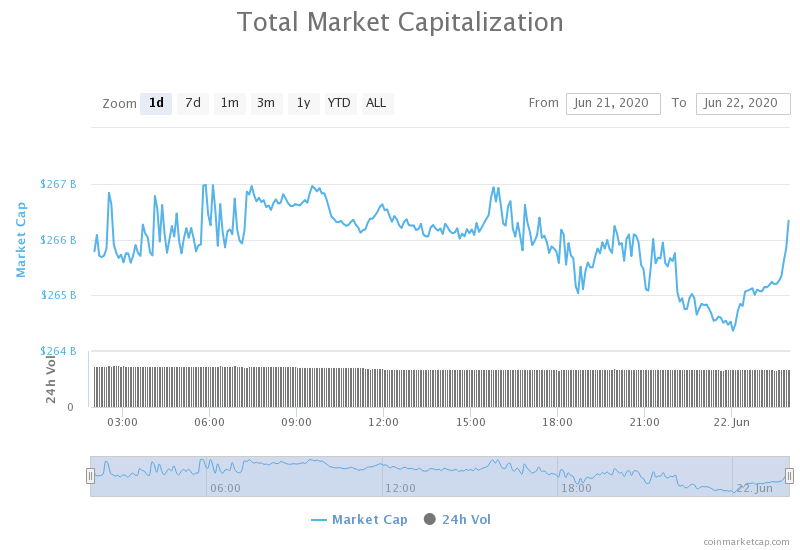
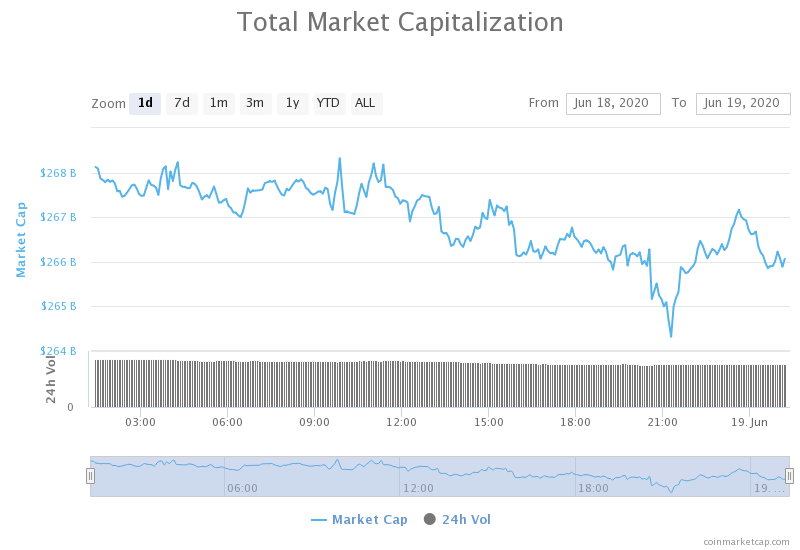
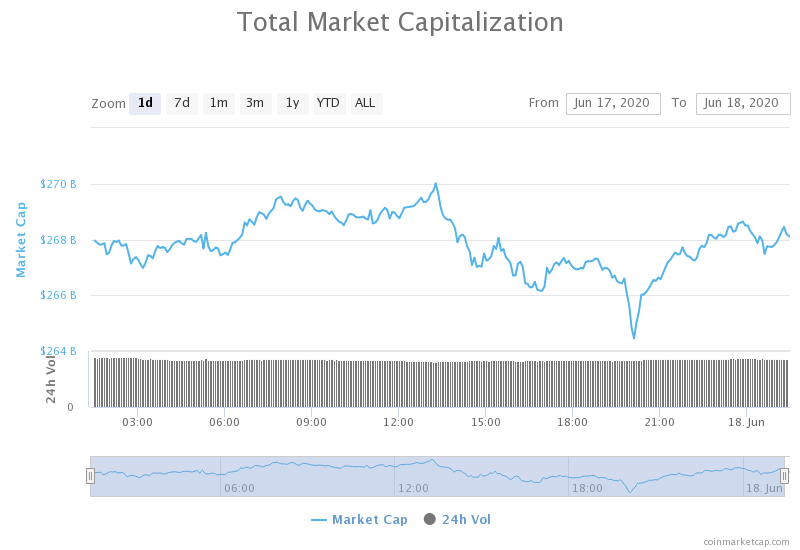
Daily Crypto Market Cap Chart
The cryptocurrency market cap experienced a sharp increase in value over the course of the day. Its current value is $373.17 billion, which represents an increase of $9.41 billion when compared to our previous report.
_______________________________________________________________________
What happened in the past 24 hours?
_______________________________________________________________________
- Tether is moving 1 billion USDT coins from TRON to Ethereum blockchain (The Block)
- Ripple exec says 20% of RippleNet transactions occur using XRP (The Block)
- ETC Labs proposes a multi-stage plan for securing Ethereum Classic against 51% attacks (The Block)
- Lightning Labs activates Wumbo channels, increasing bitcoin payment channel capacity (The Block)
- Swiss firm raises $15M to build out DeFi data platform (The Block)
- Investors pinpoint DeFi insurance as the next big thing—YFI keeps surging (Cryptoslate)
- DeFi yield farming is an “unsustainable zero-sum game”: Ethereum innovator (Cryptoslate)
- INX Crypto Exchange to Launch $117M IPO Next Week (Coindesk)
- Grayscale: Bitcoin Market ‘Looks Like 2016, Before Historic Bull Run’ (Cointelegraph)
- Shock: Ethereum Miners Against Proposal to Reduce Block Rewards by 75% (Cointelegraph)
_______________________________________________________________________
Technical analysis
_______________________________________________________________________
Bitcoin
After a failed breakout of the ascending triangle, Bitcoin’s price started moving down sharply towards $11,630. The move, as we noted in our previous articles, stopped there. Bitcoin spent the past 24 hours mostly consolidating after a brief moment of bullish presence, which brought its price above $11,800 levels.
This move towards the upside, no matter how small it is, shows that Bitcoin is in a great spot at the moment, and it would take a lot to shake it out of this extremely bearish mid-term position.
BTC traders should be looking for a trade above $12,000, or after the push towards it fails.
BTC/USD 4-hour Chart
Technical factors:
- Price is at its 50-period EMA and below its 21-period EMA
- Price slightly below its middle band
- RSI is neutral (48.45)
- Volume is average (descending)
Key levels to the upside Key levels to the downside
1: $12,015 1: $11,630
2: $12,300 2: $11,460
3: $12,900 3: $11,090
Ethereum
Ethereum spent the day struggling at the $415 level, as the fight for whether it will end up above or below the level is still continuing. The second-largest crypto by market cap recovered from its drop to $395 after hitting a semi-descending line, which acted as support/resistance since Aug 5.
This fight for $415 clearly shows the fight between two mindsets: bulls who are extremely bullish when it comes to DeFi and everything related, and bears which are scared of the skyrocketing ETH transaction fees as well as of the ICO scenario that happened around 2017.
Ethereum traders should wait for ETH to establish itself above or below $415 before trading.
ETH/USD 4-hour Chart
Technical Factors:
- Price is currently at its 21-period and its 50-period EMA
- Price is at its middle band
- RSI is neutral (47.15)
- Volume is slightly below average
Key levels to the upside Key levels to the downside
1: $415 1: $400
2: $445 2: $361
3: $496 3: $340
Ripple
XRP’s chart looks a lot like BTC’s chart in the past couple of days. The third-largest cryptocurrency by market cap stopped moving towards the downside after hitting $0.285, which held up quite nicely. XRP then got a small boost towards the $0.29, where it is now consolidating.
With both 21-period and 50-period moving averages right above the price, XRP would require a strong bullish initiative in order to move towards $0.31, which (at the moment) seems unlikely.
Traders can look for an entry within the range between $0.285 and $0.31.
XRP/USD 4-hour Chart
Technical factors:
- Price is currently below the 21-period and 50-period EMA
- Price is slightly below the middle band
- RSI is neutral (46.15)
- Volume is descending (approaching average)
Key levels to the upside Key levels to the downside
1: $0.31 1: $0.285
2: $0.32 2: $0.266
3: $0.332 3:$0.2454