Market Activity Index MT4 is an indicator that was created in May 2016 by developer Young Ho Seo. This new technical indicator was designed to detect a quiet market period before the start of a highly volatile market. Like many excellent technical indicators, this indicator is very stable and widely applicable to many financial and non-financial instruments without too many restrictions.
Overview
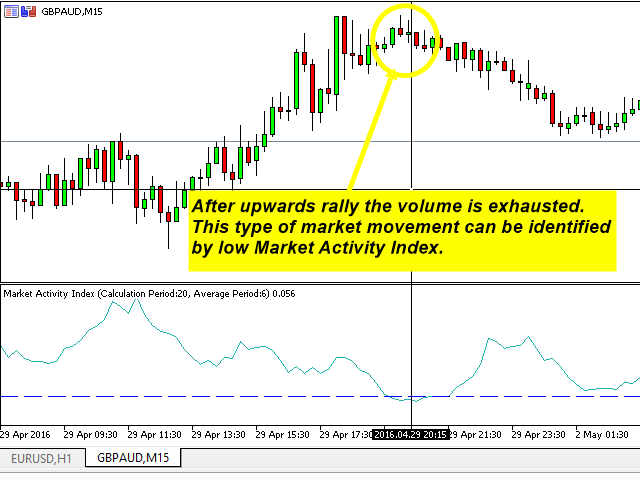
The market activity index can be better used to visualize the alternating form of the low and high volatile markets. It is a very useful tool to pick up the quiet market, but ironically this is a very powerful tool to predict the highly volatile market.
The most important thing about the Market Activity Index is that the reading of this indicator is limited by its upper limit (1.0) and lower limit (0.0), but for the lower limit, it will never diverge from actual price movements. This means that for the reading of 0.08 Market Activity Index cannot be calculated from a highly volatile price movement.
To understand how essential this concept is, imagine that the price can go even higher even after the RSI reading indicates more than 70 signal overbuy (This can happen to 99% of oscillators.). The same can happen to ADX or most technical indicators. For example, 25 ADX read can still be calculated even if there was a fairly extreme price movement before. One might say that these are a false signal or a sign of delay. This Indicator is not a magic indicator, but it will make your job of reliably notifying the quiet or side market period to traders most of the time. This tool can help you understand and learn the pace of the market.
The Market Activity Index is designed to range from 0.0 to 1.0 theoretically. Level 0.0 indicates a period of calm theoretically dead and level 1.0 theoretically indicates maximum volatility. But in reality, extremes 0.0 and 1.0 will not be achieved in practice. Instead, the values we may have will be 0.05 or 0.1 to identify the side or time span of minimum volatility. The levels between 0.05 or 0.1 additionally correspond to the common critical value of 95% or 90% used in statistical hypothesis tests.
According to the observations of this indicator, some currency pairs work best with 0.05 real value and for other currency pairs, 0.1 value works best. The choice of the critical value should be made on the basis of the price data itself.
The user may want to adjust the Market Activity Index for different currency pairs. Here is a brief explanation for each input variable:
- Calculation period: period for calculating the market activity rate
- Average period: period to soften the market activity rate
- Index Critical level: Critical level 0.05 or 0.1
- Index Critical level Width: Critical level line width
- Use the weighted average: true or false only (the weighted average is more sensitive than the unweighted average)
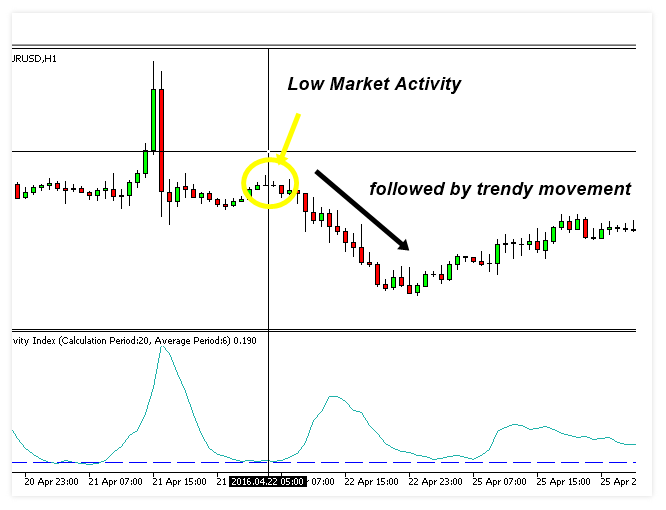
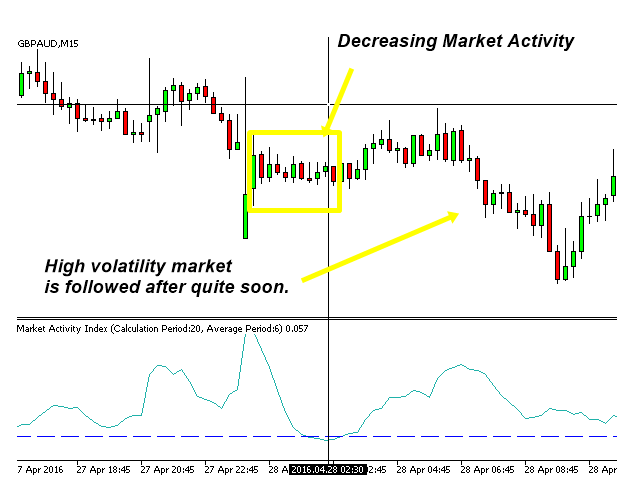
The market activity index can be better used to detect the lull in the market, which is also called the side market or low-volatility market. In practice, this period of calm is followed by a period of high volatility on a cyclical basis. The Market Activity Index itself represents the alternate image of market volatility in quantitative form. This indicator can successfully detect the start of a highly volatile market period. Although the market activity index often accurately detects the turning point, the market activity index does not aim to predict the direction of the market from its design stage.
This indicator is an excellent tool to inform us about the low volatility or side market. However, it is not an indicator to indicate the direction of the market. If your negotiating strategy is management-based, then you may need to combine it with other technical indicators. If you prefer to monitor multiple financial assets at once, you can use the Market Activity Index Panel.
Service Cost
You can find this indicator for sale on the MQL market at a price of 30 USD, it also has a free demo version so you can try it before buying it.
Conclusion
There are not many ratings of users who have tried this tool, so we do not have much data to evaluate it, but we think it can be a very interesting indicator for all types of traders.
In summary, and as has been commented, this index will warn us of changes in volatility in the markets but does not predict the direction of prices, so it is advisable to combine it with a trend indicator. In this way, the Market Activity Index will warn us when a period of high volatility begins and the trend indicator will tell us the direction of the price.