Introduction
Currency values are critical for international trade and vice-versa. The exchange rates are directly influenced by changes in import and export composition, quantity, and prices. The volatility of a currency is directly associated with the country’s import and export relations with other countries. Understanding how international trade affects currencies in the forex market is paramount for fundamental analysis.
What are Imports by Country?
A country’s trade balance (net exports and imports) is critical for currency valuation. The Balance of Trade refers to the required balance to exist between the total monetary value of a nation’s exports and imports. It is key to currency valuation. When a country exports, domestic currency comes into the country in exchange for the sale of products. When a country imports, the currency goes out in exchange for purchasing goods outside the country. Hence, a balance of exports and imports to maintain a healthy economy.
It is often necessary to understand a nation’s export and import composition to grasp its ties with other countries. Countries’ dependency on goods and services from other nations induces leverage and power for the exporting countries. For example, the United States imports 20% of all its goods from China. If China were to cut-off all its exports to the United States, that would dramatically impact the United States economy and its currency. Hence, the categorization of imports based on country and goods gives us an idea of the underlying relationships between currencies.
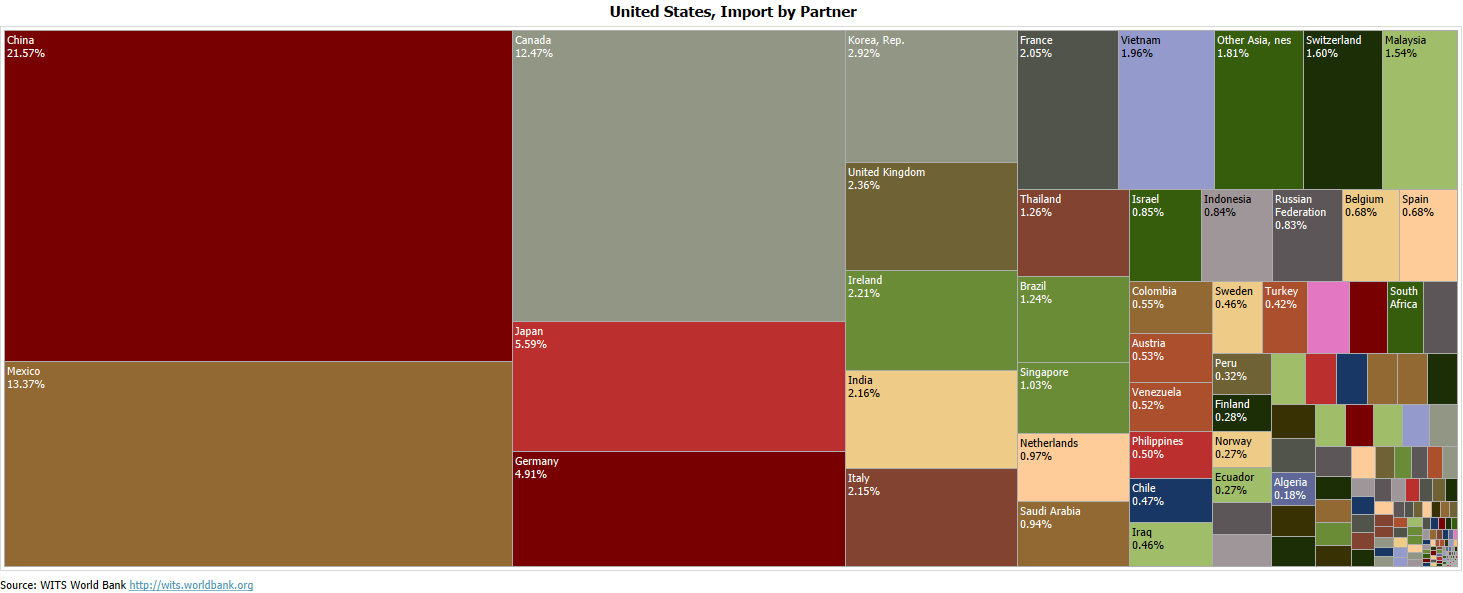
United States Imports by Country

Source: Trading Economics
How can the Imports by Country numbers be used for analysis?
Today’s global world is one that is tightly interconnected and has complex links amongst countries. Understanding trade composition helps us in identifying where to look for volatility. For instance, the United States only imports about 2% of its products from India. If, for some reason, the import prices changed from India in either direction or completely stopped, it would not impact the trade balance significantly.
Hence, categorization based on countries helps us understand the dependencies a particular country has. Heavy dependence on a limited set of countries, especially for primary resources like energy and food, is not suitable for the economy. During times of a natural disaster in the exporting country will affect the dependent countries also.
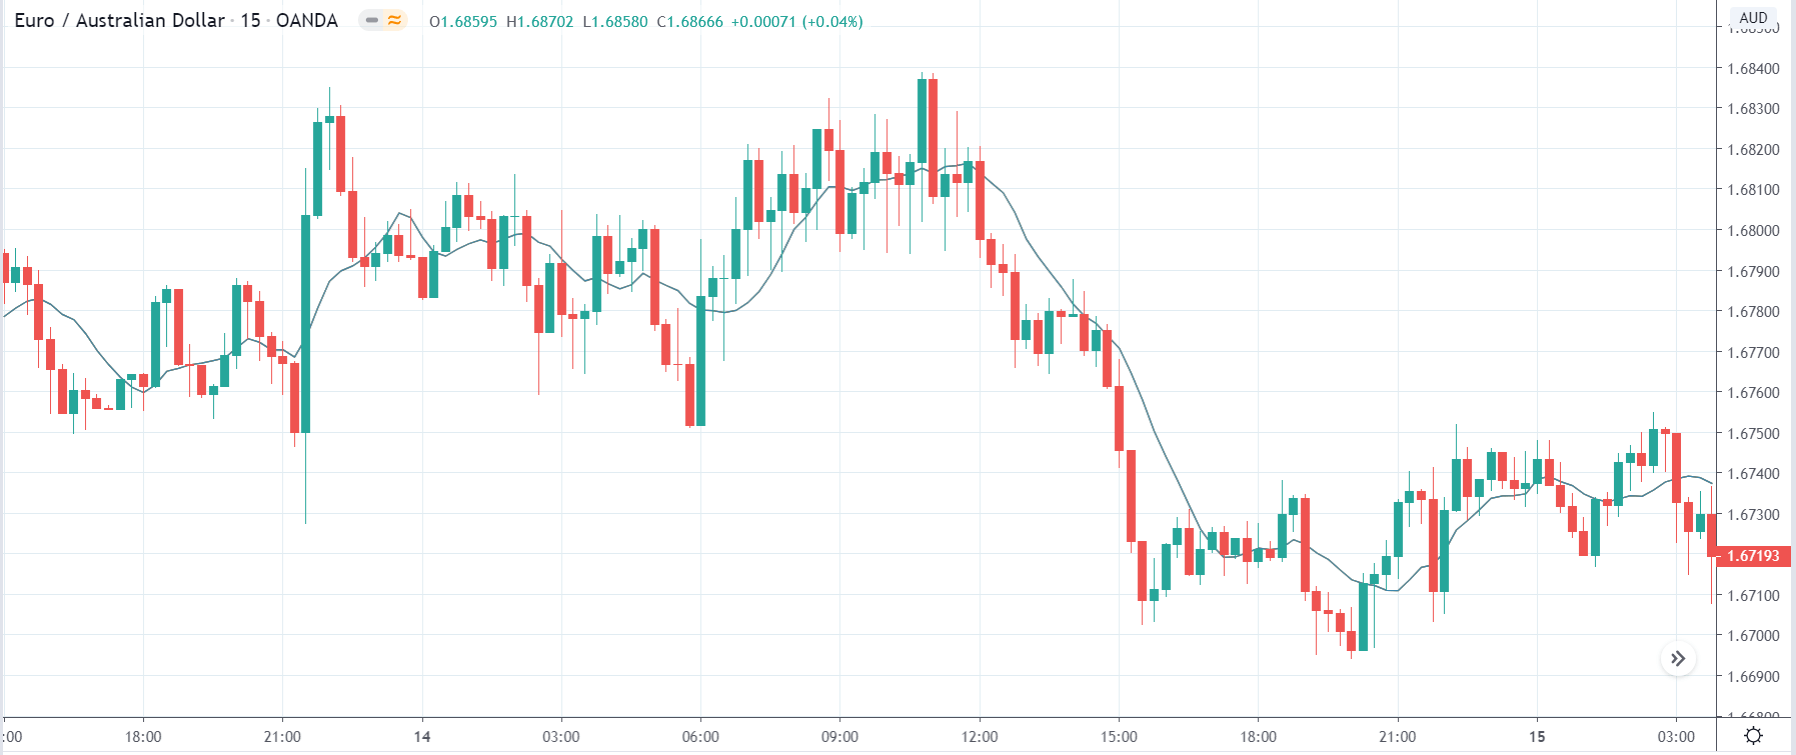
A country that solely depends on its trade relations with fewer countries is likely to see more volatility in currency valuation. The more diverse the portfolio of a country in terms of its international trade partners, the more robust the currency is. Hence, currencies like the AUD, CAD are more volatile currencies because their exports are heavily dependent on fewer markets, unlike the EUR and USD.
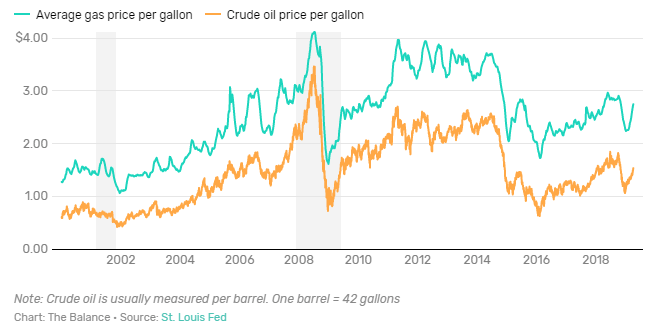
Imports and Exports by country and category of products are equally essential to understand a nation’s currency volatility. For instance, Australia’s heavy dependency on coal and iron ore exports to china and japan induces volatility in AUD currency in correlation with coal and iron ore prices.
The Imports by country is not an economic indicator but is a prerequisite for understanding macroeconomic analysis of currency pairs. Currency valuations are primarily affected by trade relations a country has. It is not frequent for a country to change its import composition by country often, but it has a significant impact on the currency when it does.
Imports form only one half of the equation. Overall to understand the macroeconomic dynamics, both exports and imports have to be taken into account. Also, currency value change has a direct effect on imports and exports. When the Domestic currency appreciates imports are cheaper and profit margin increases for importing companies but hurts exporters as they receive fewer dollars than before. When the domestic currency depreciates, imports get hurt while exporters benefit. Some countries competitively peg their currency lower during export and higher during import. This phenomenon is sometimes referred to as “currency wars.”
Changes in import and export composition as a result of trade agreements or tariffs imposed has a more direct impact on companies that constitute the import and export goods and services. Hence, stock prices of companies are more sensitive to import and export data.
Impact on Currency
Imports categorized based on countries is for segregation and analysis purposes only. It is not an economic indicator in itself. Still, it is essential to understand the existing trade partners of a country to know which currencies are being exchanged for what goods. Imports and Exports both make up the balance of trade, which helps to analyze currency valuation.
Hence, Imports categorized by country are although useful, changes in the composition are necessary for a macroeconomic picture but does not induce volatility in itself. Any change in composition would have already been announced in news reports that would be priced into the market. It is useful at the starting point for establishing currency analysis, but it is neither an economic indicator nor induces any volatility in currencies.
Economic Reports
For the United States, The Census Bureau tracks and consolidates import and export composition on its official website. It releases monthly data ranking countries with which it had exports and imports. It details all the goods and services that are exported or imported from the partner countries.
Sources of Imports by Country
Census Bureau’s Trade highlights reports are available here. We can find a consolidated listing of “Imports by country” of most countries on Trading Economics.
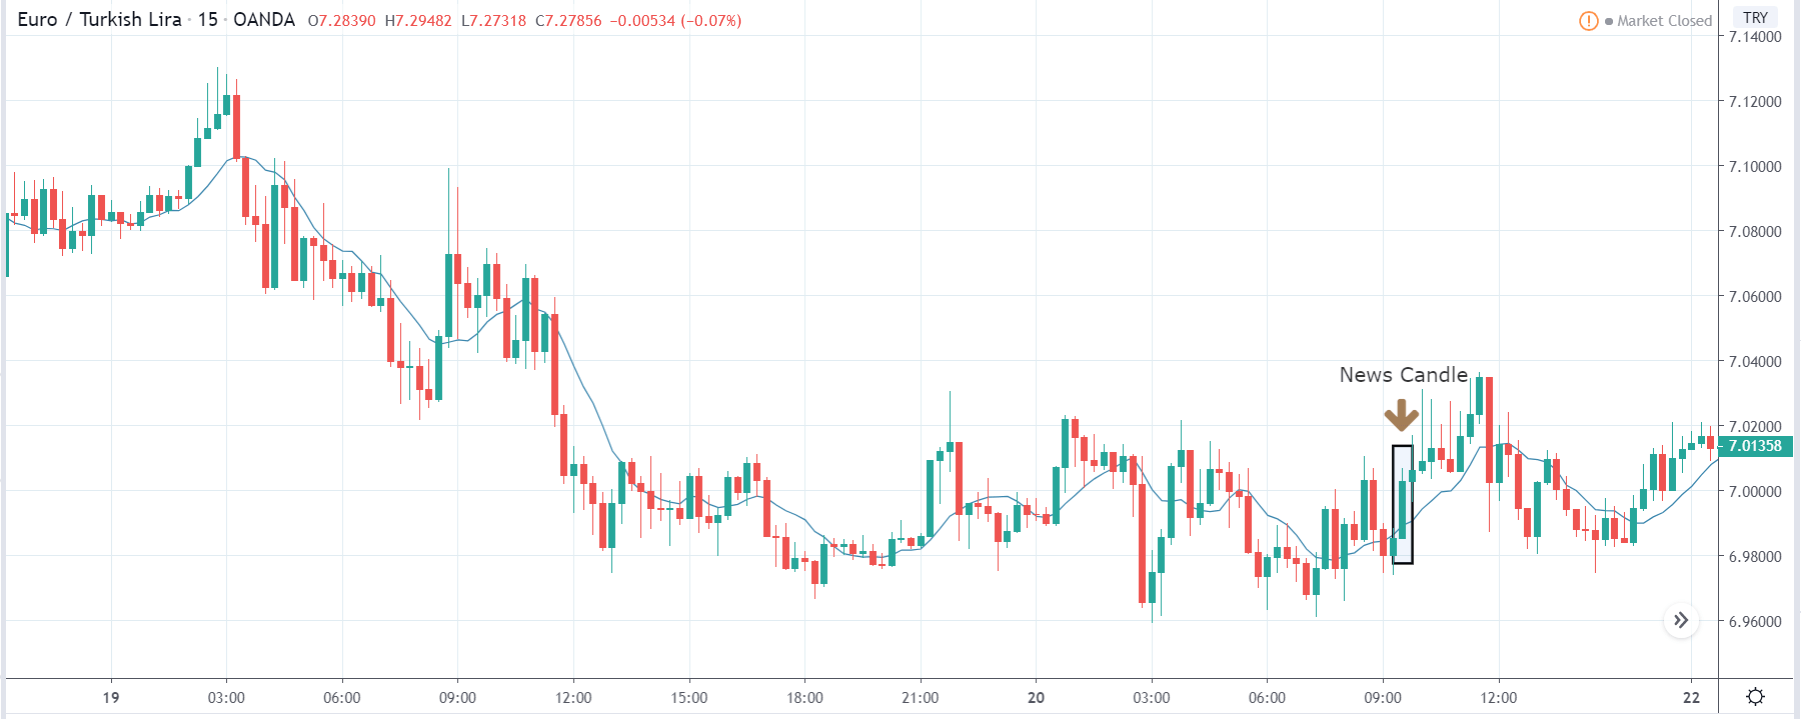
Imports by Country News Release – Impact on Price Charts
Imports by Country is an important piece in analyzing the “Trade” and “Imports” fundamental indicators. It alone is not an economic indicator but is one of the components that make up a fundamental indicator. Precisely, the balance of trade is the economic driver that references the data obtained from Imports and Exports. Extending further, the data from Imports is acquired from factors like Imports by Country and Imports by Category.
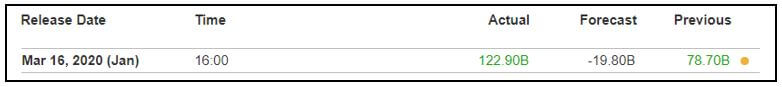
Imports by Country alone does not pump up the volatility of the market. Also, the report is released during the release of the Imports data.
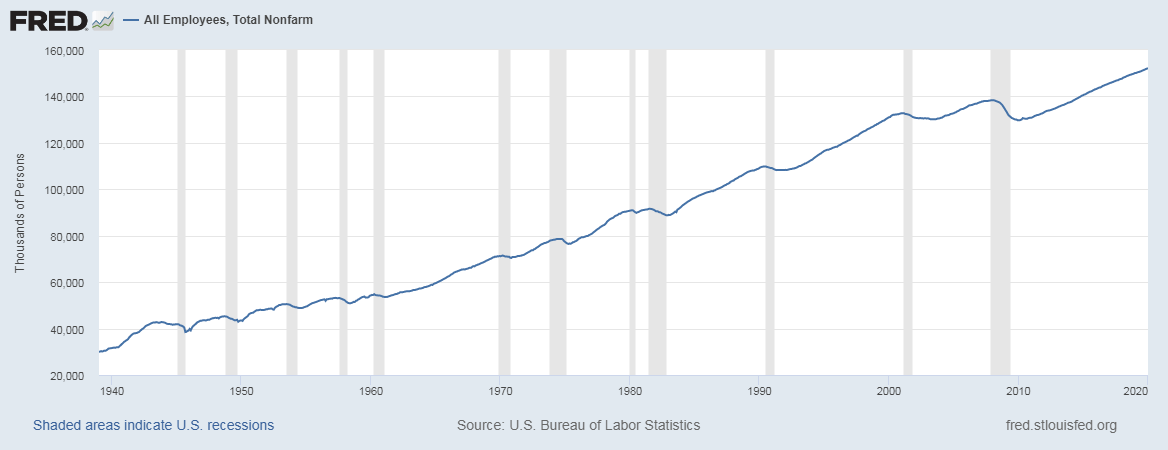
Imports Report – Untied States
United States Imports by Country
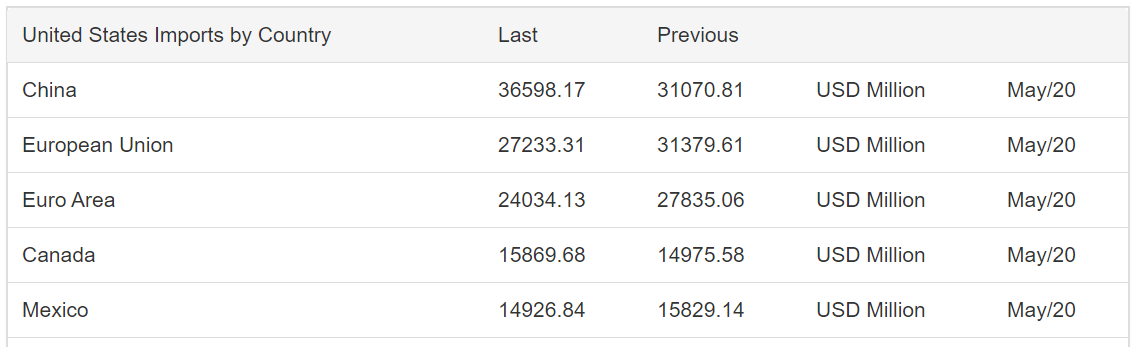
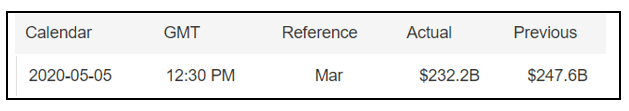
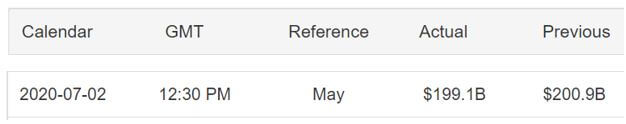
The USA is the second-largest importer in the world. The imports of the USA are China, the European Union, Euro Area, Canada, Mexico. For the May data, the overall imports dropped from $200.9 billion to $199.1 billion. Imports from China and Canada increased the previous month, but the rest saw a slight decline.
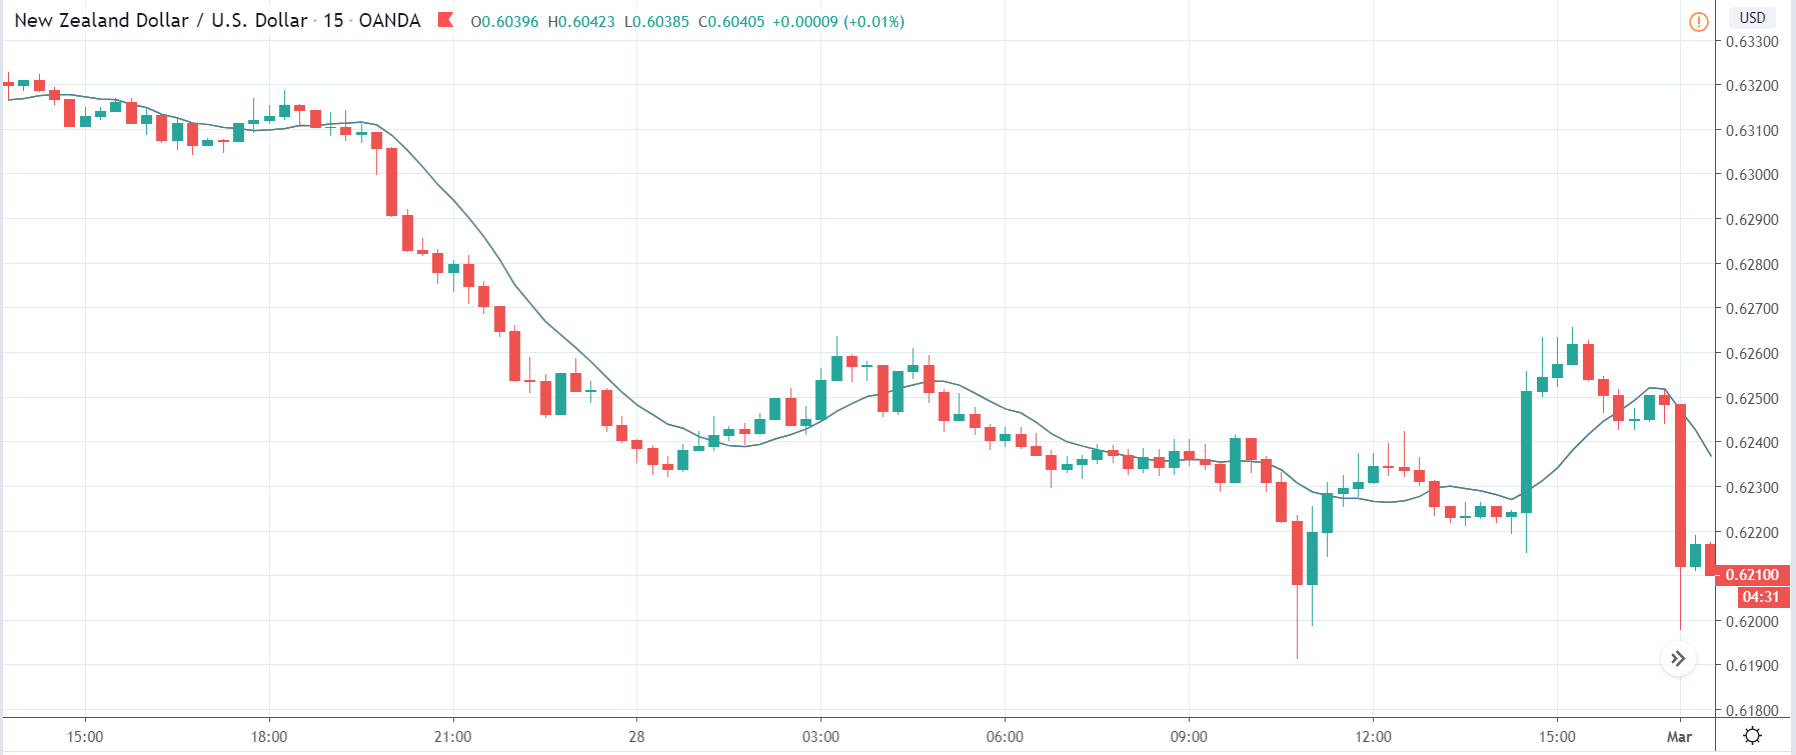
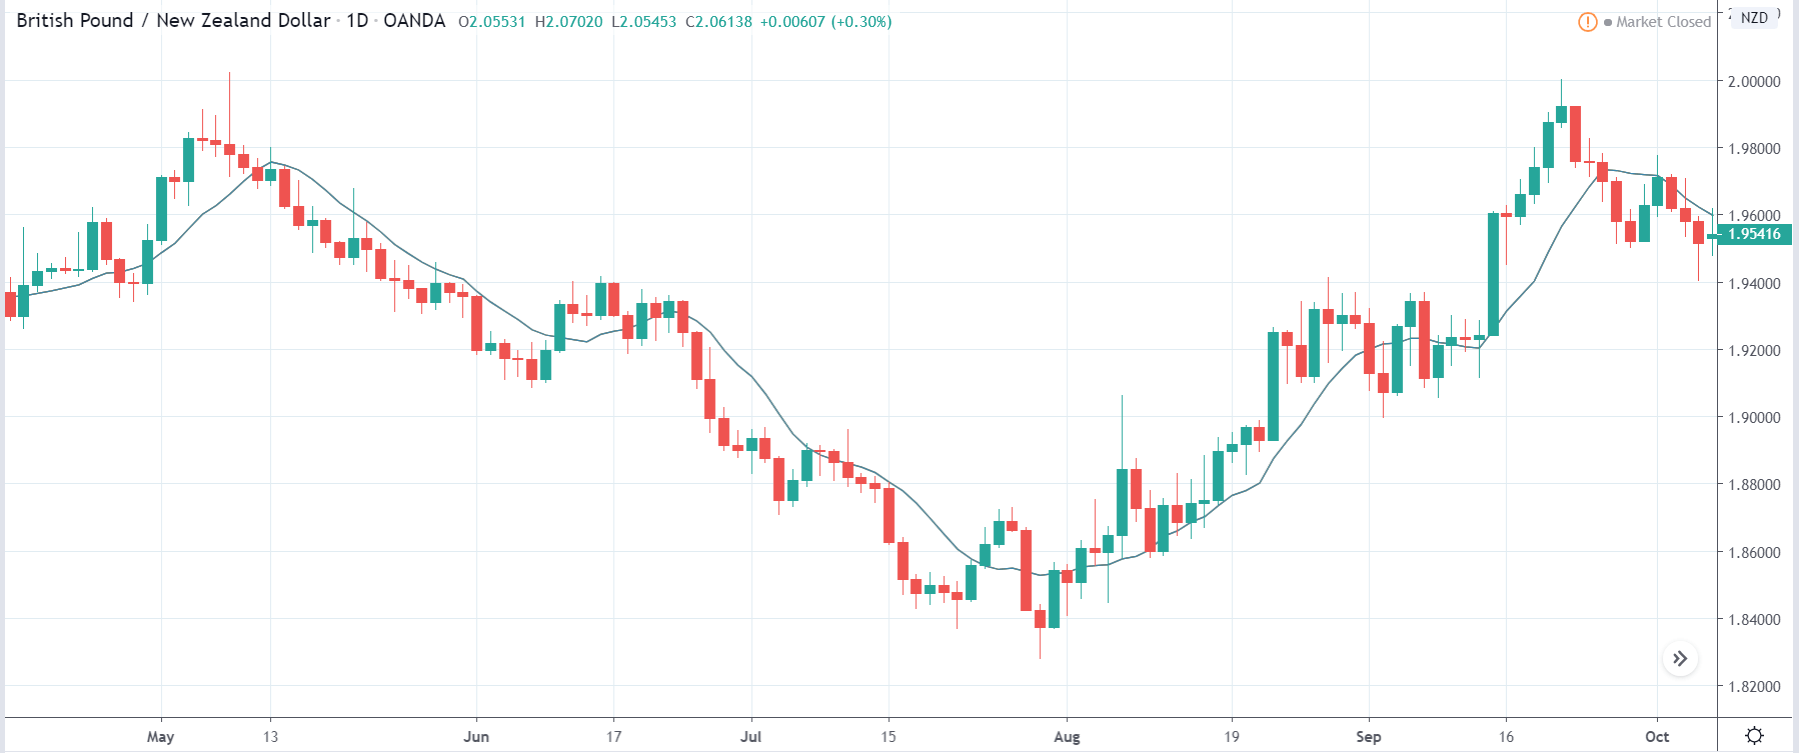
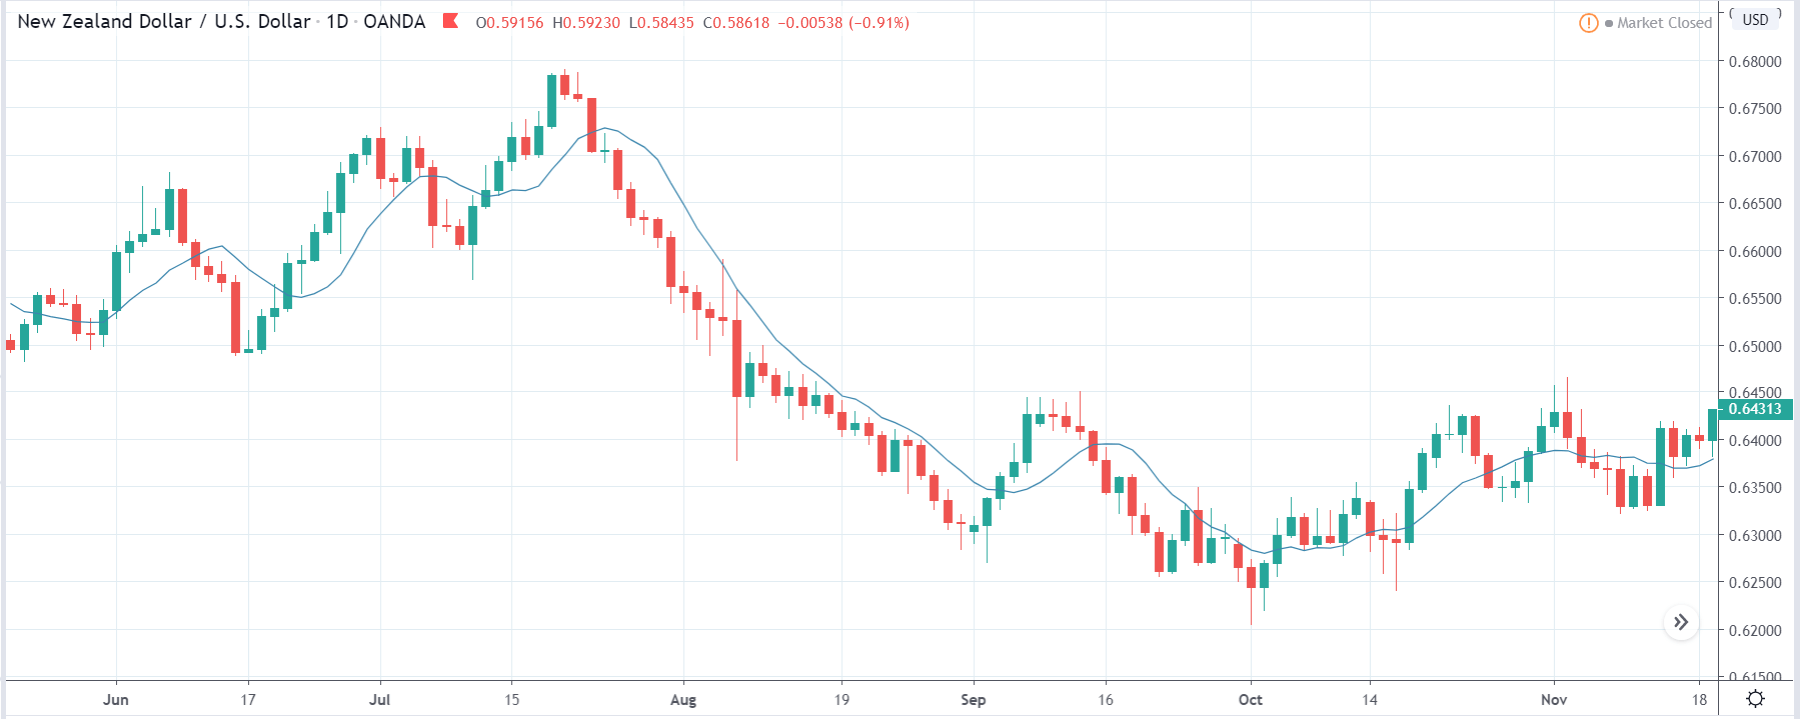
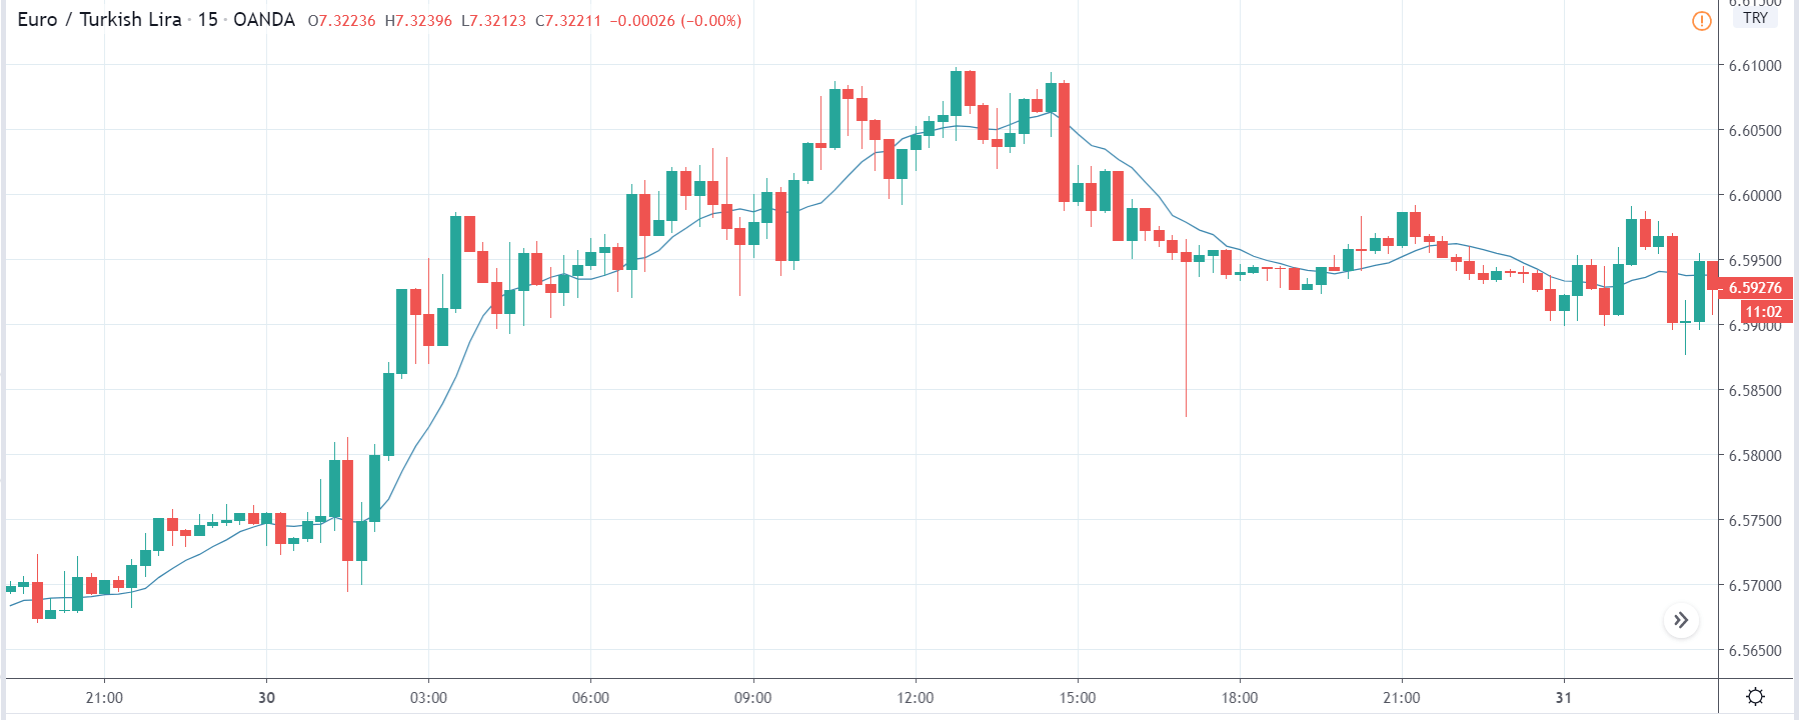
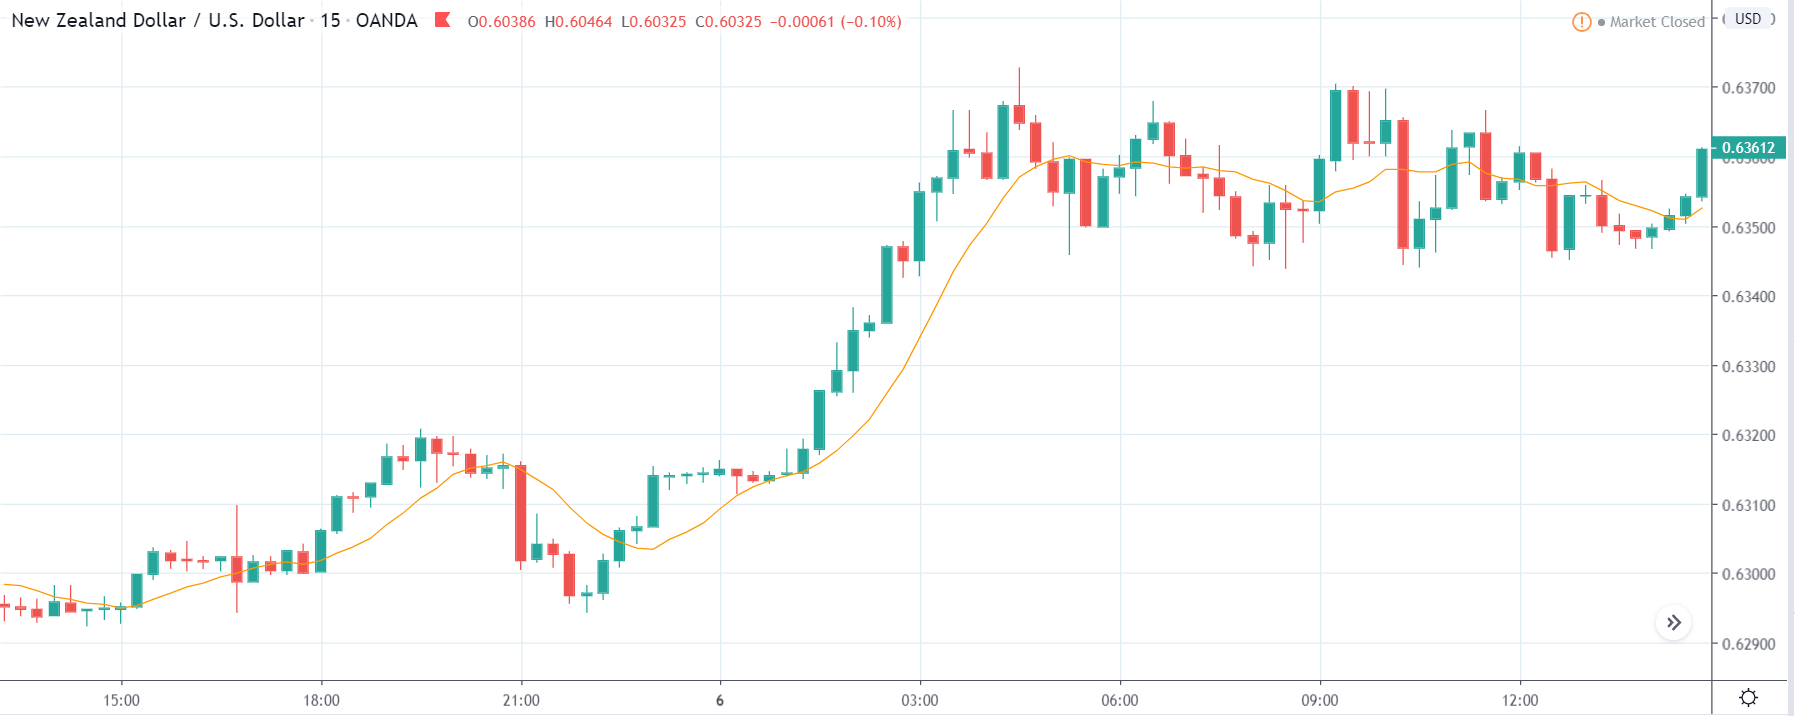
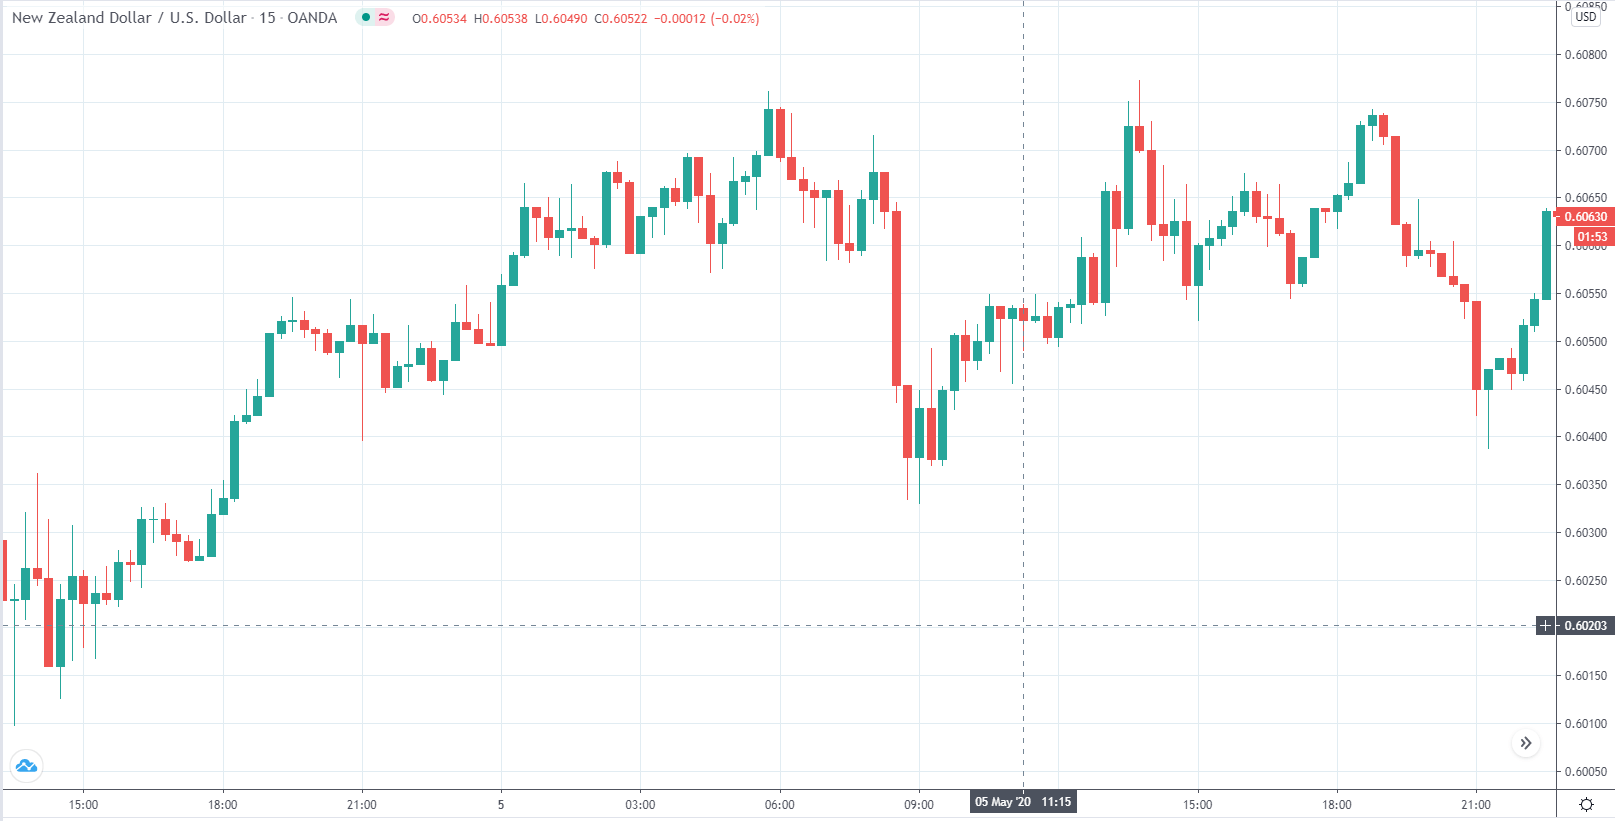
NZDUSD – Before the Announcement
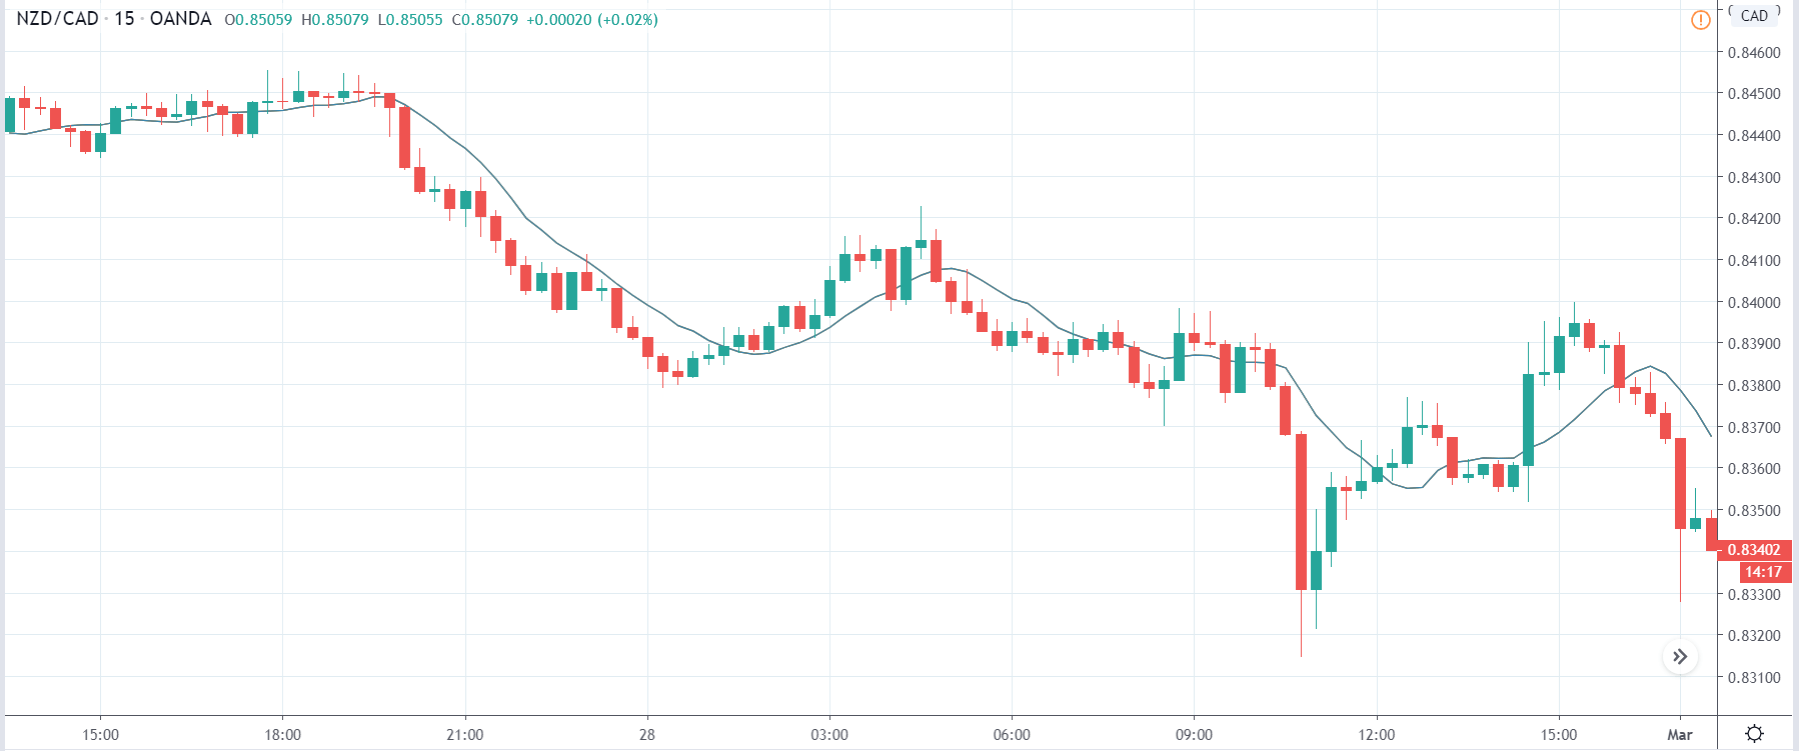
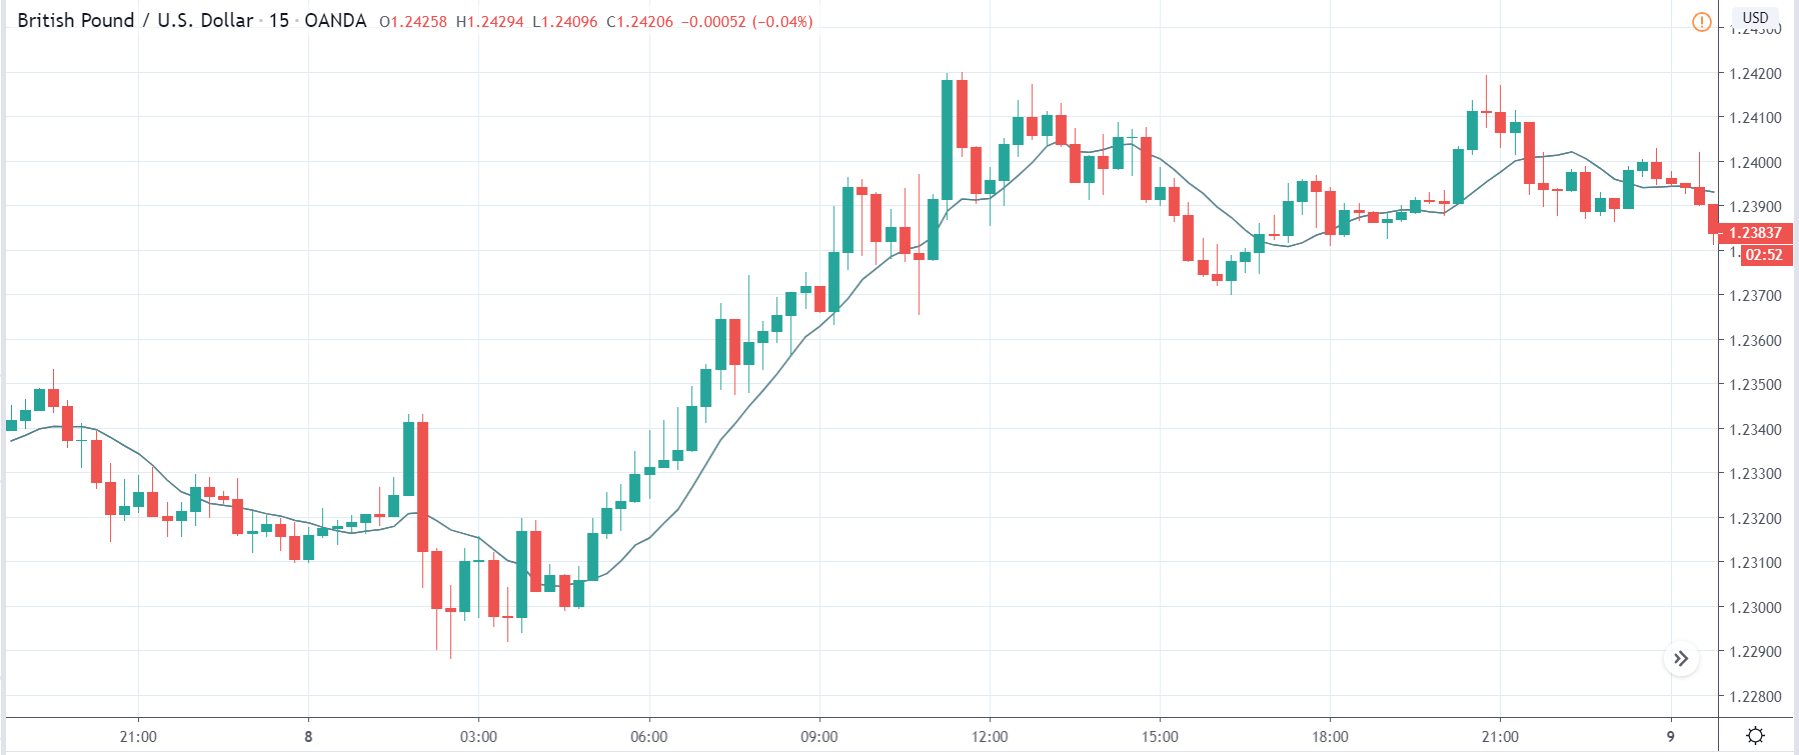
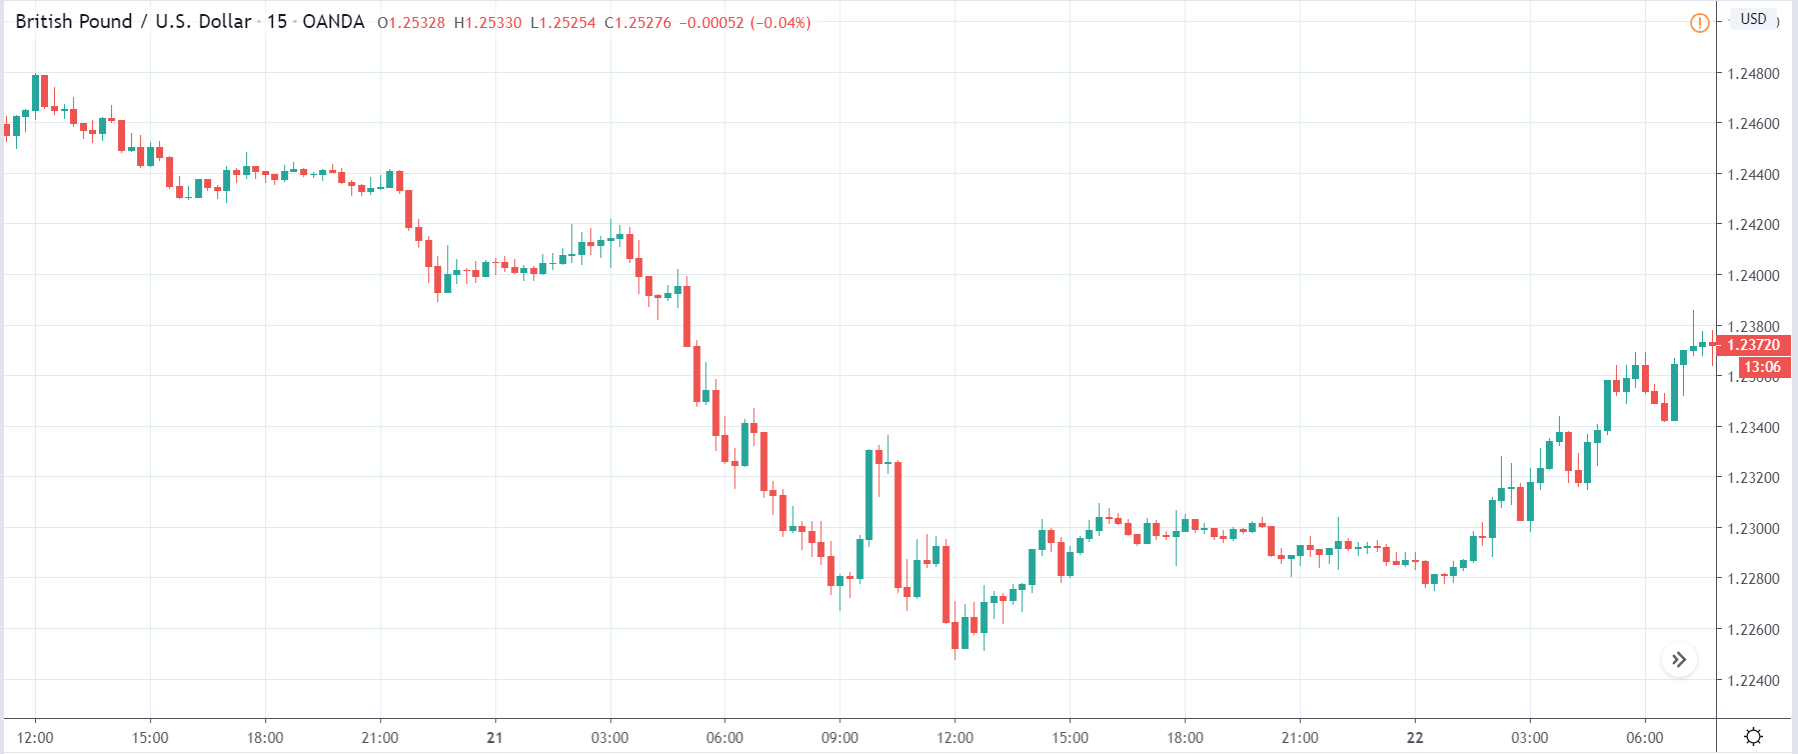
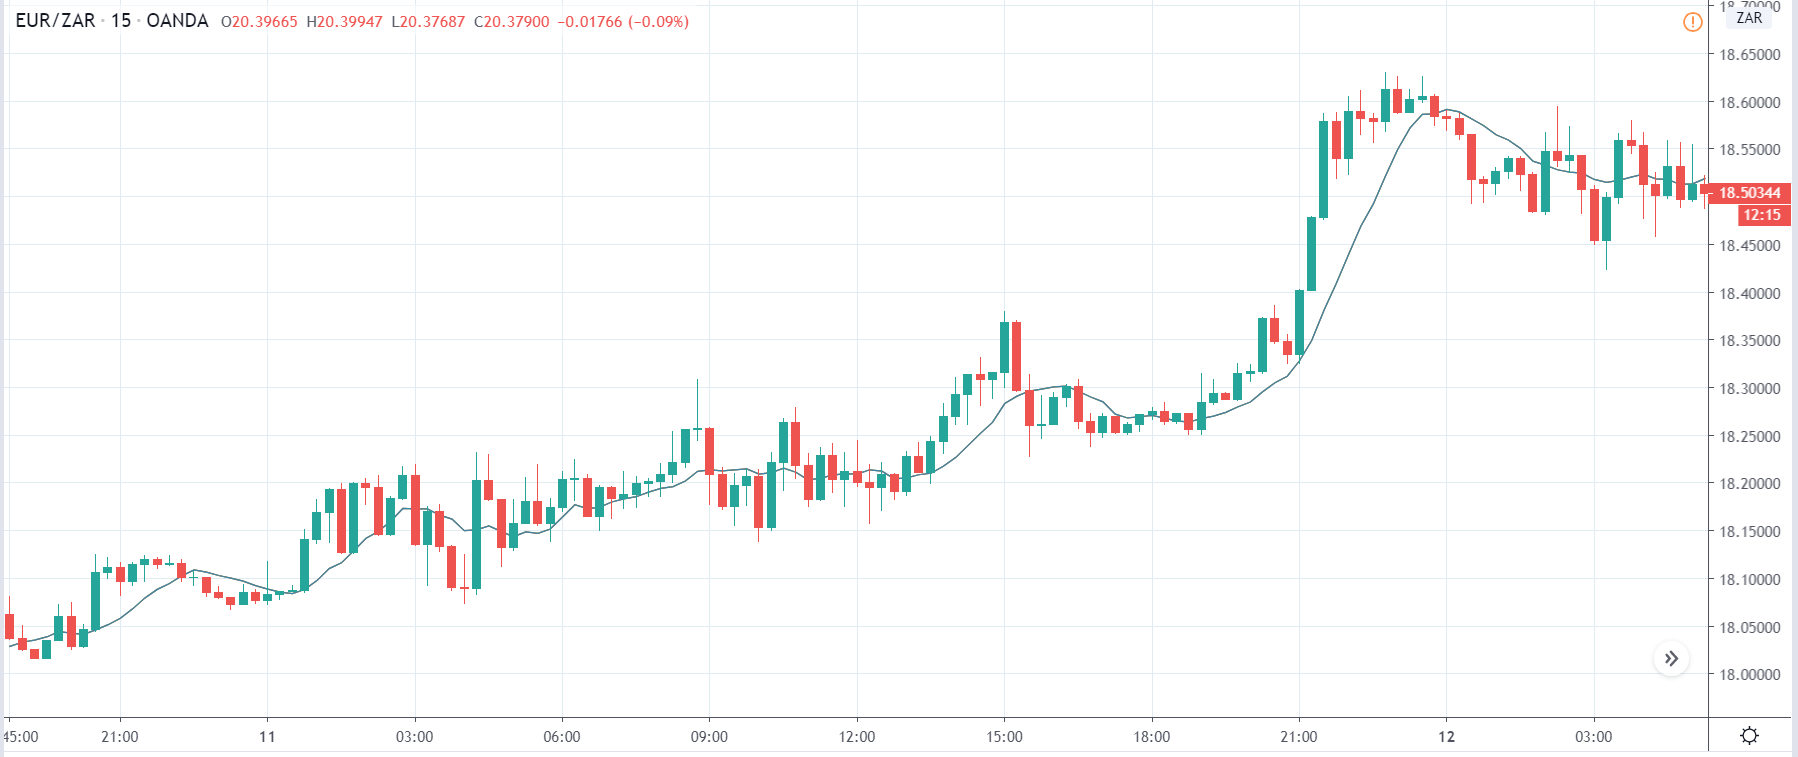
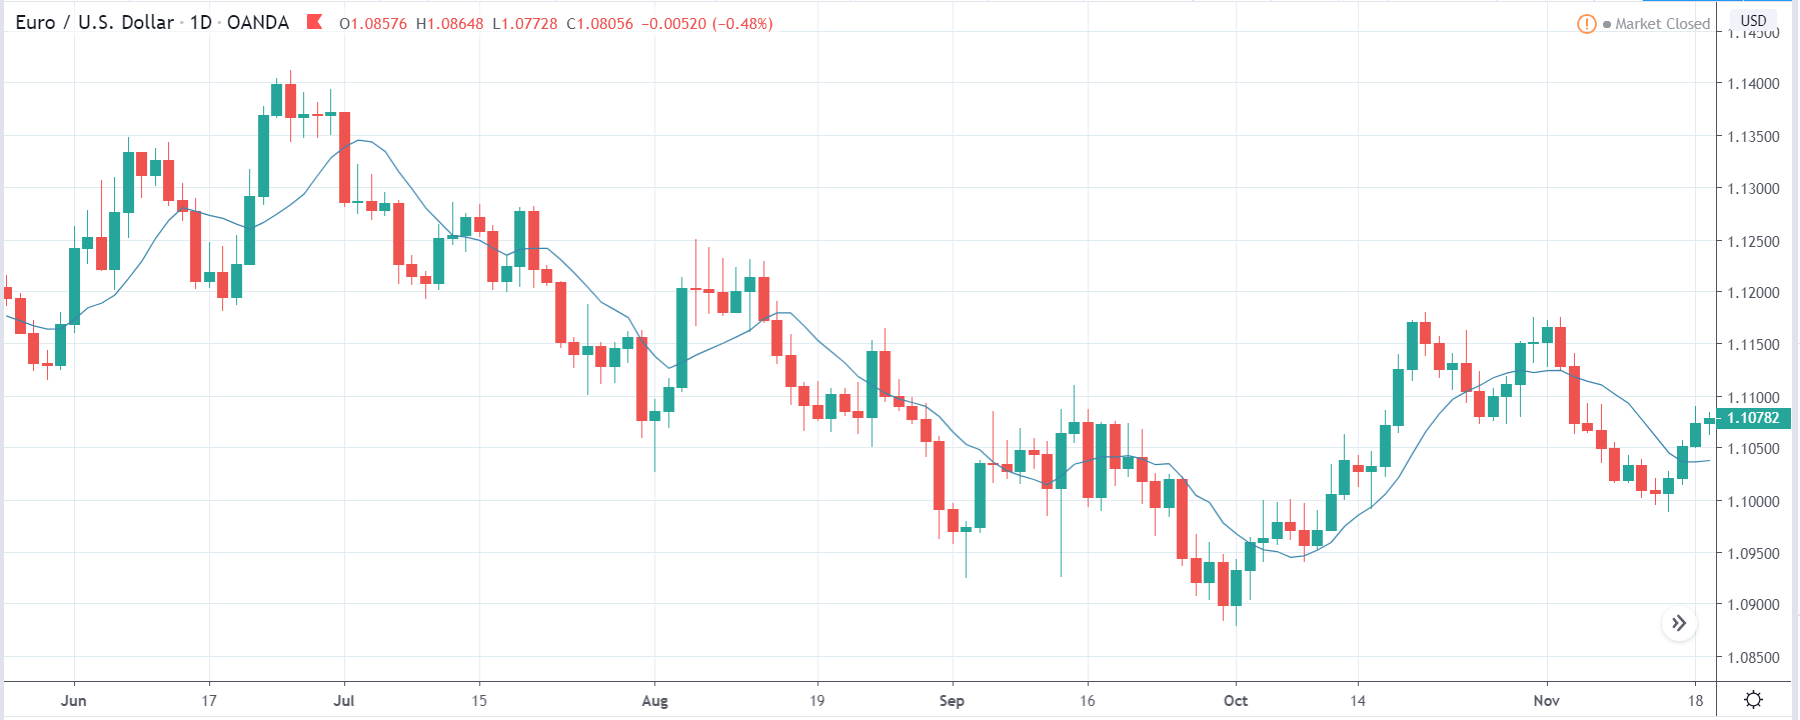
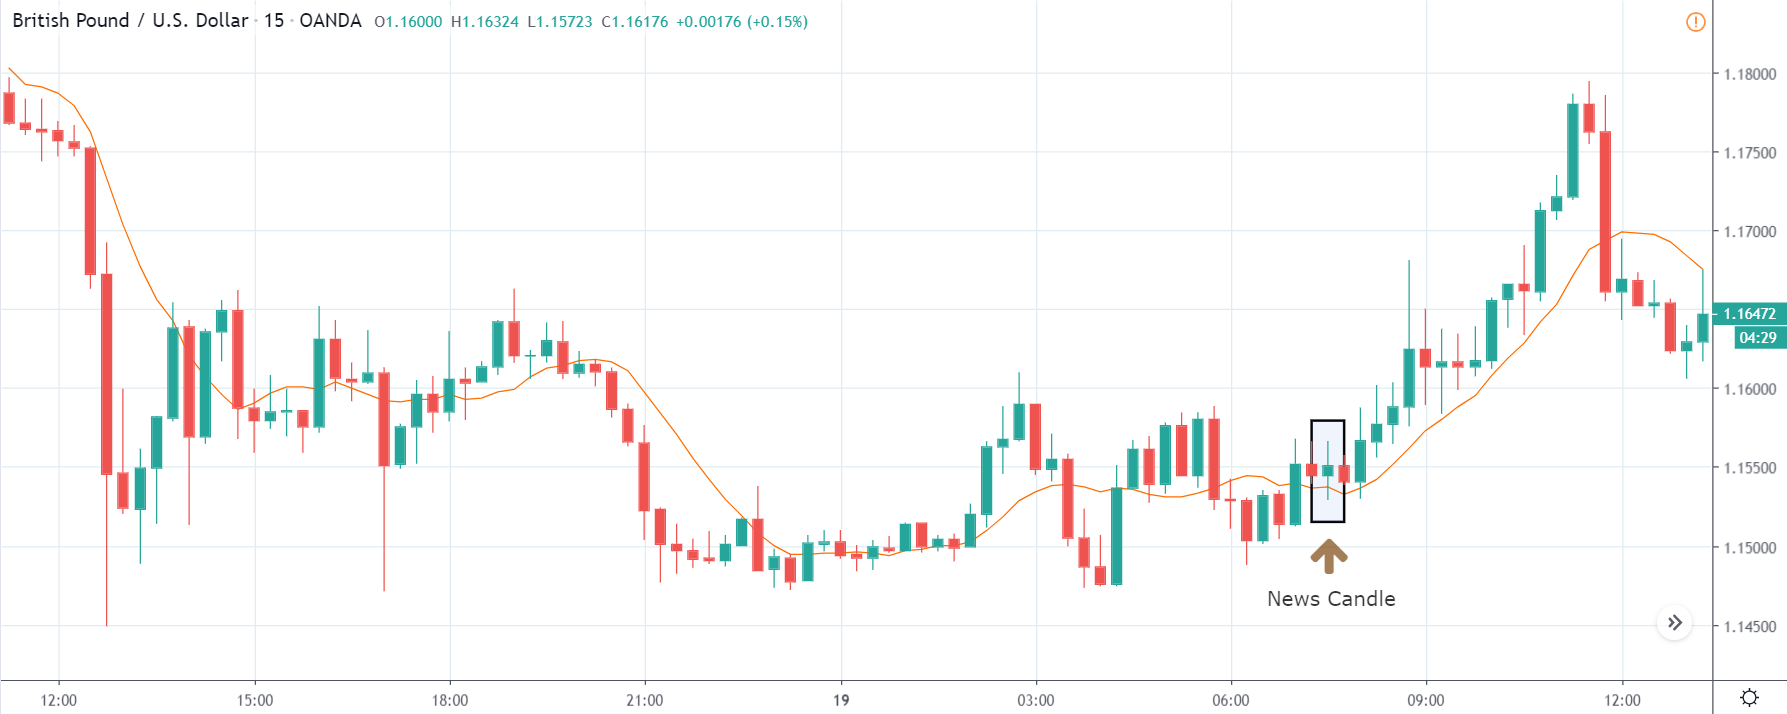
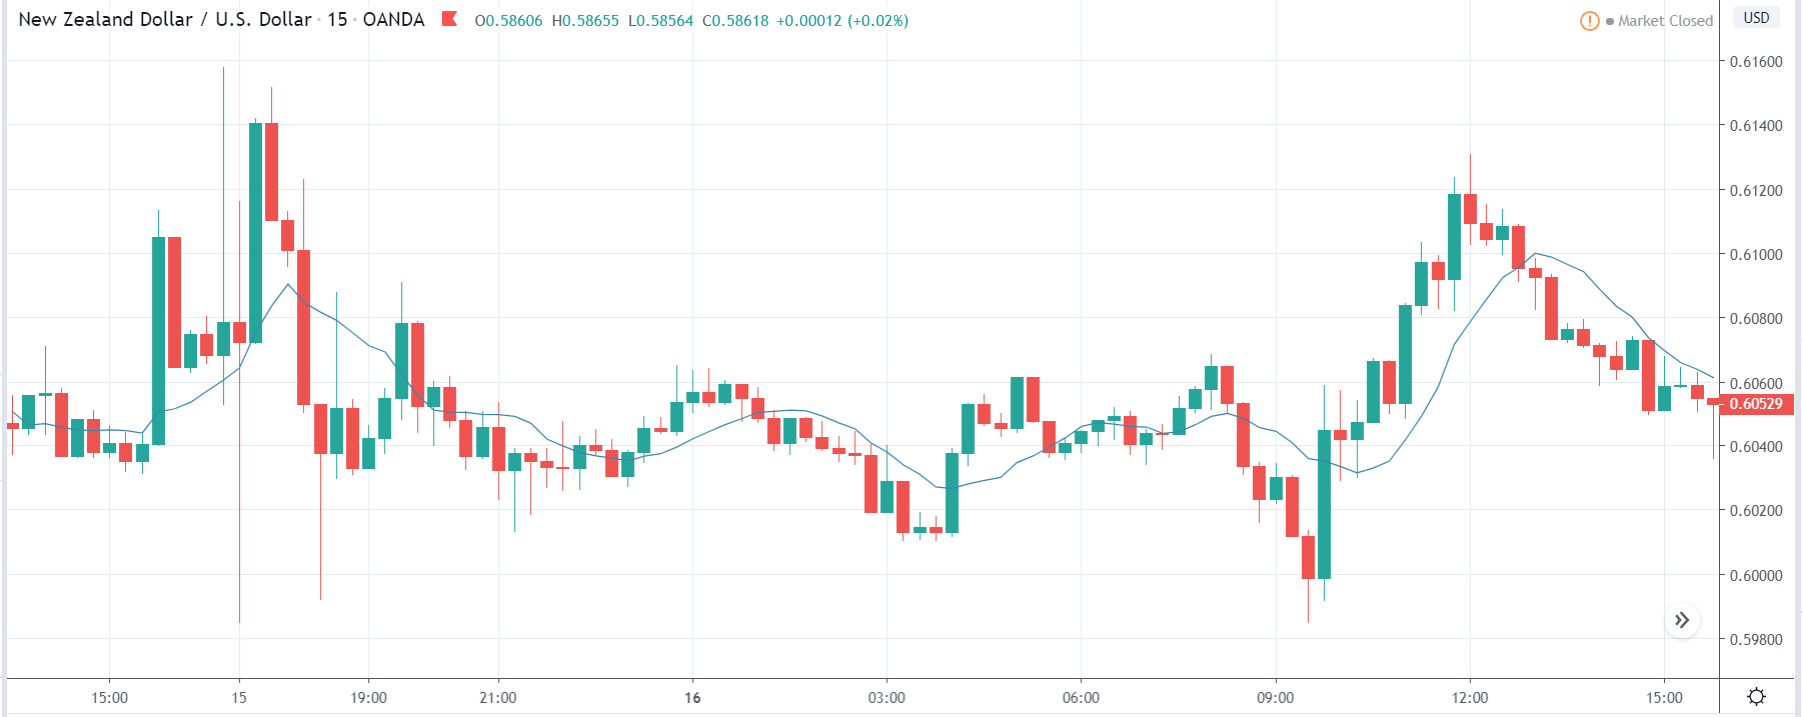
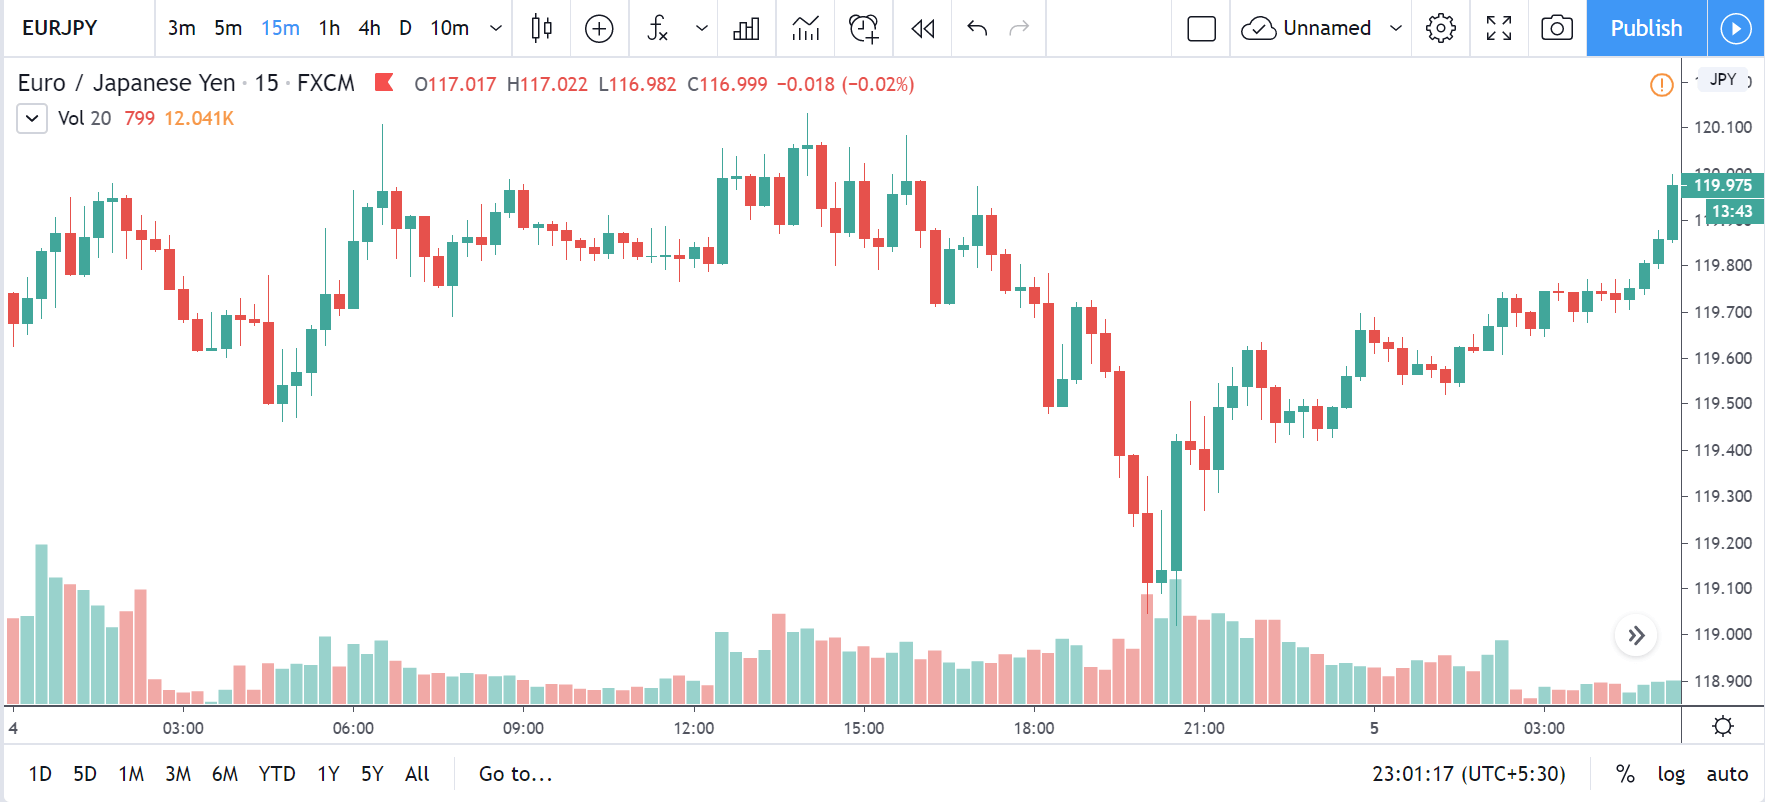
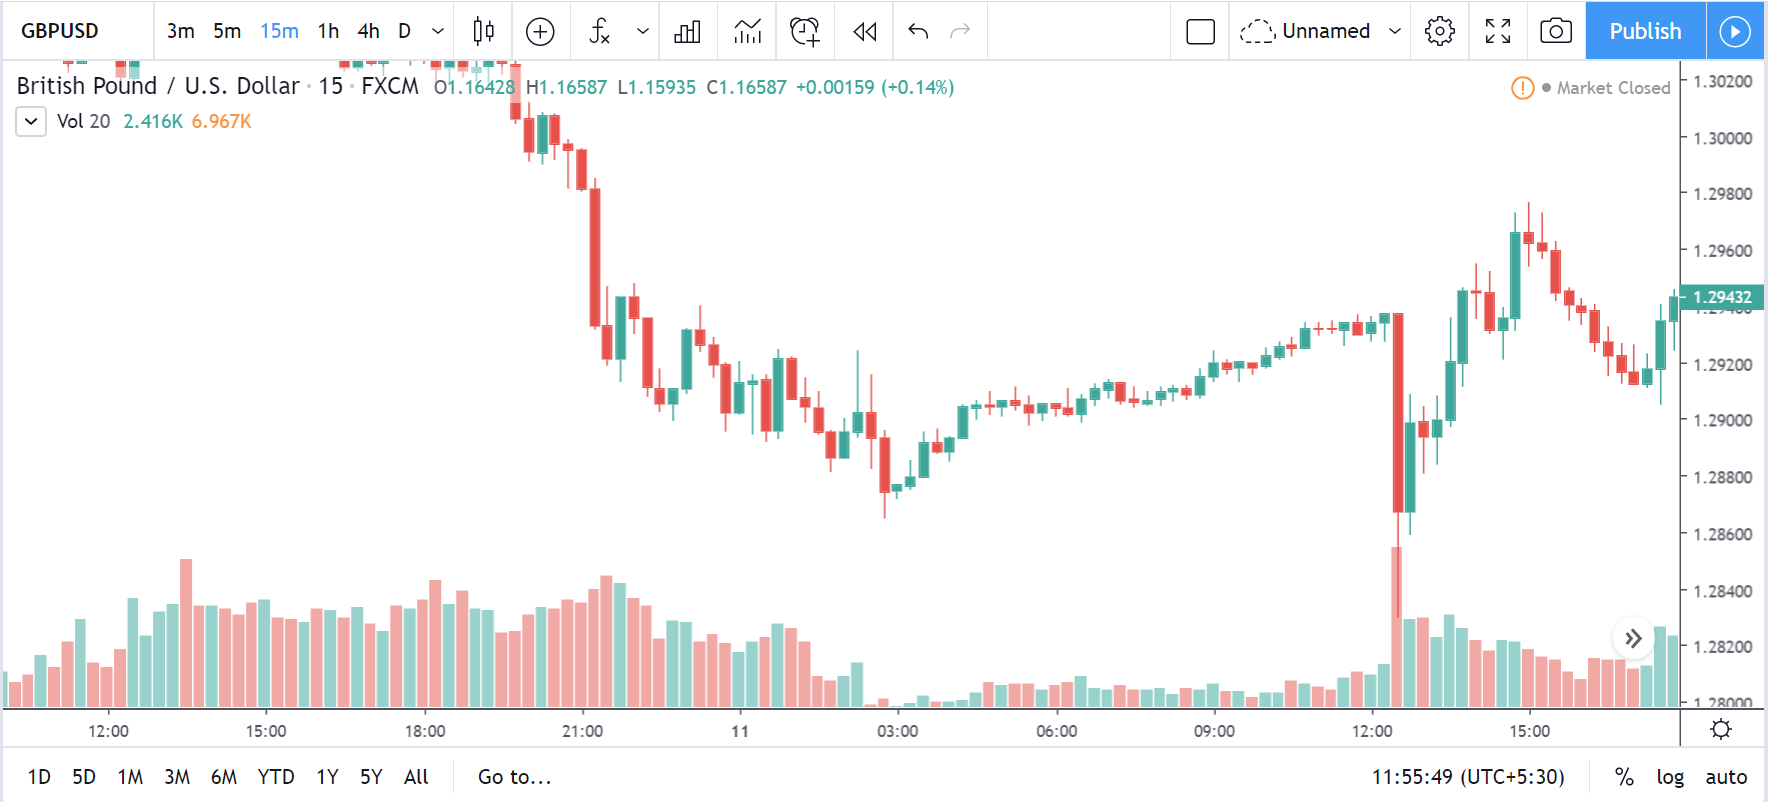
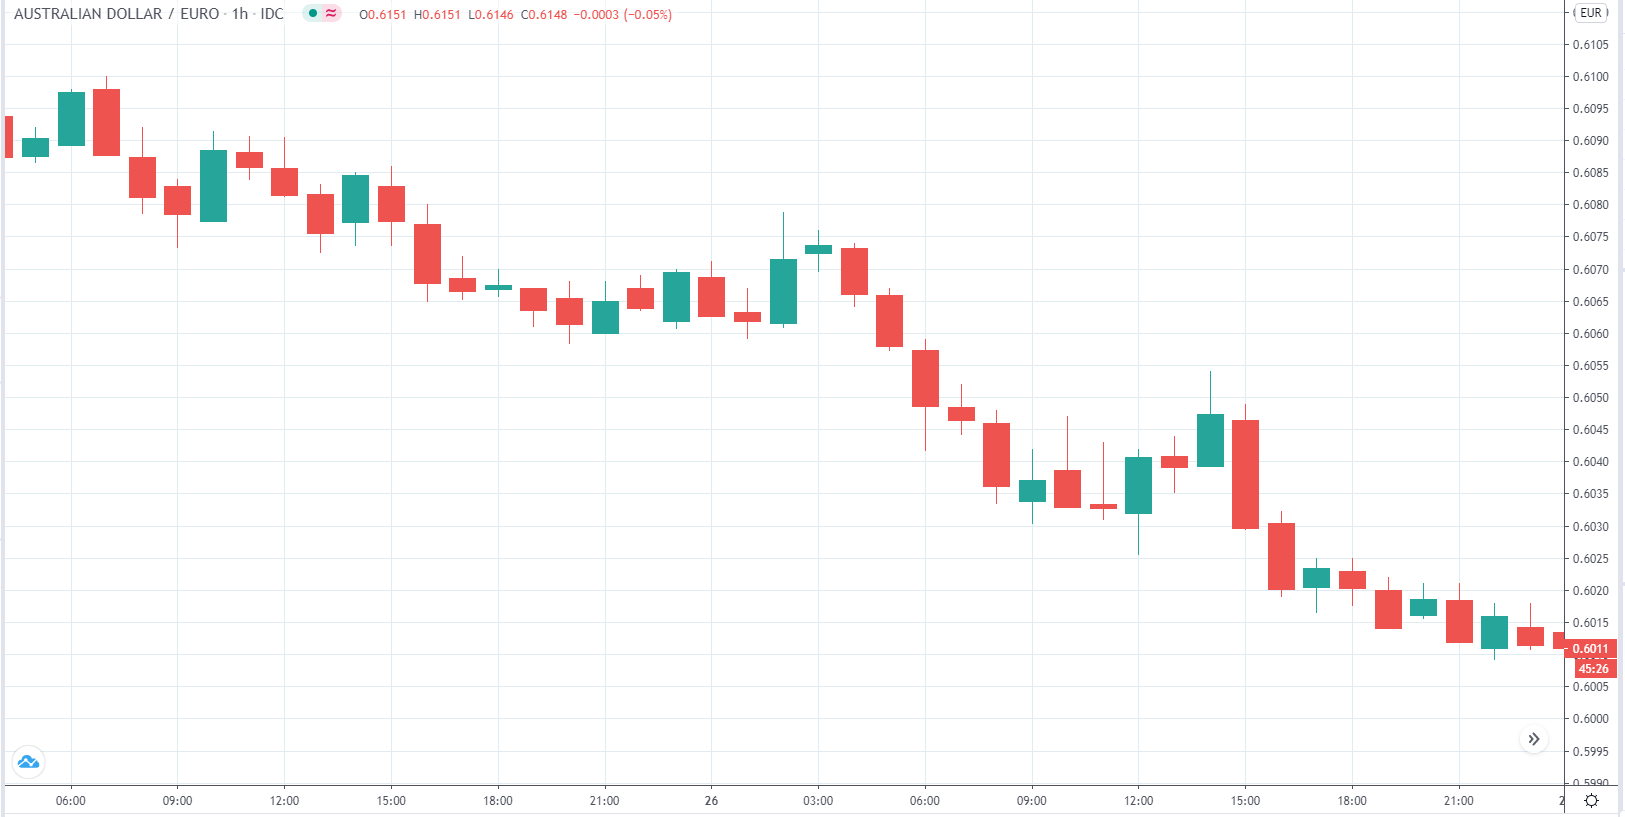
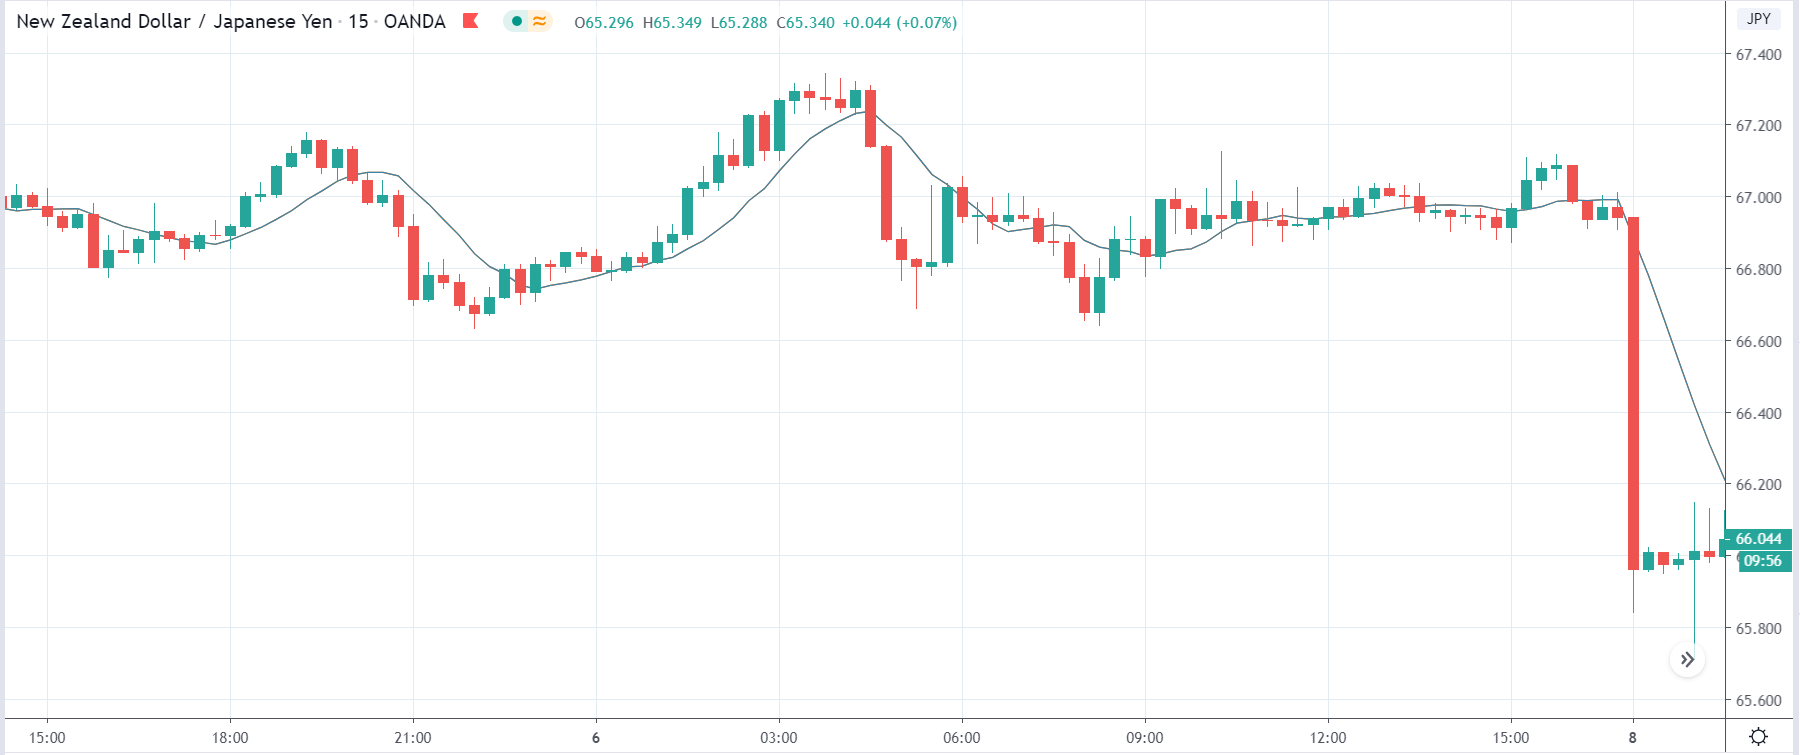
In the below chart of NZDUSD, on the 4H time frame, we can see that the market is in an uptrend. It made a high to 0.65815. Since then, the price has been retracing.
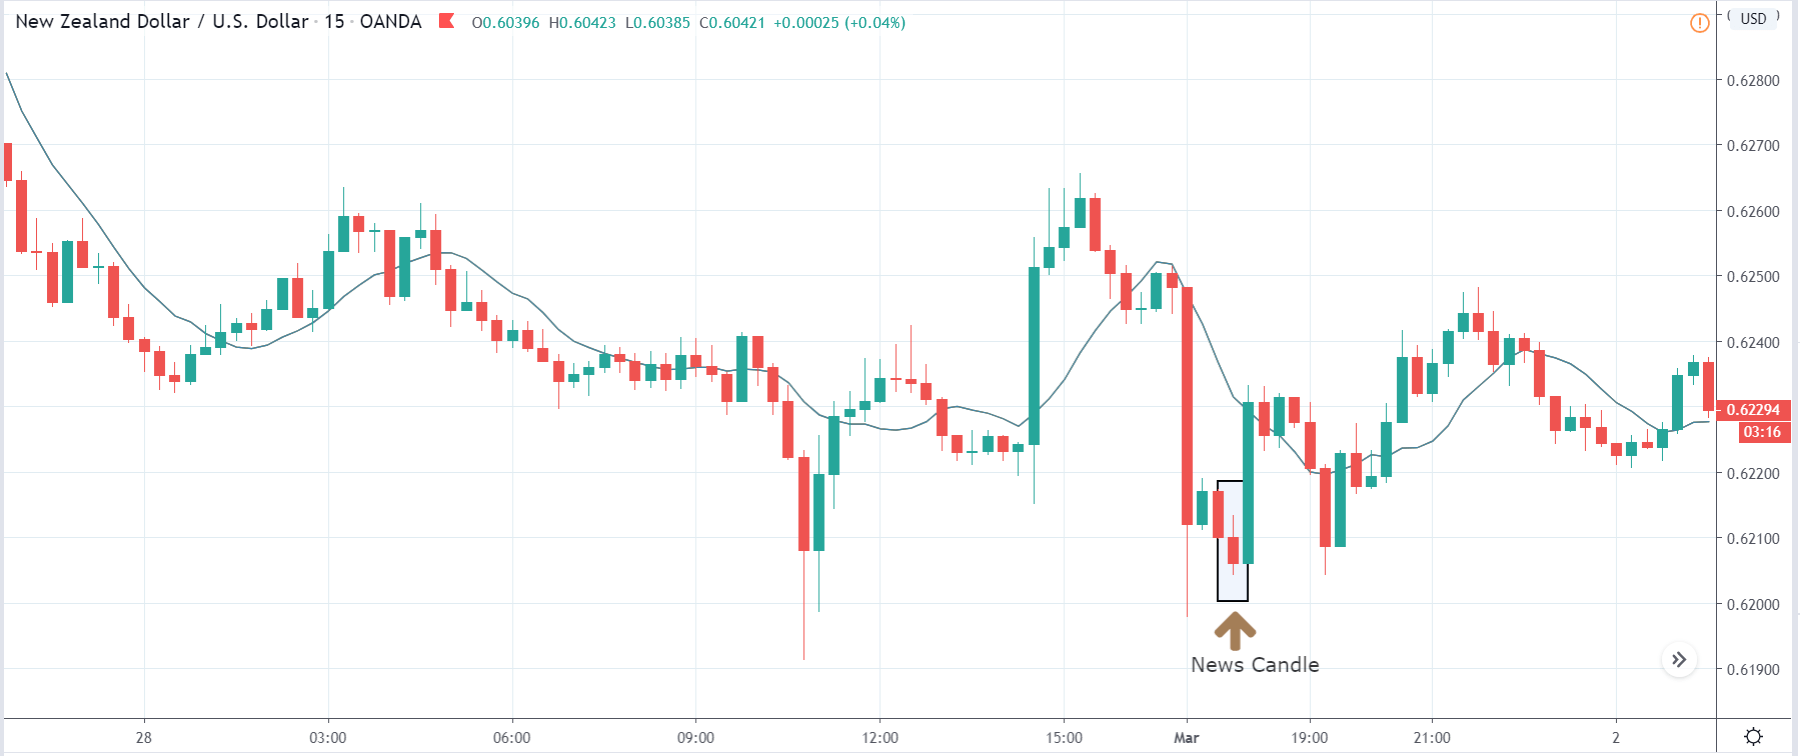
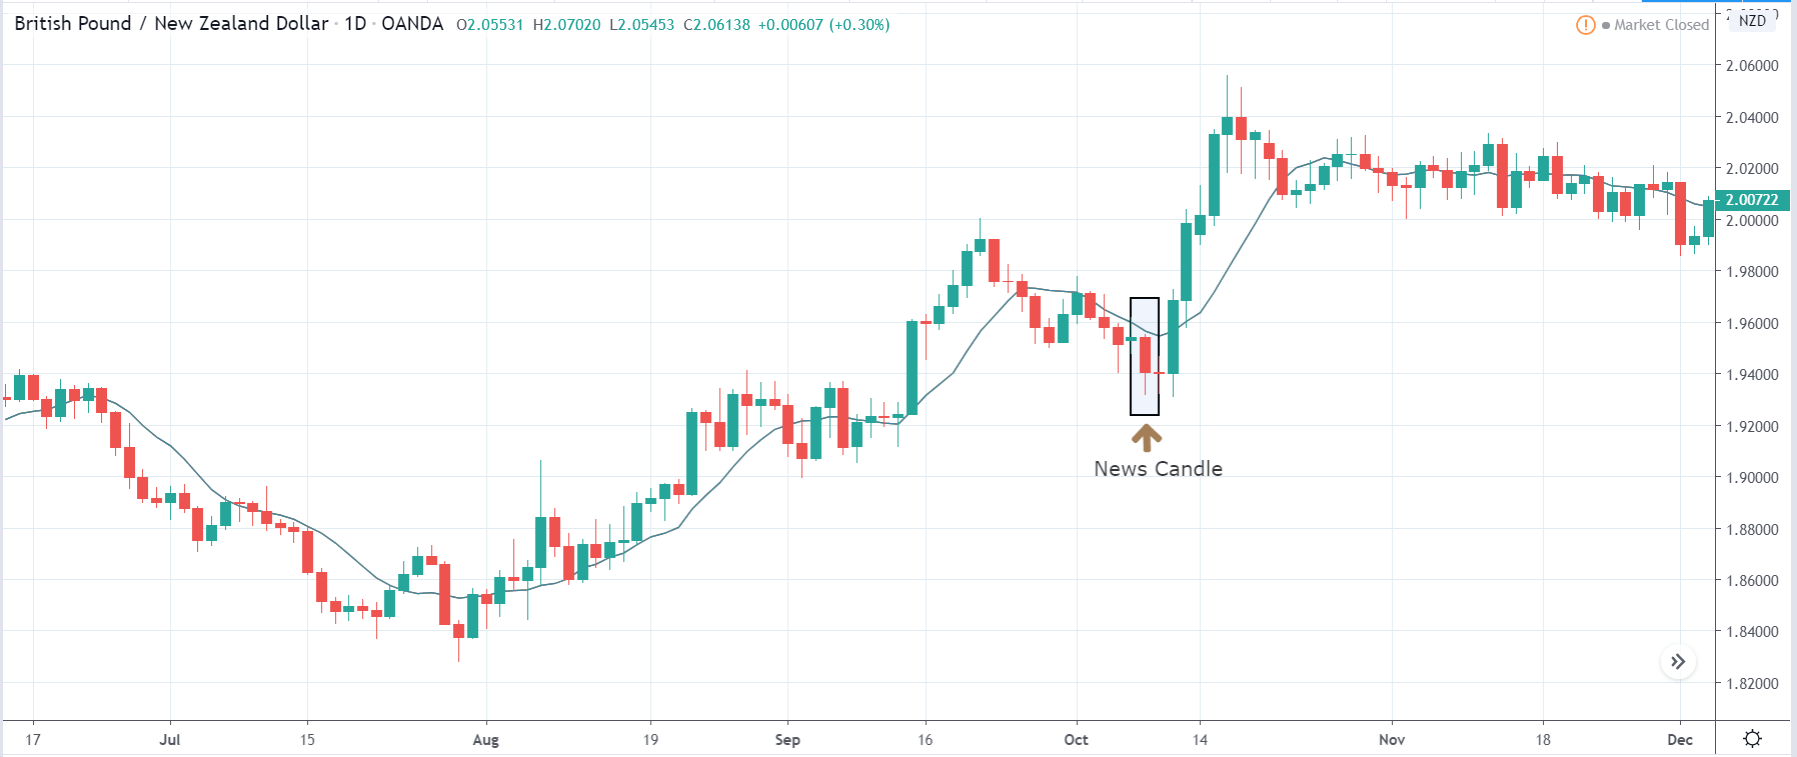
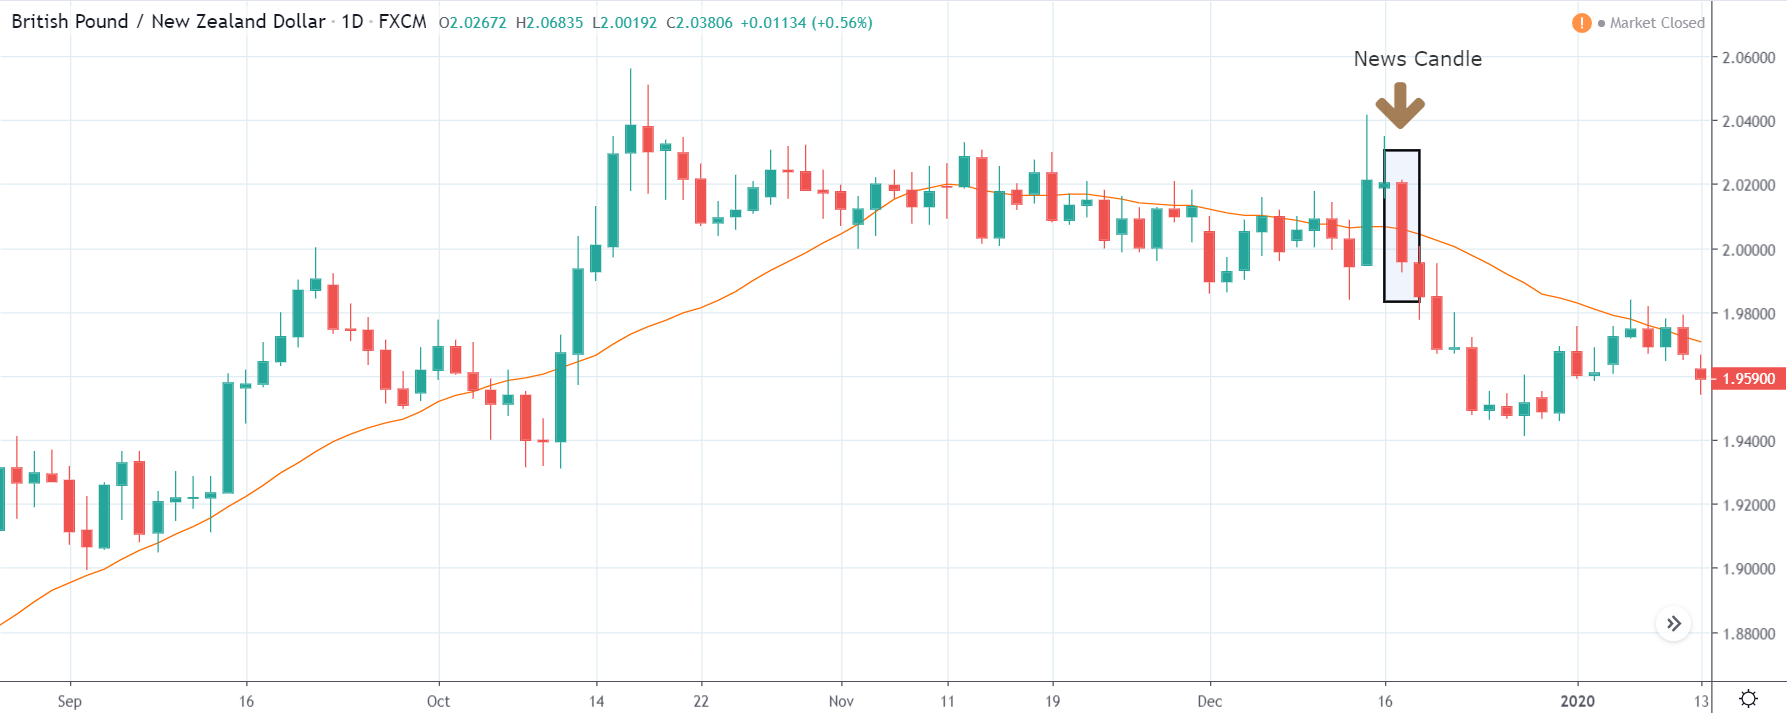
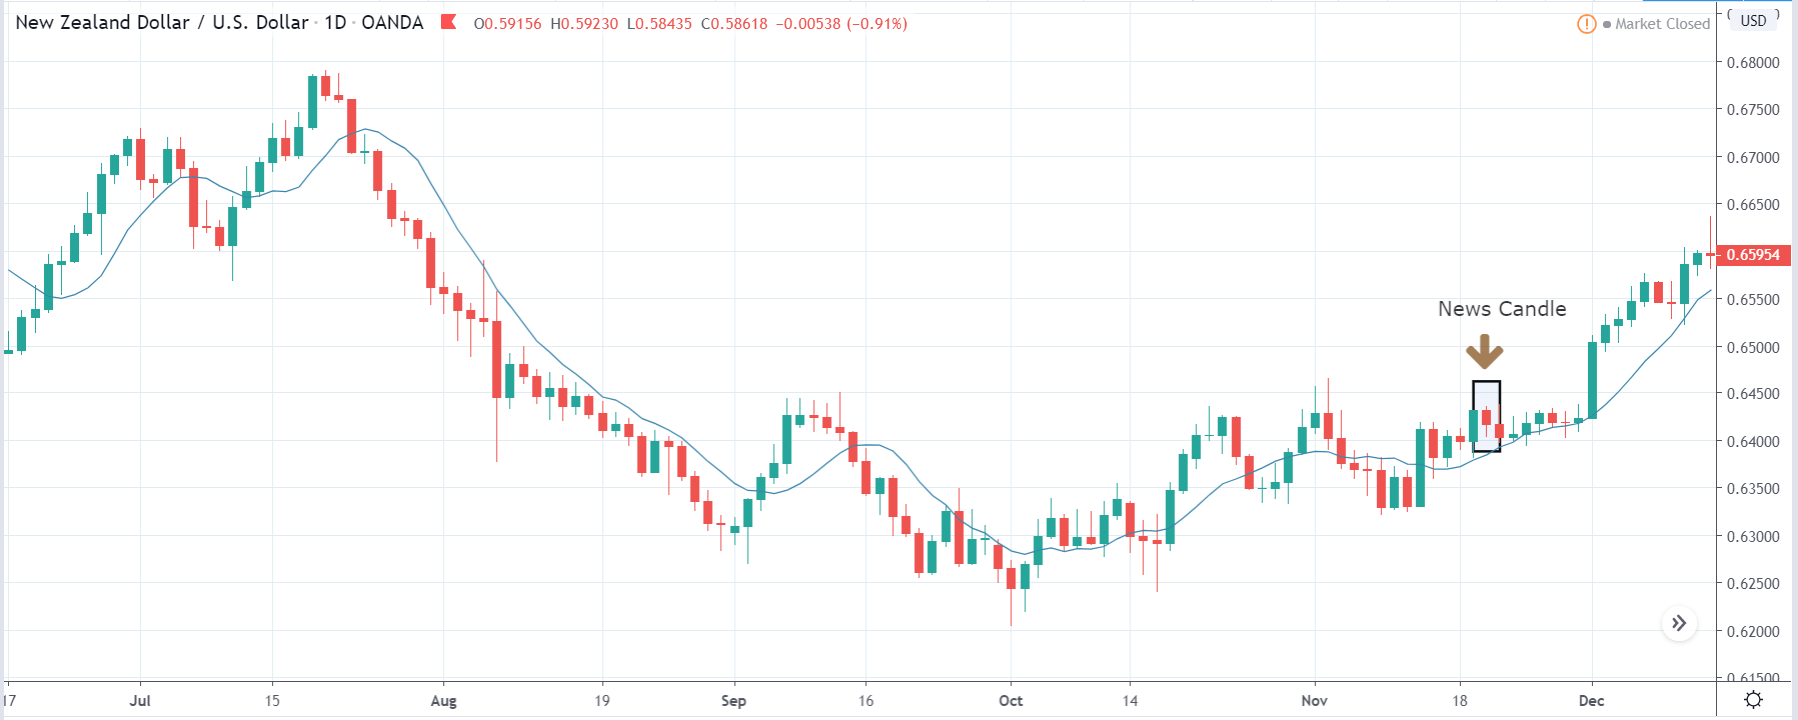
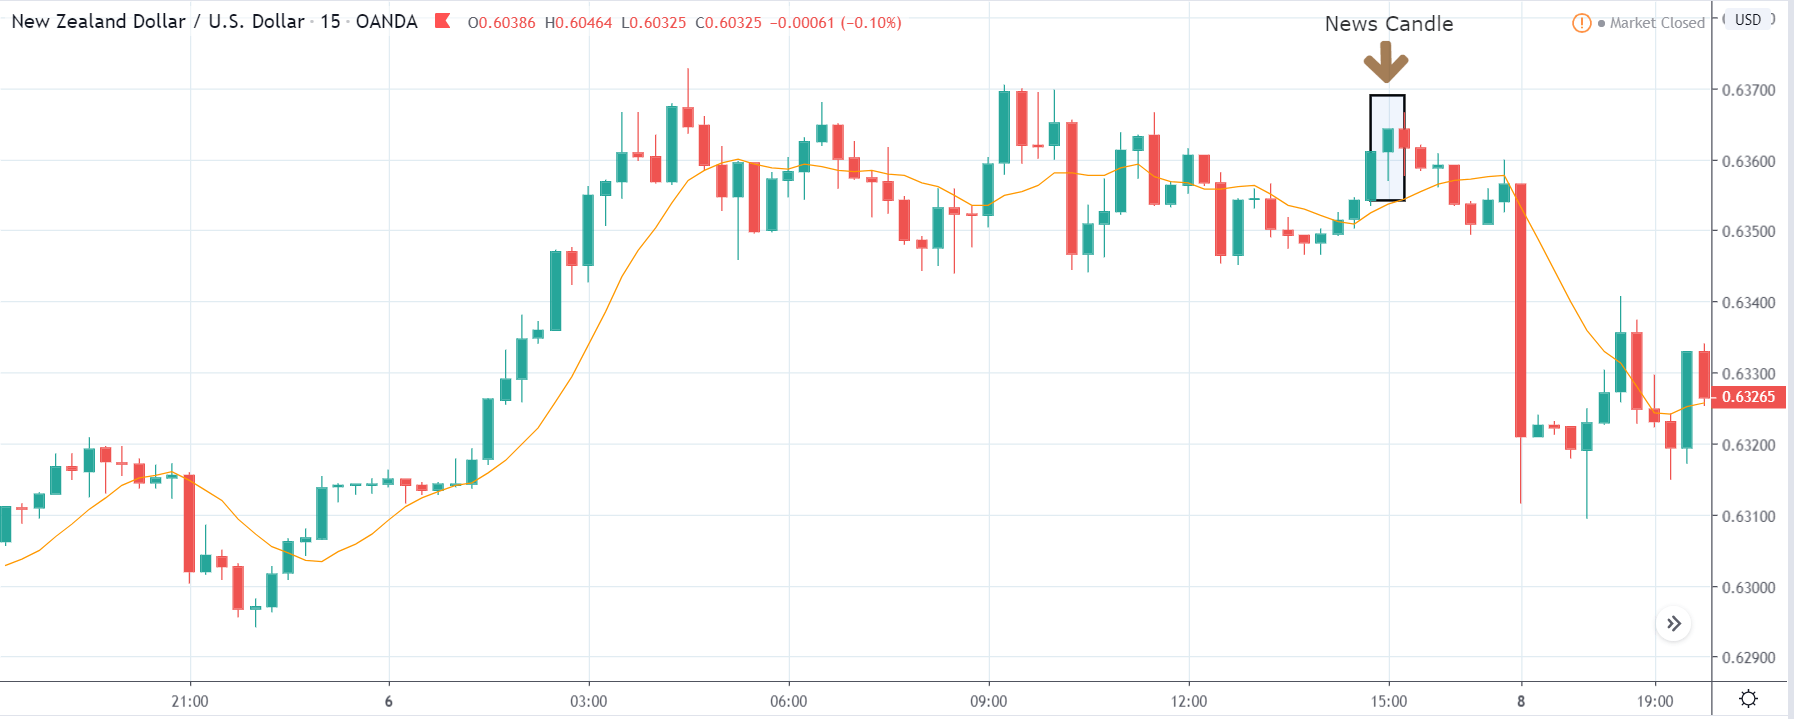
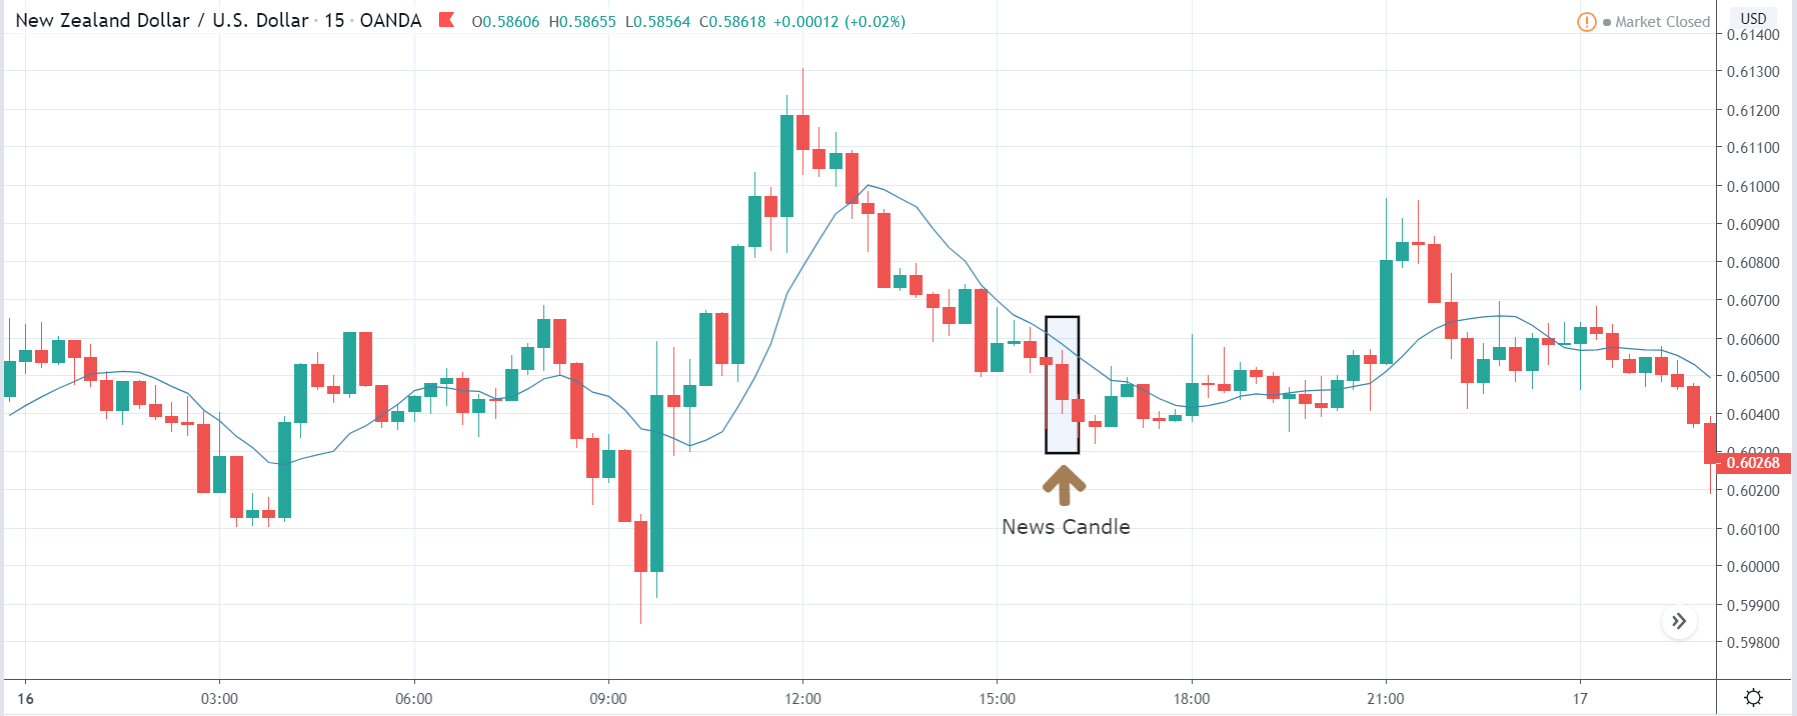
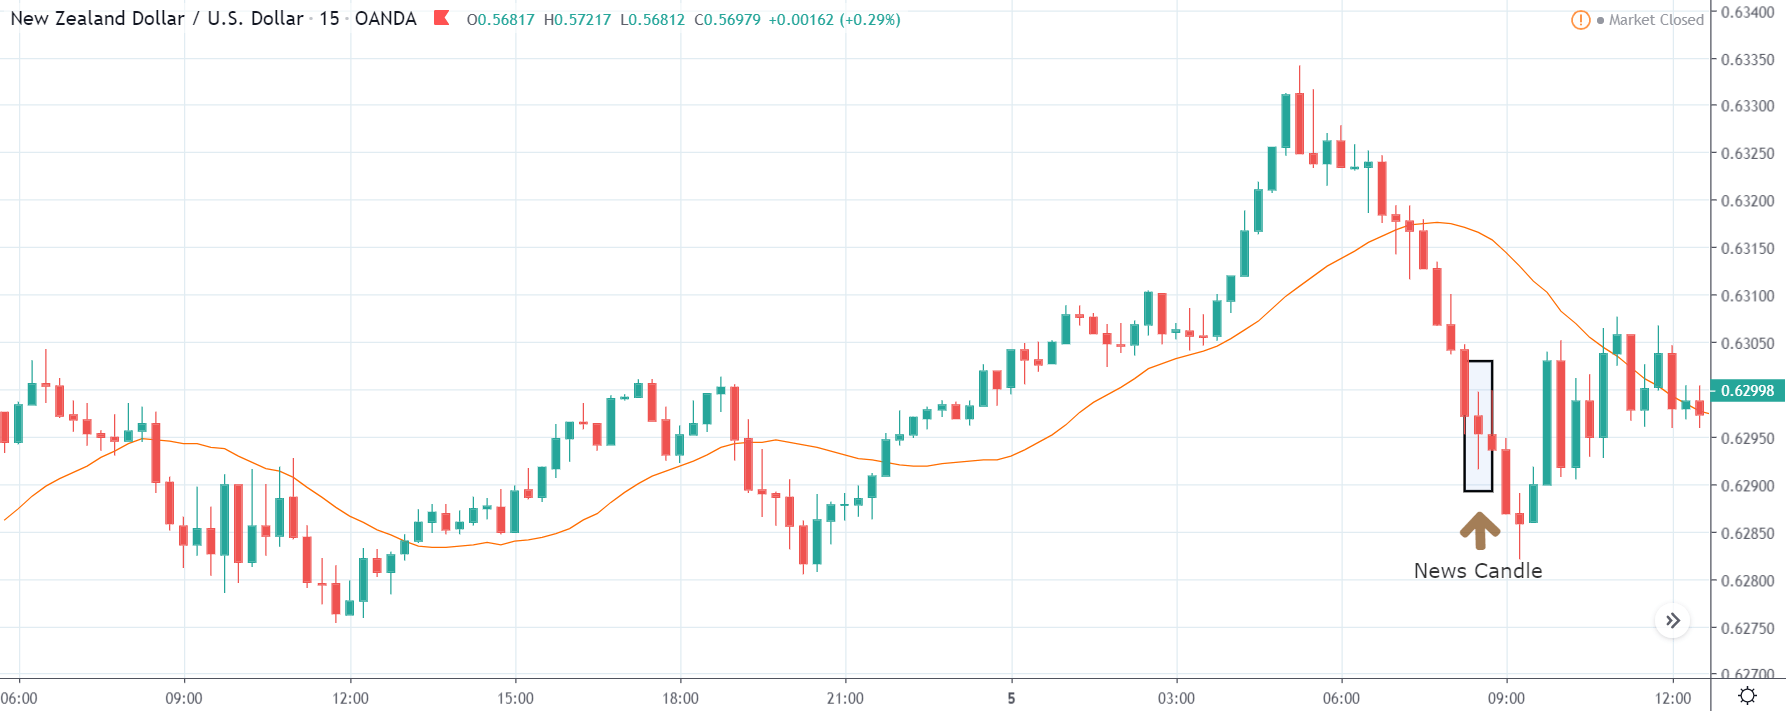
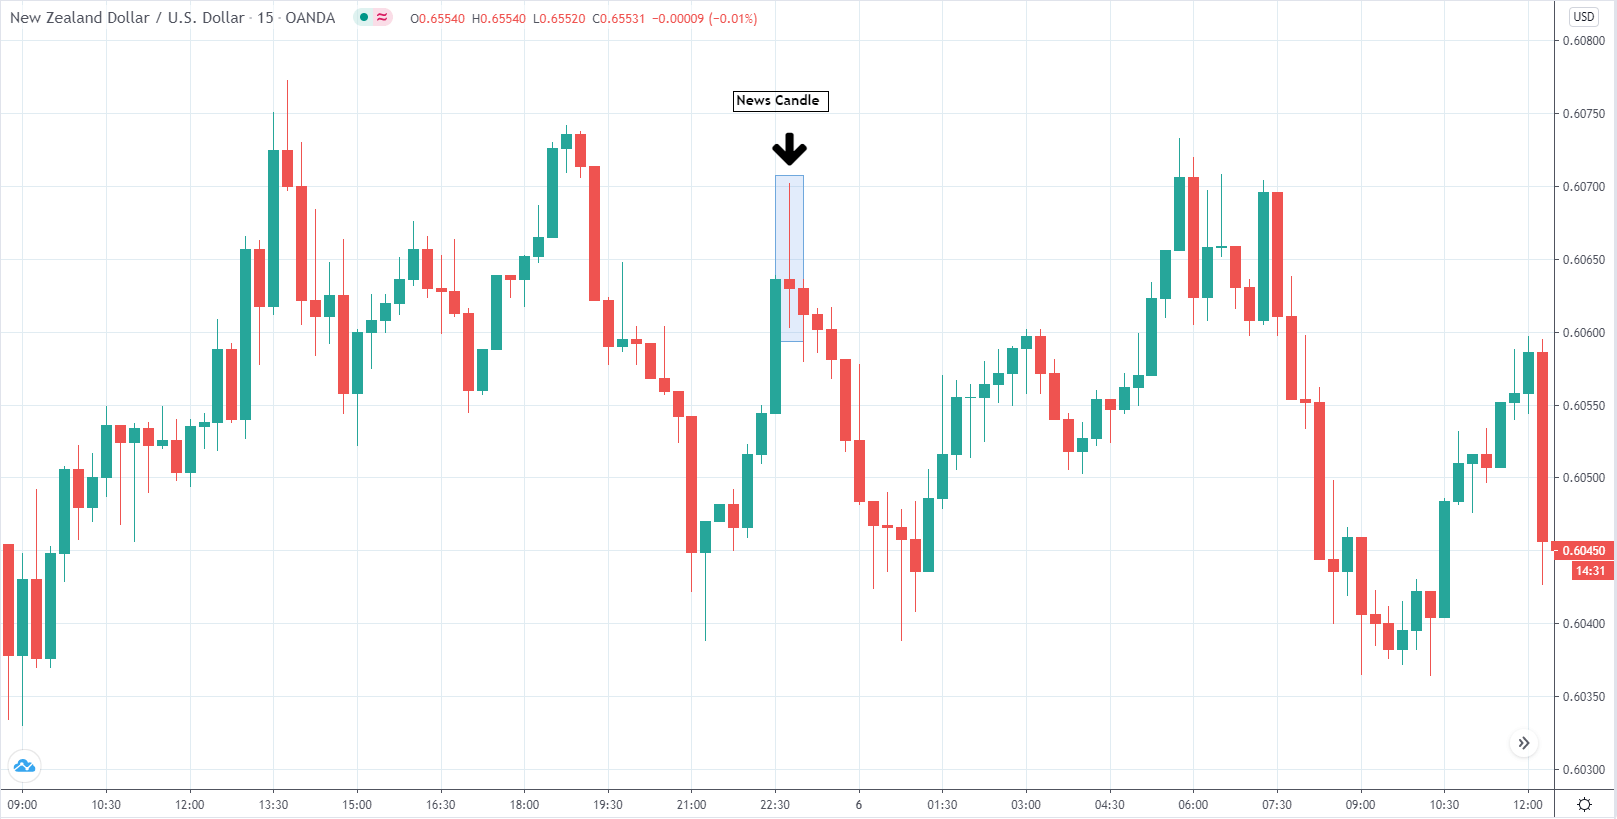
NZDUSD – After the Announcement
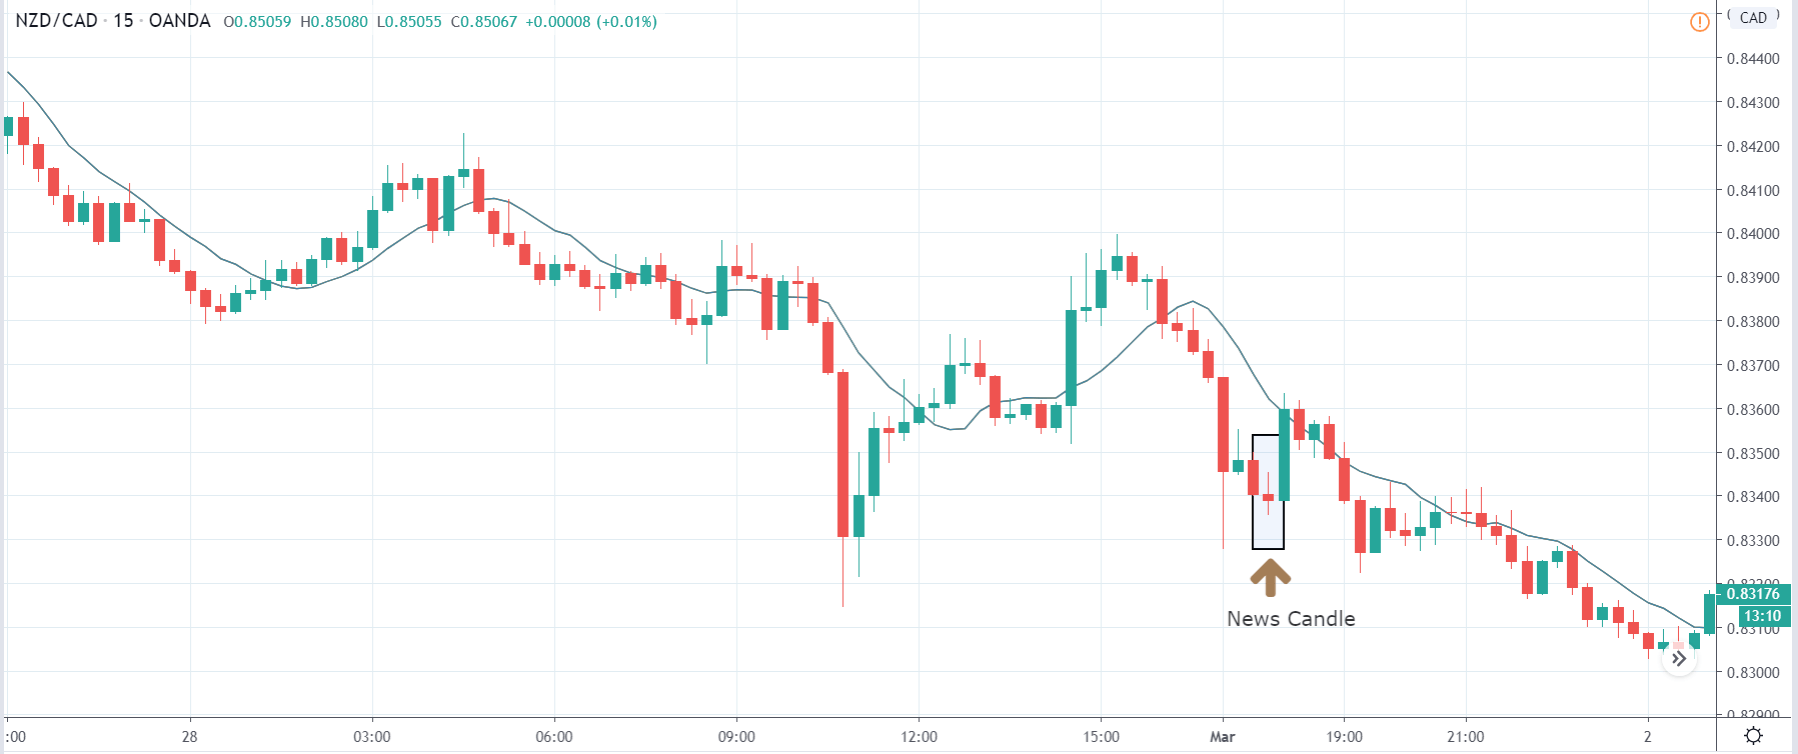
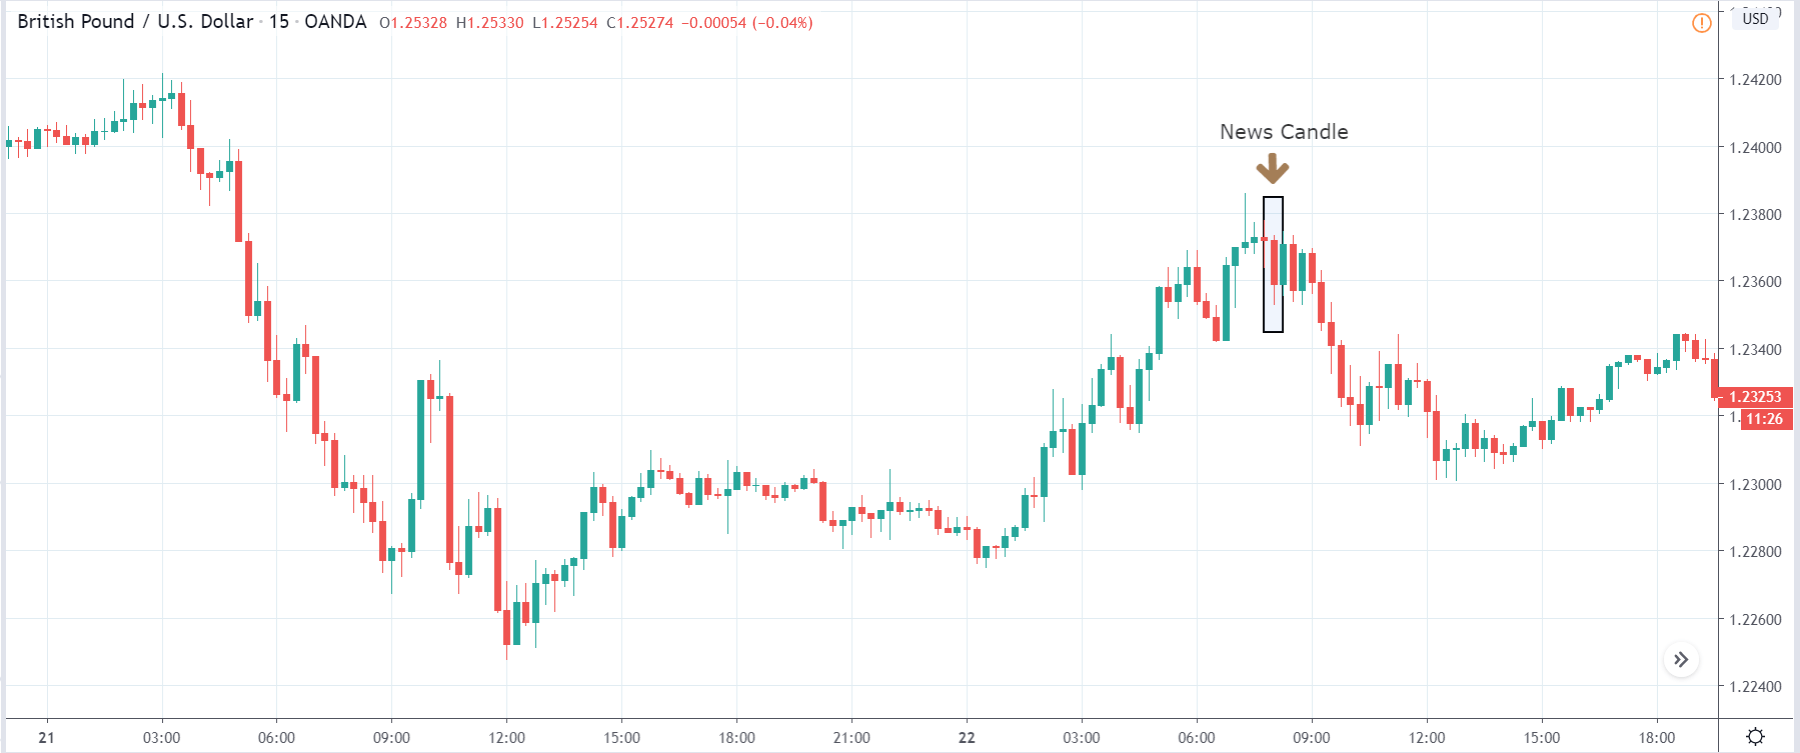
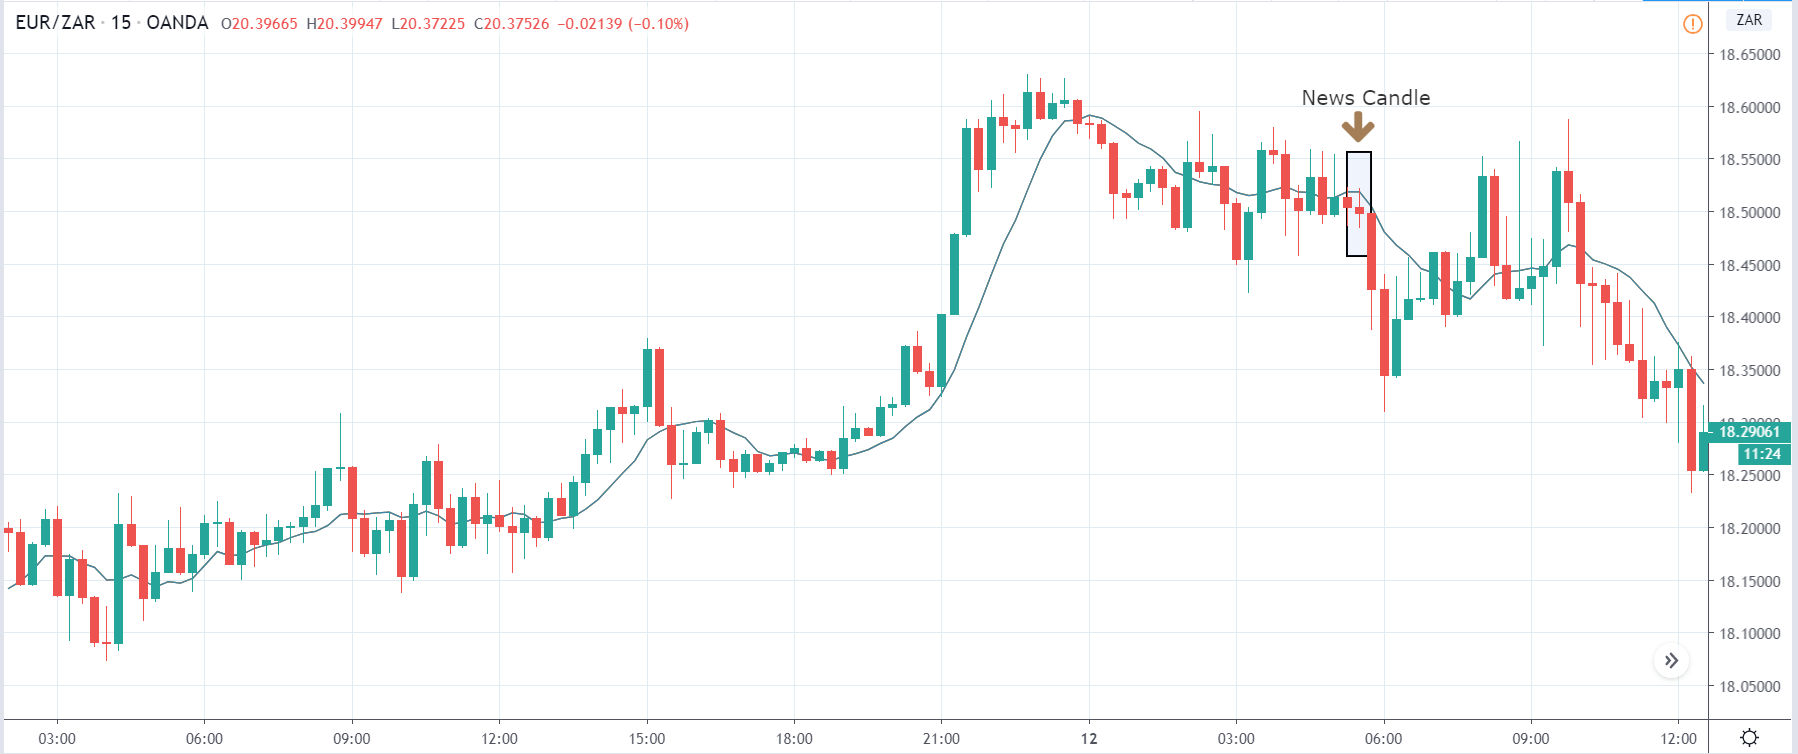
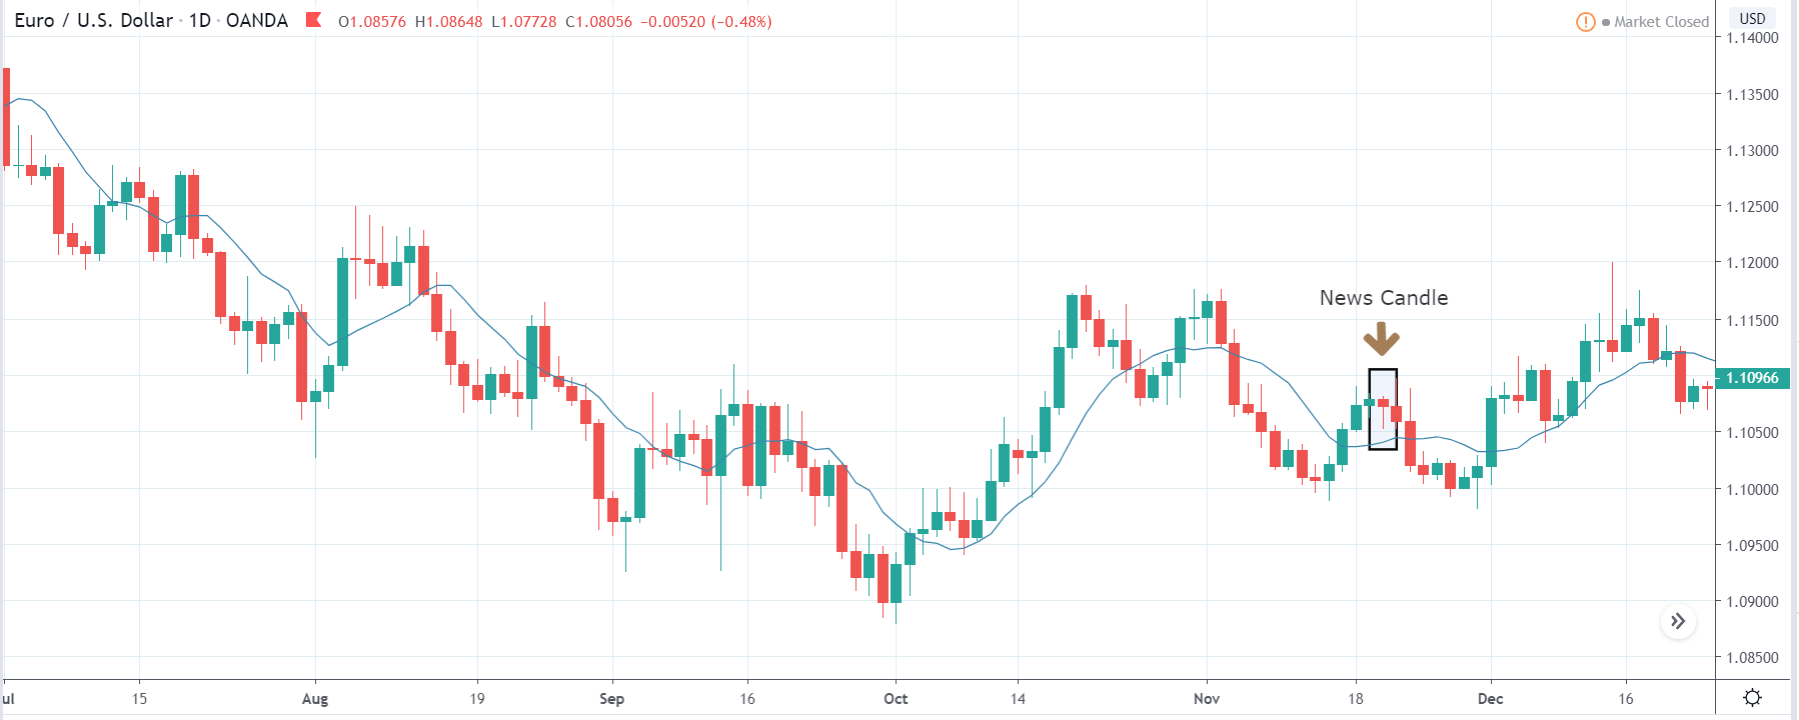
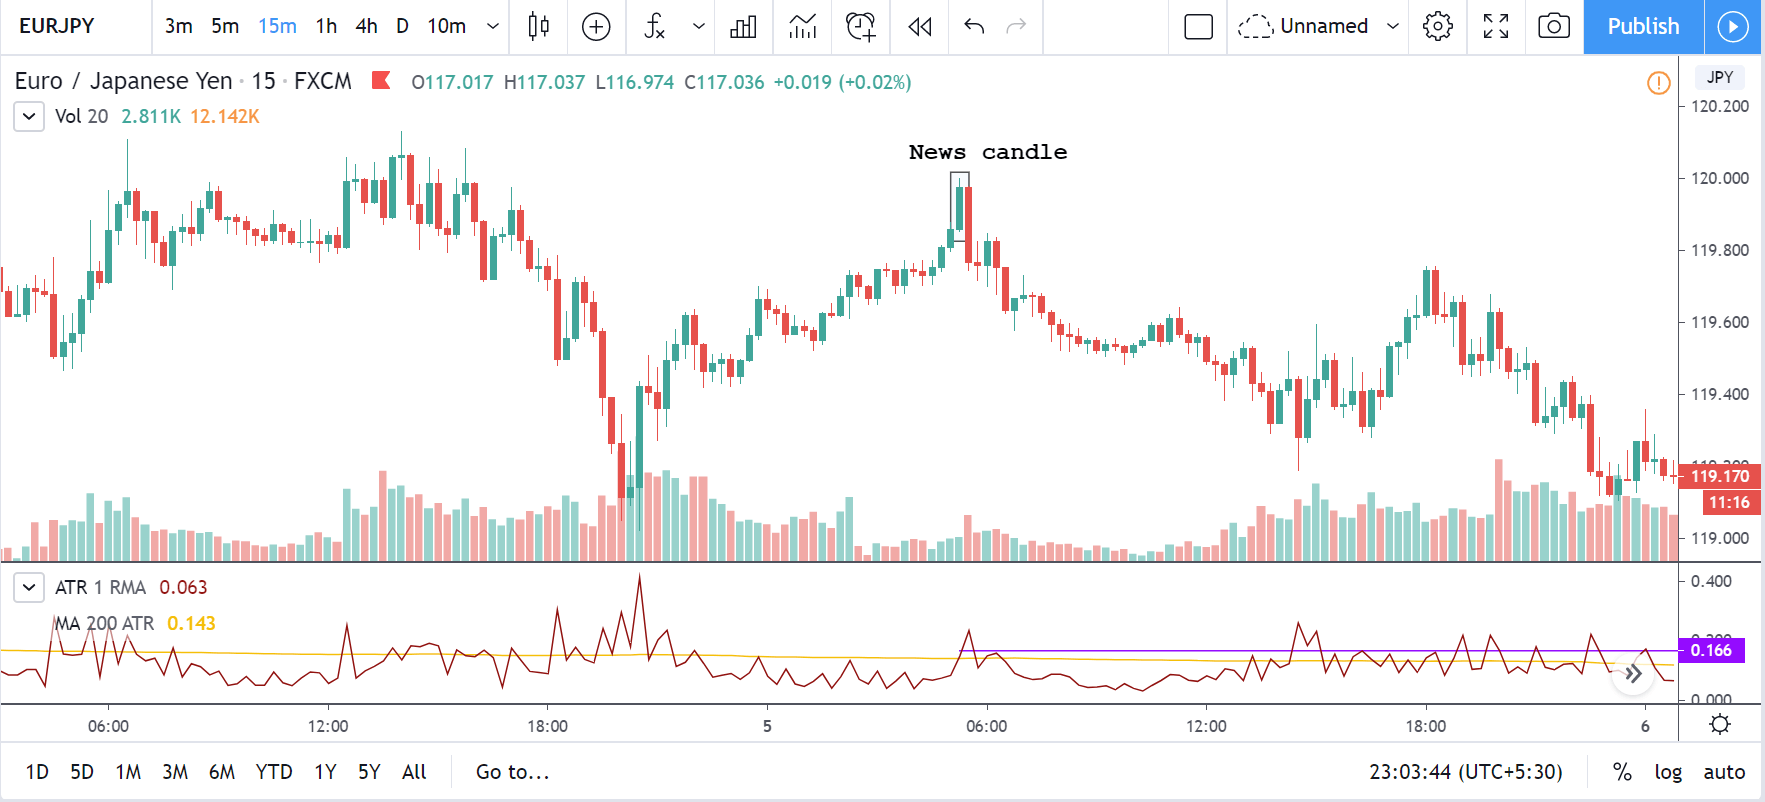
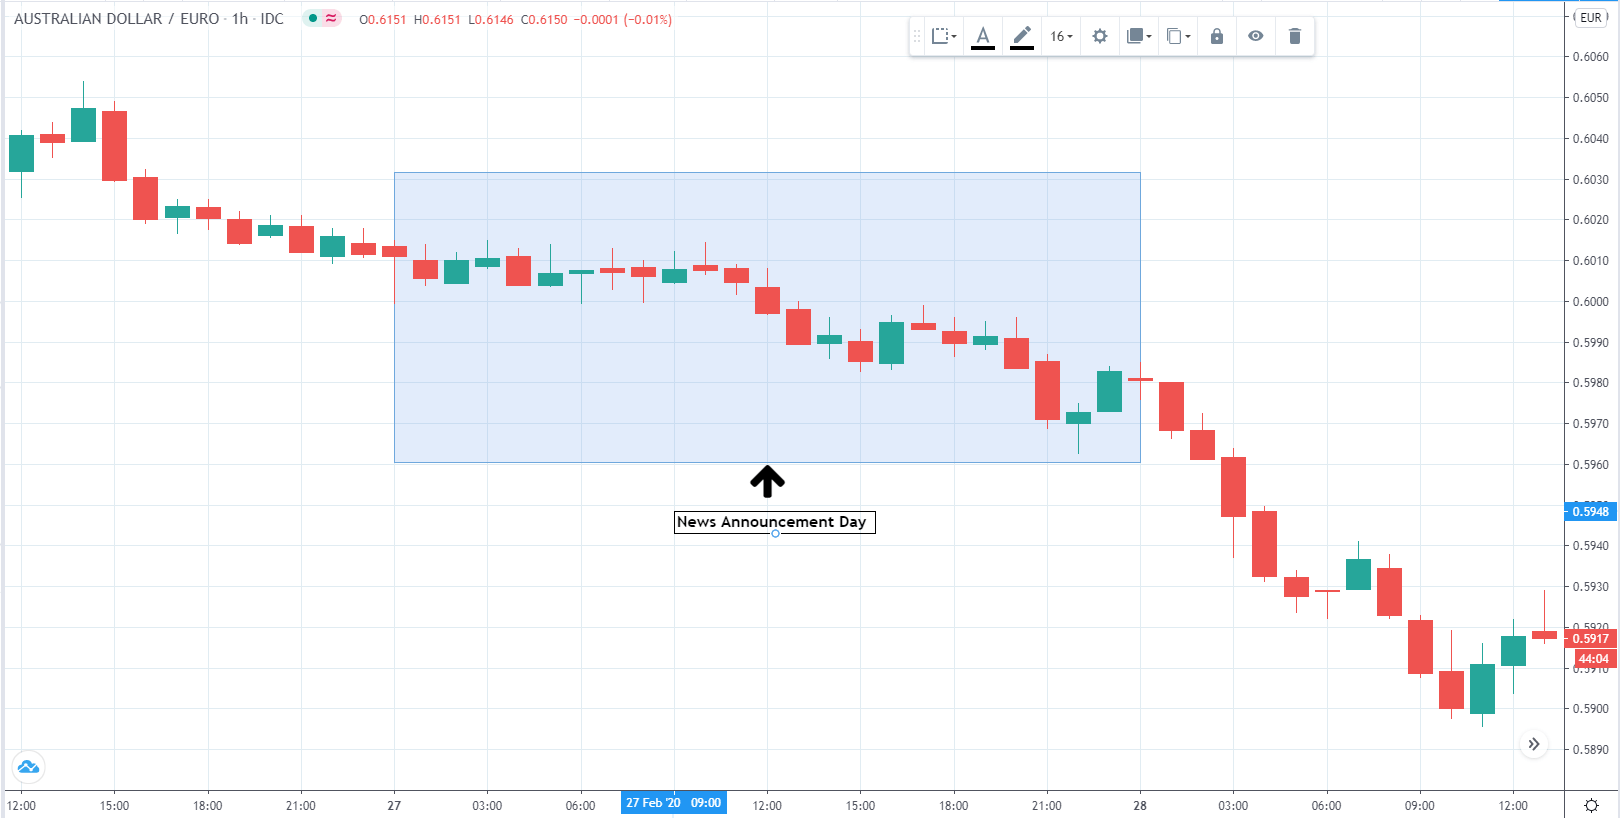
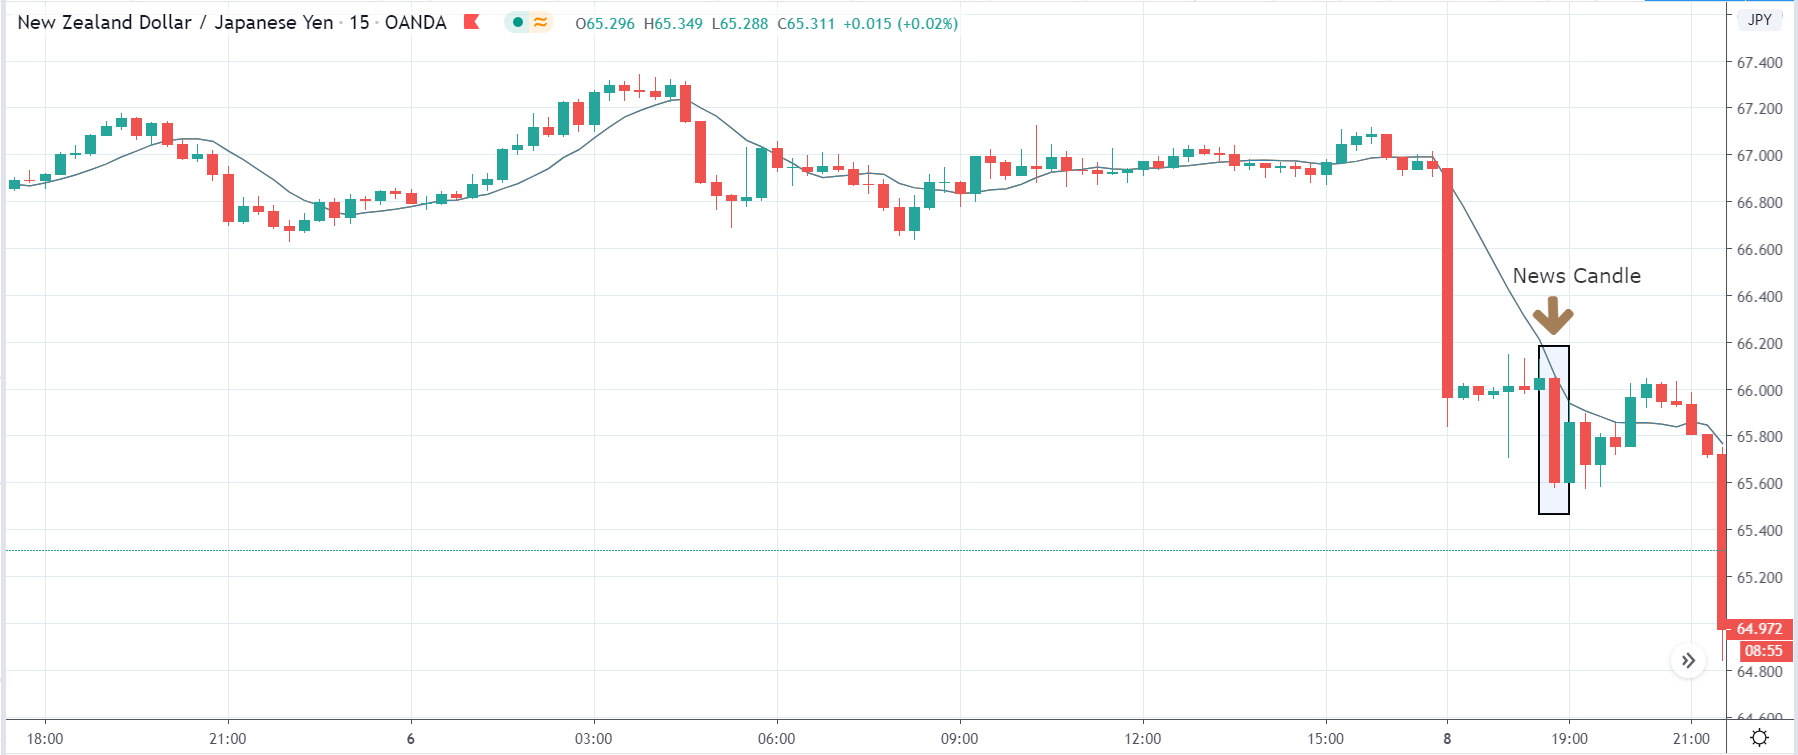
On the day of the report announcement, the NZD showed strength, while USD showed weakness. However, the volatility and volume remained average. In the following days, the bullishness remained intact. In fact, after consolidating for a while at the resistance, the price made a new high. Thus, we can conclude that the Imports by Country indirectly did affect the USD price.

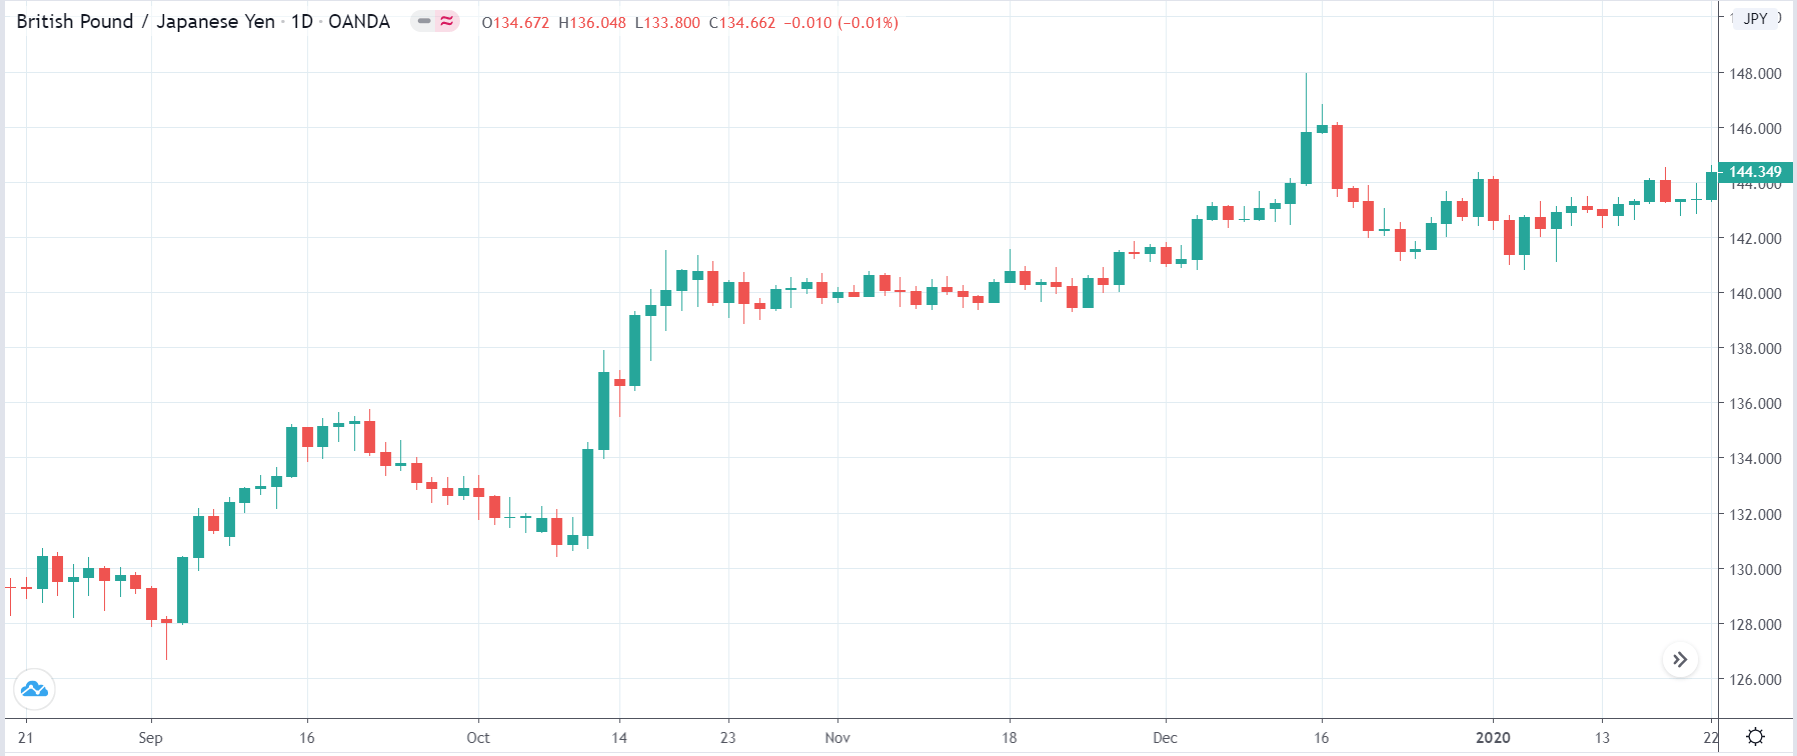
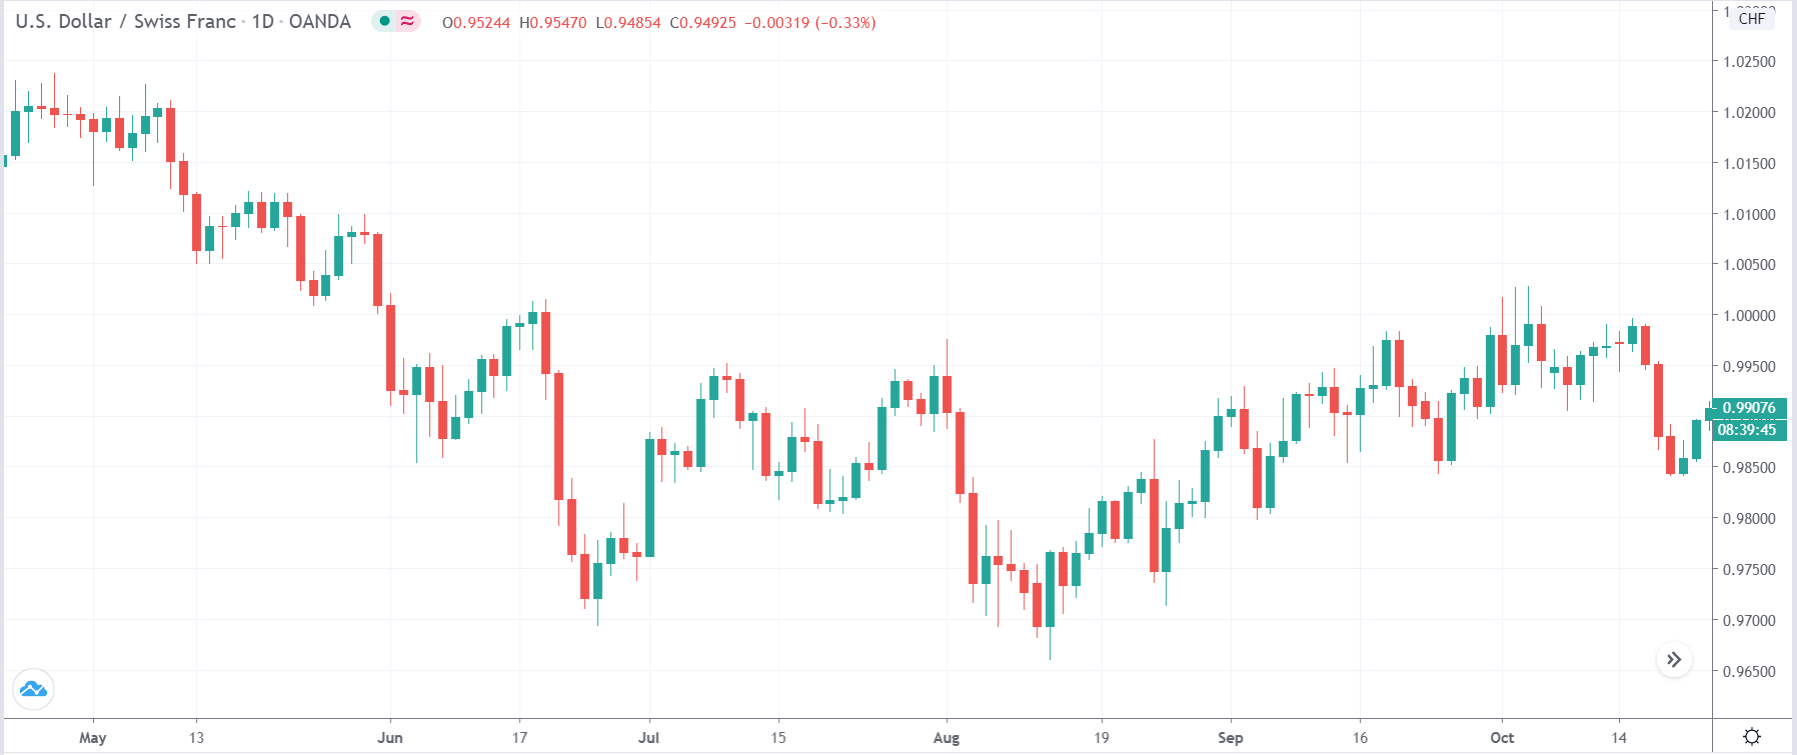
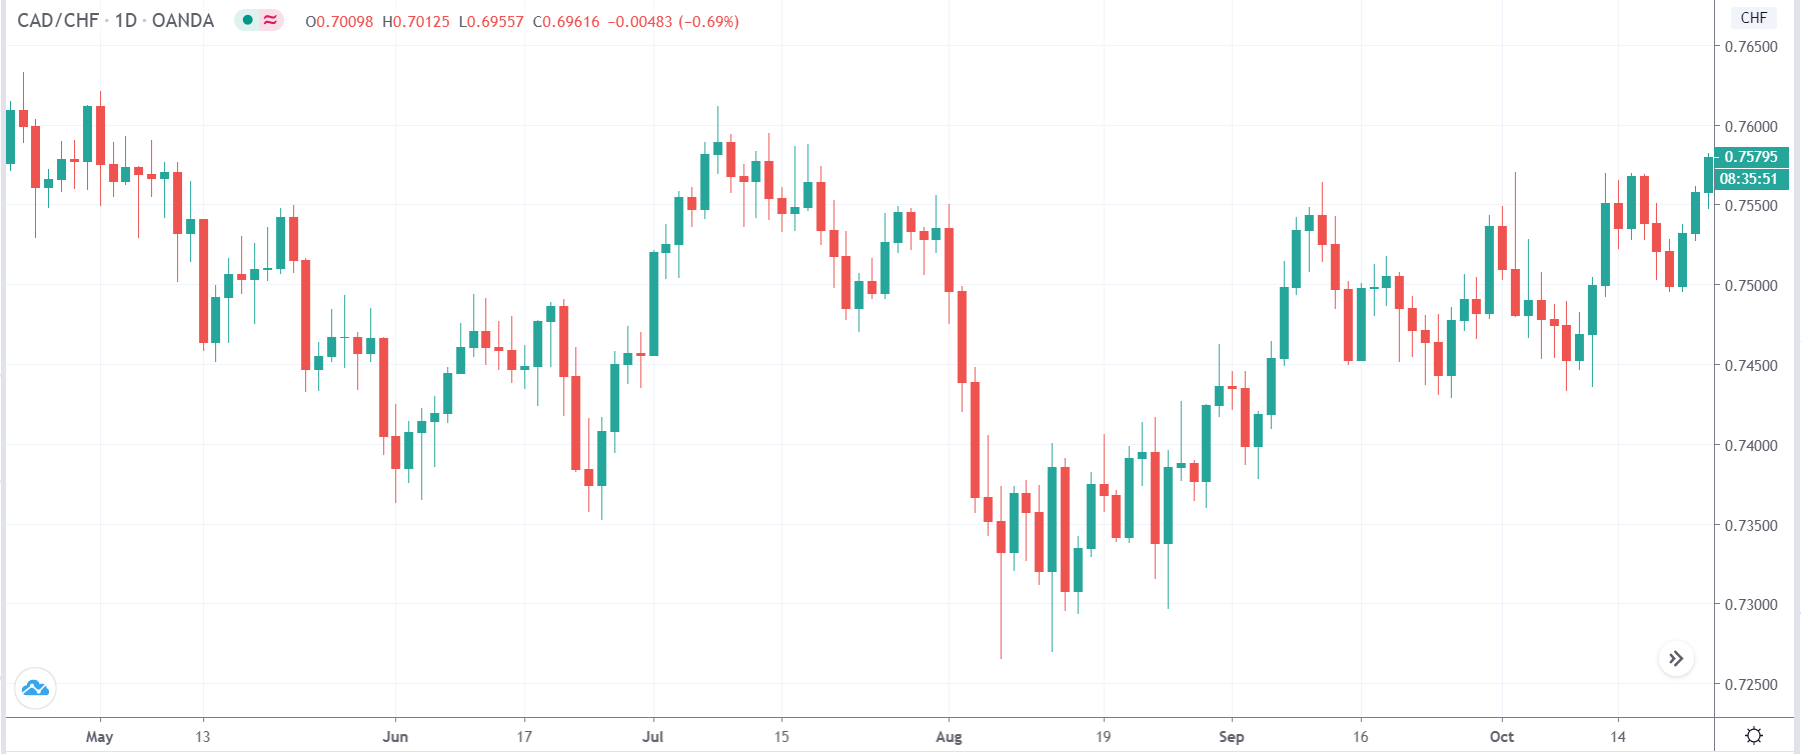
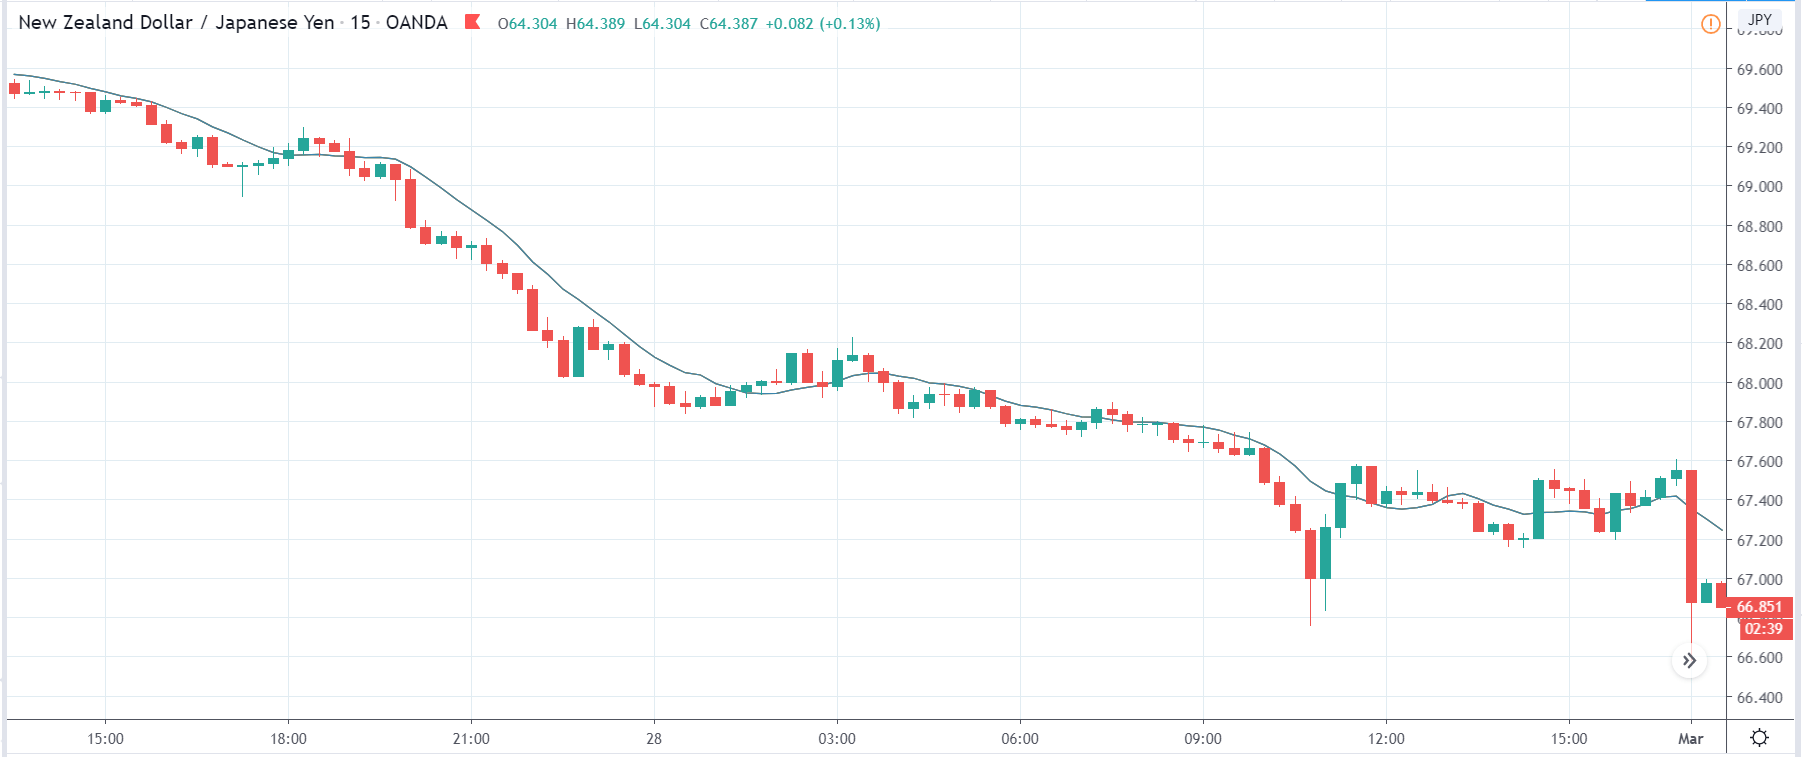
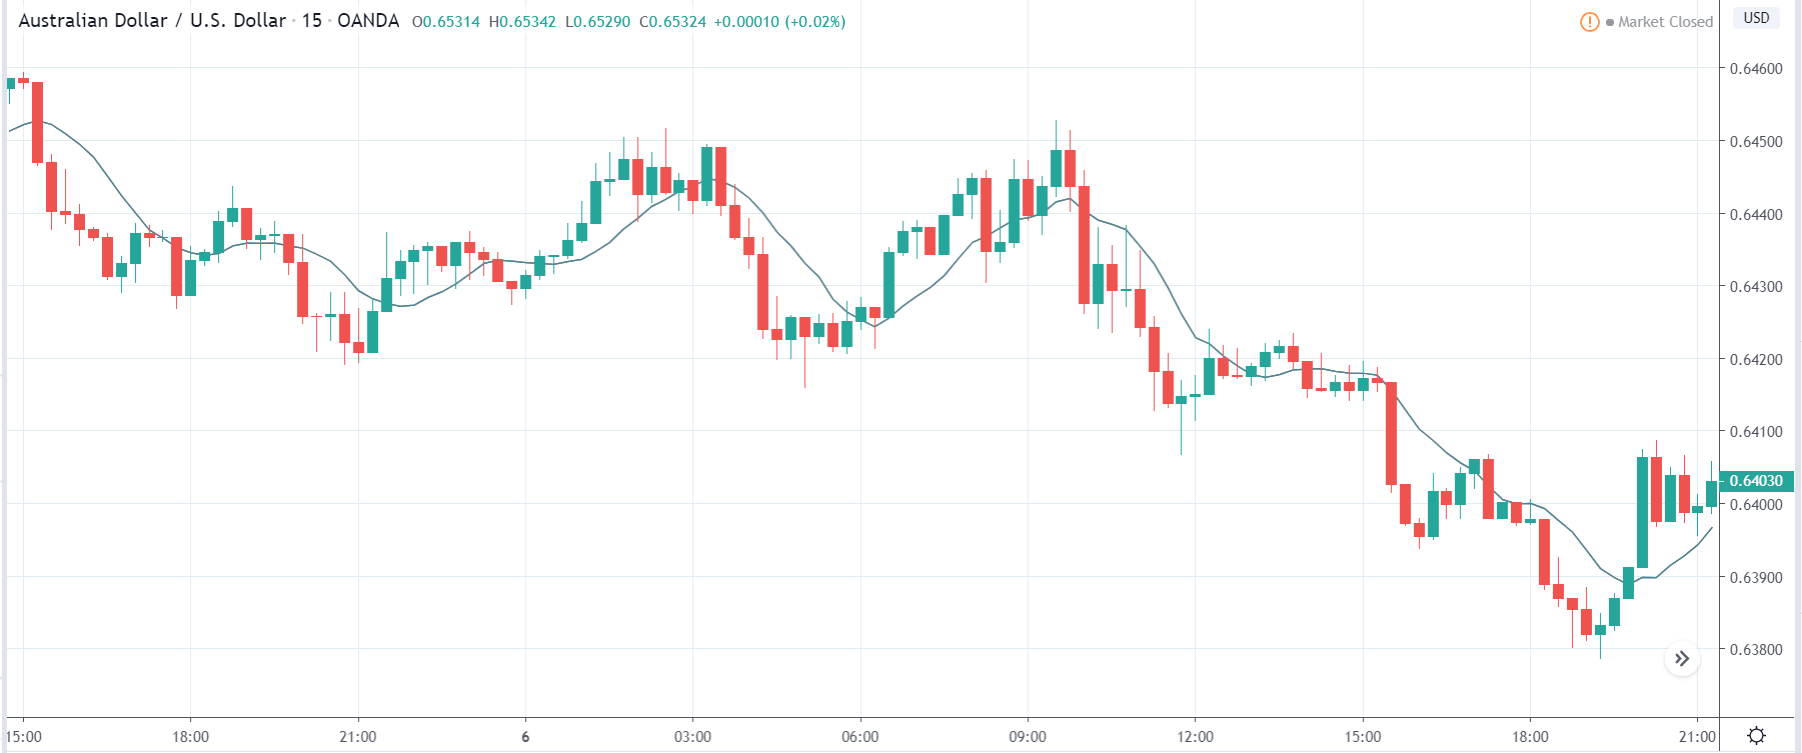
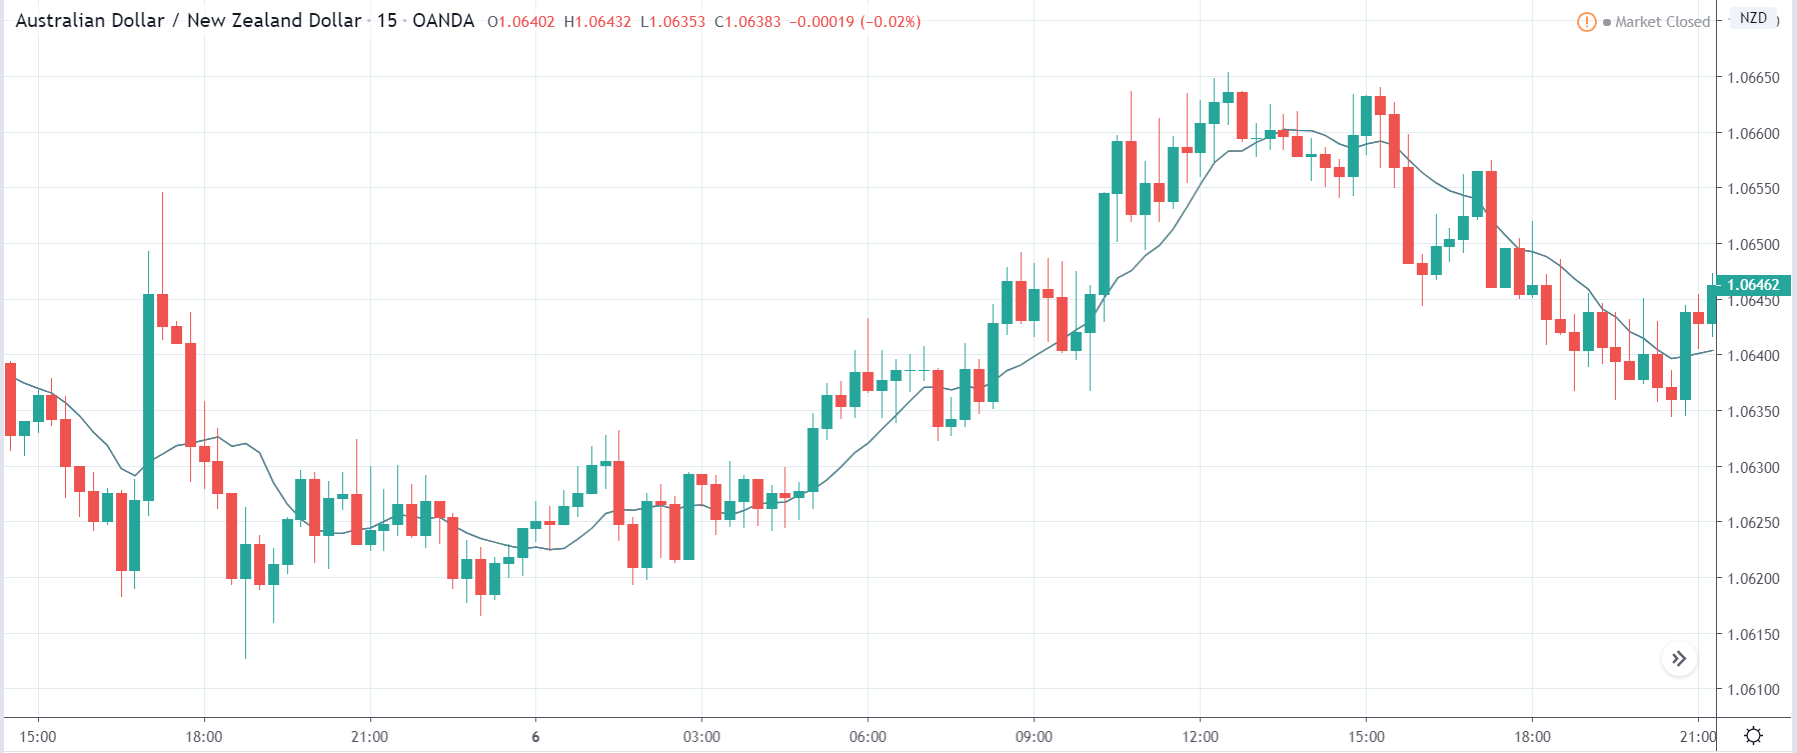
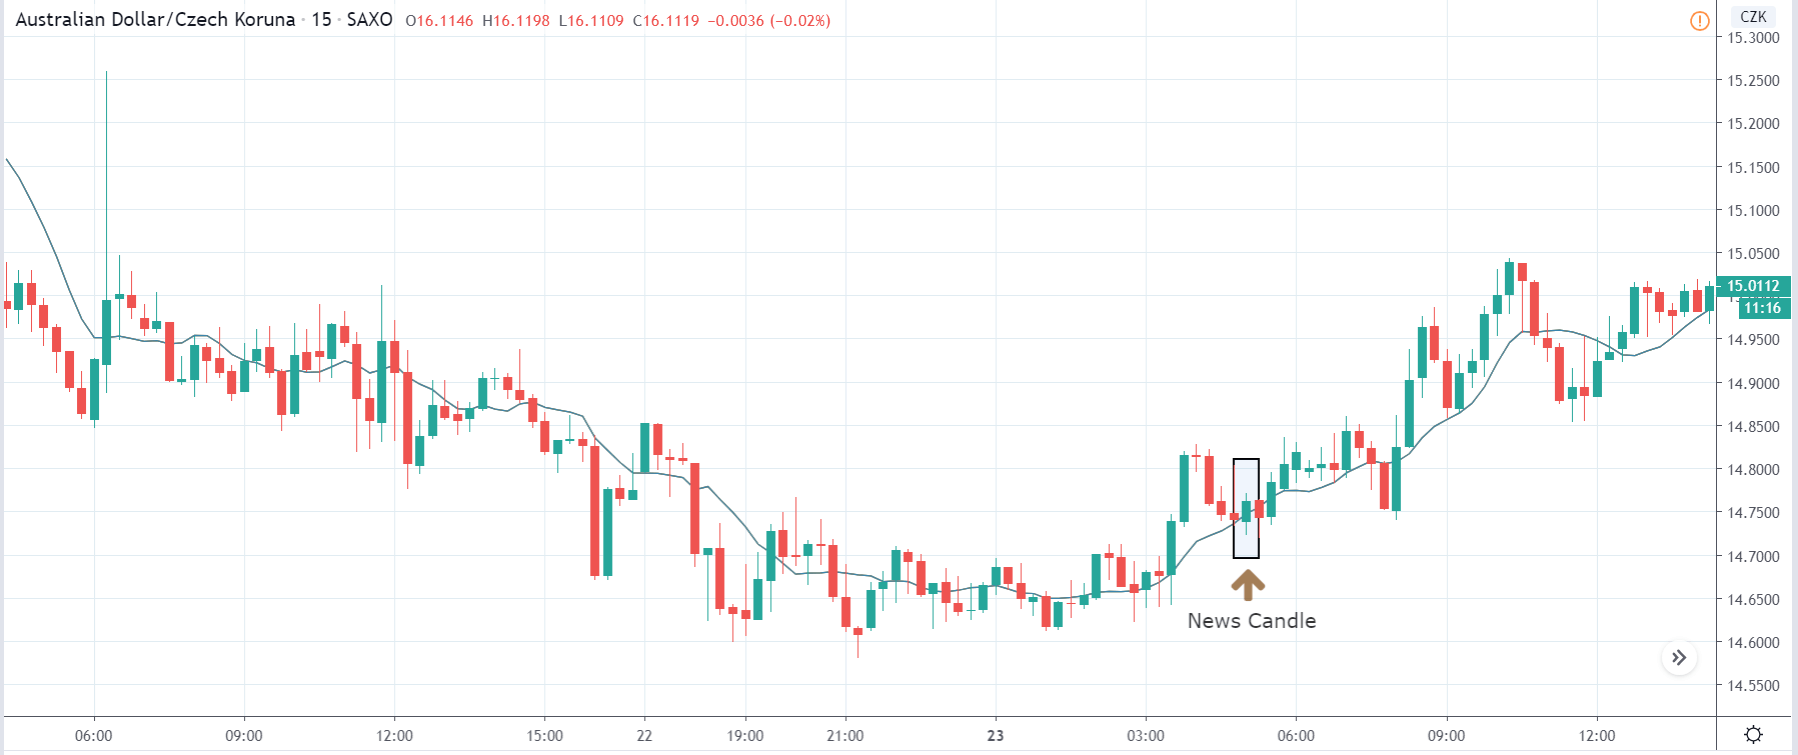
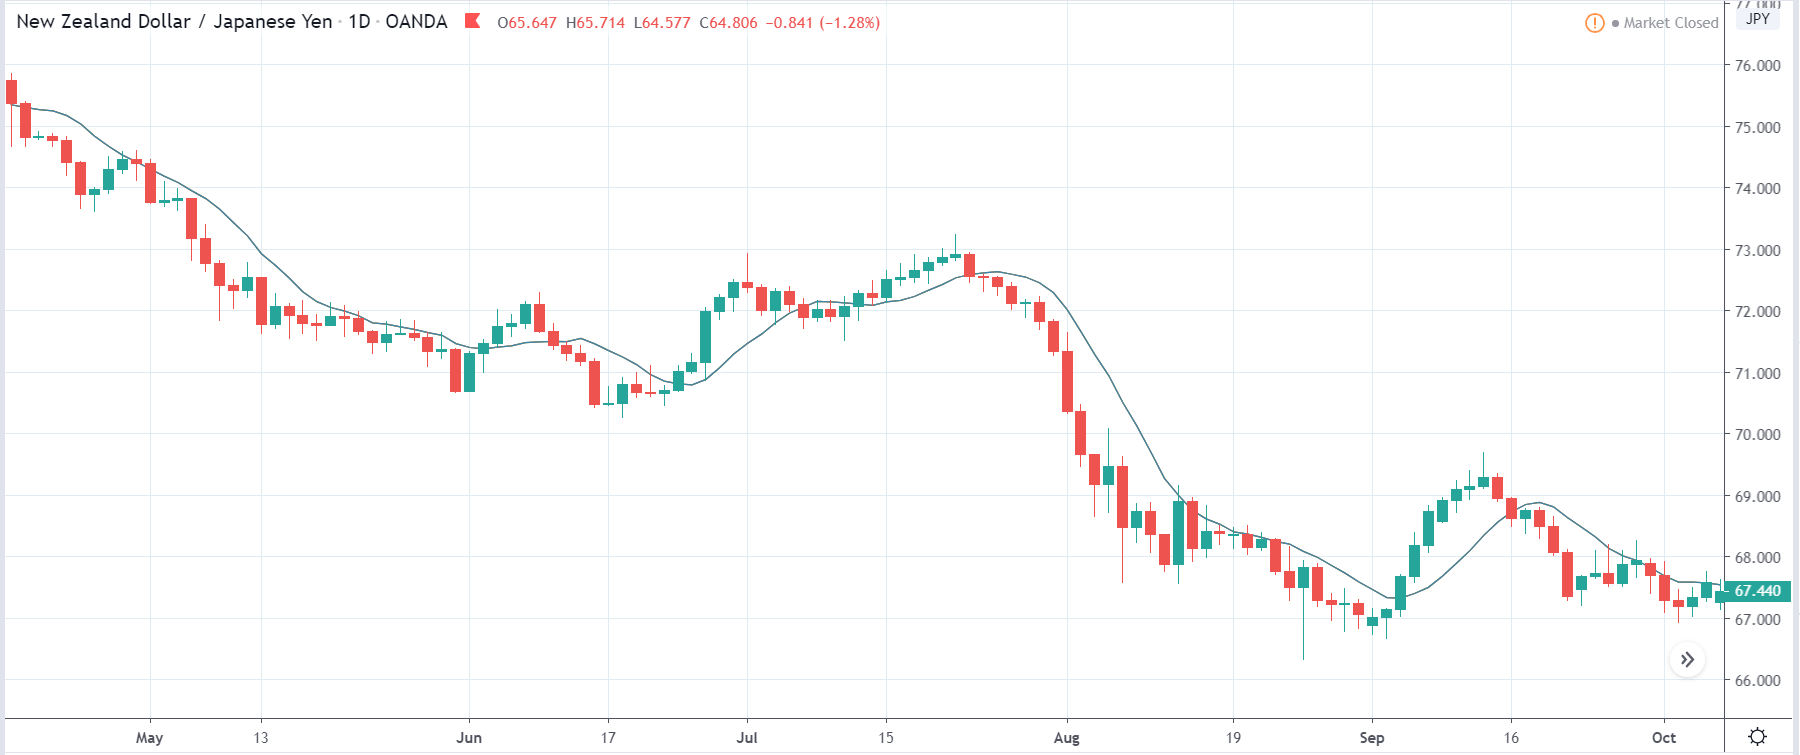
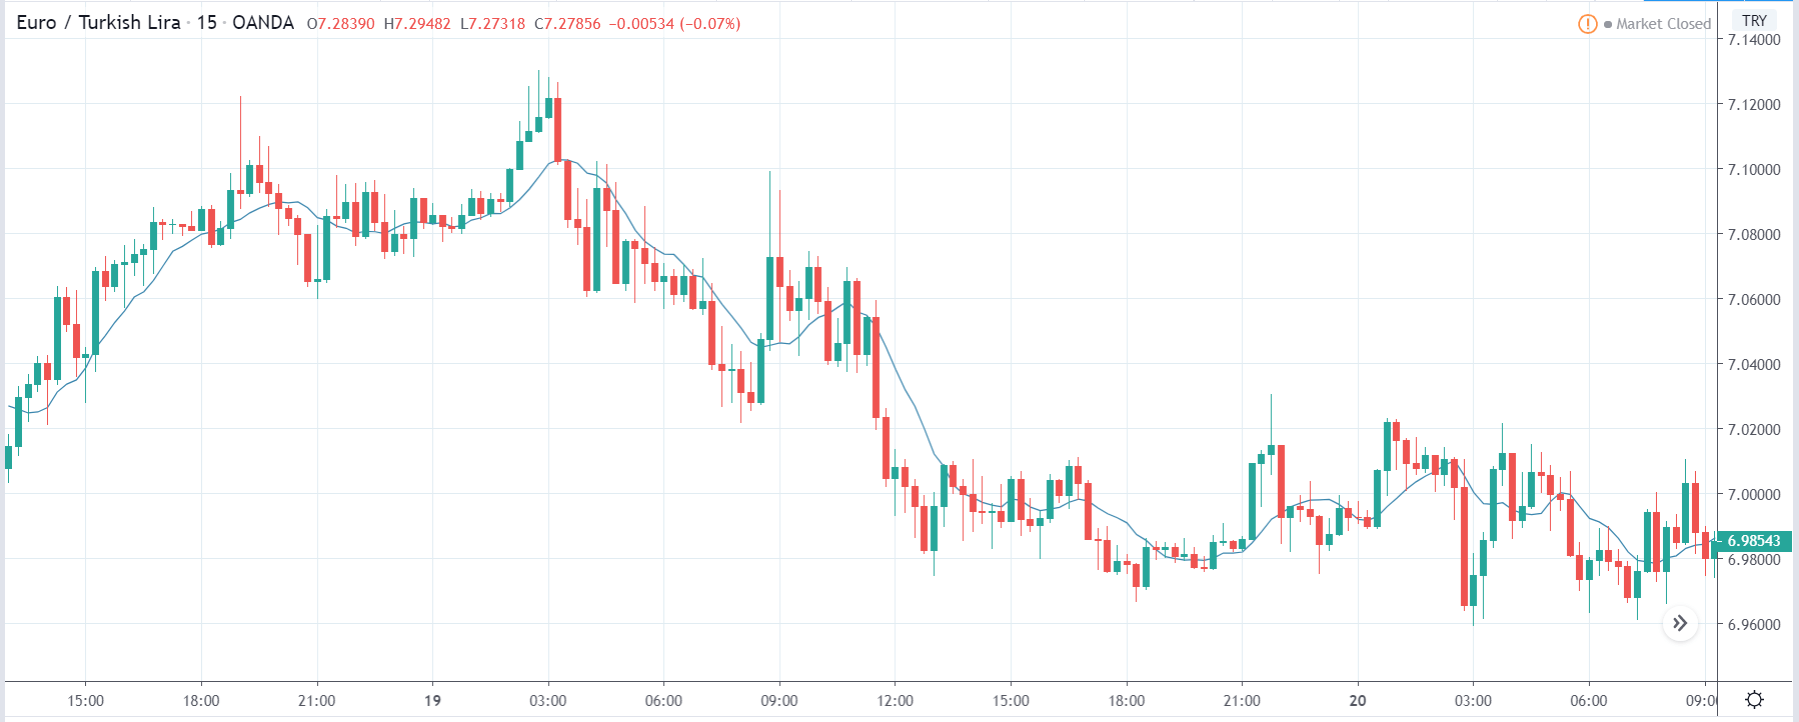
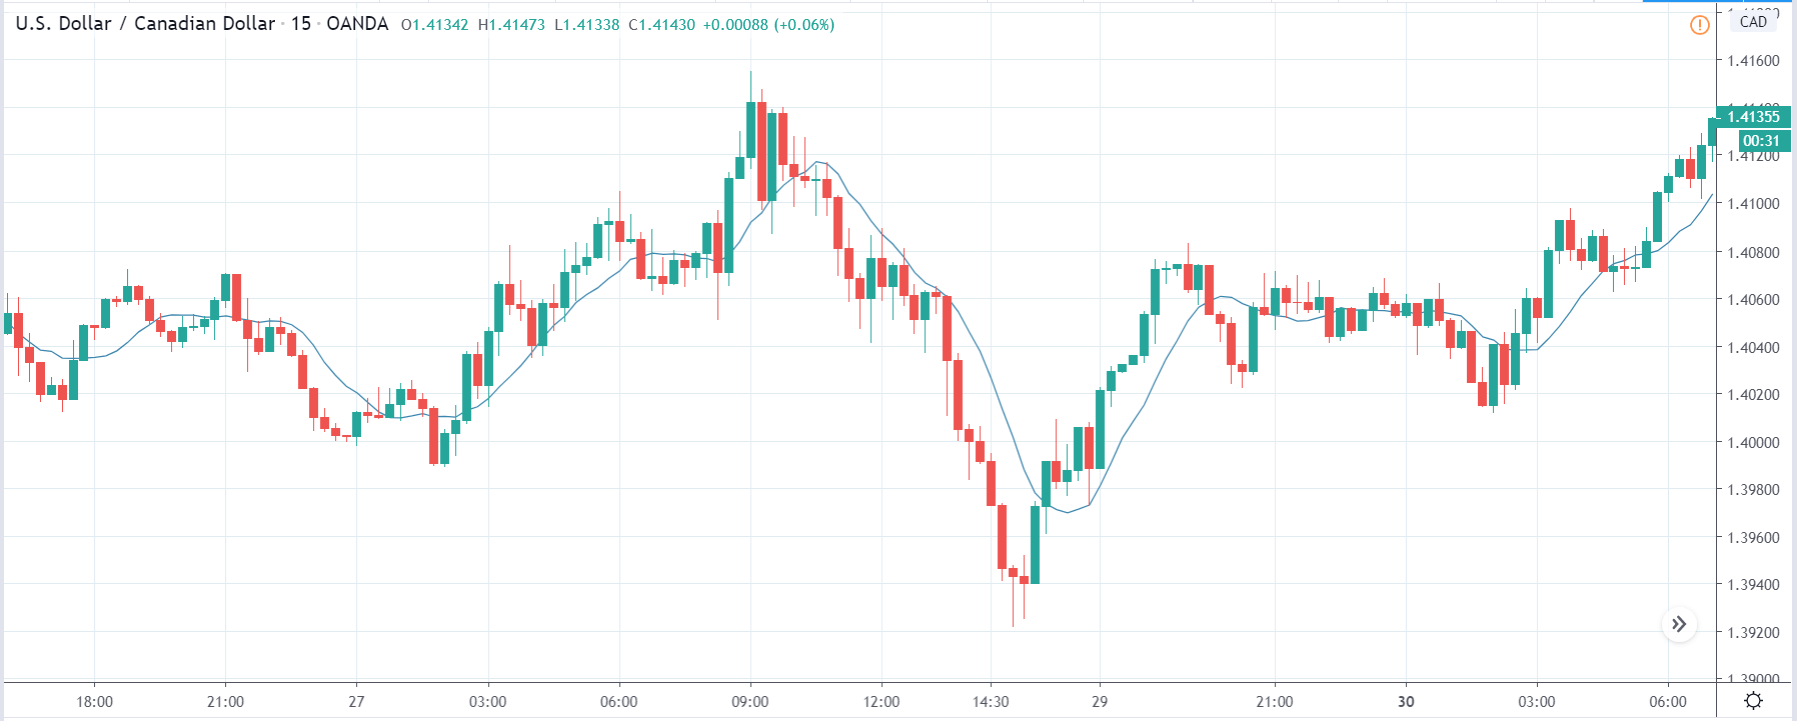
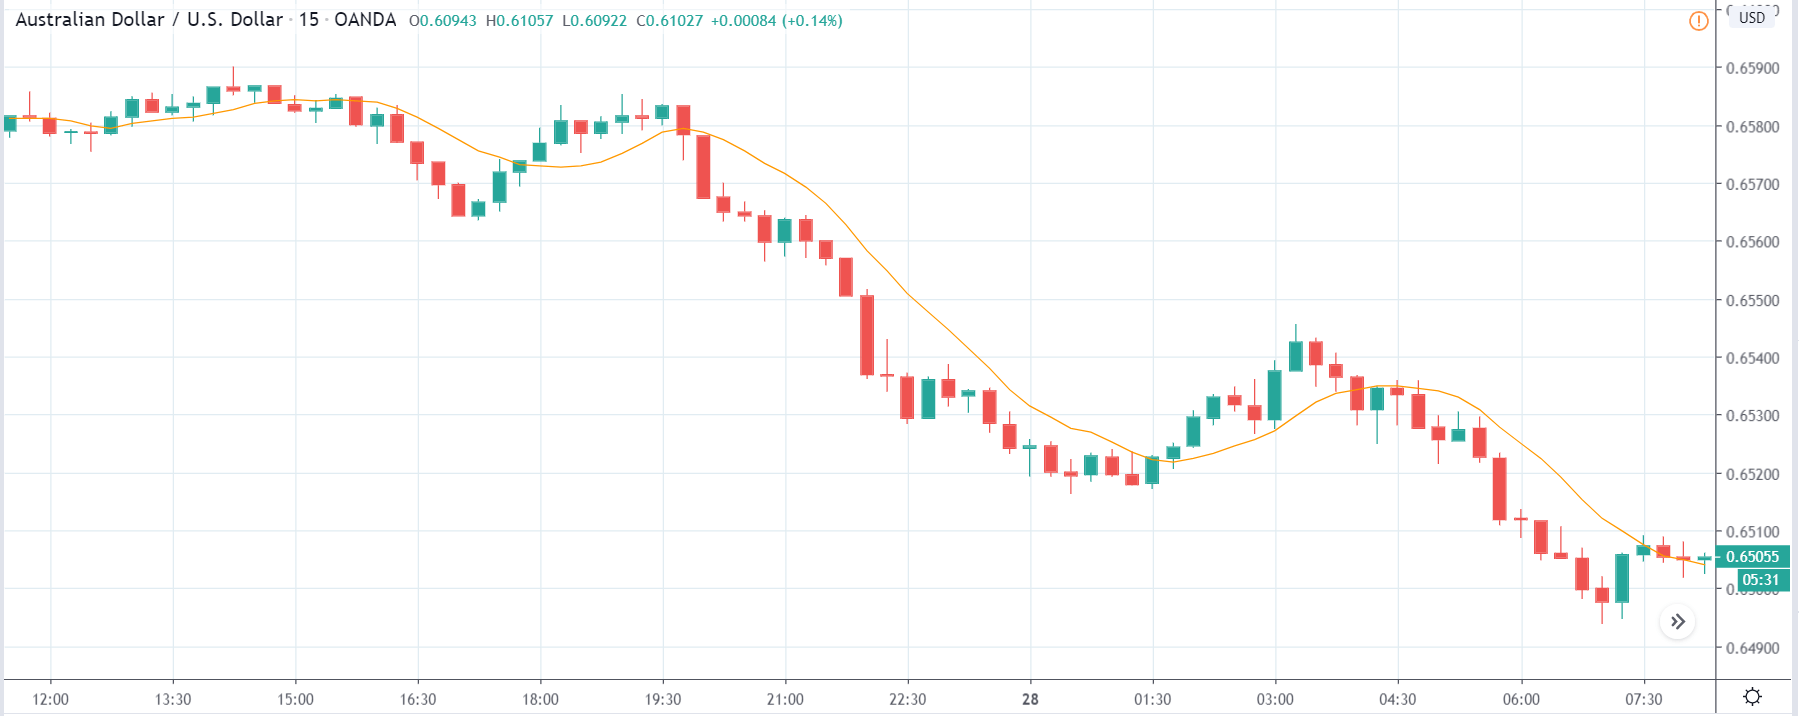
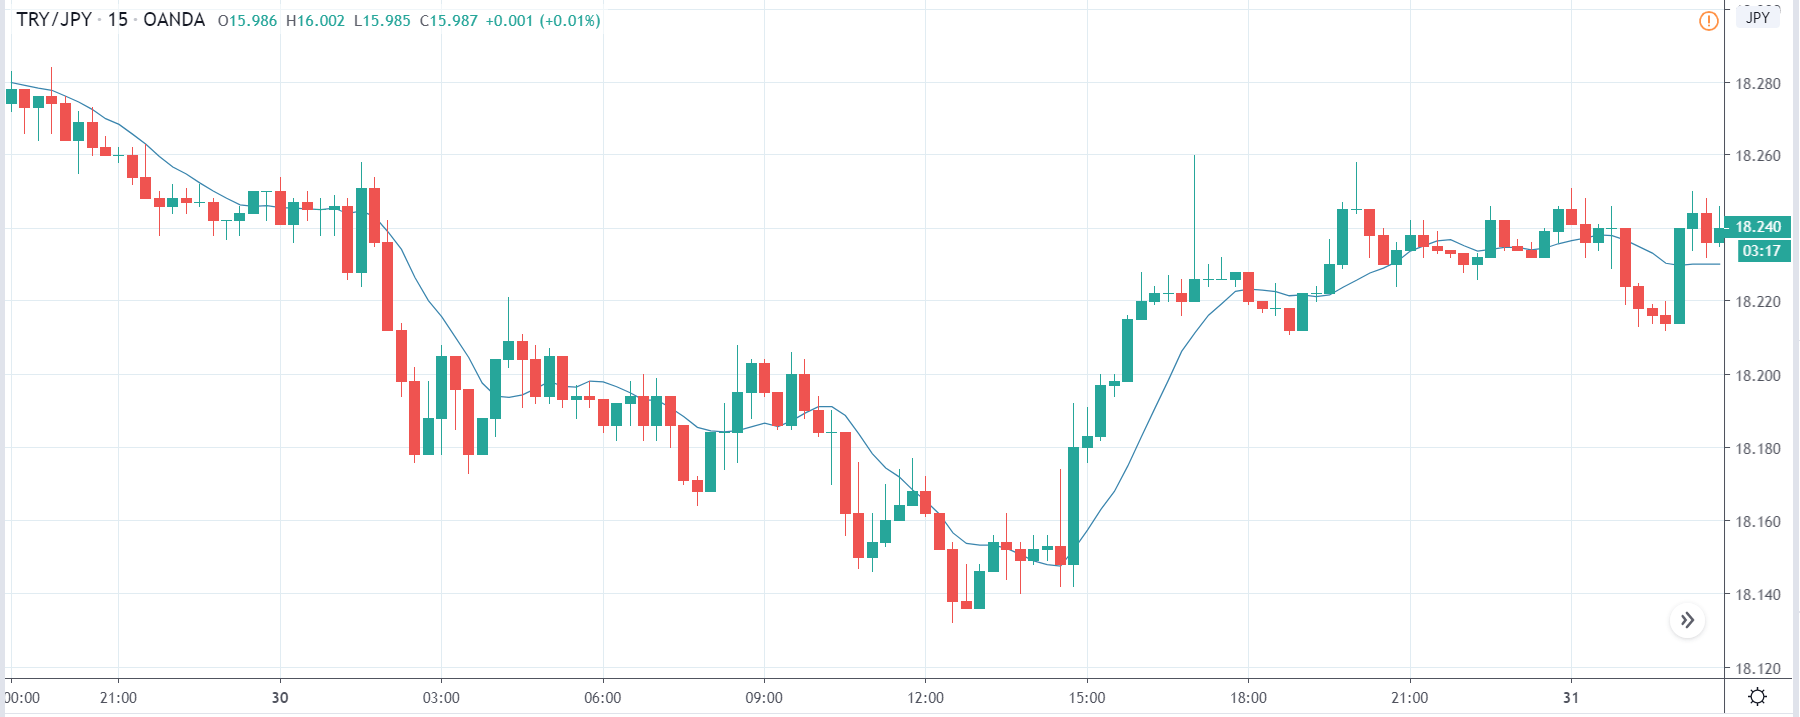
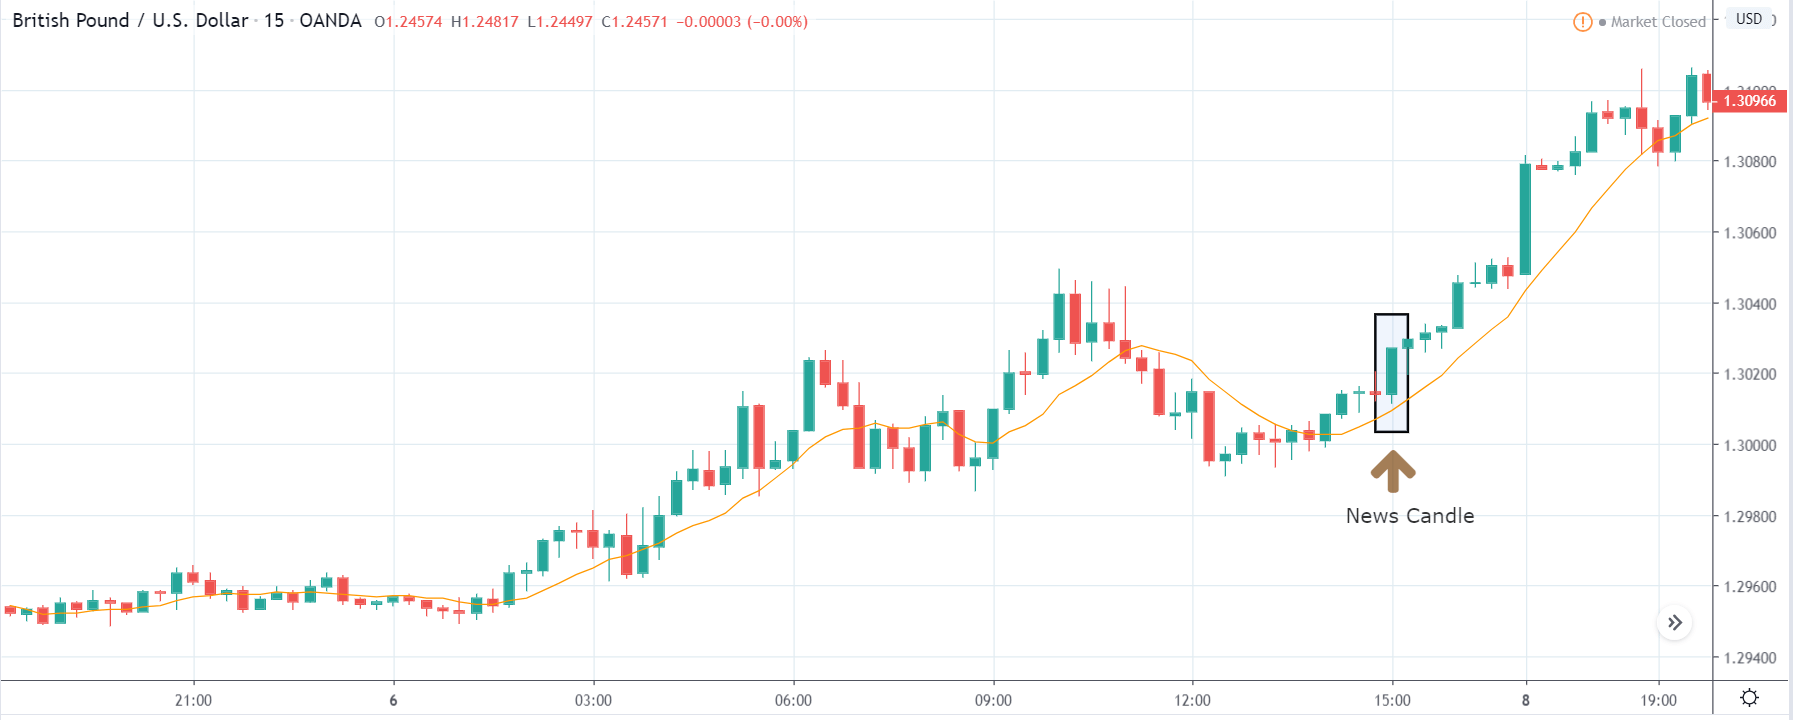
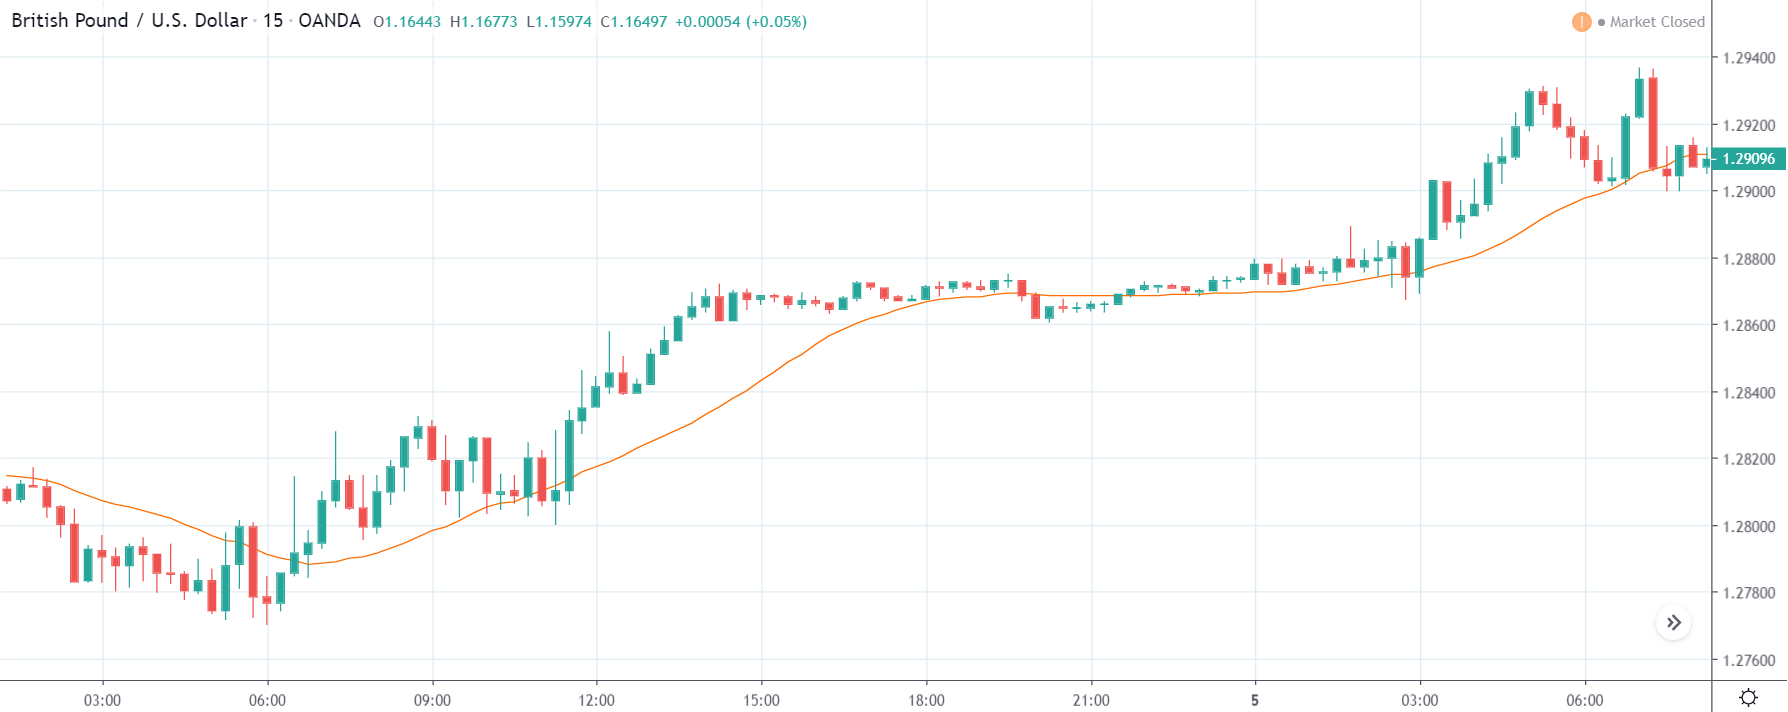
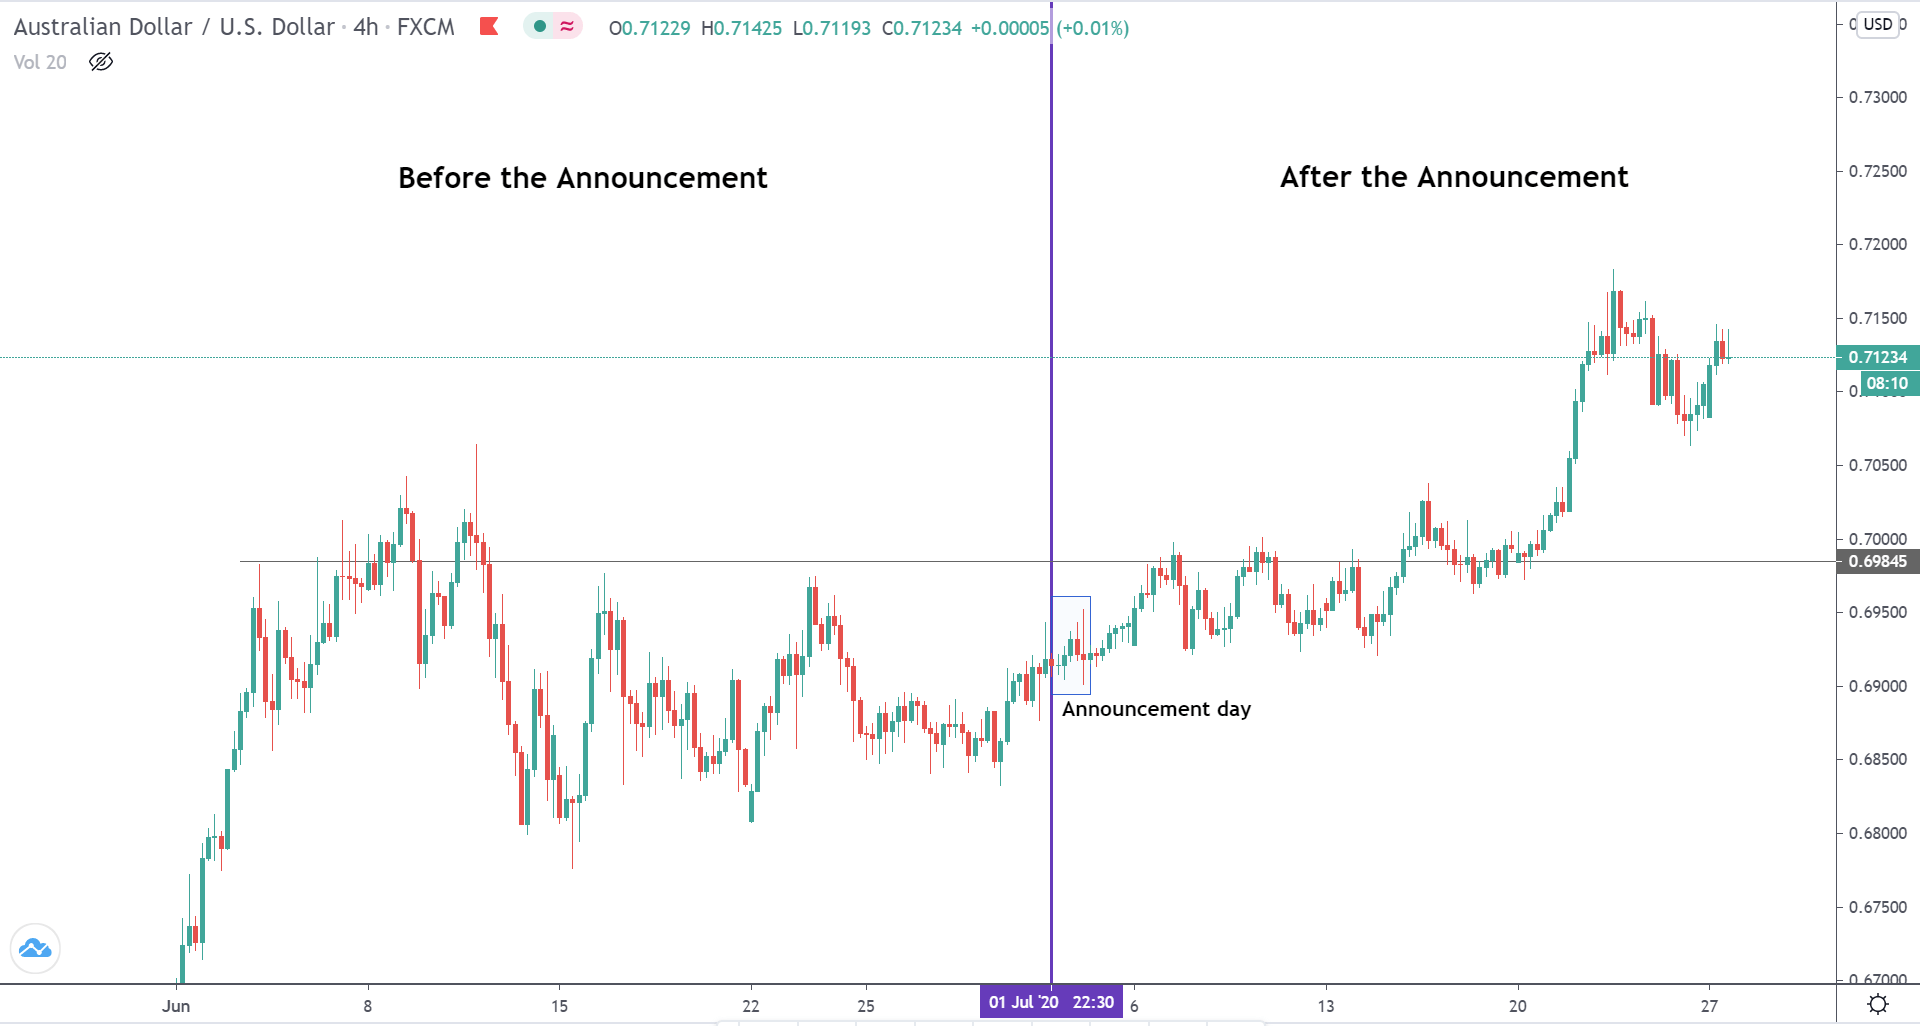
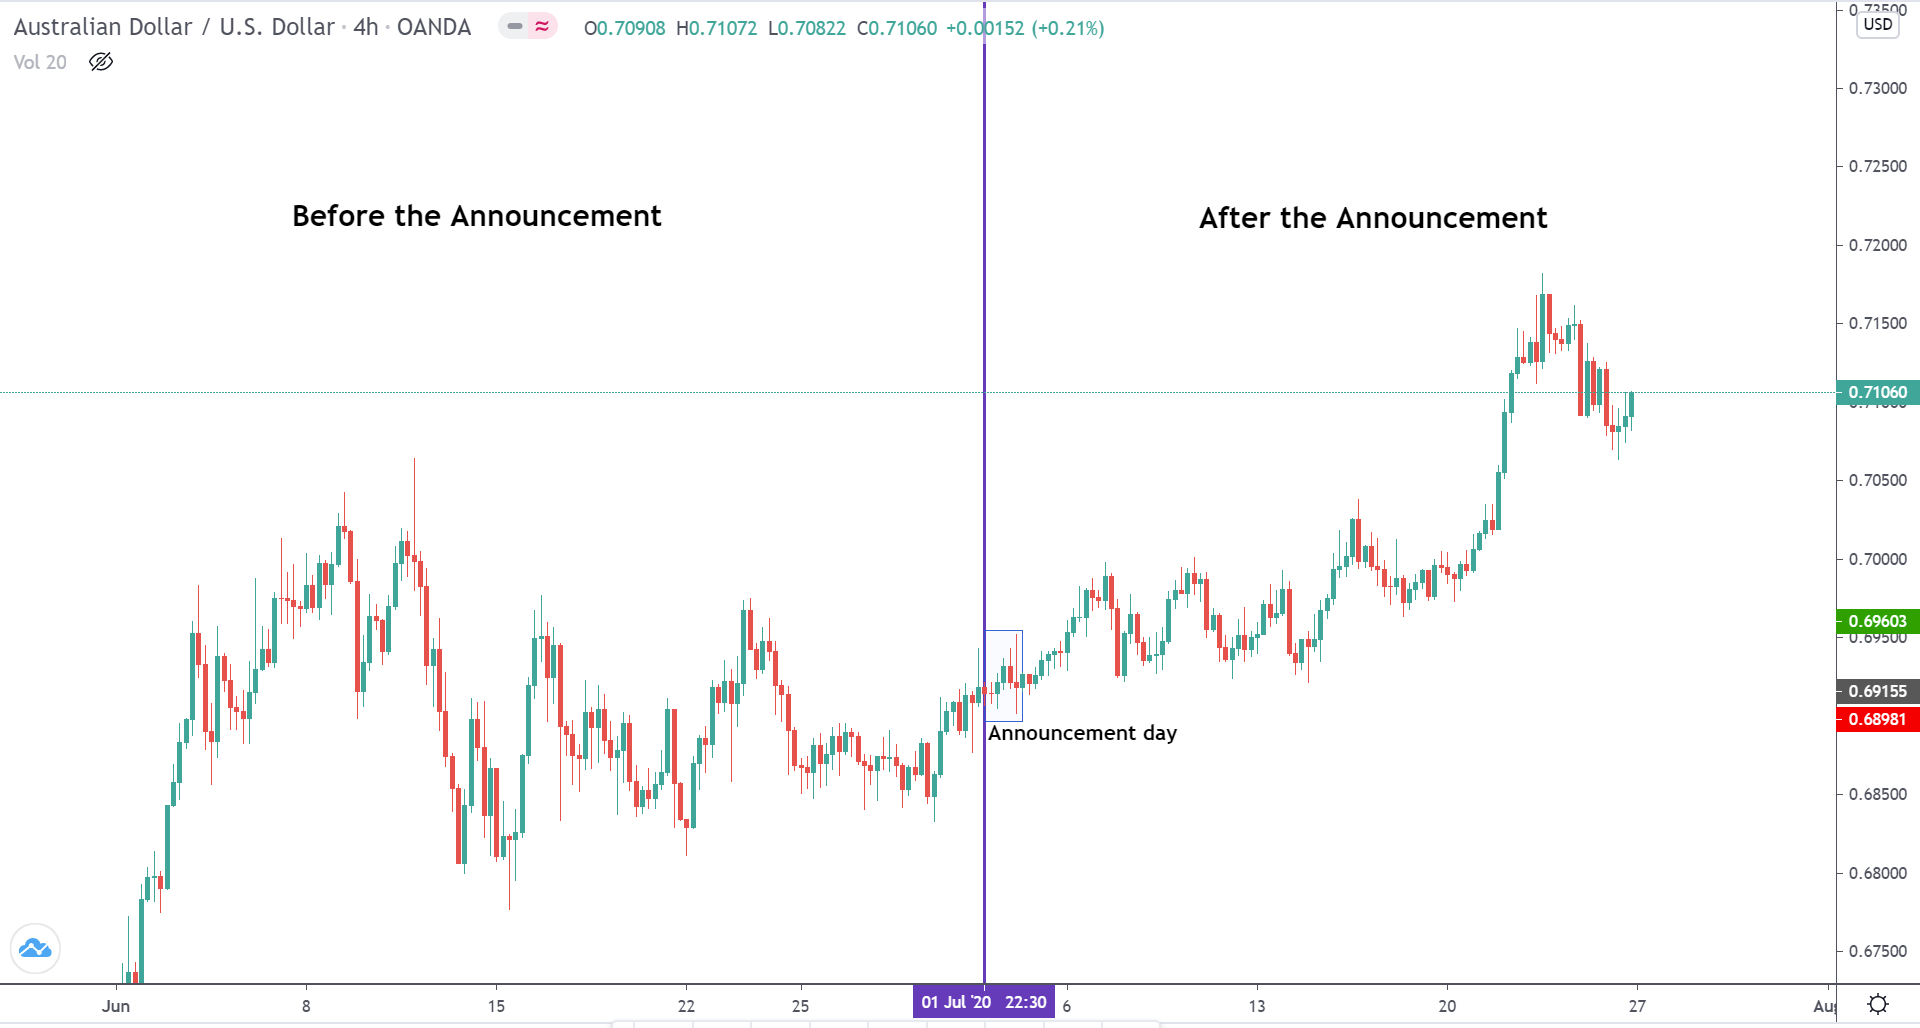
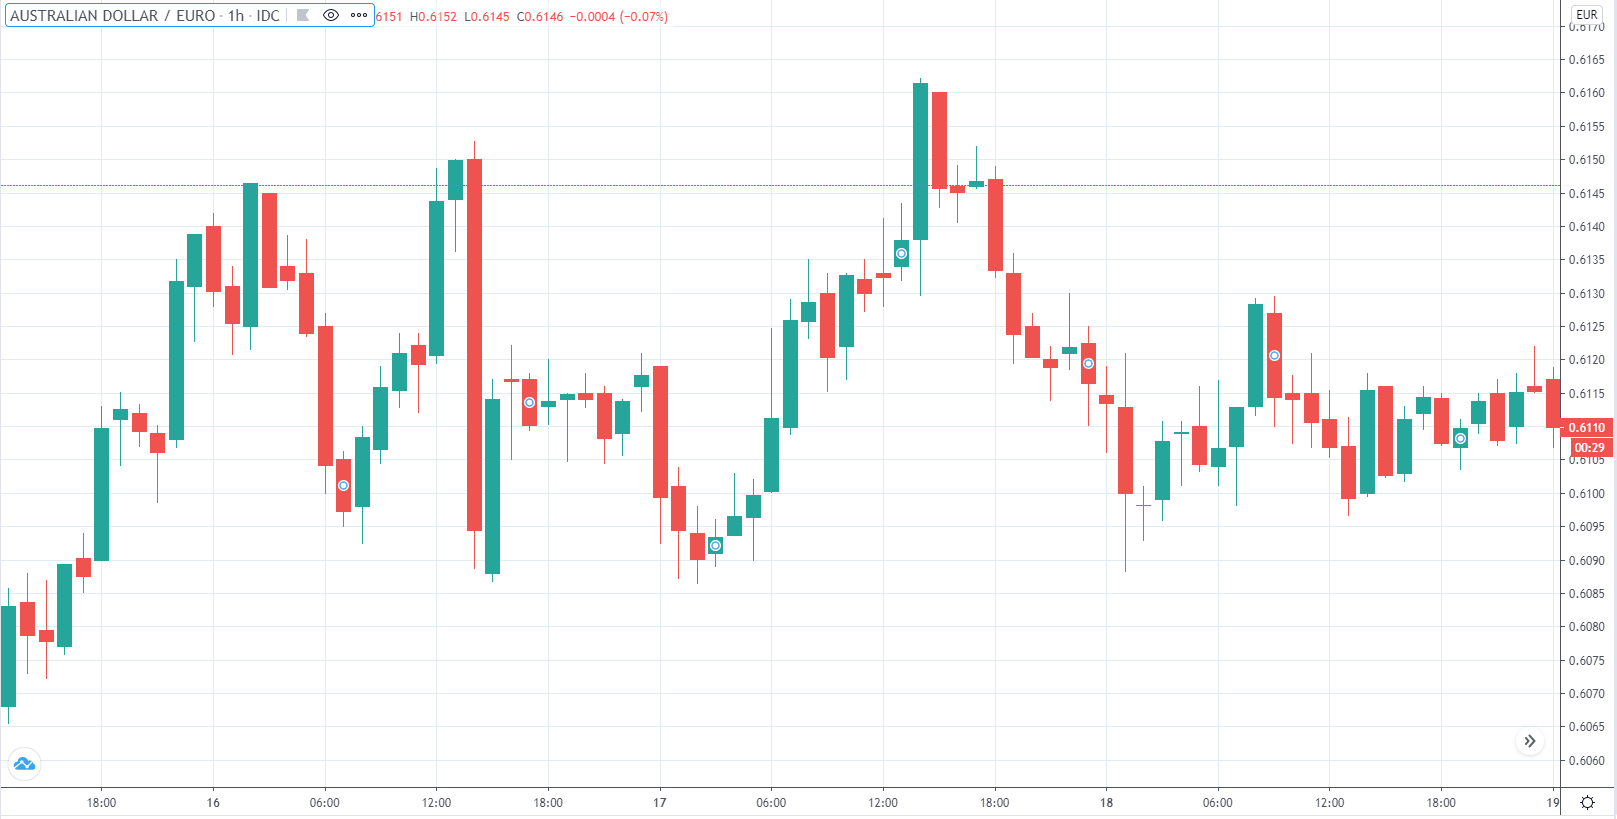
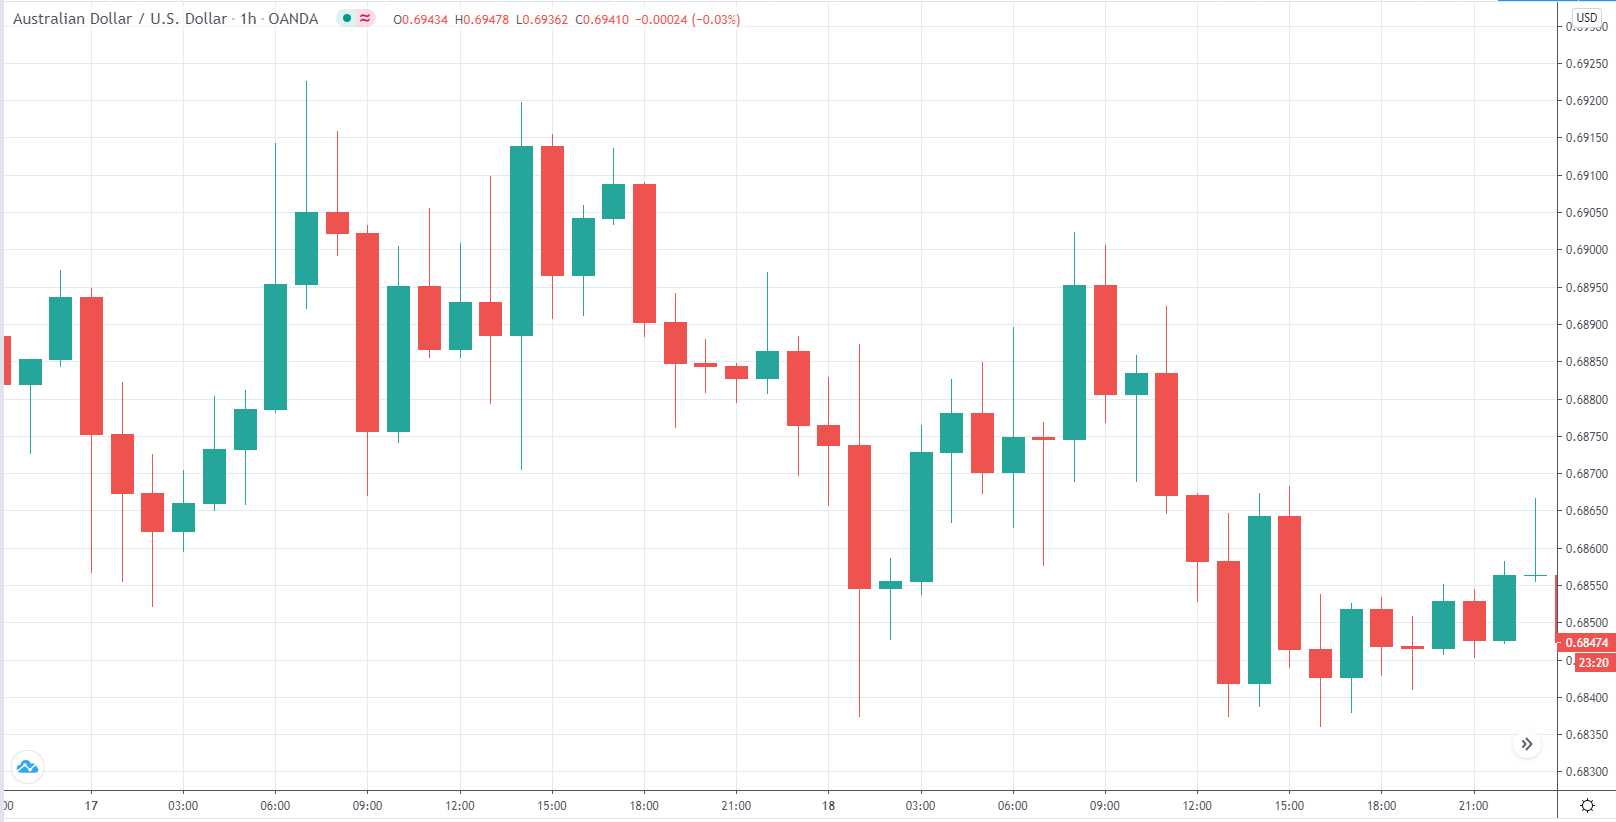
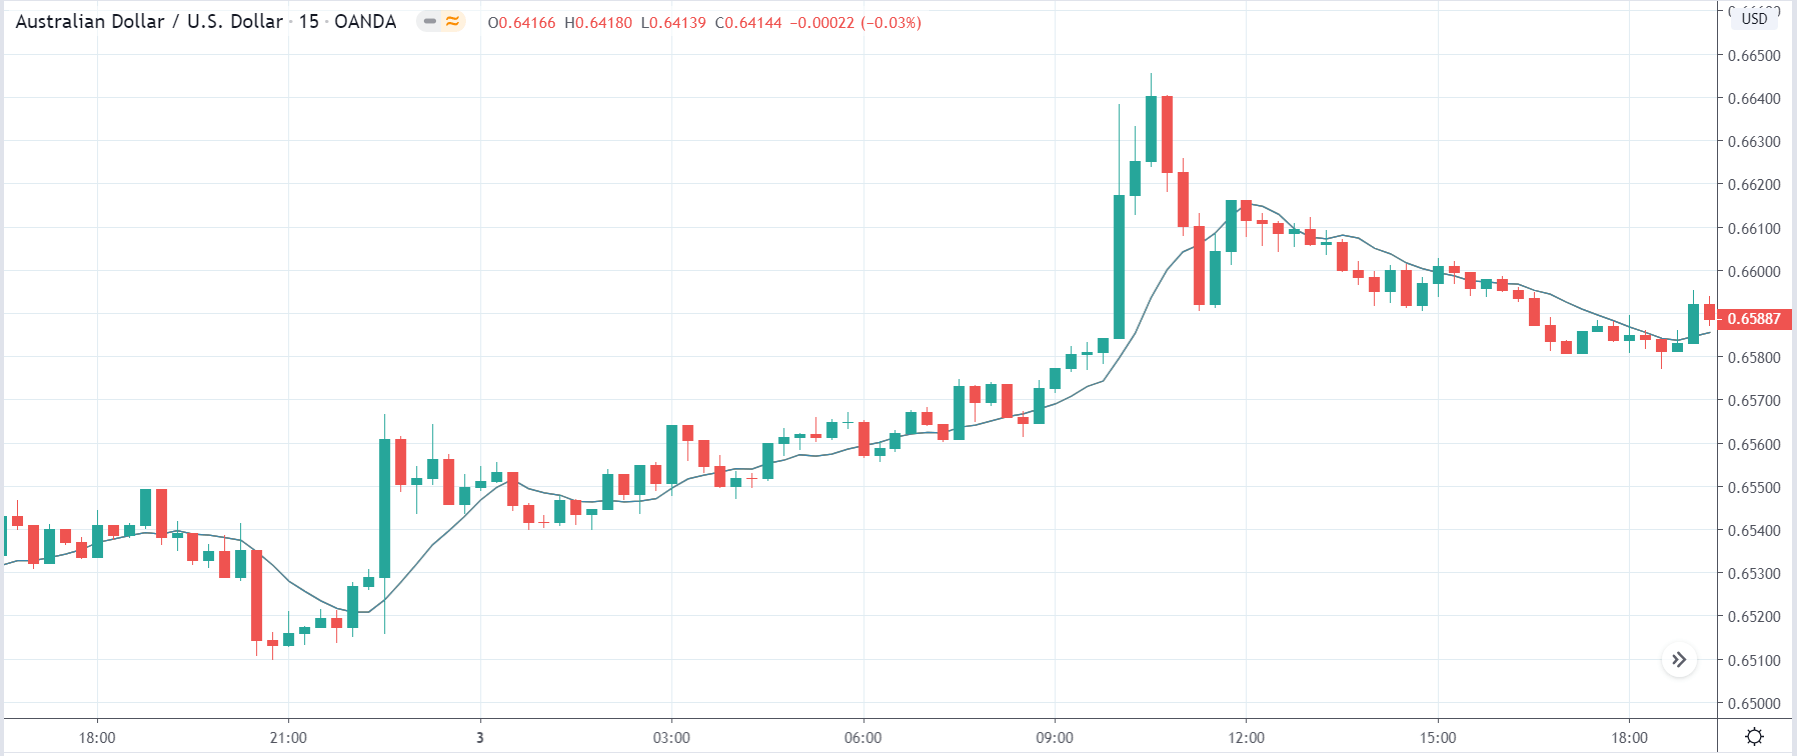
AUDUSD – Before the Announcement
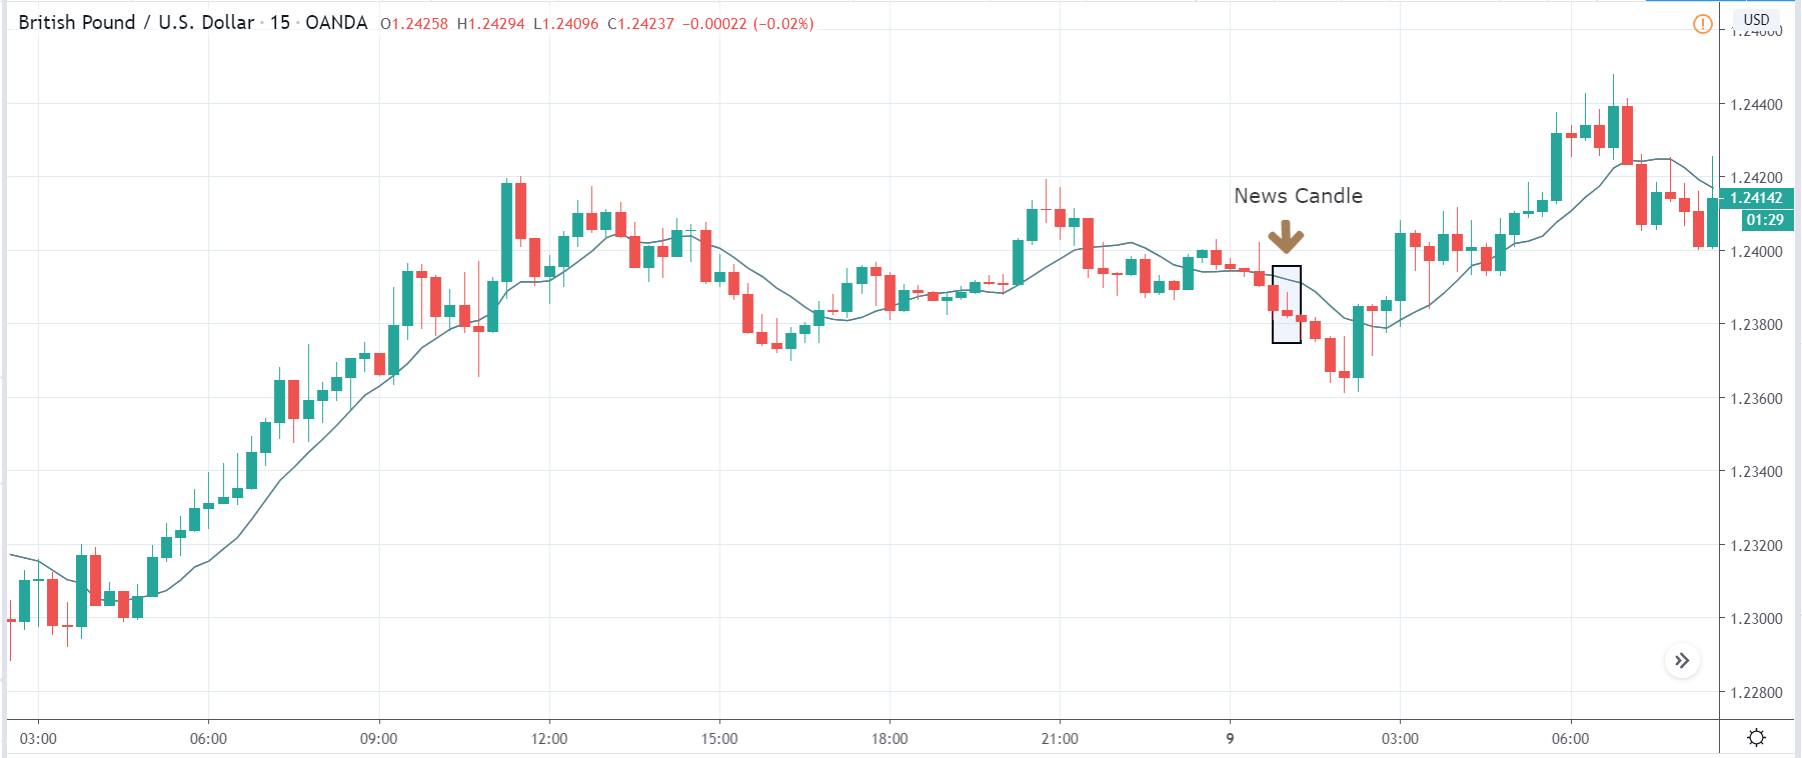
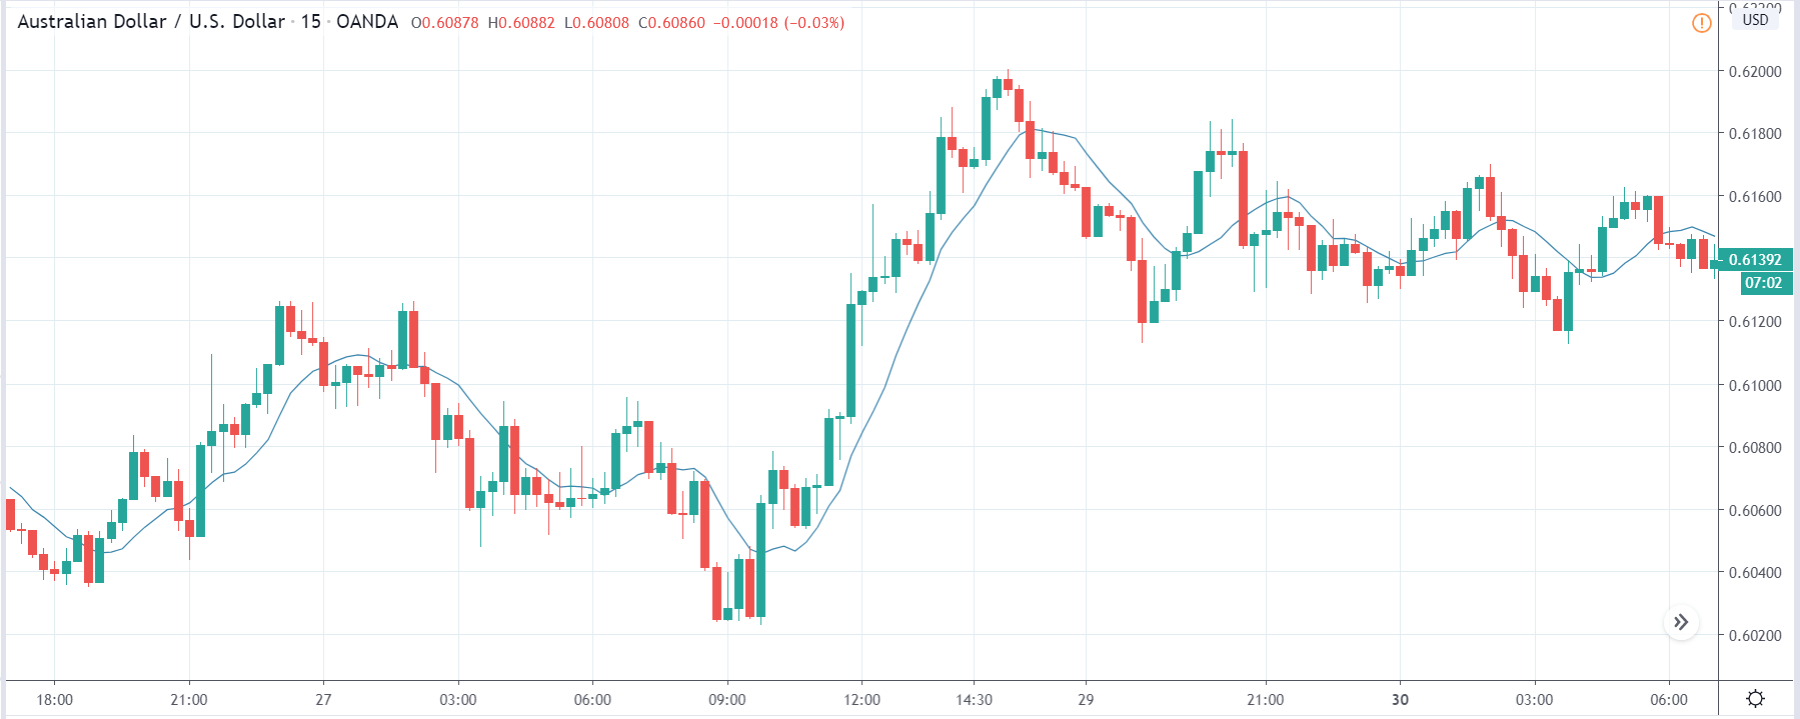
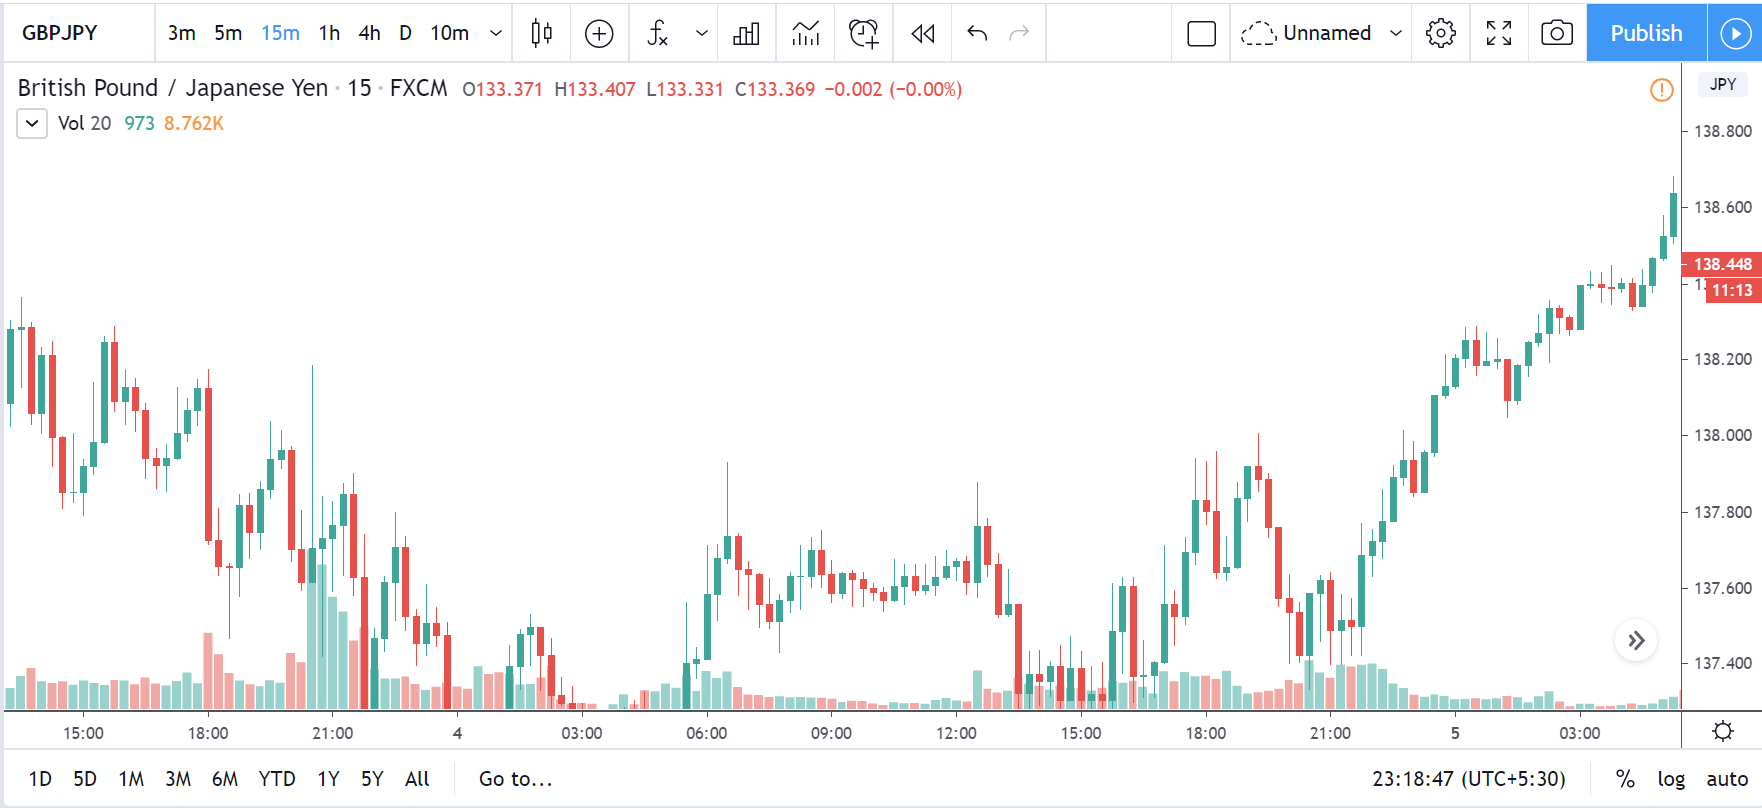
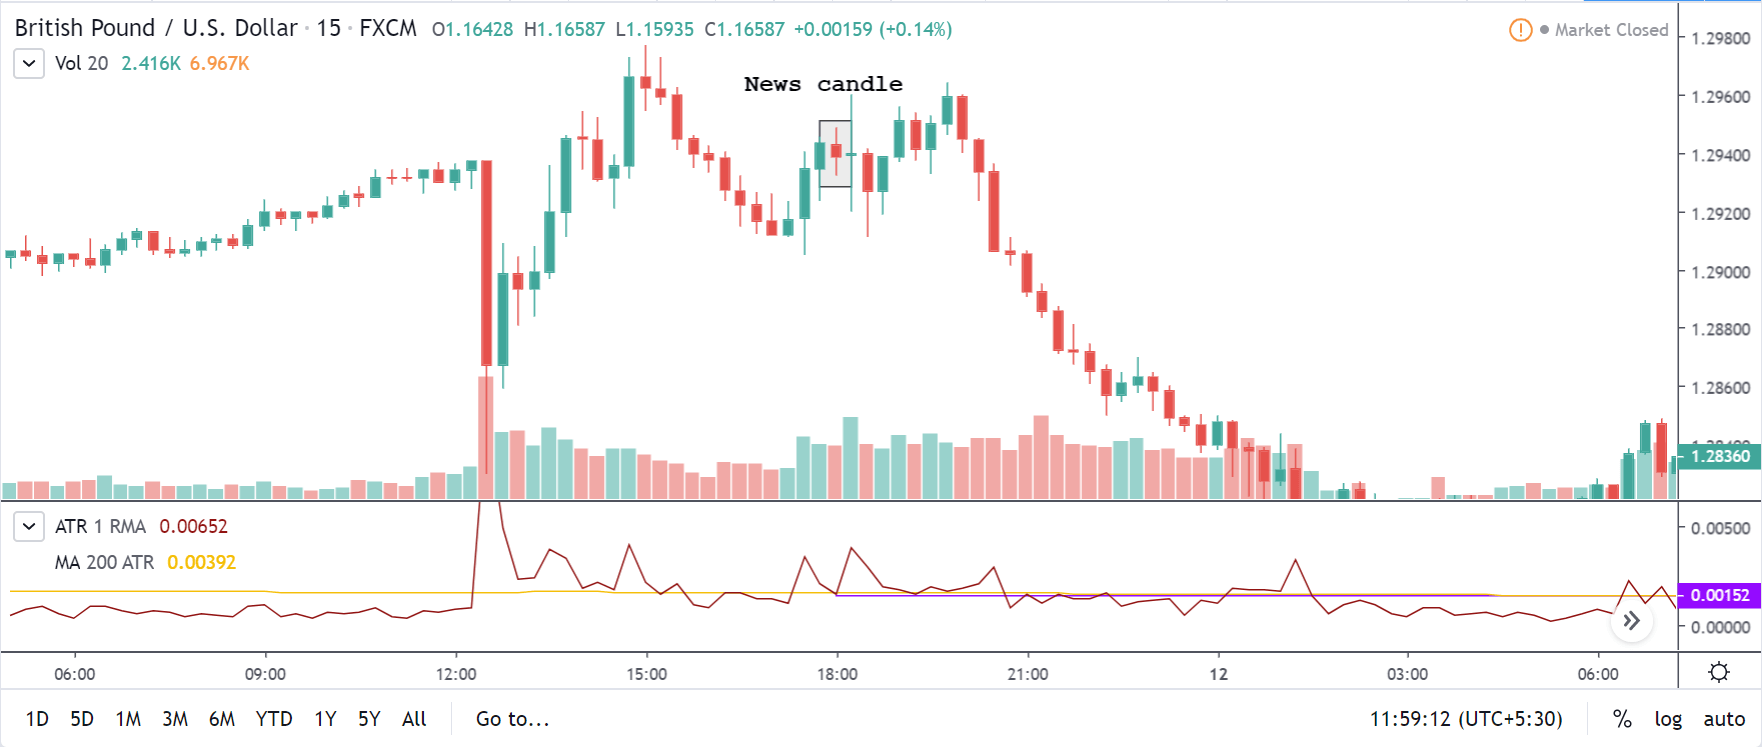
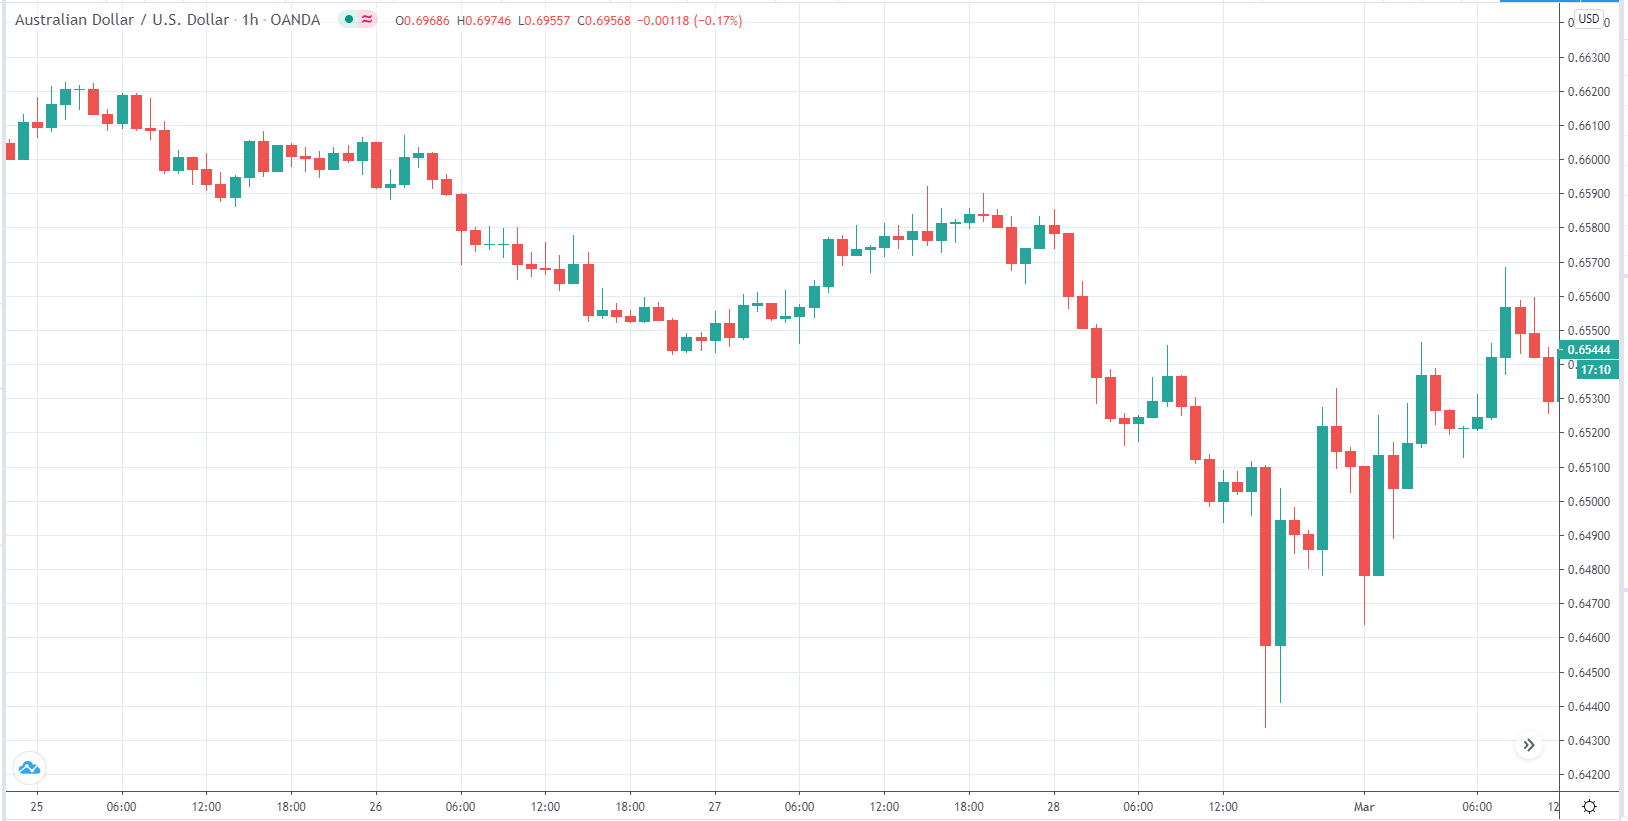
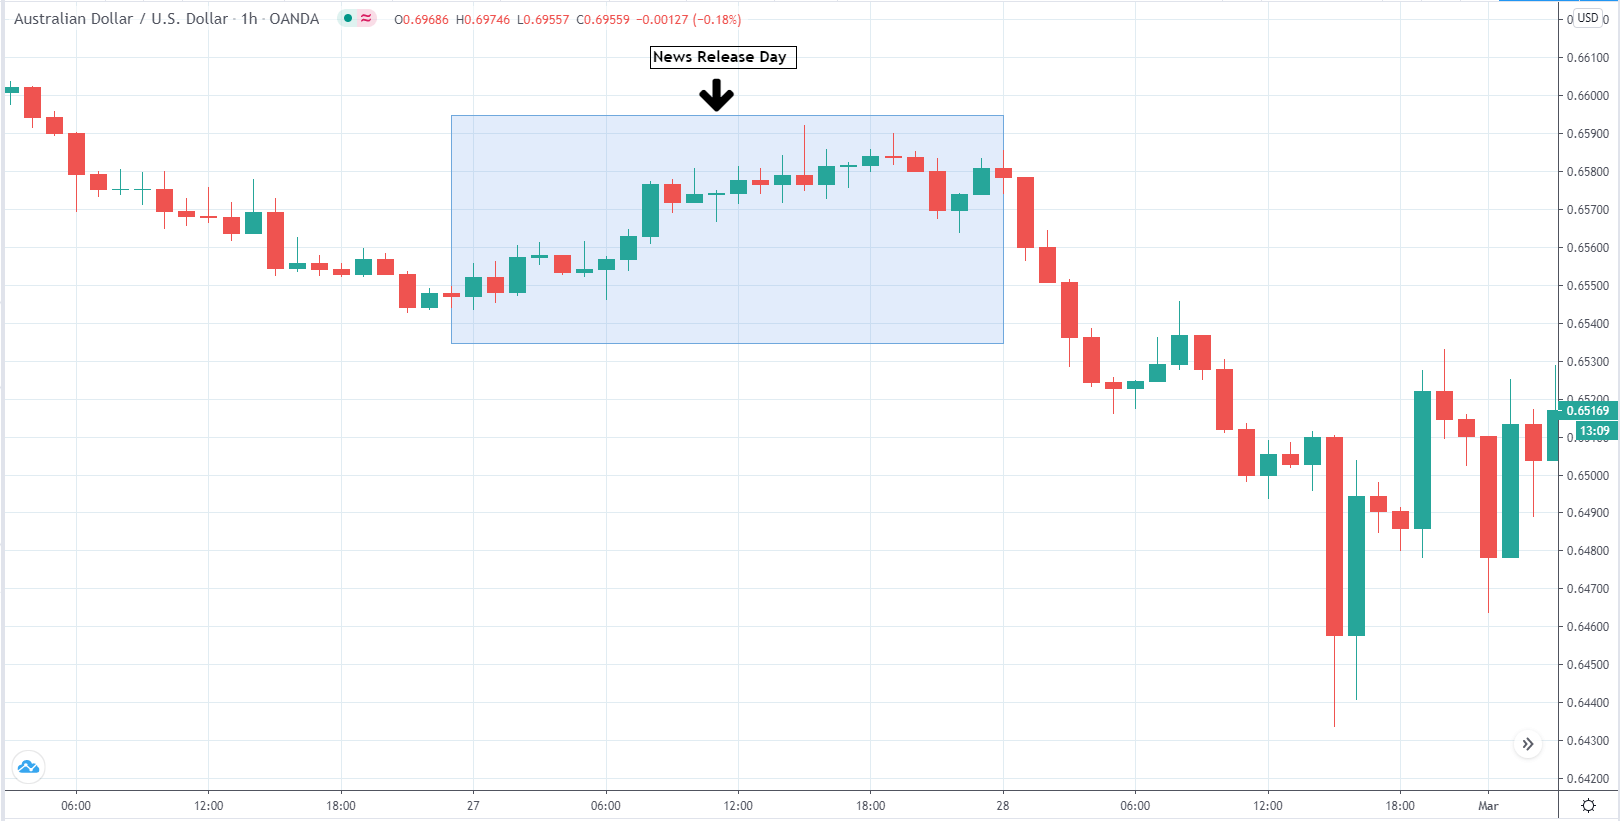
From the price chart of AUDUSD, we can see that the price action is similar to that of NZDUSD. Before the announcement of the news, the market was in a strong uptrend. After making a high to 0.69845, the prices have been pulling back down.
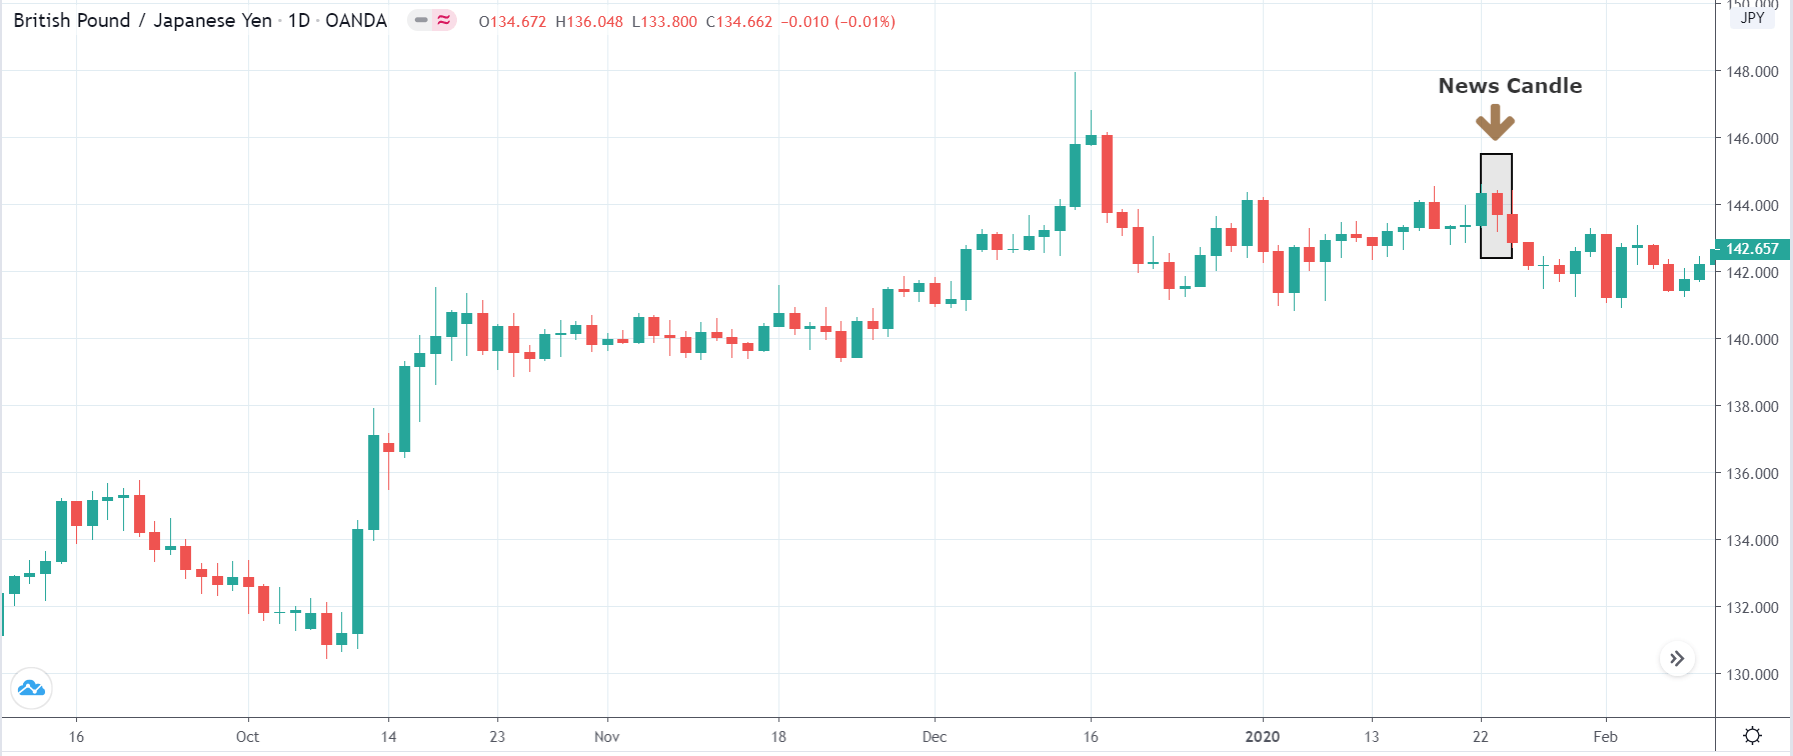
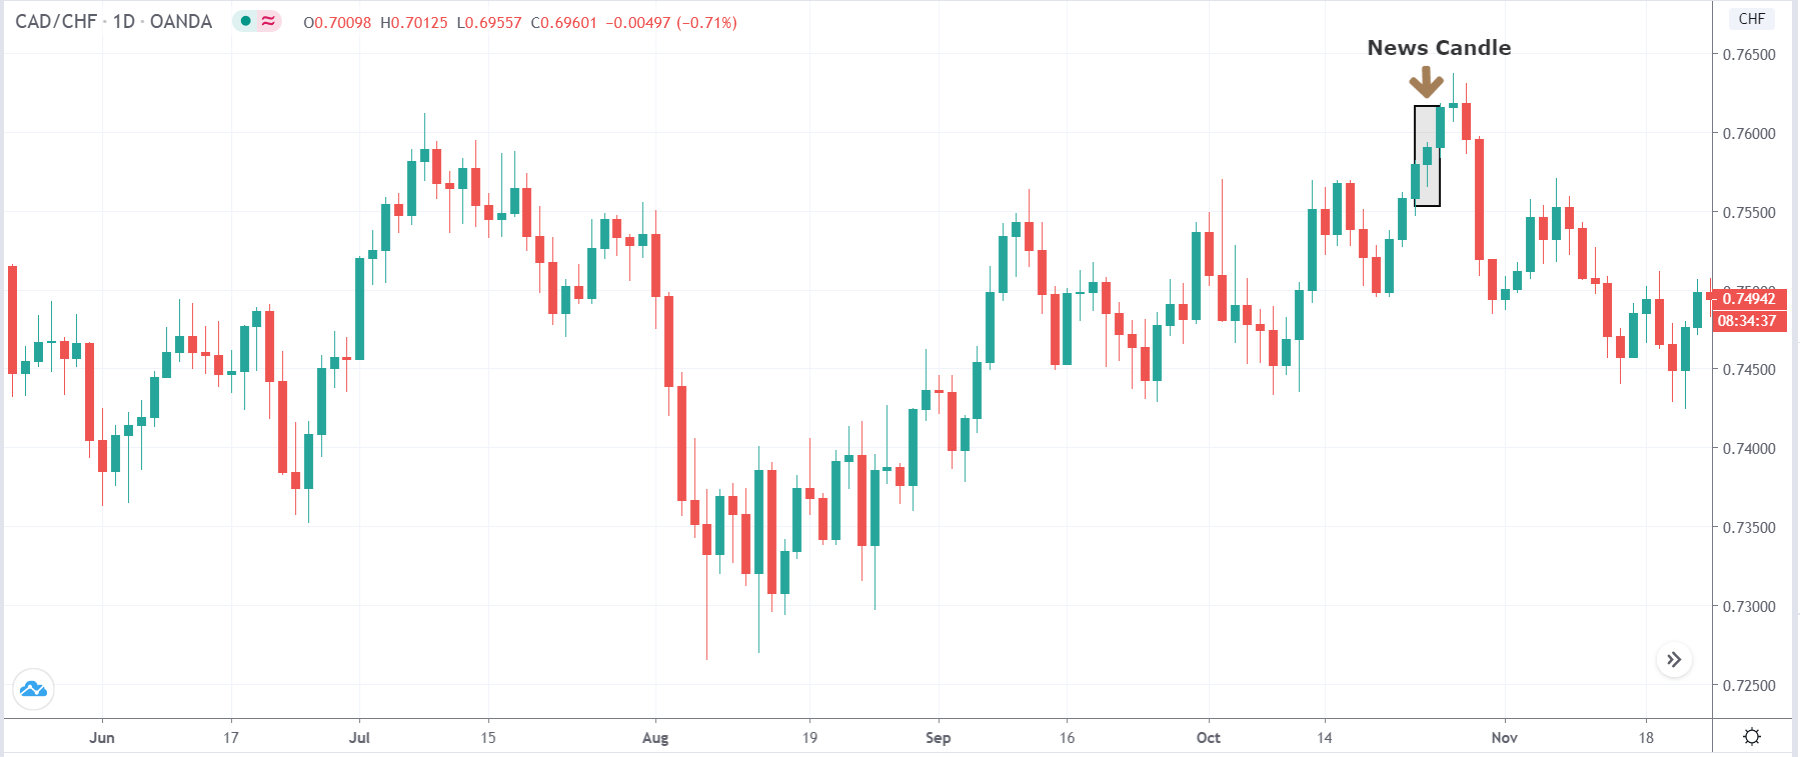
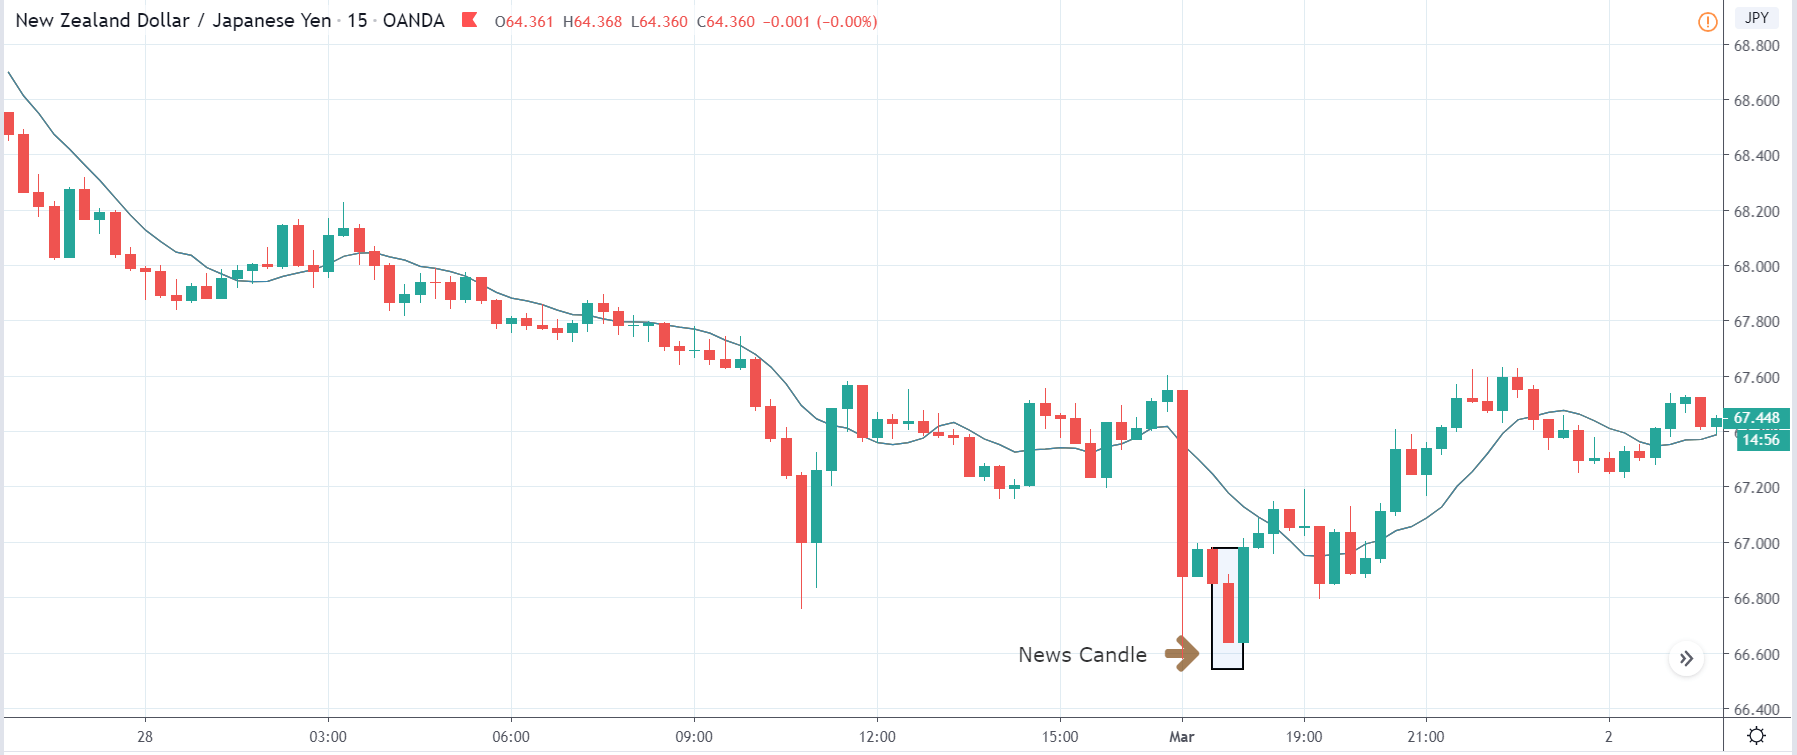
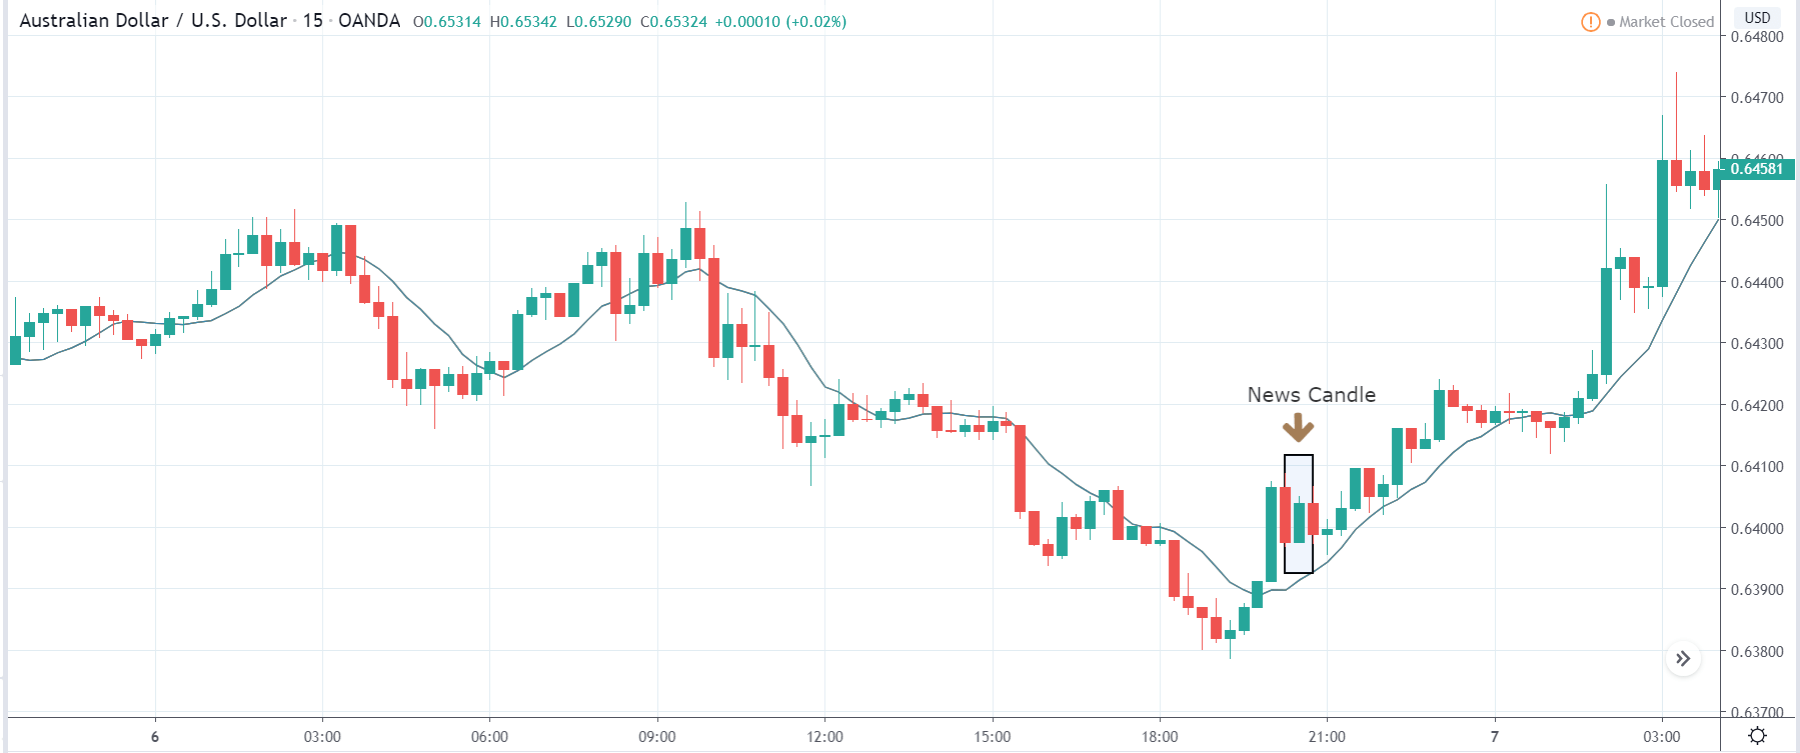
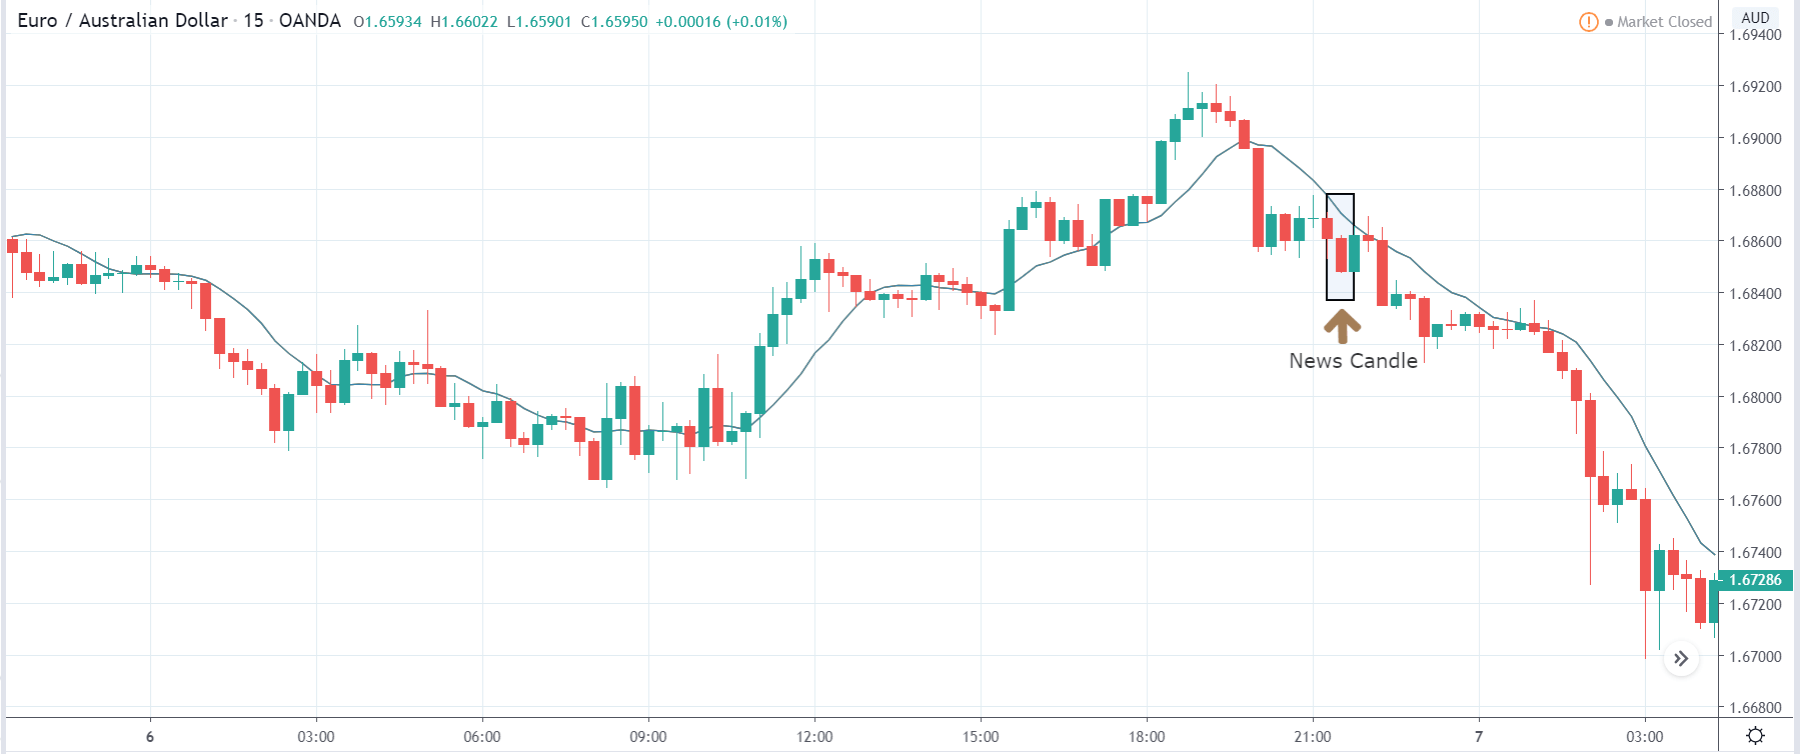
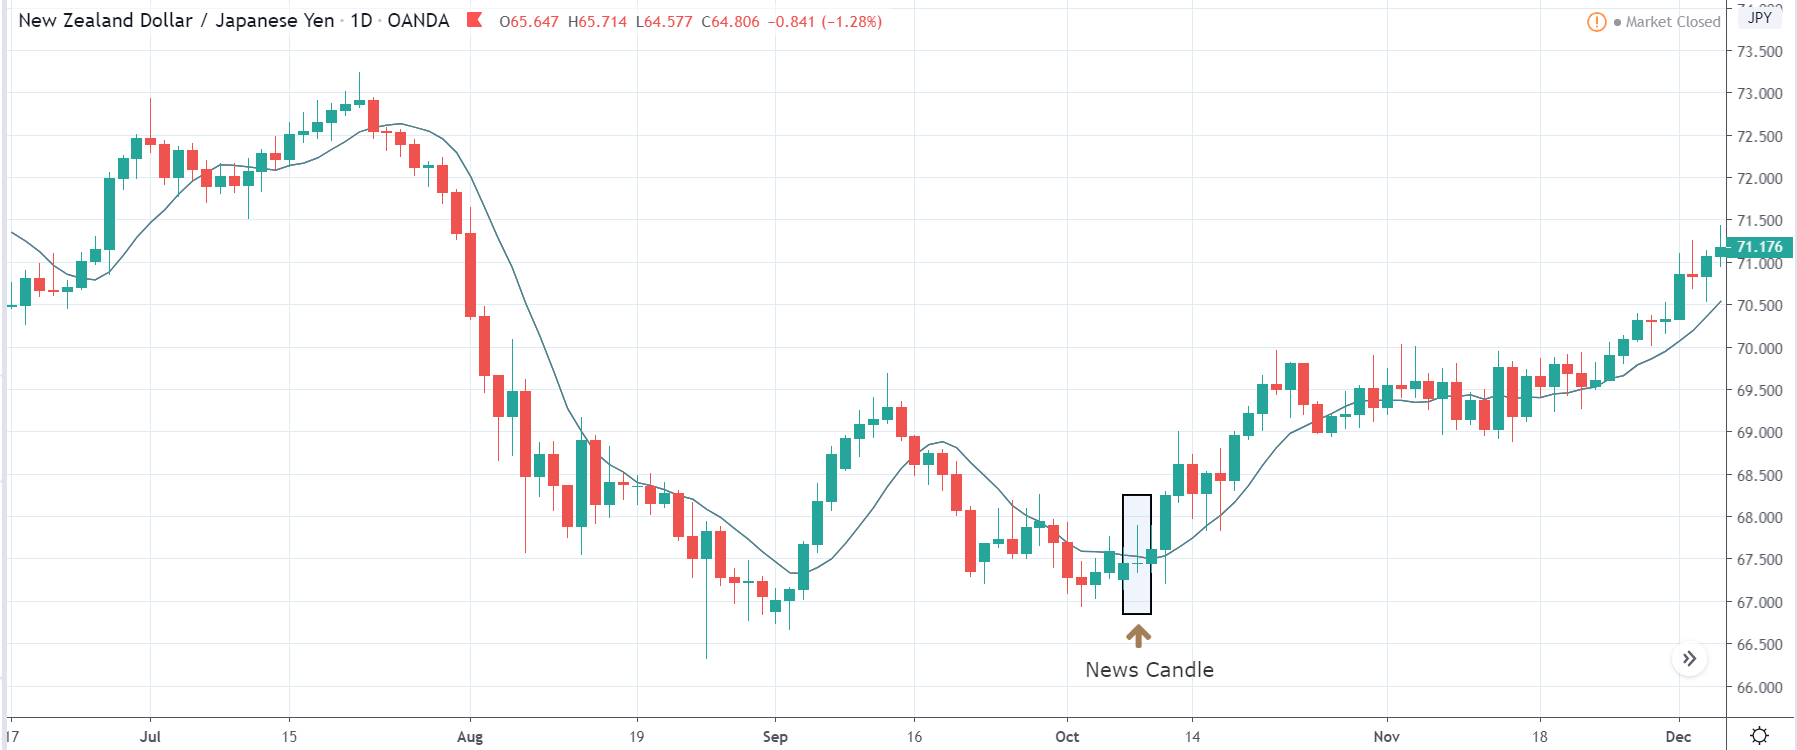
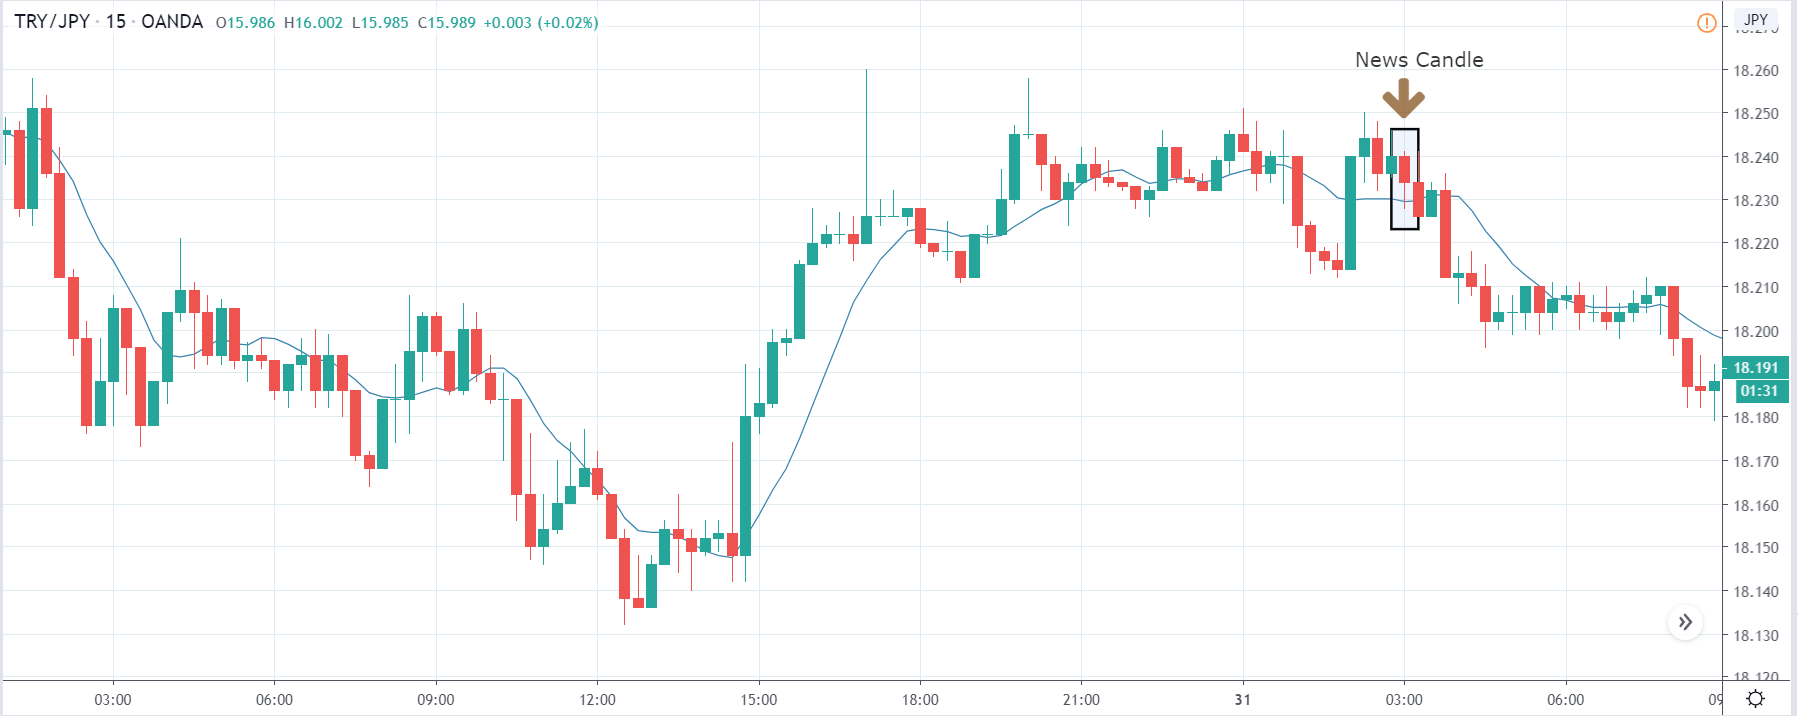
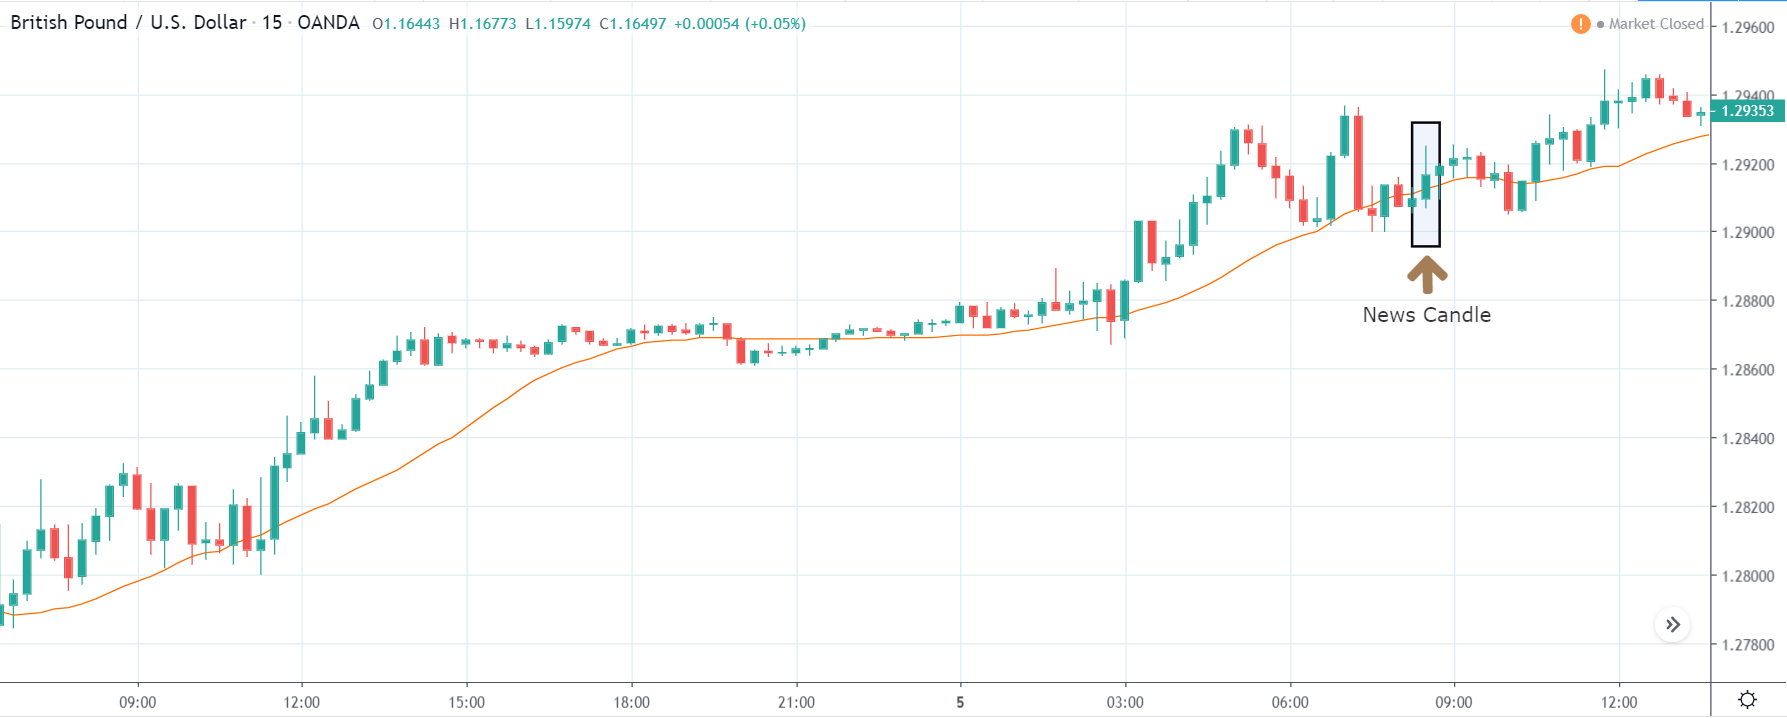
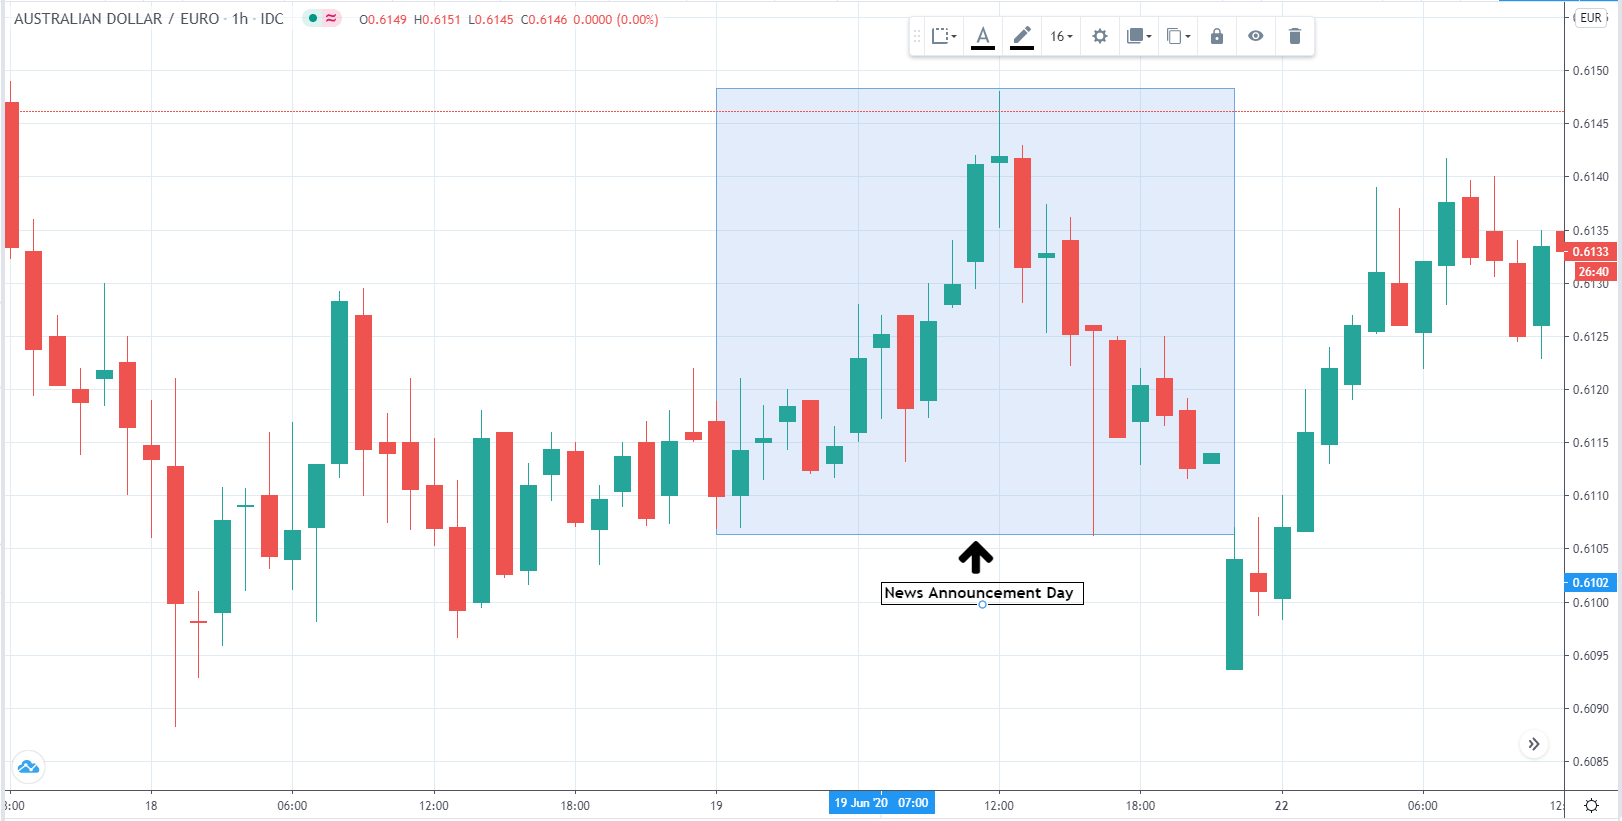
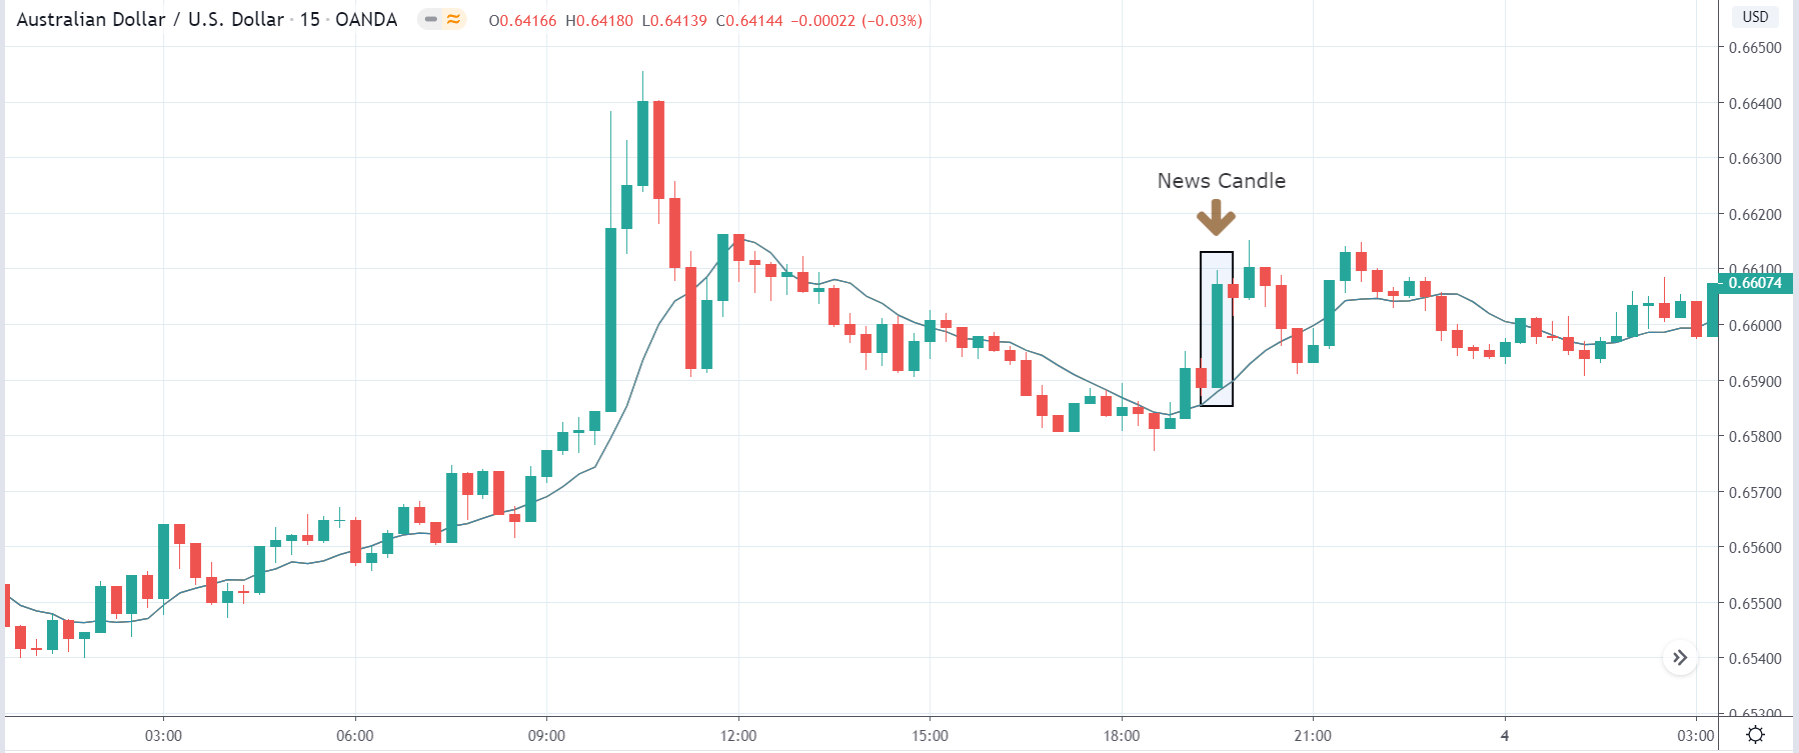
AUDUSD – After the Announcement
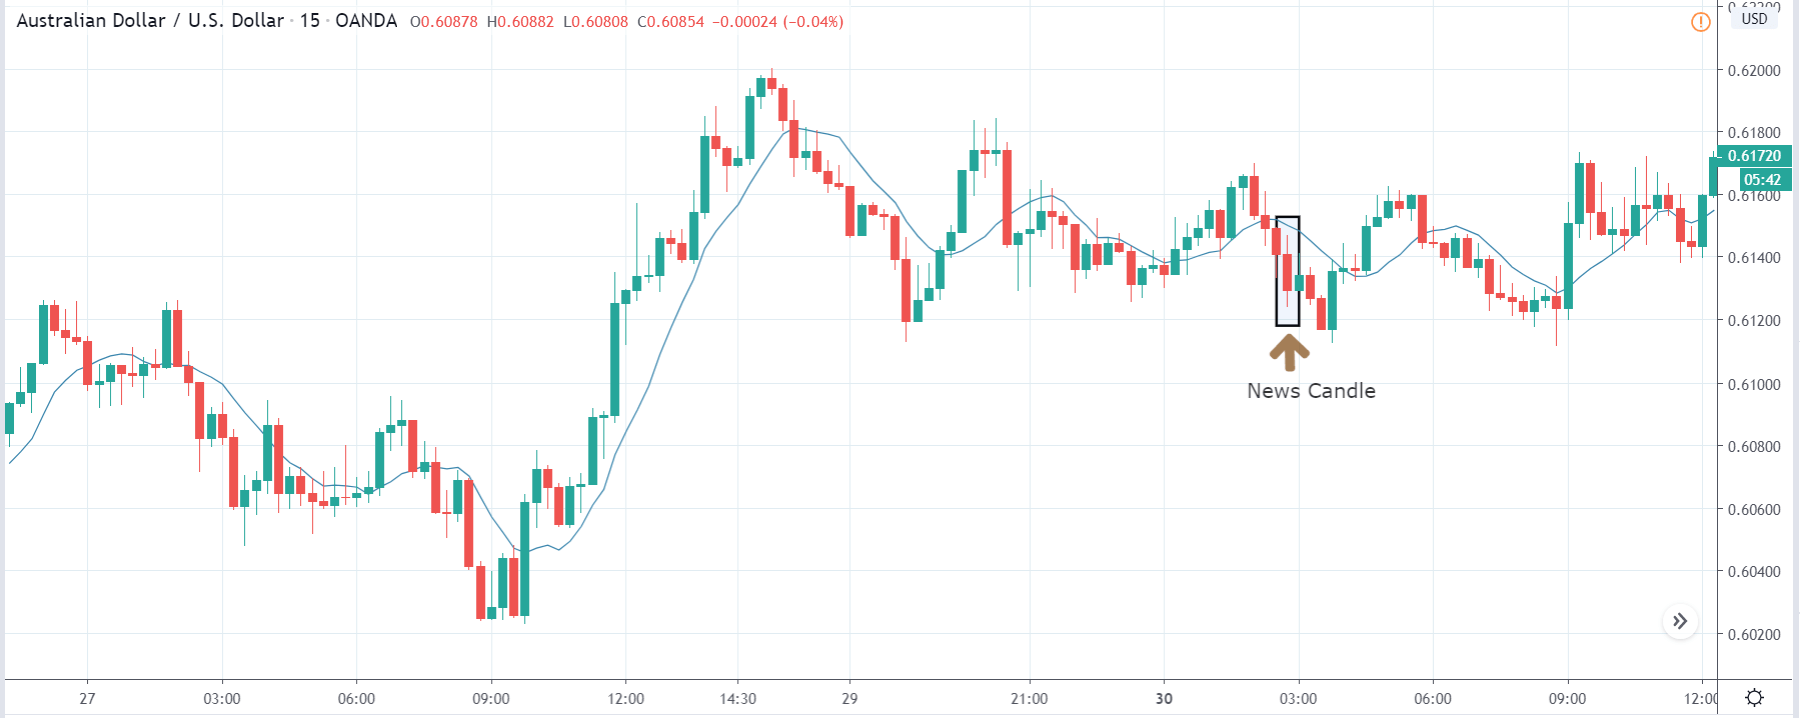
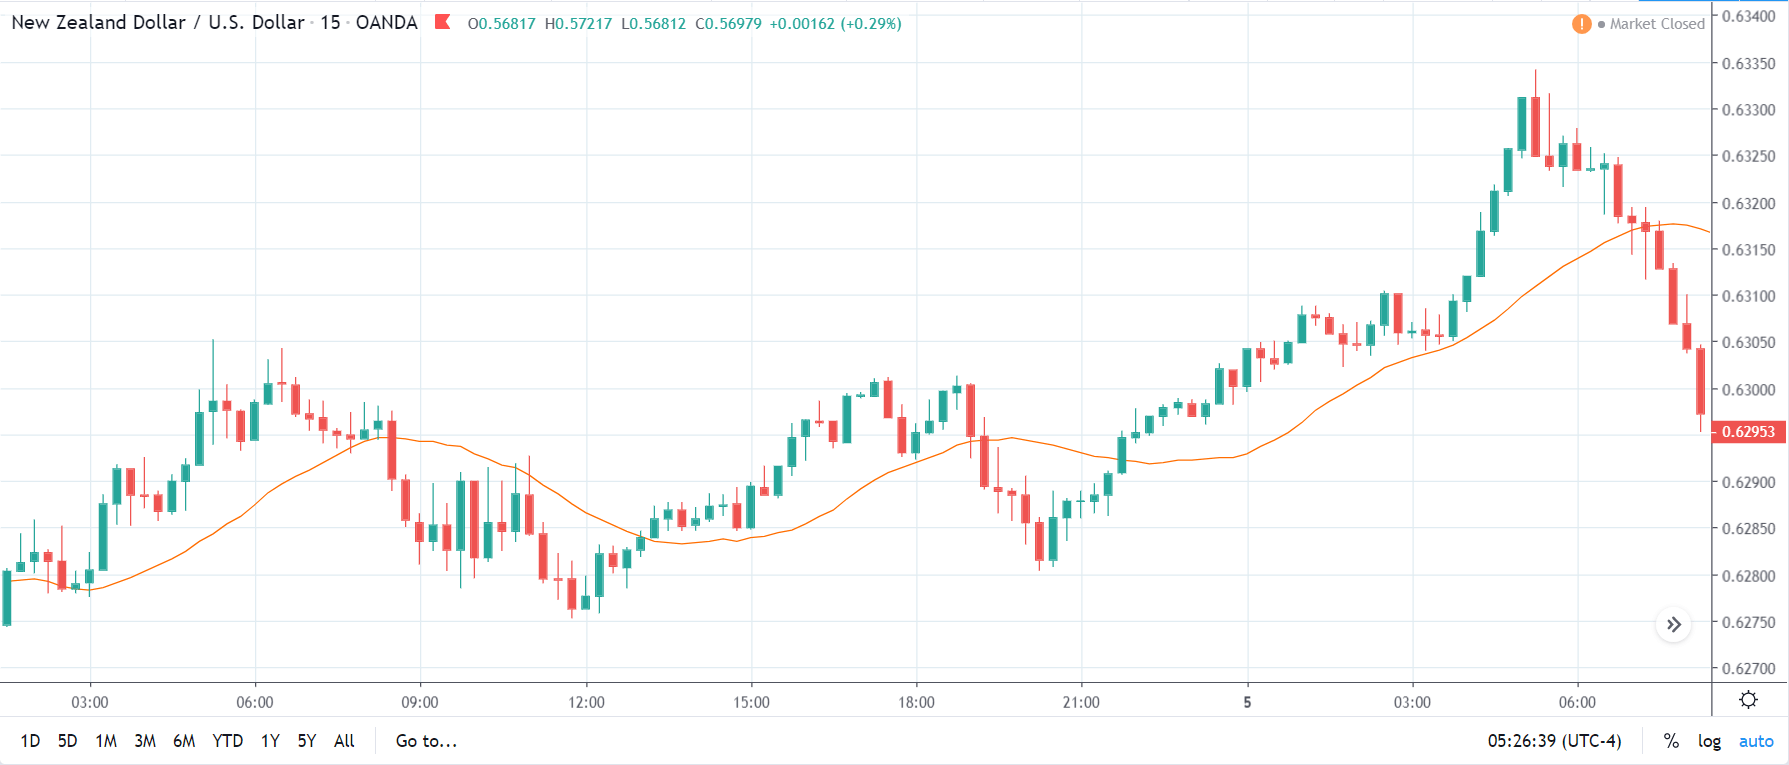
During the announcement of the news, the market volatility was unchanged. However, in the subsequent sessions, the market reacted negatively on USD, and the price touched the recent high and even made a higher high. The market perhaps did react as expected to the new, but in the later weeks.
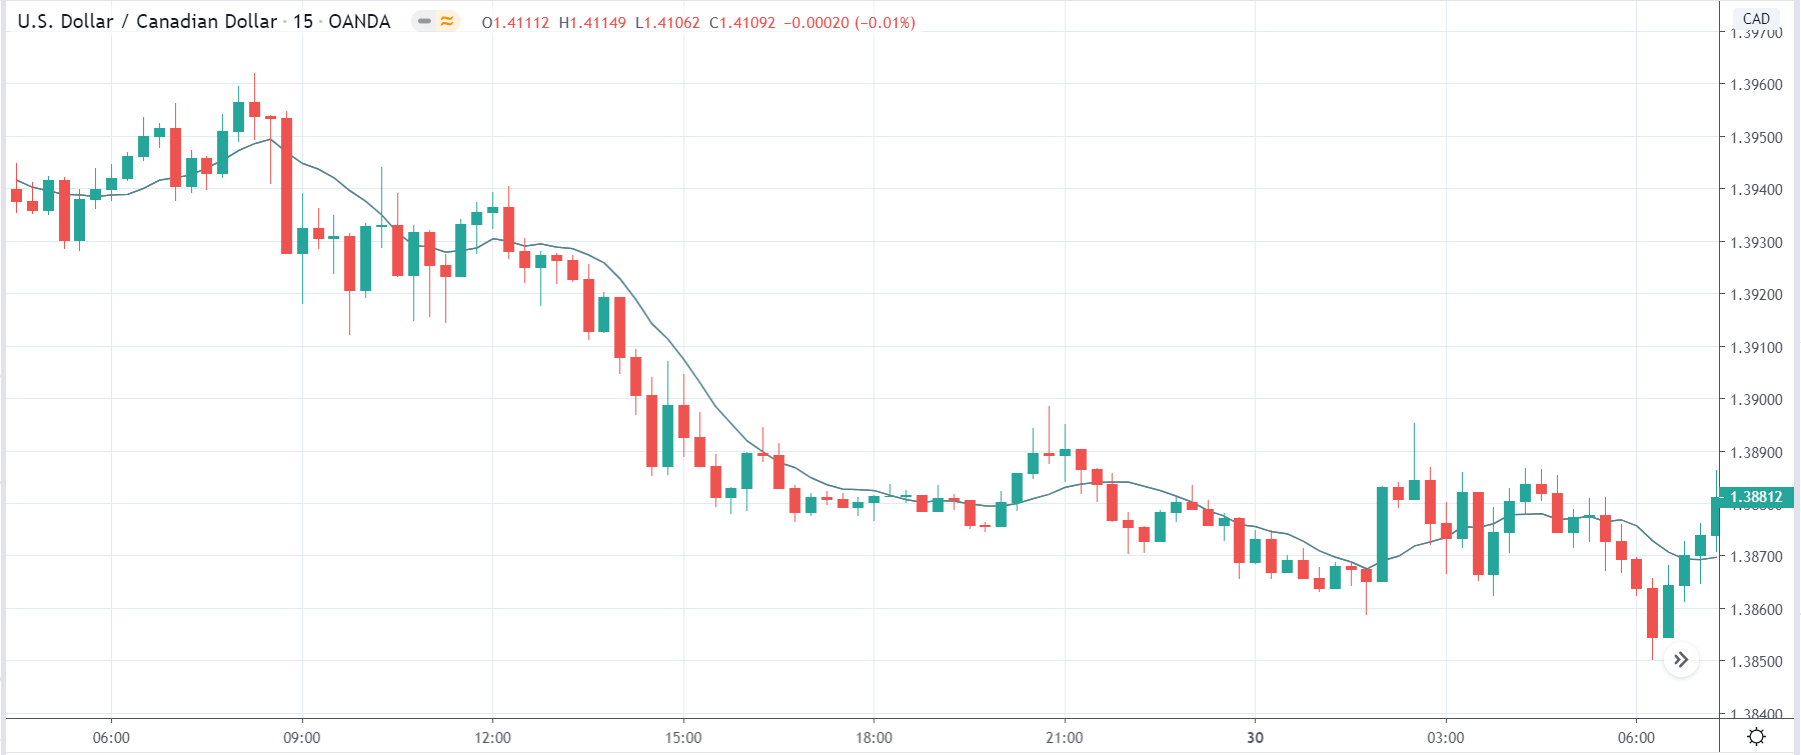
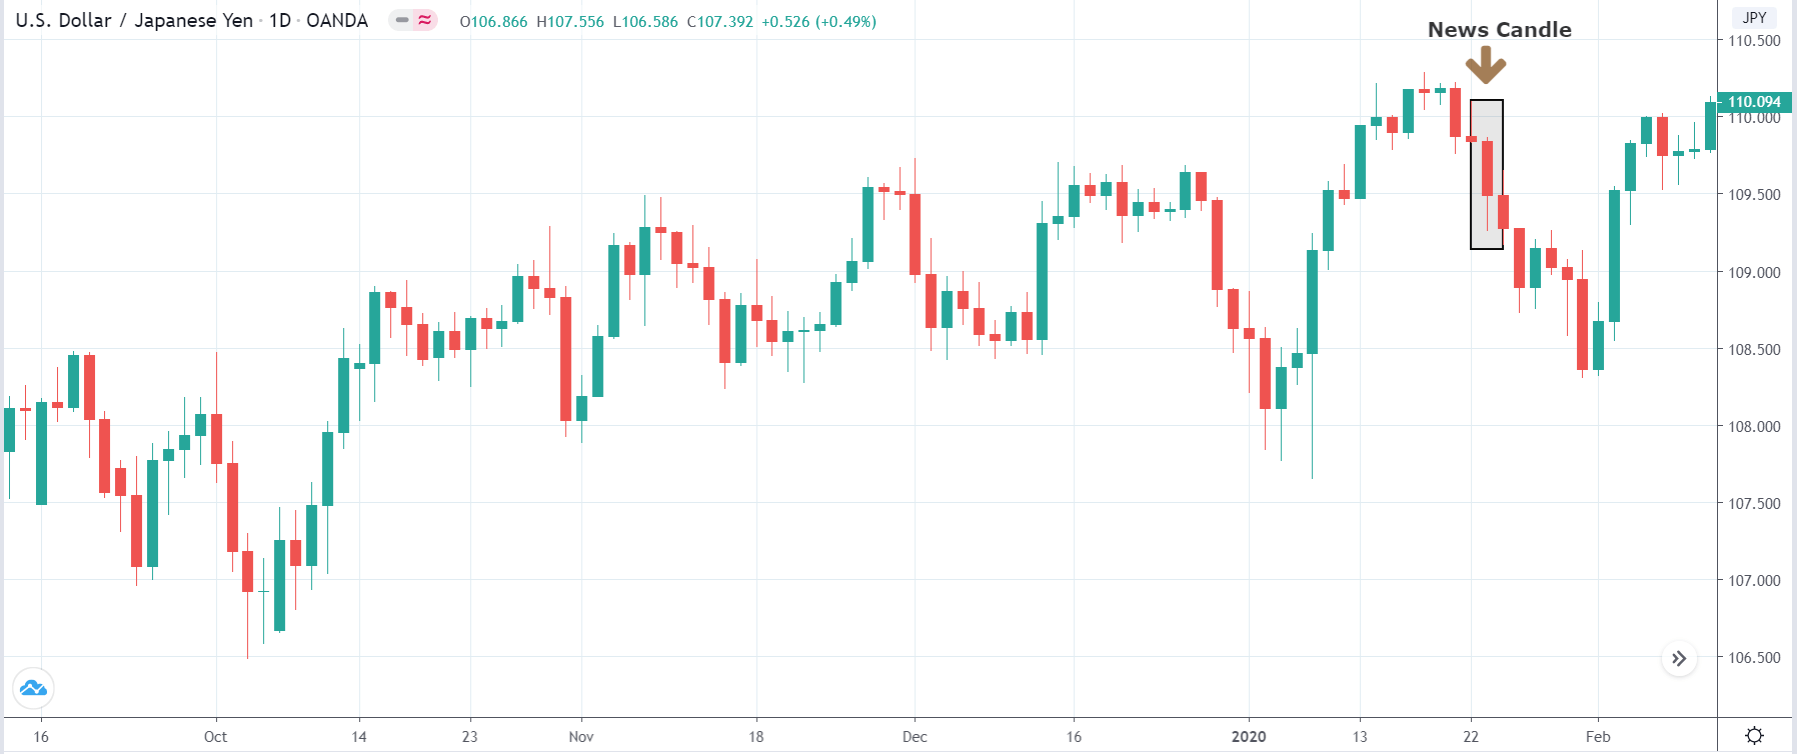
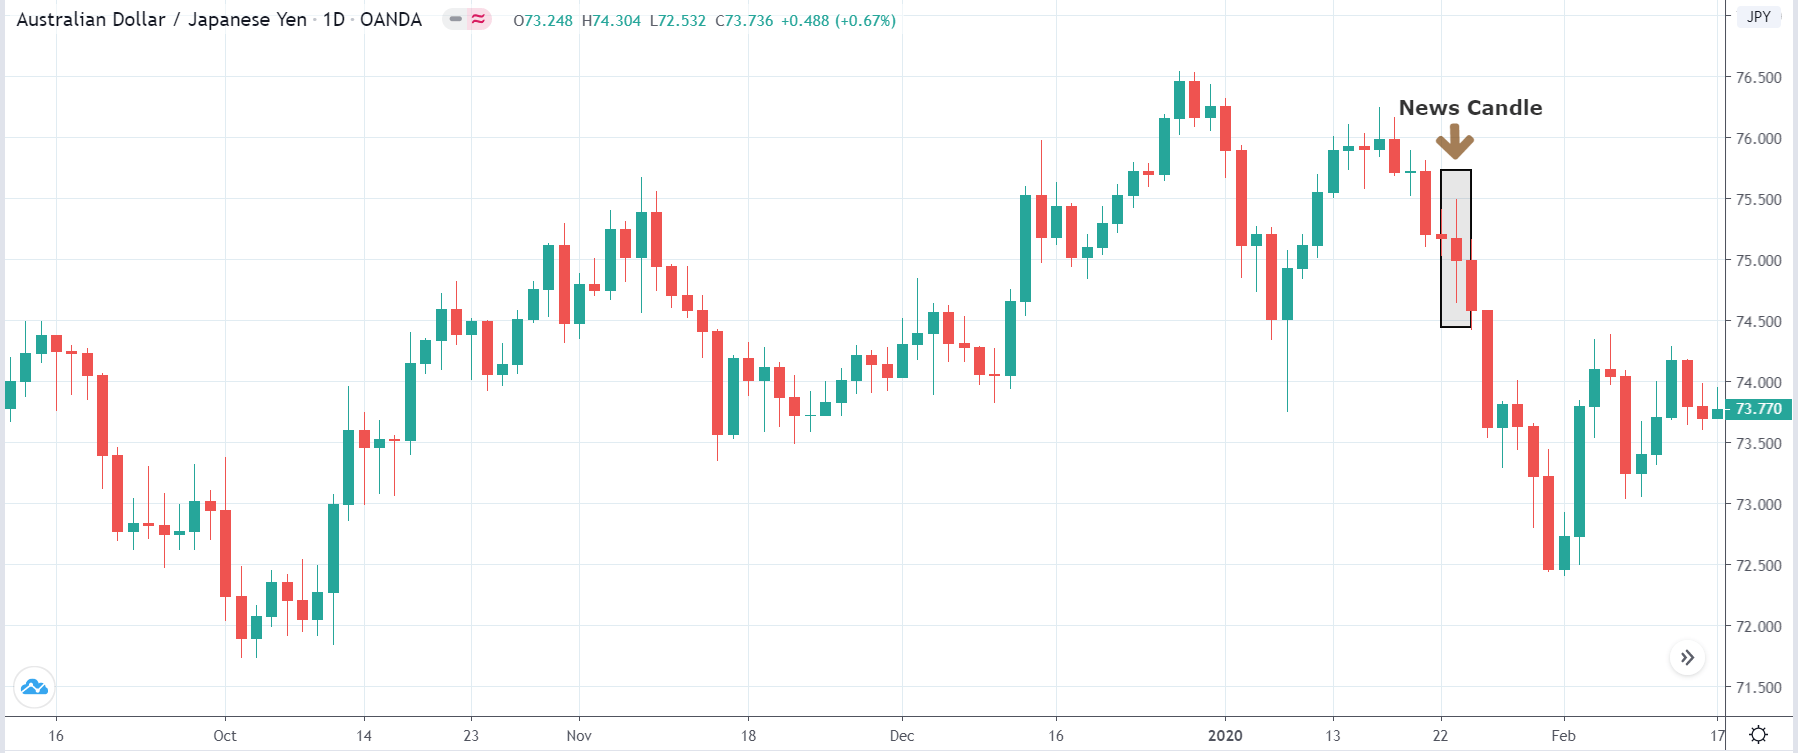
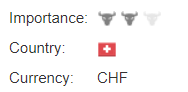
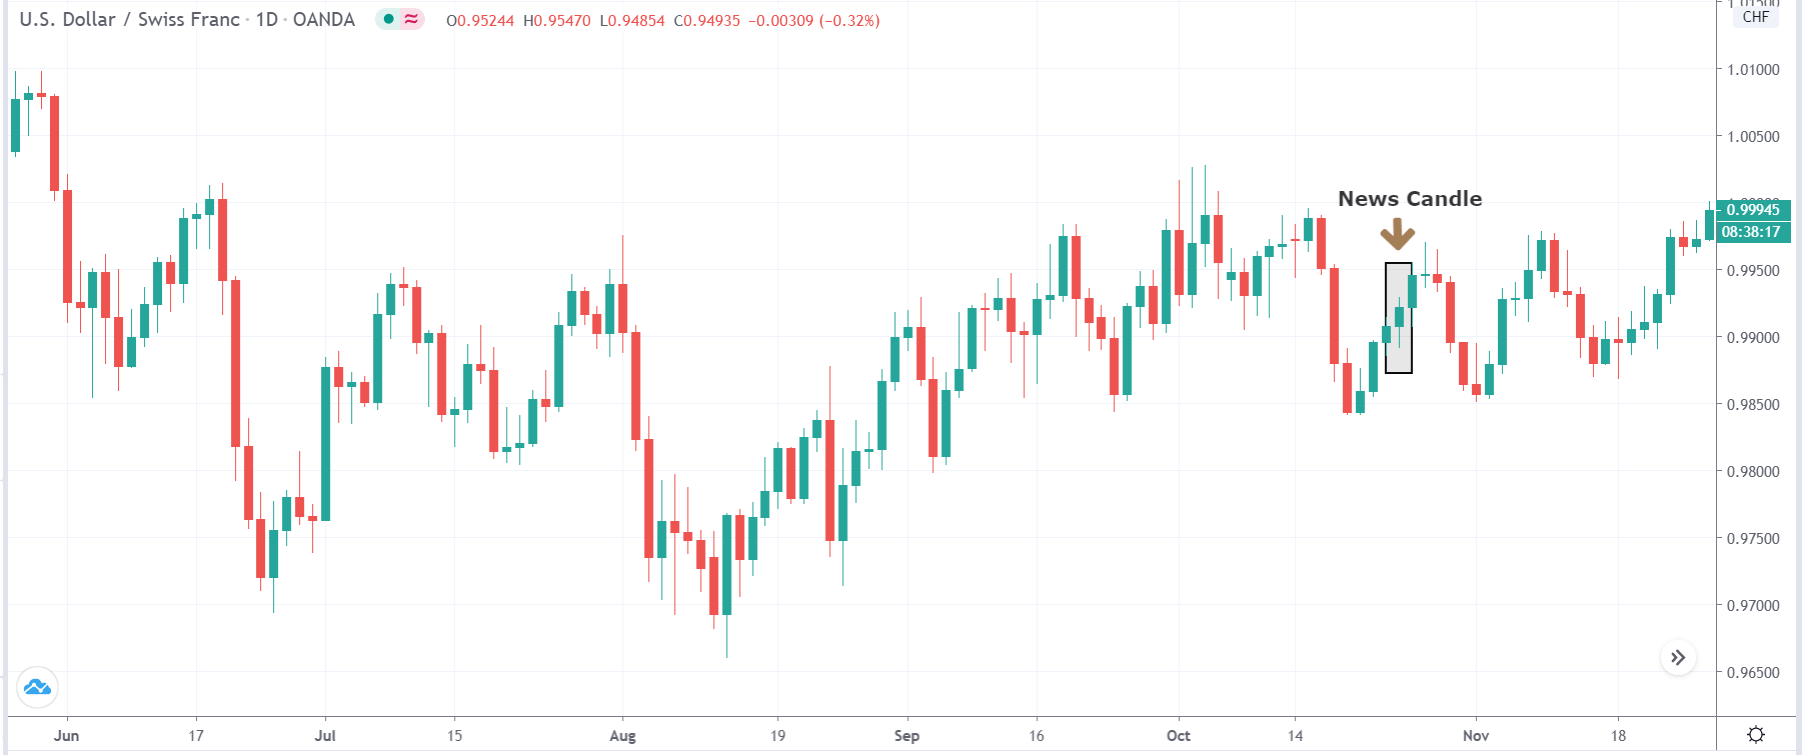
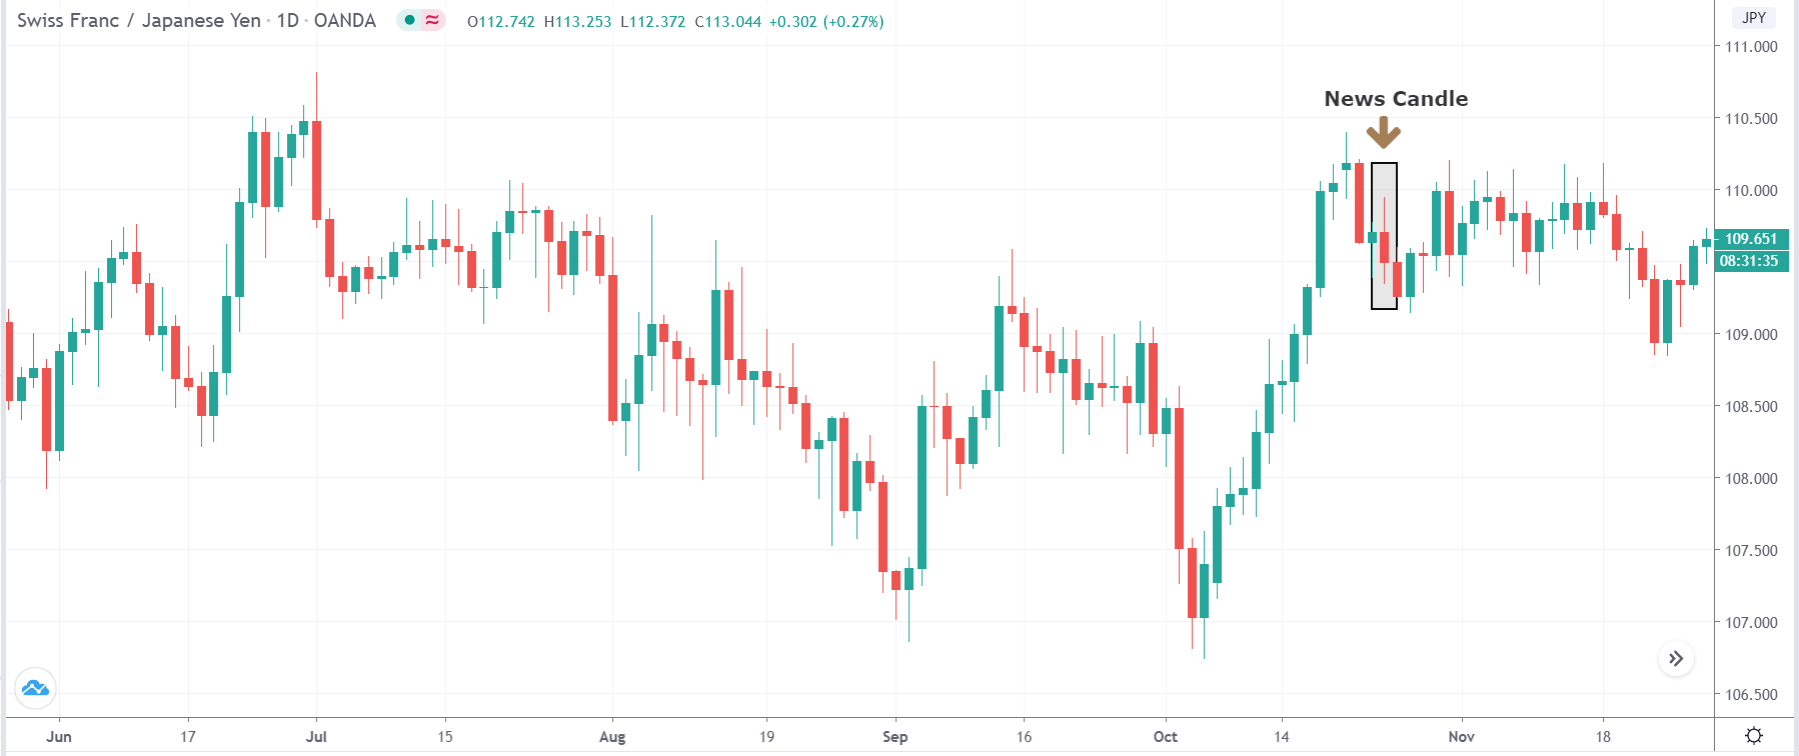
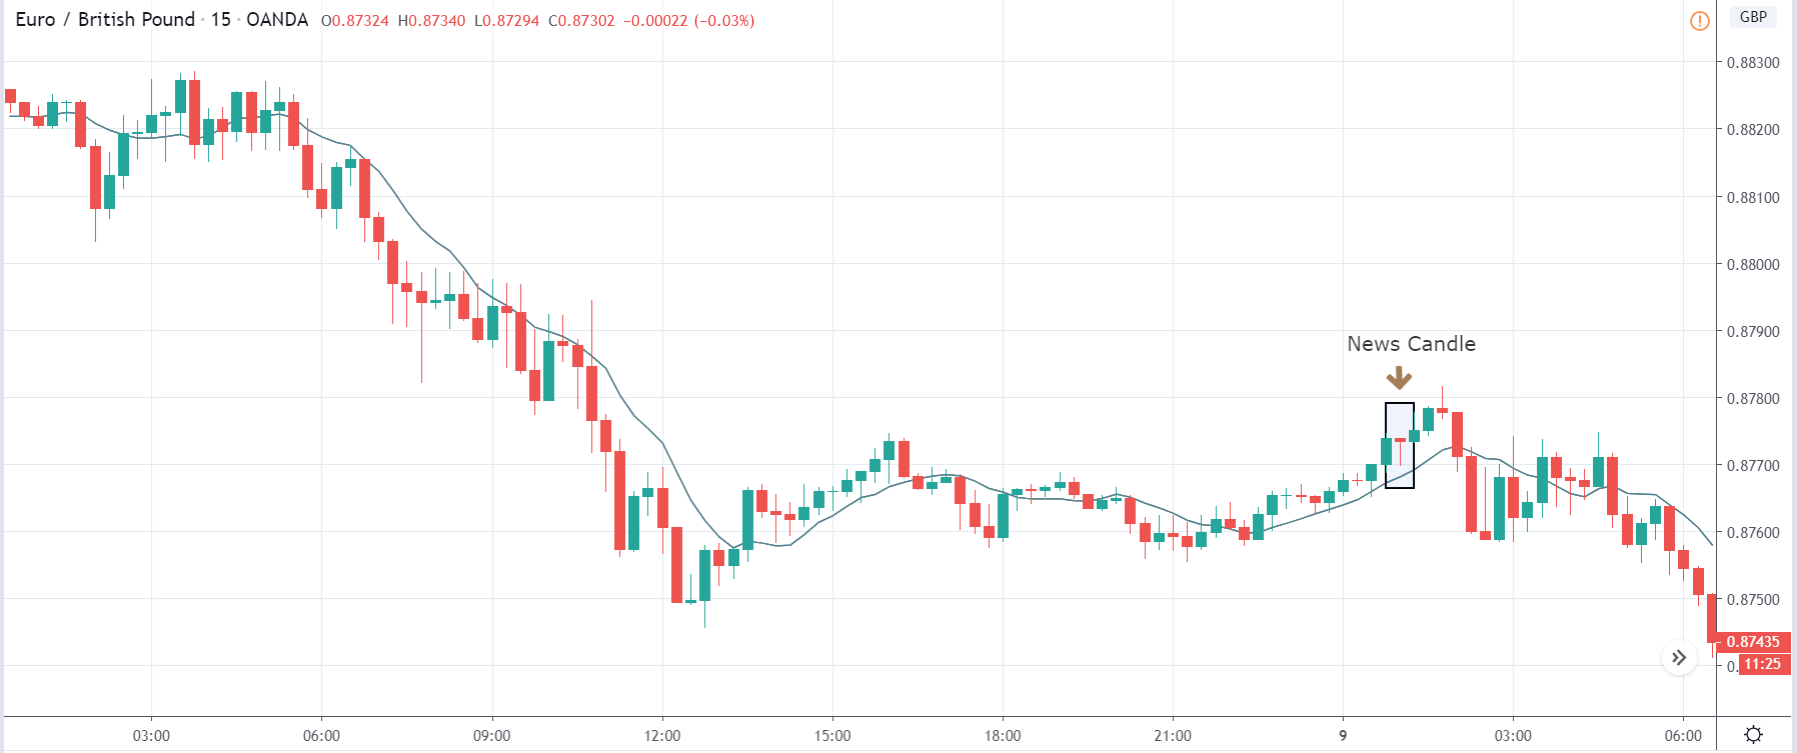
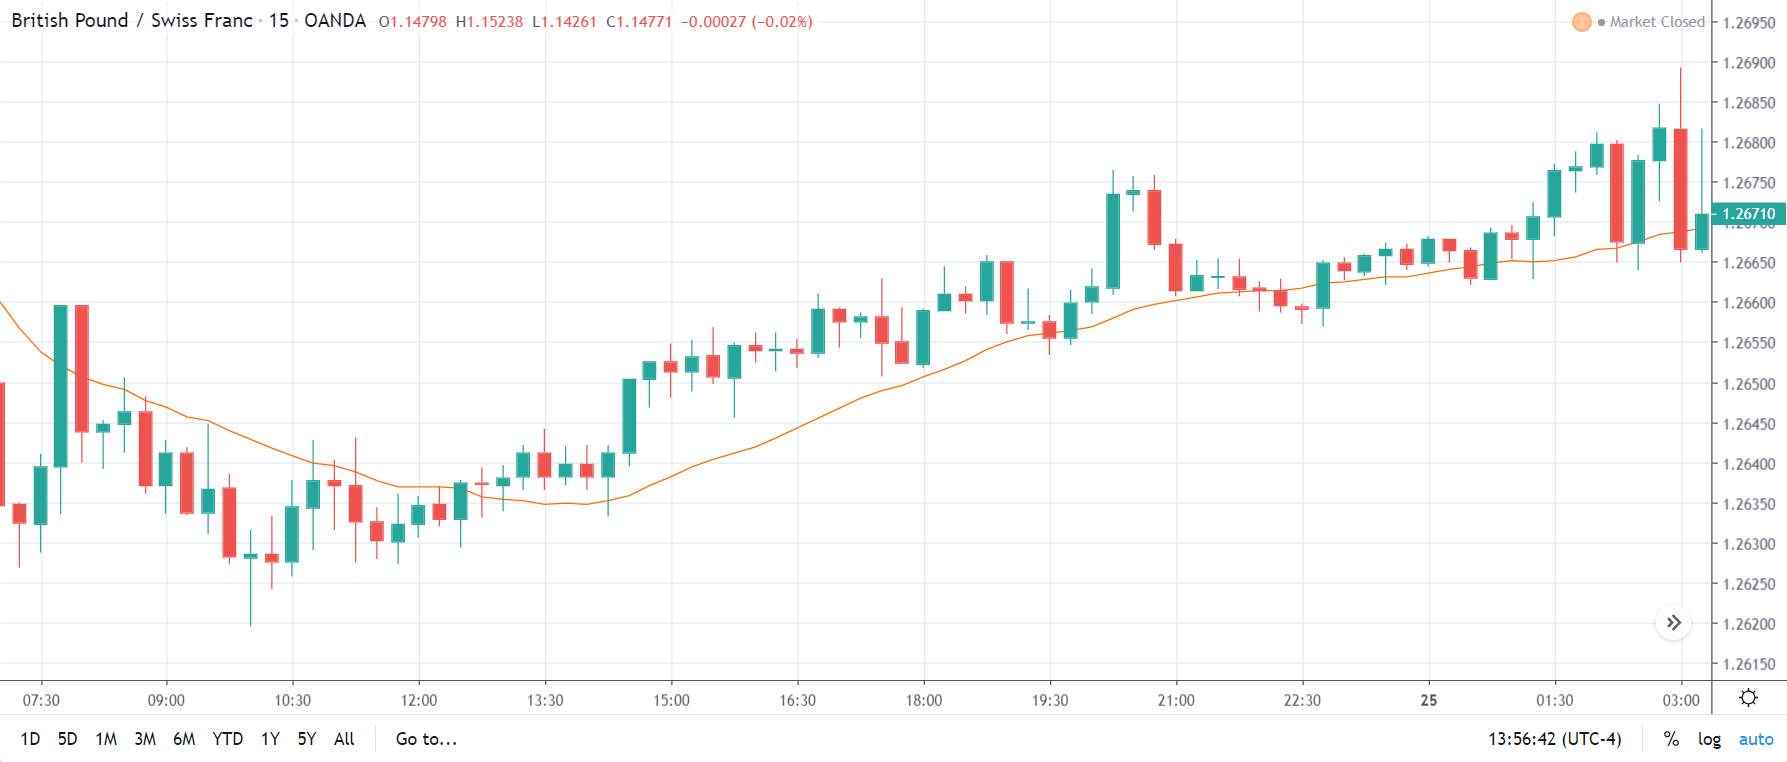
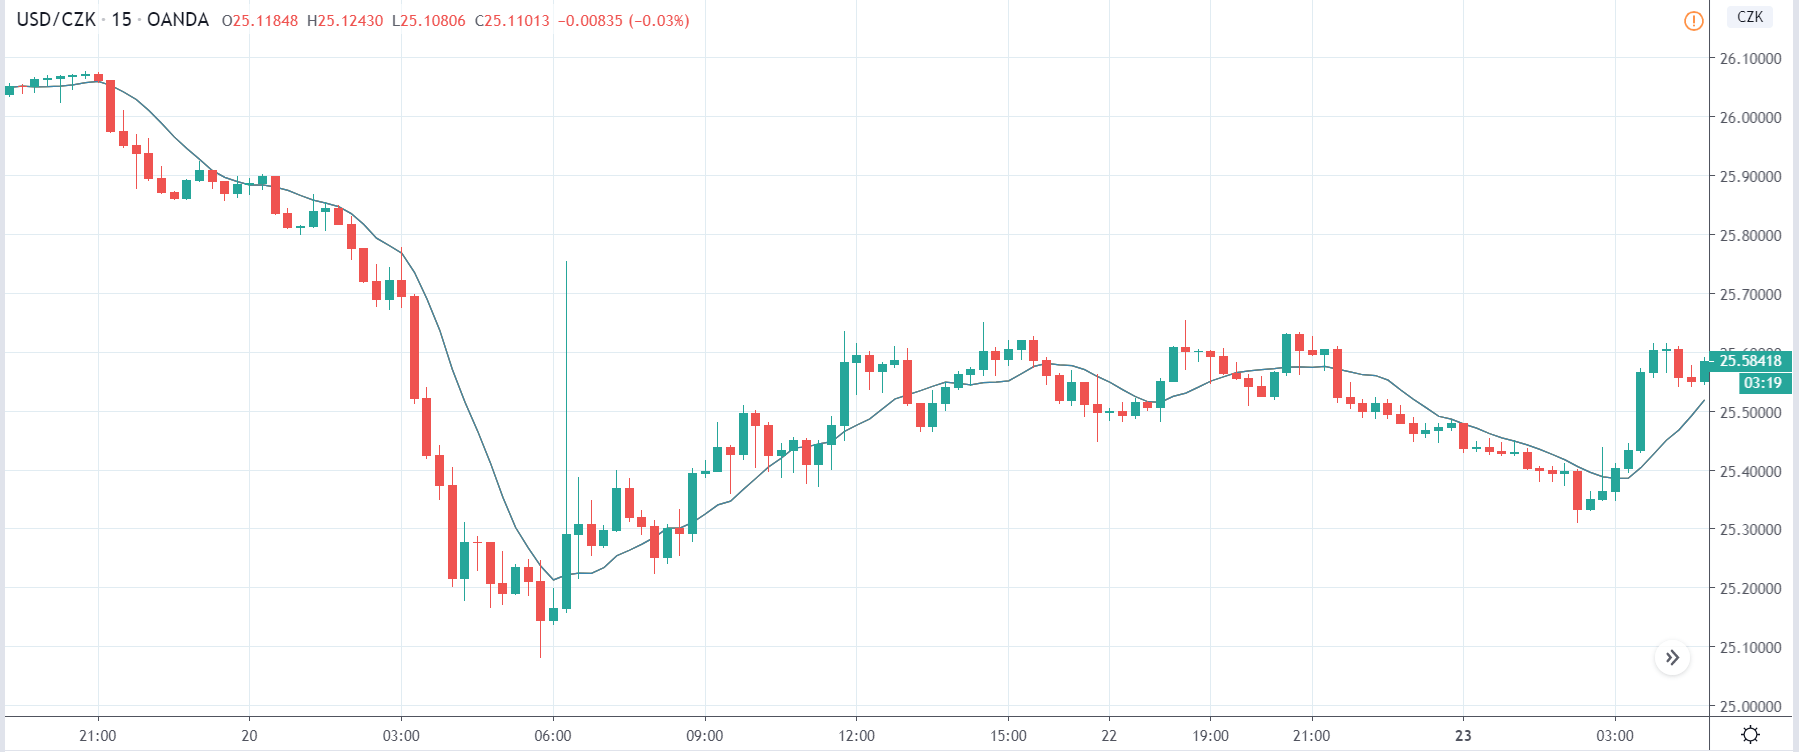
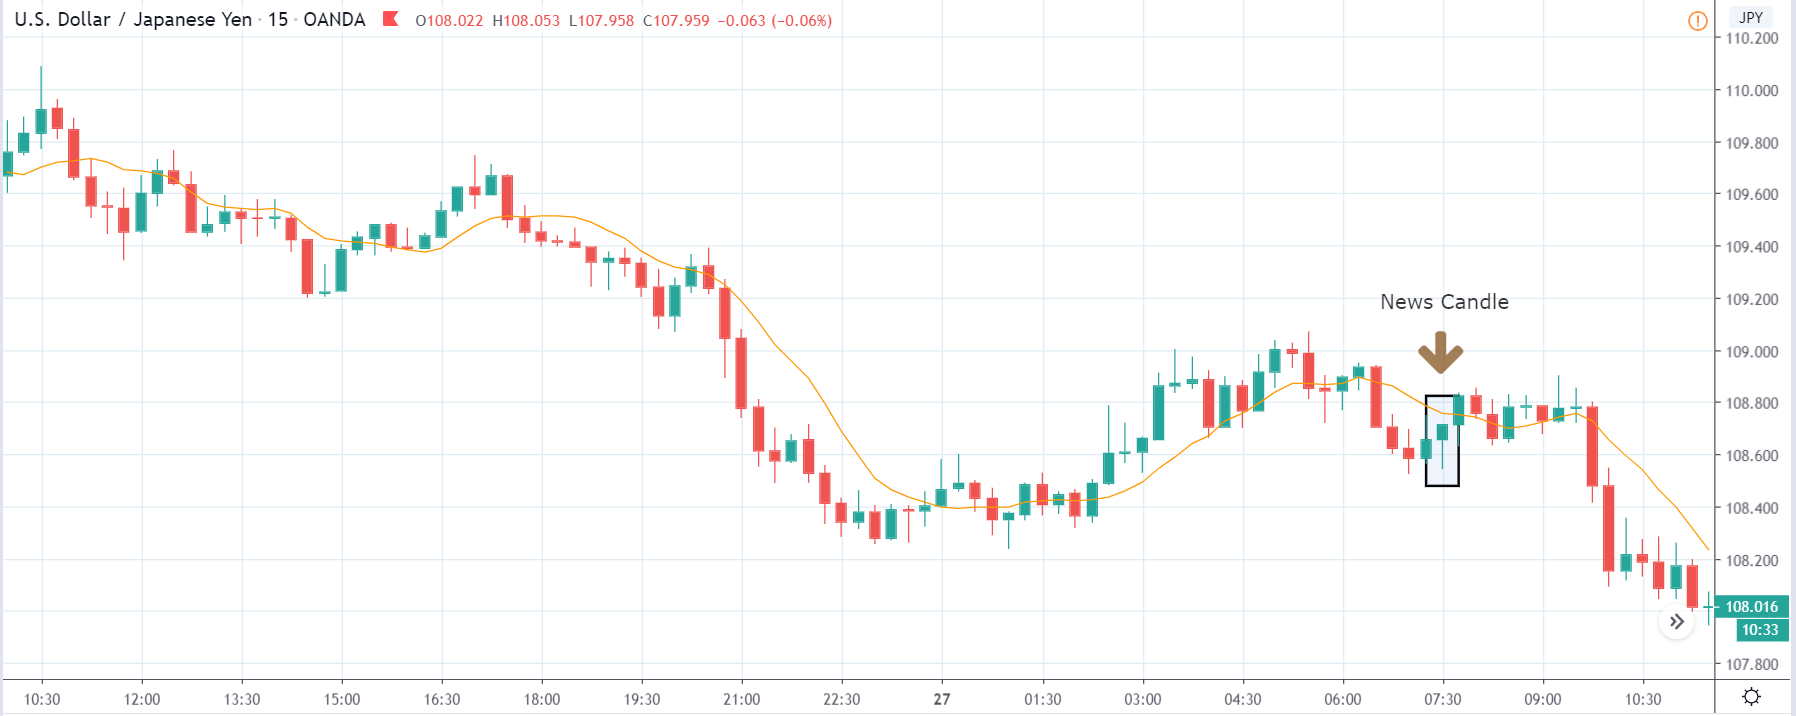
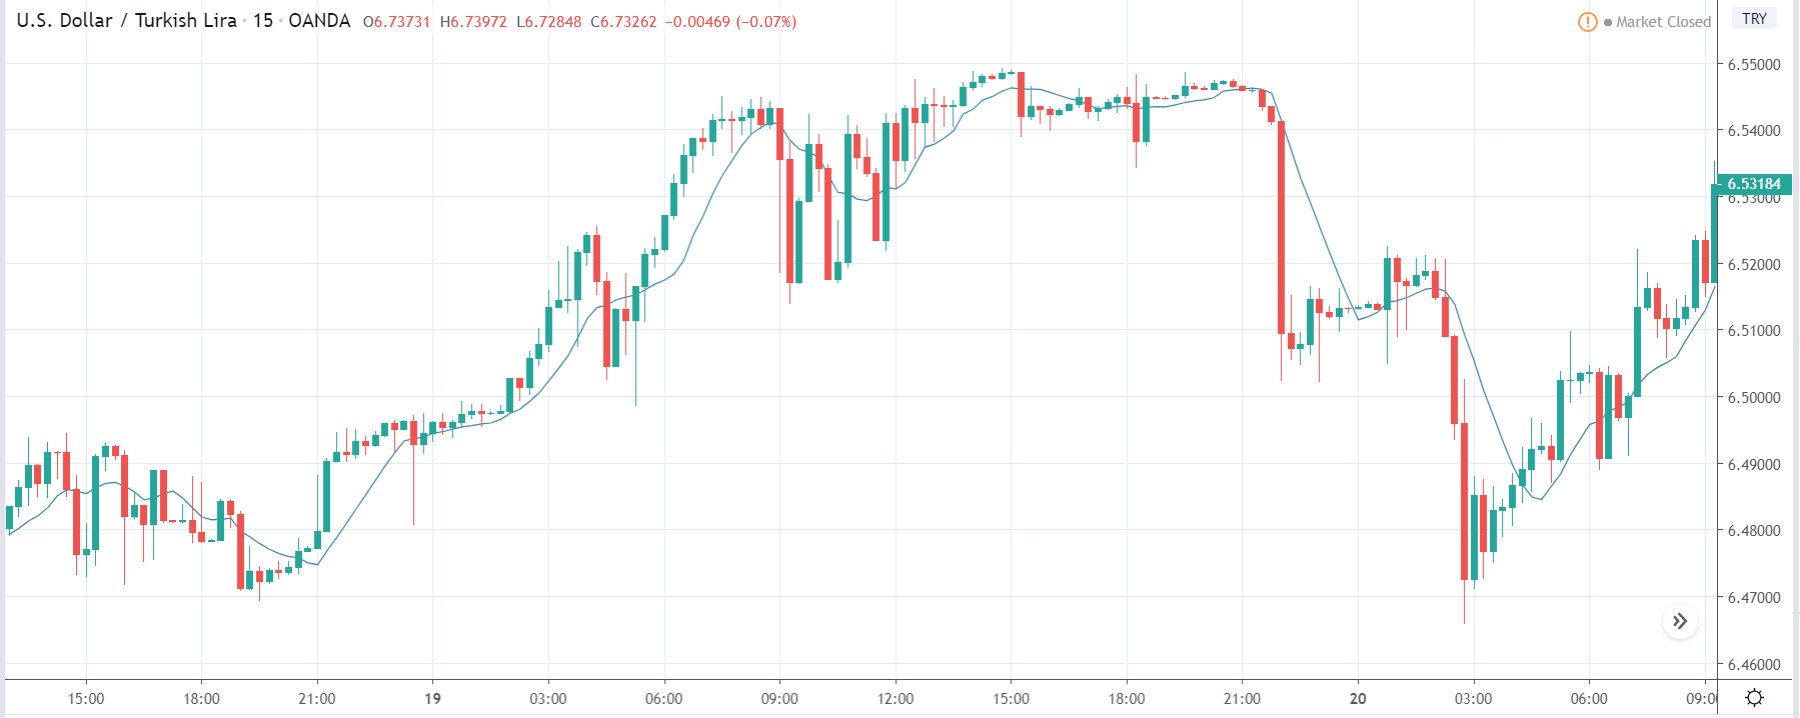
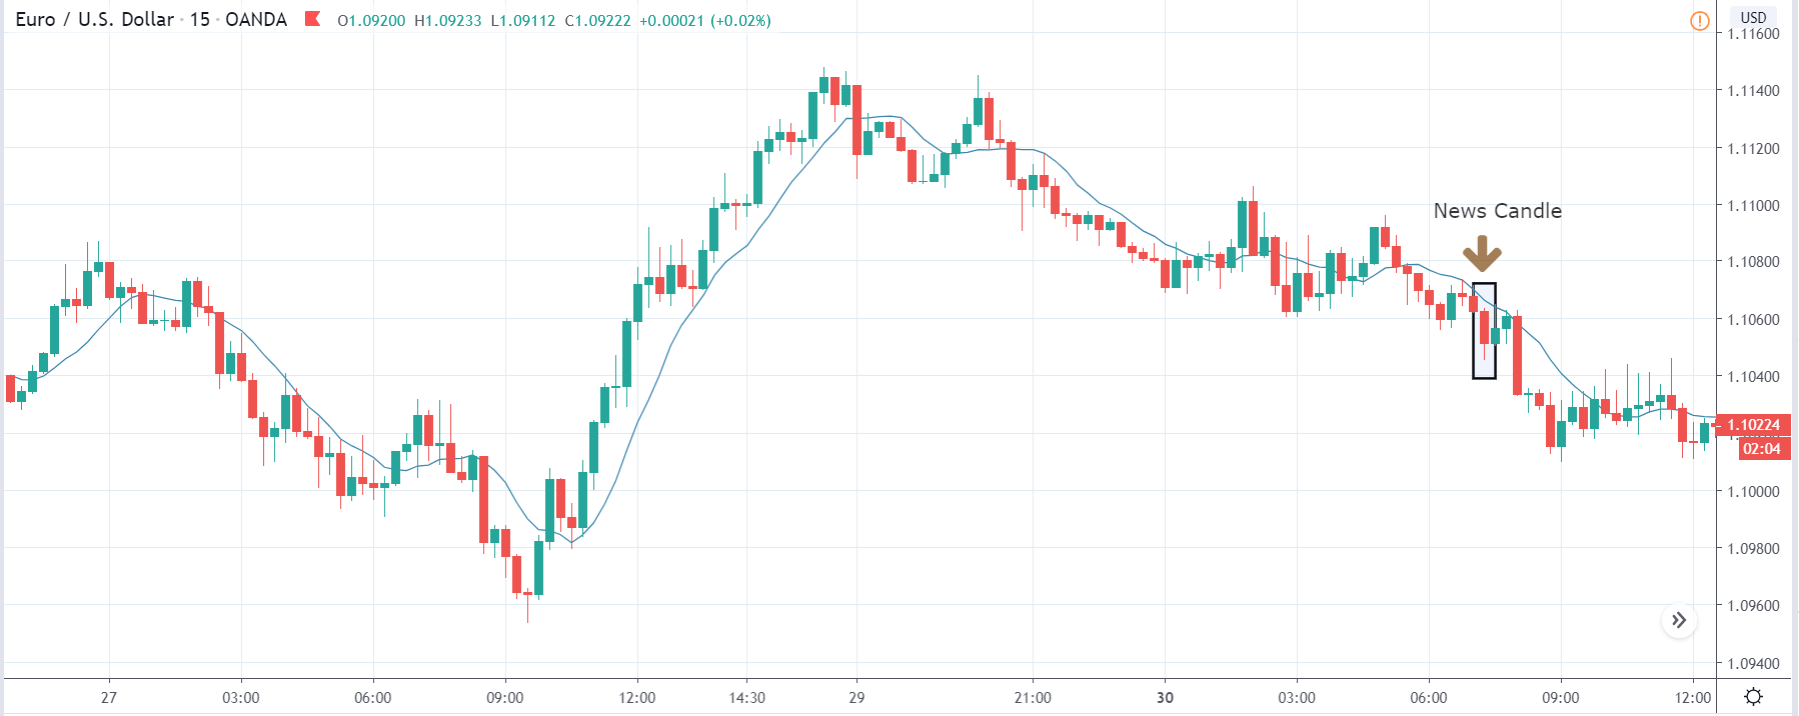
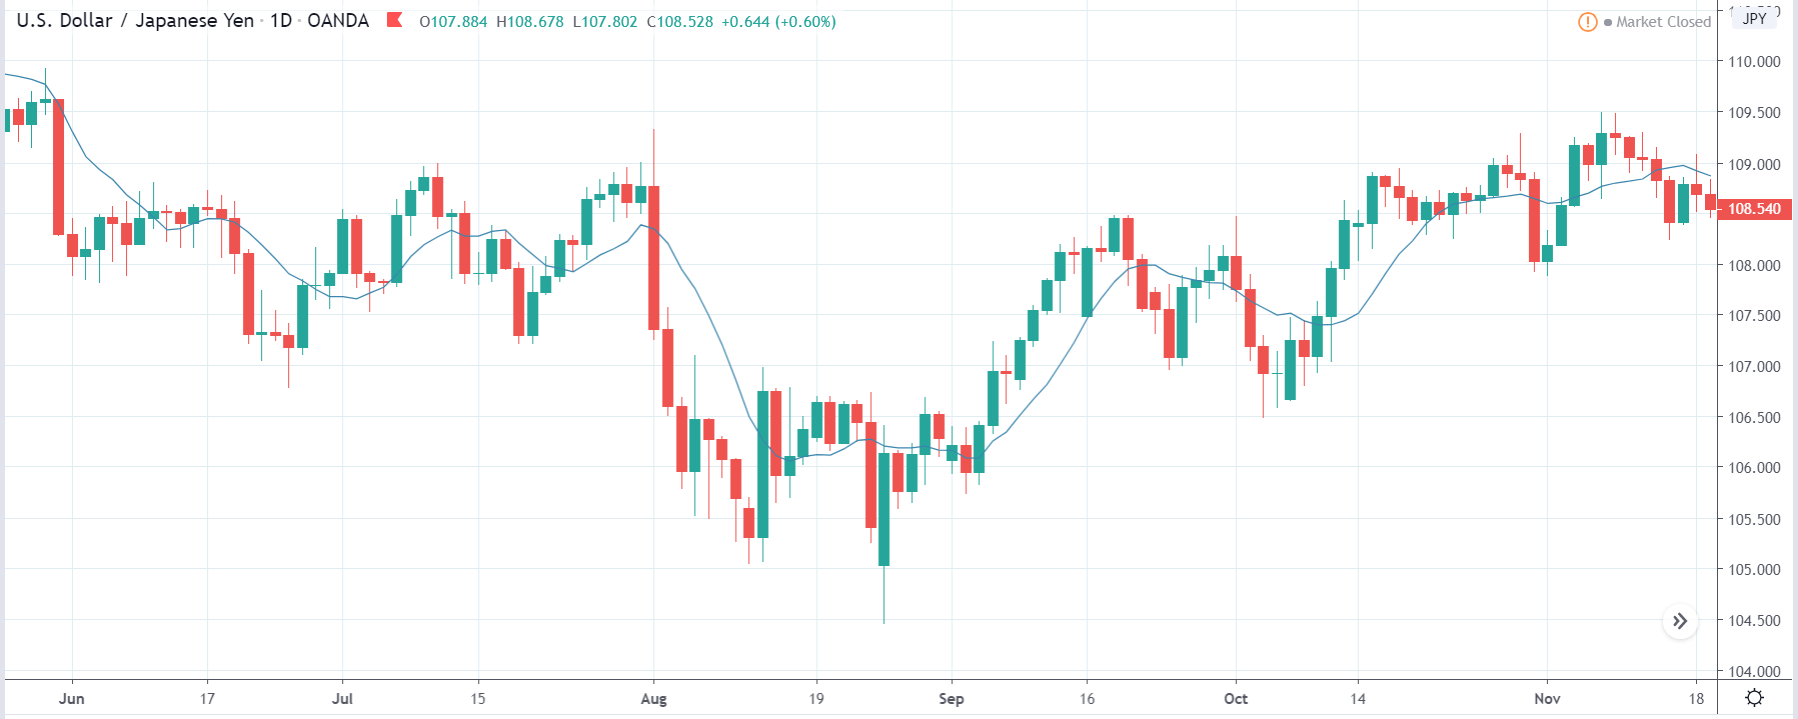
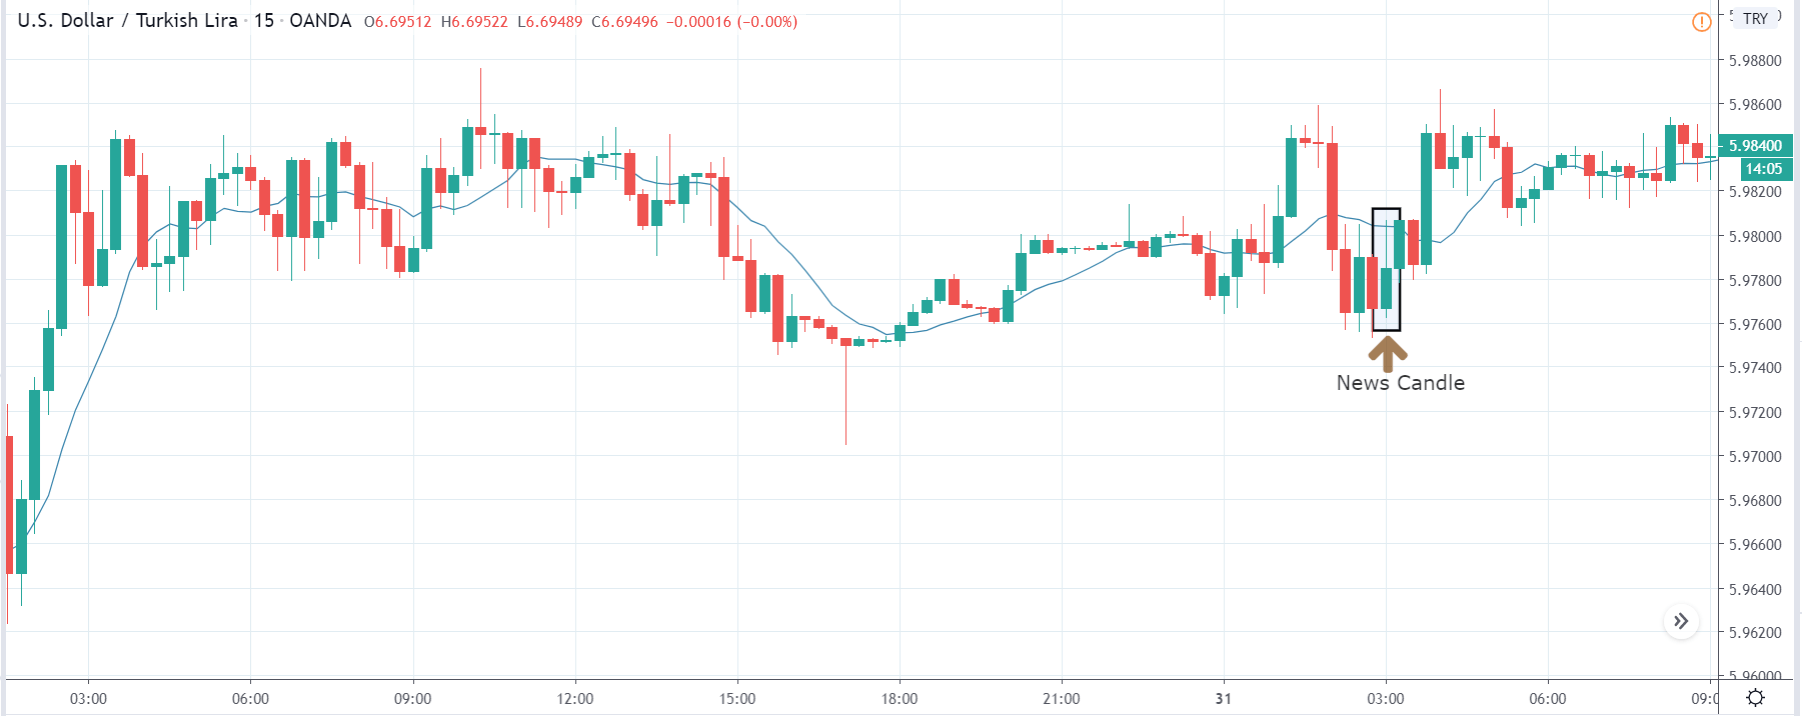
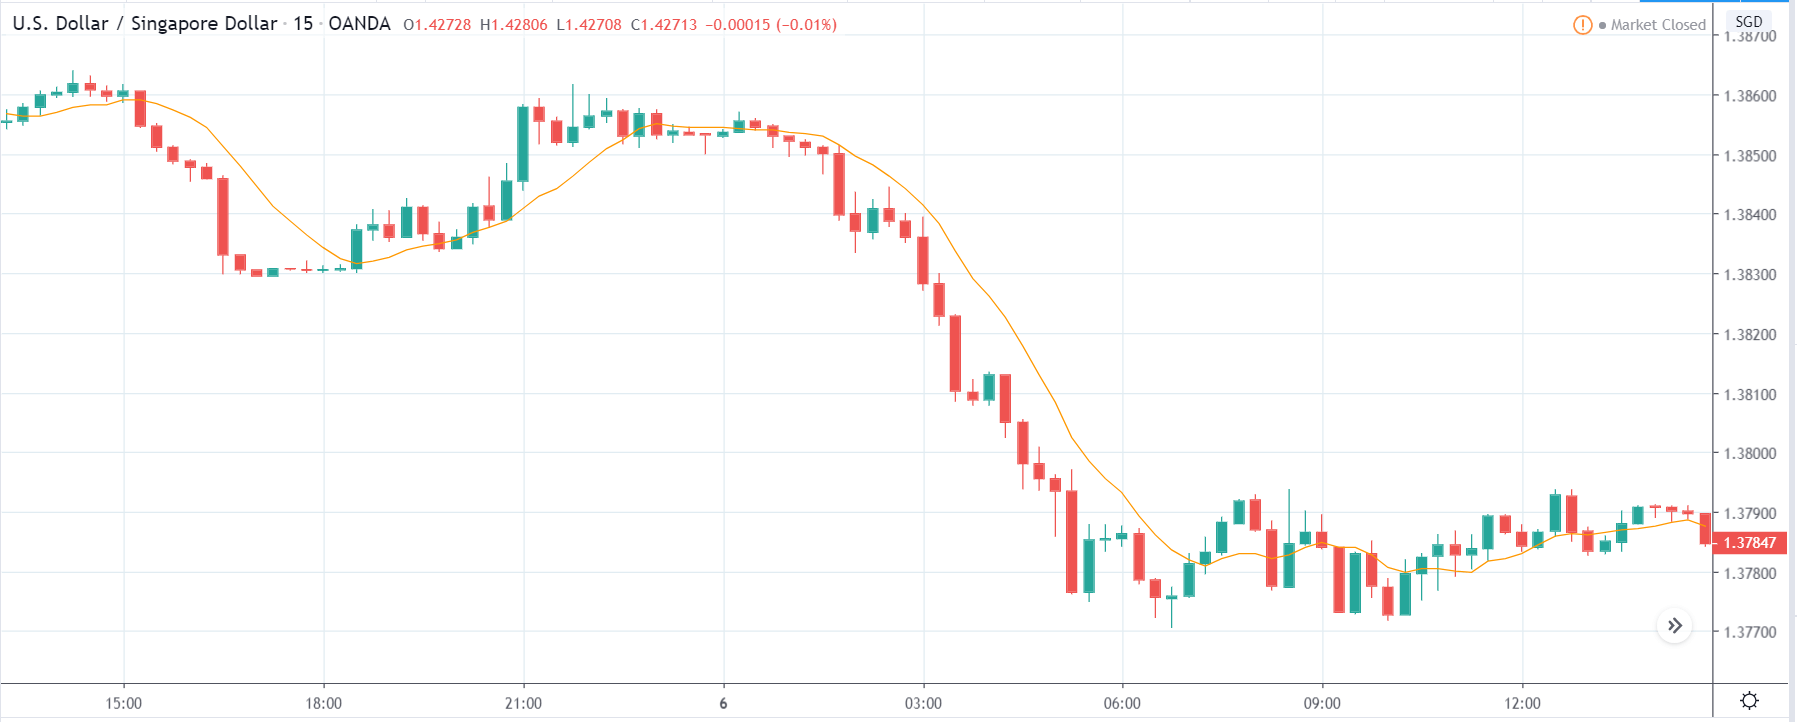
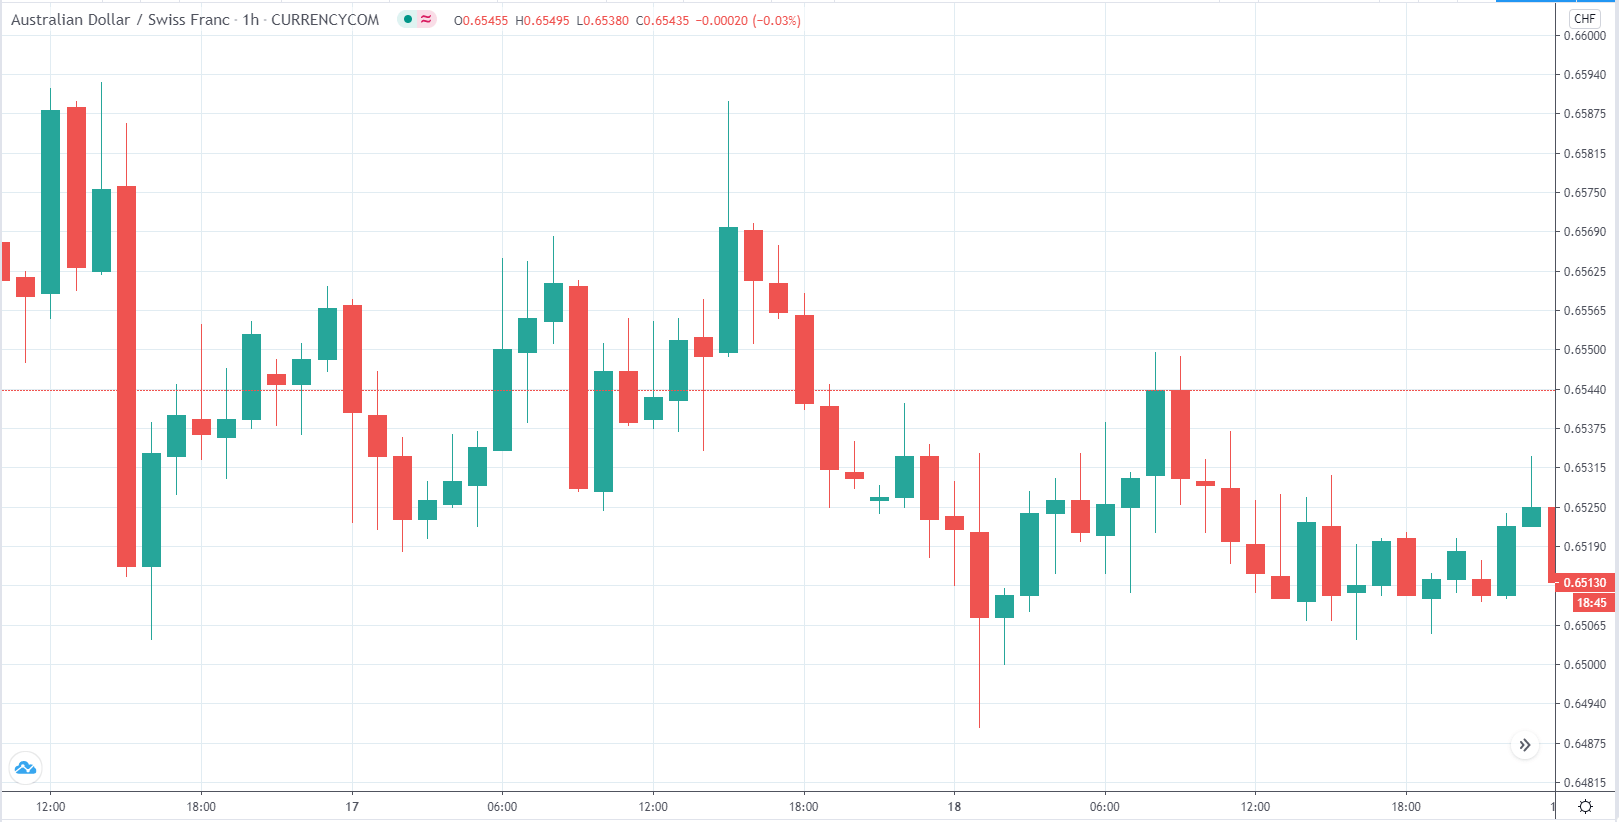
USDCHF – Before the Announcement
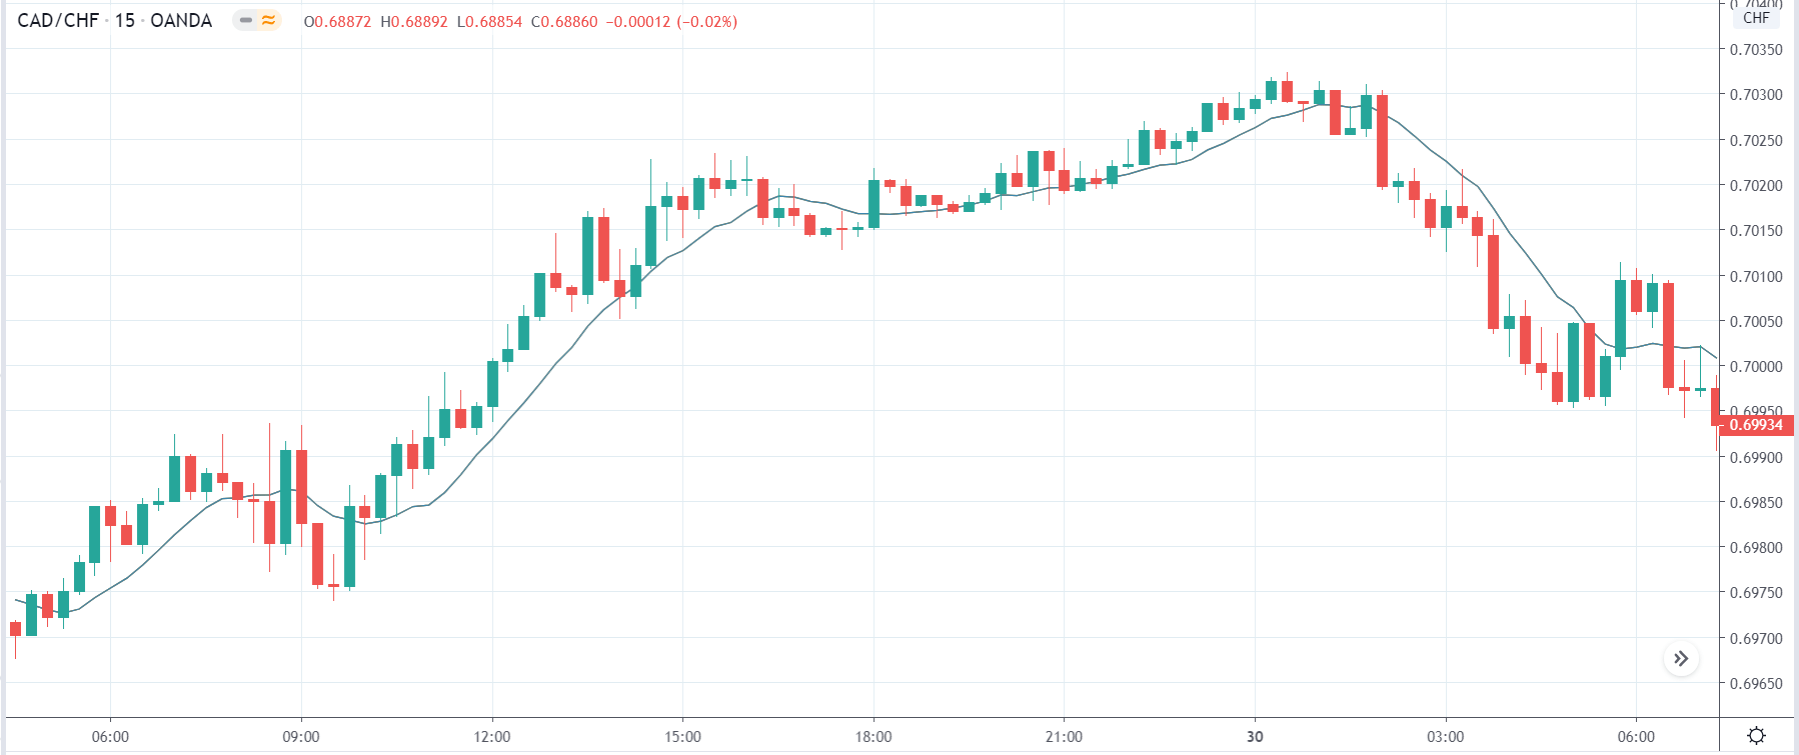
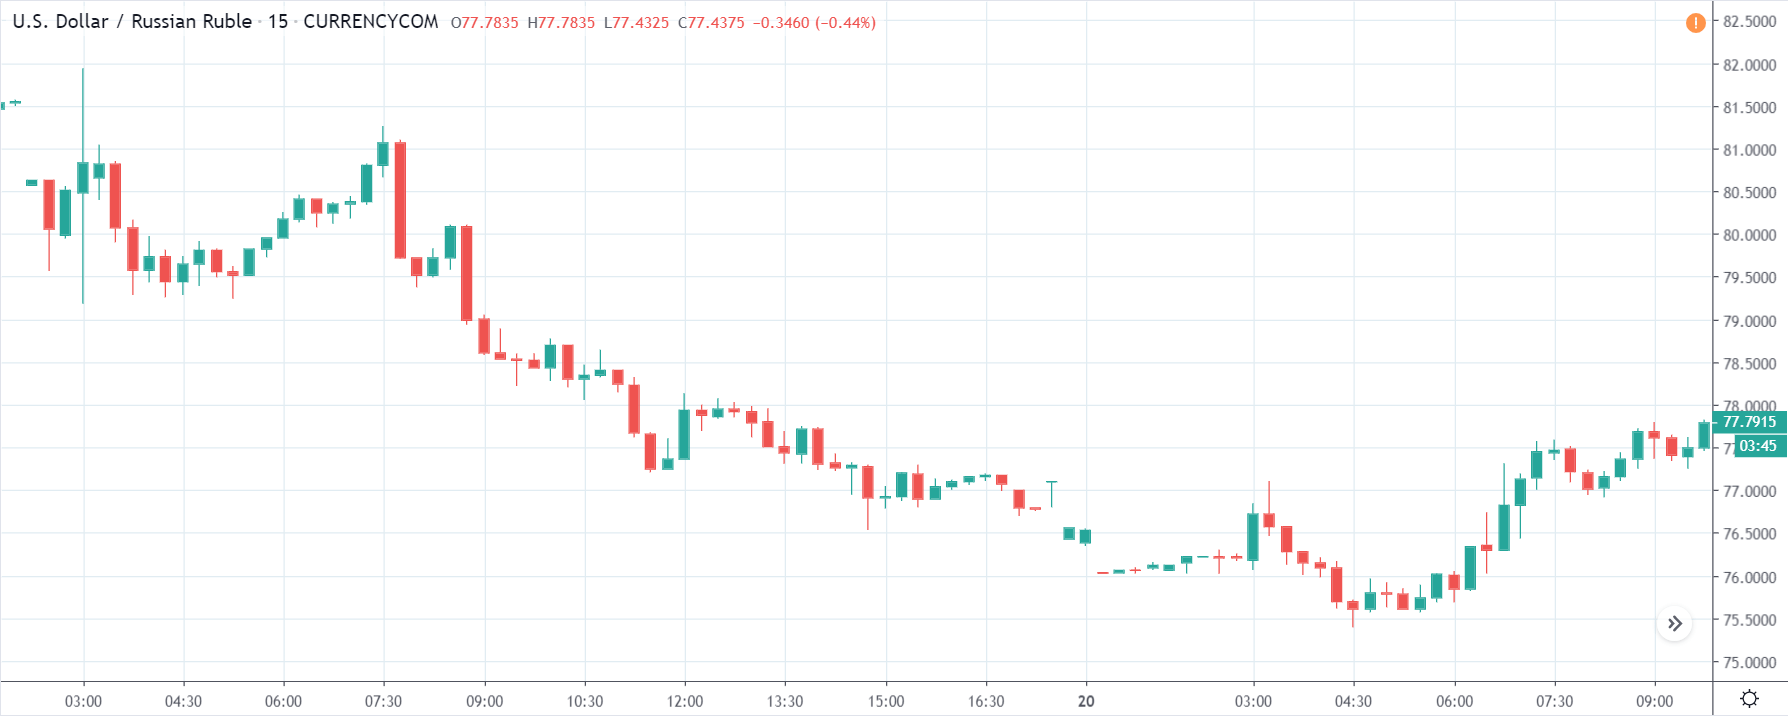
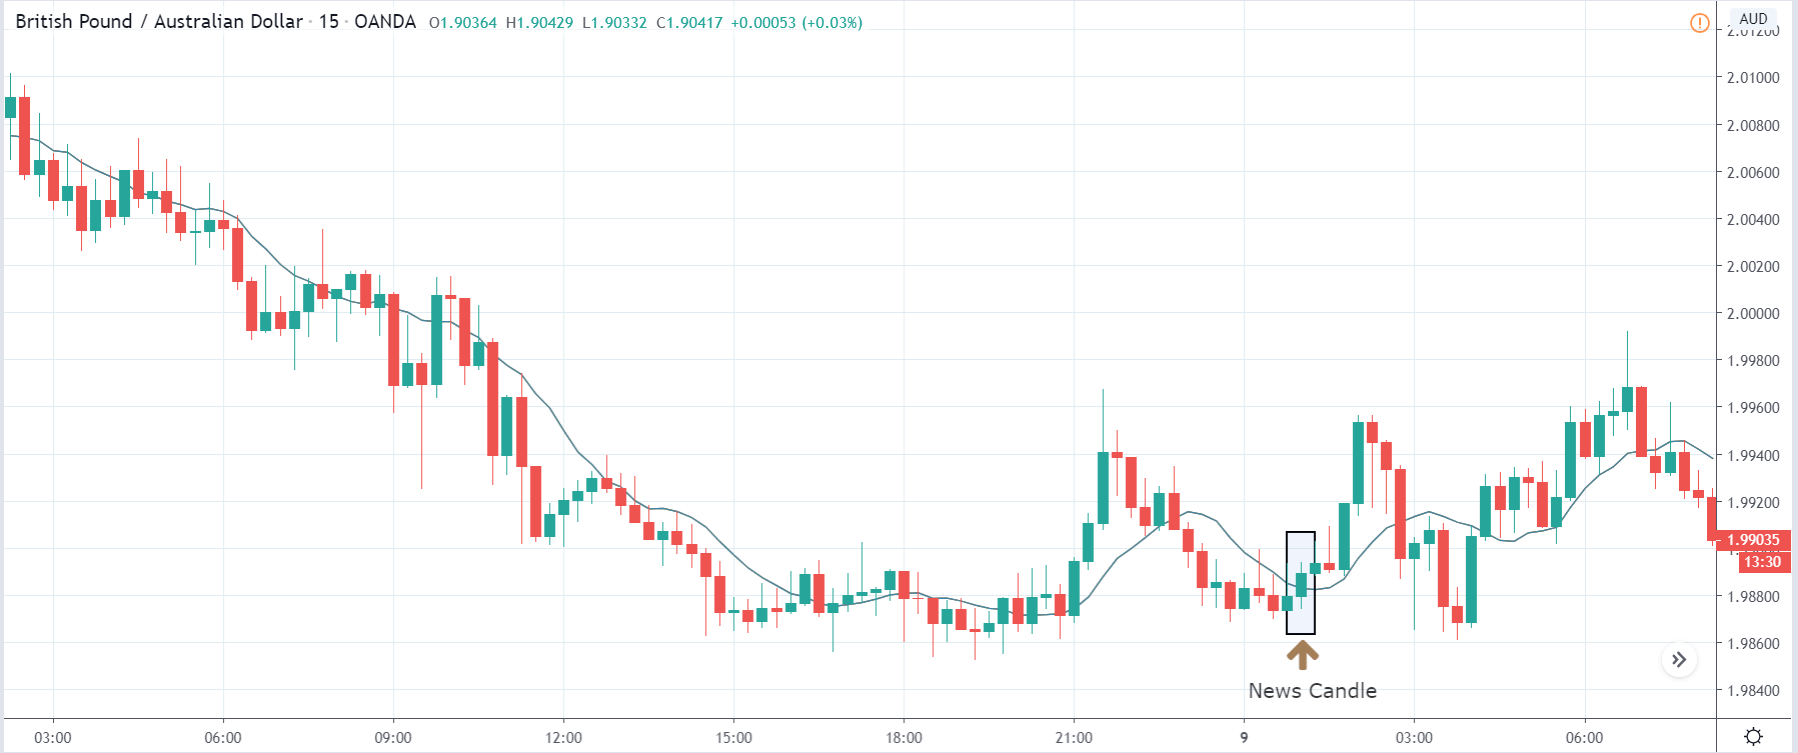
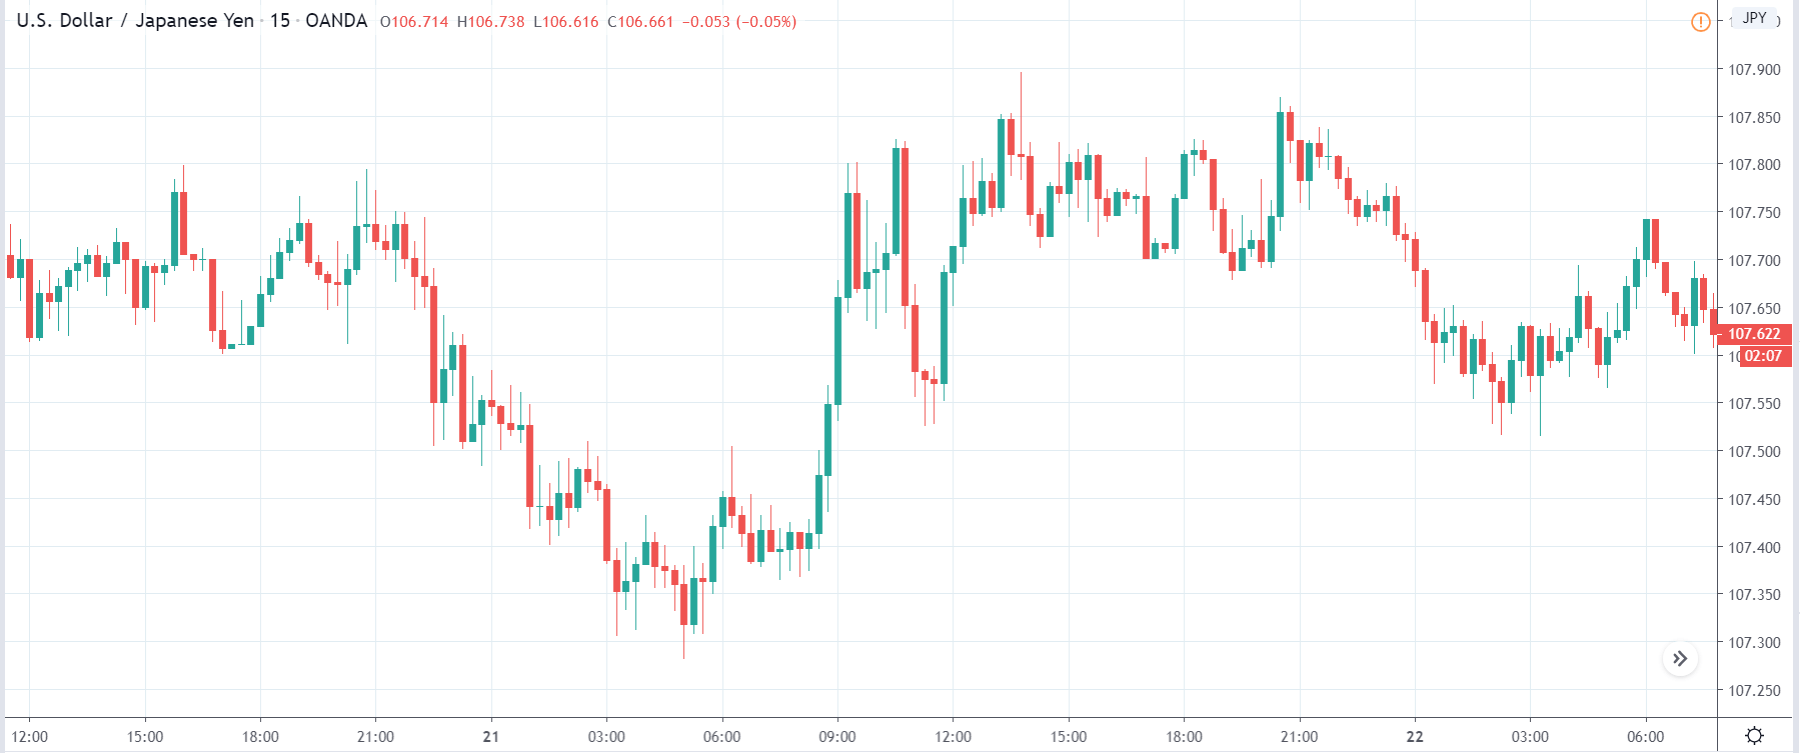
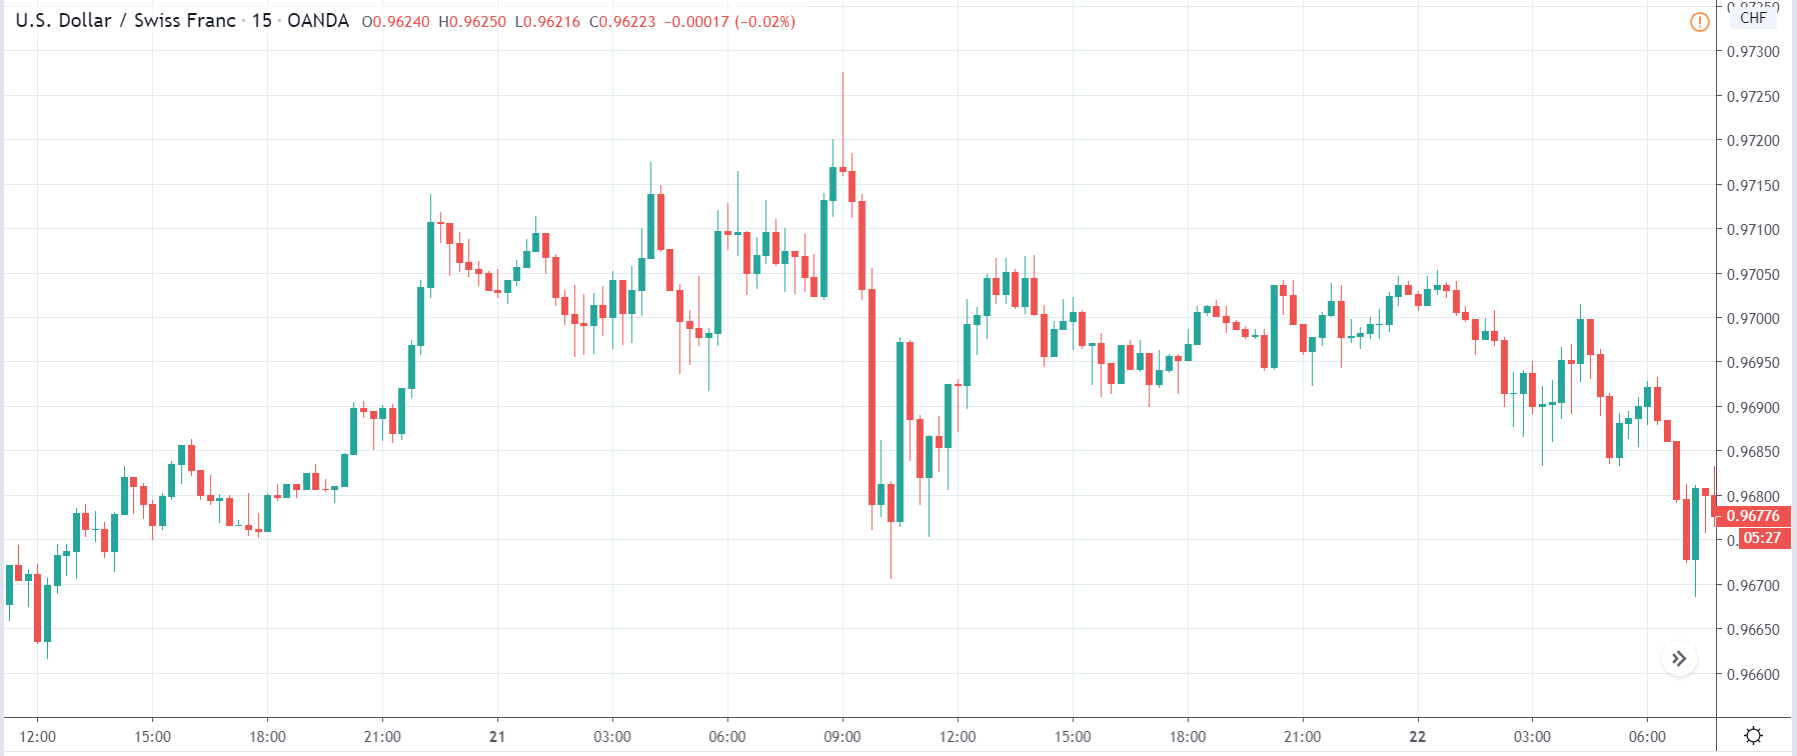
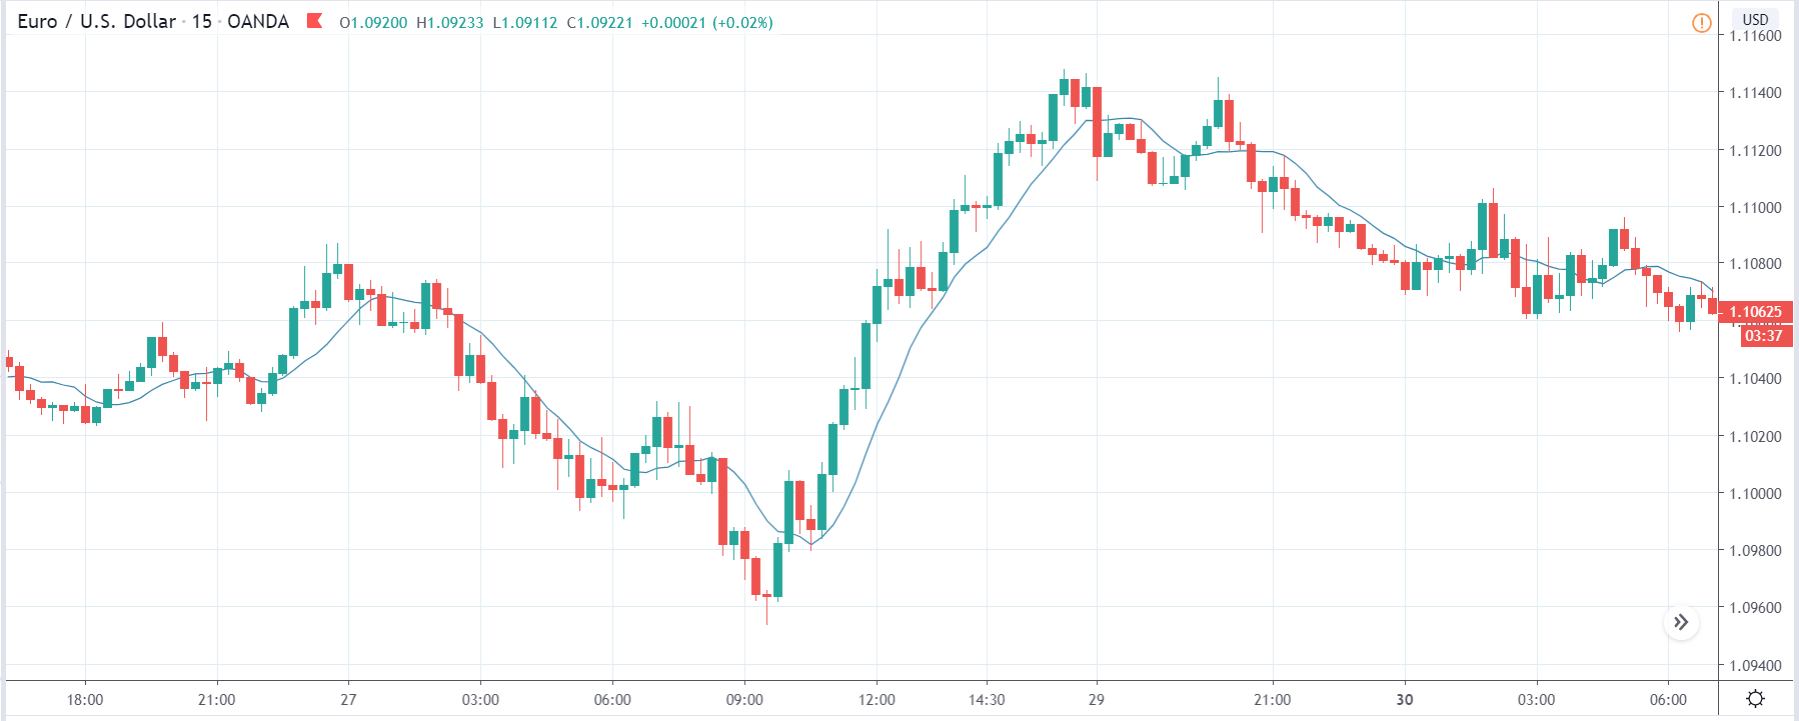
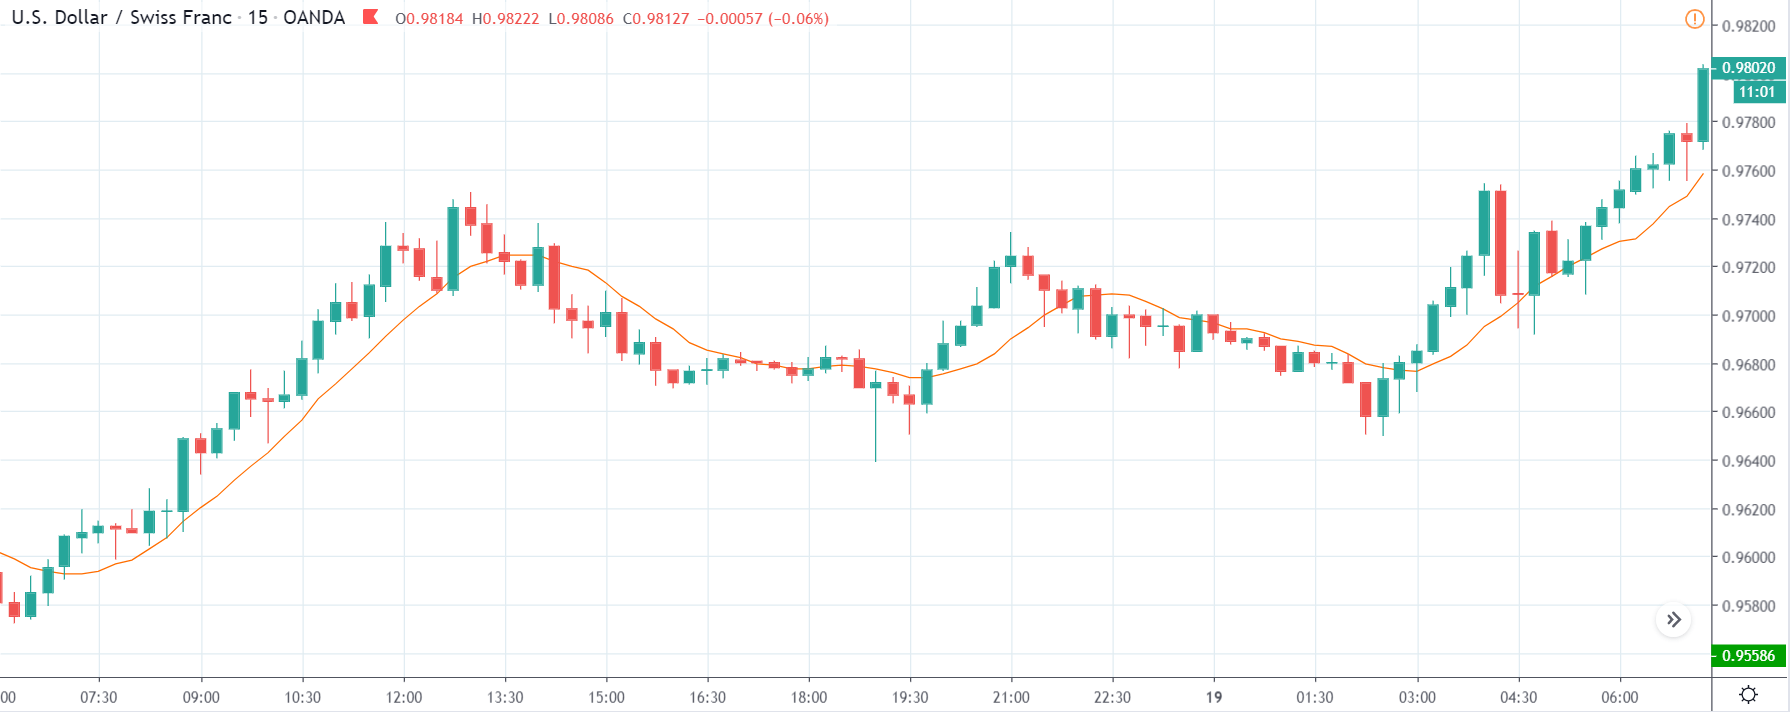
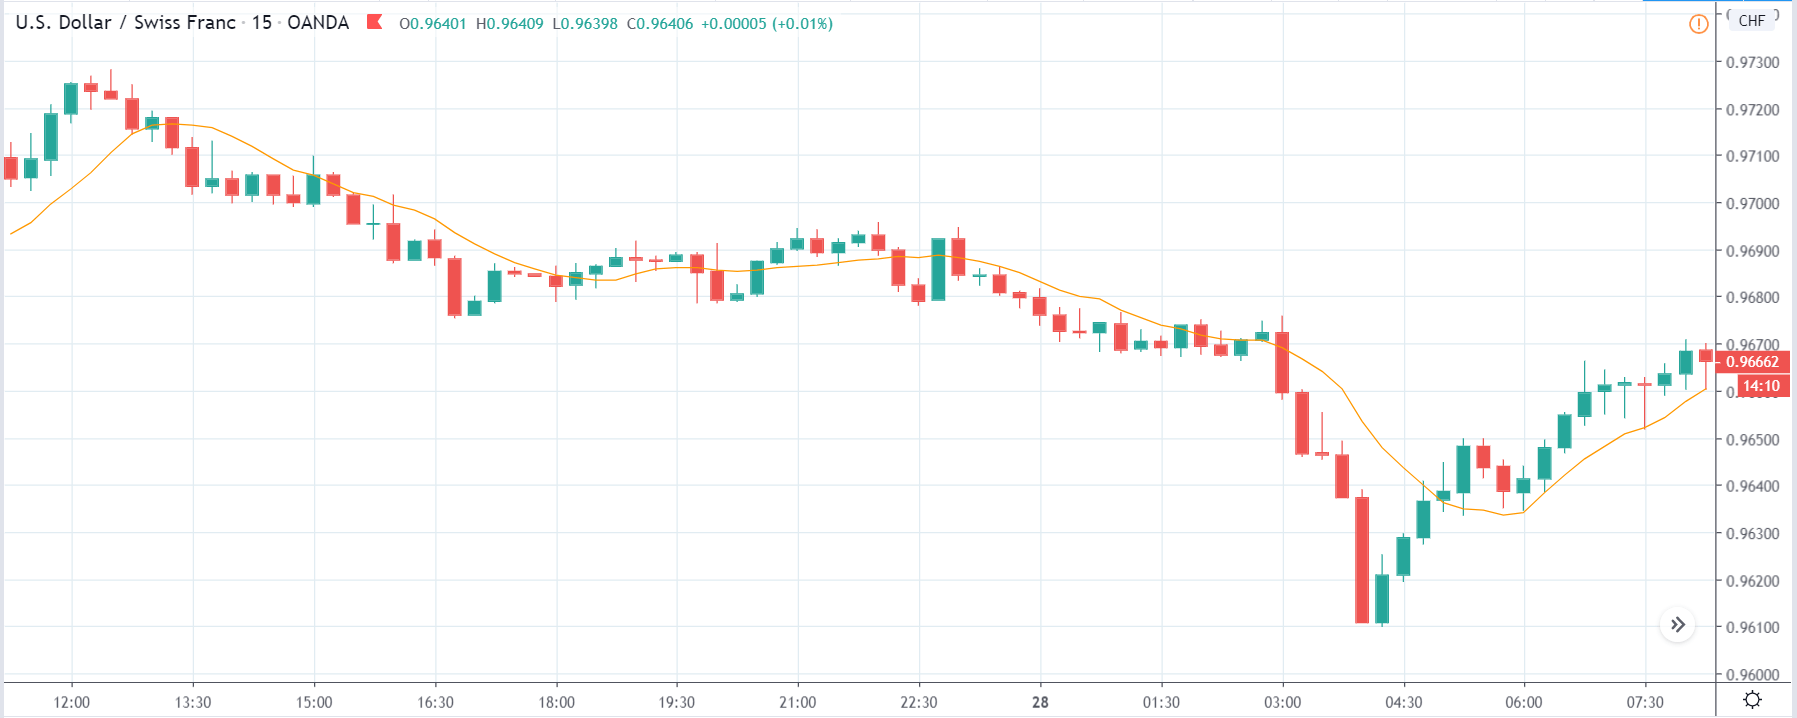
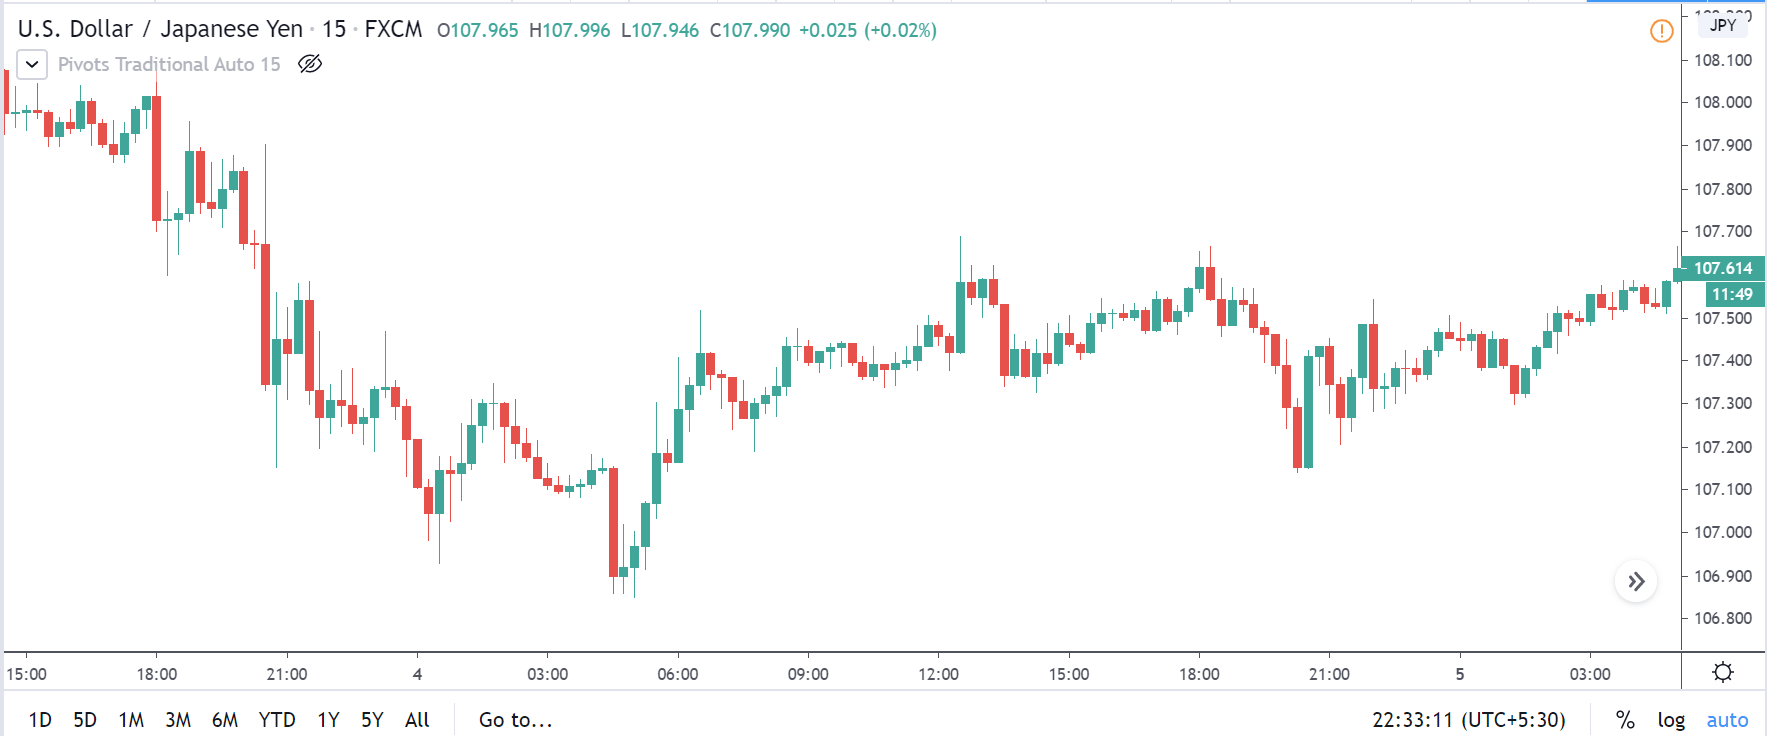
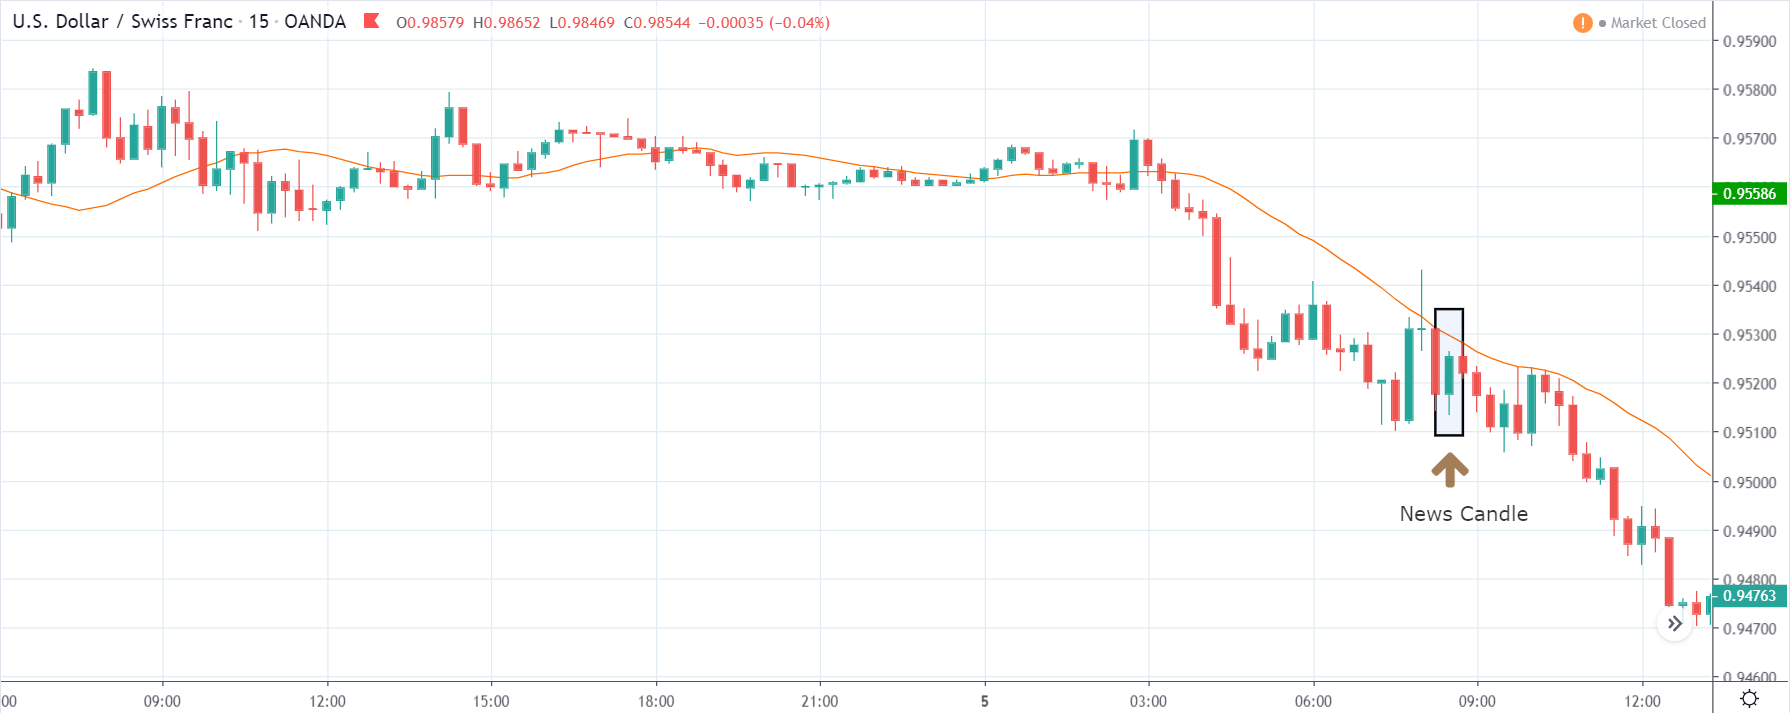
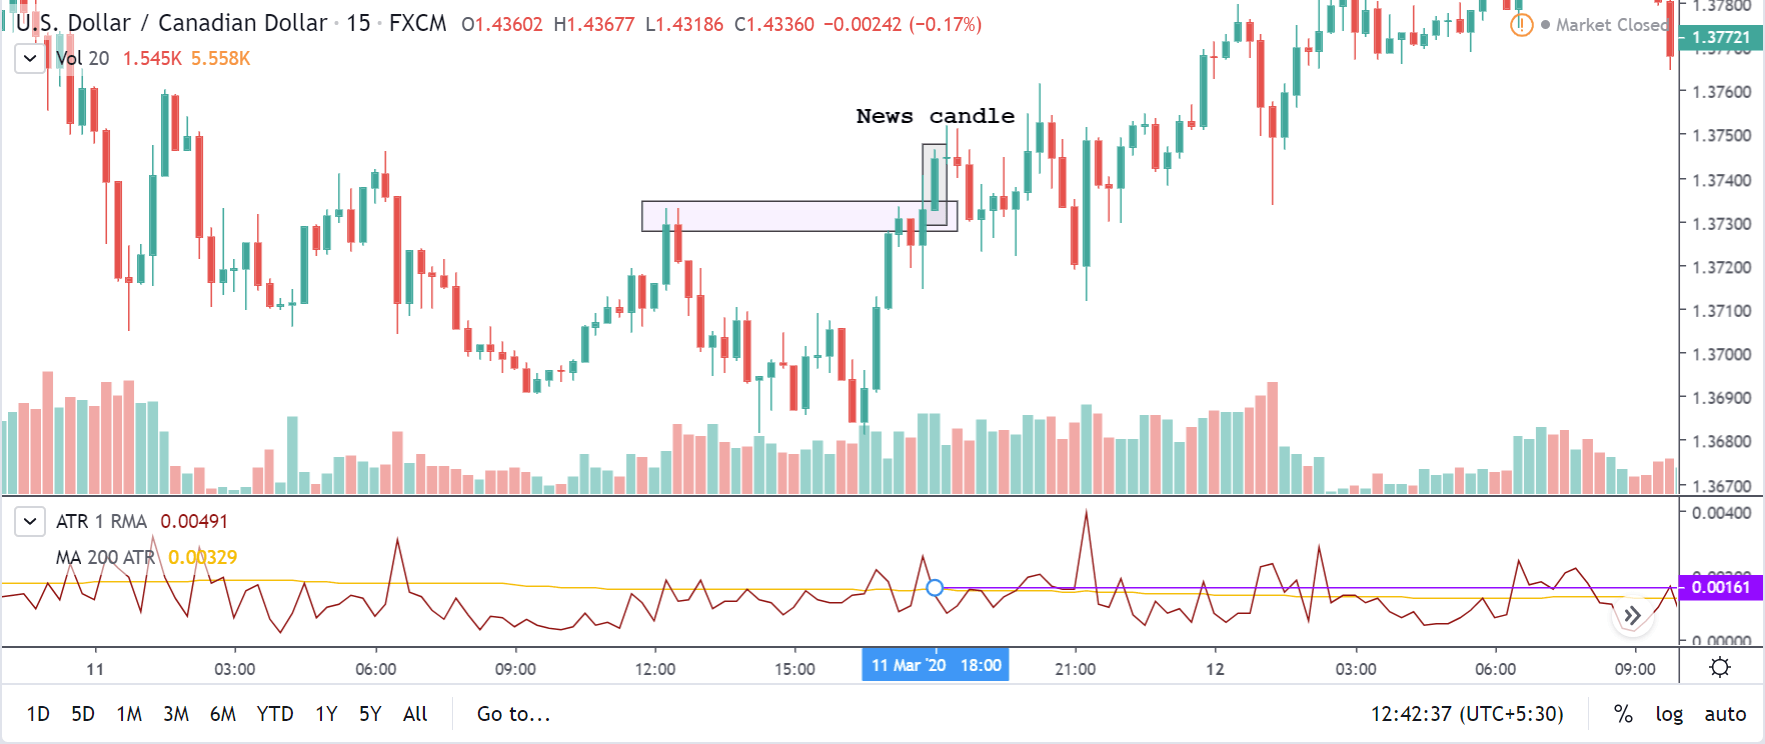
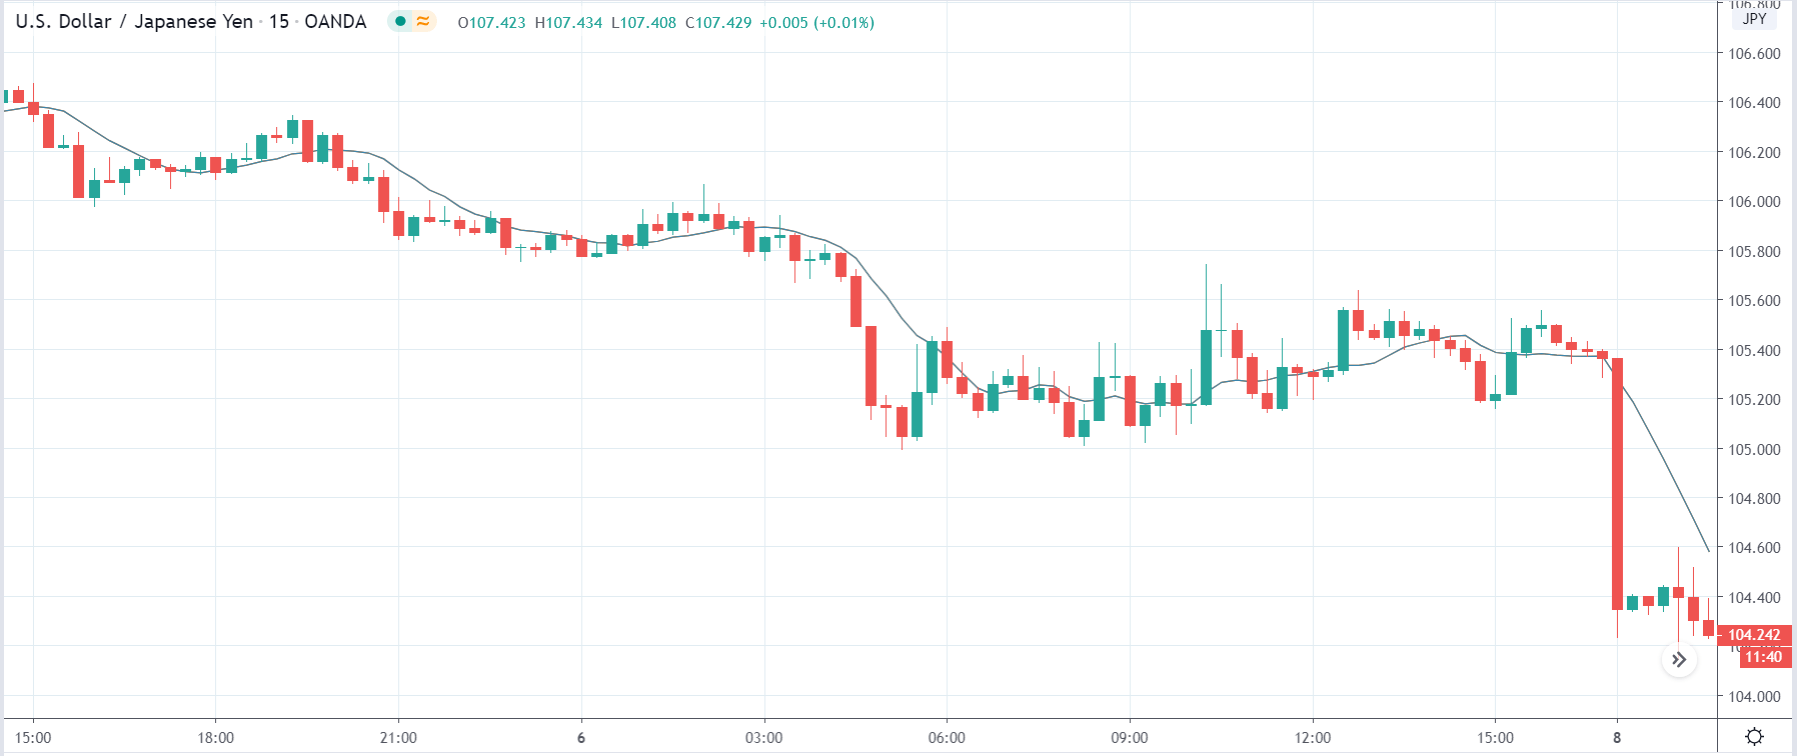
Before the announcement of the news, the market was in a pullback phase of a downtrend.
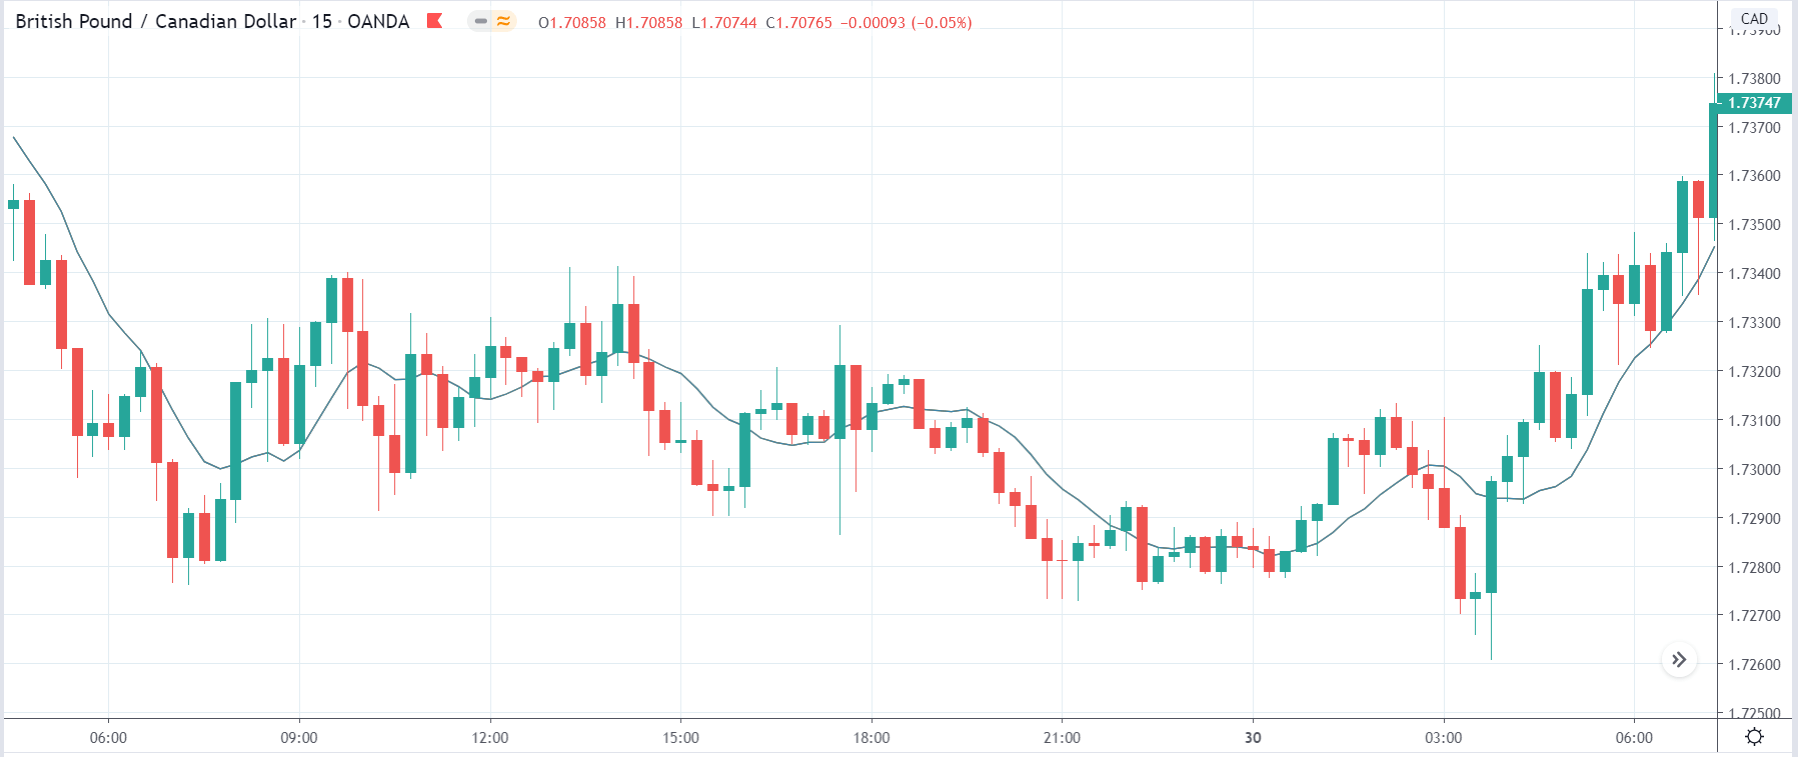
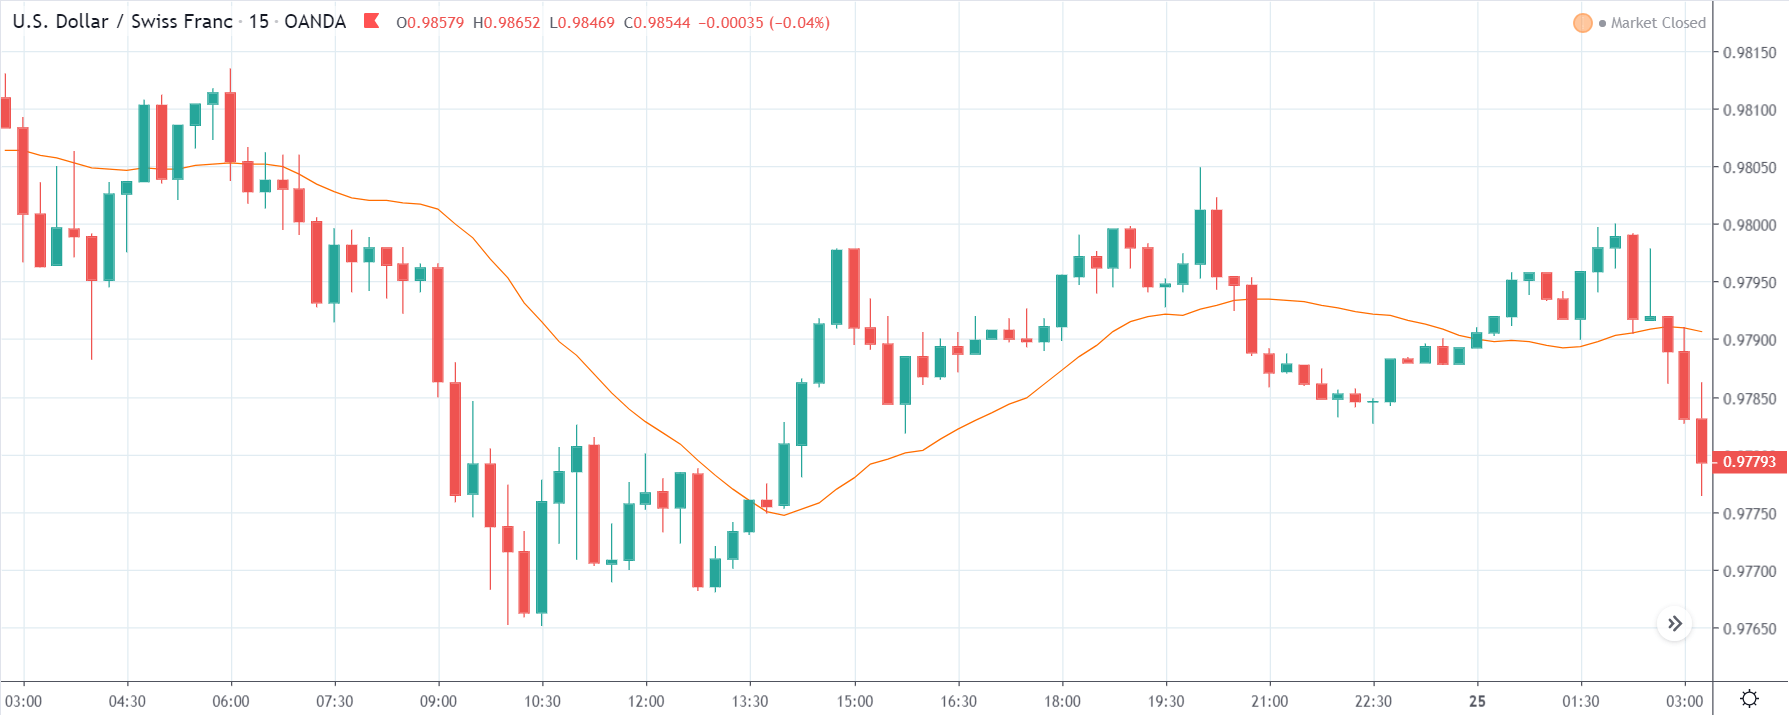
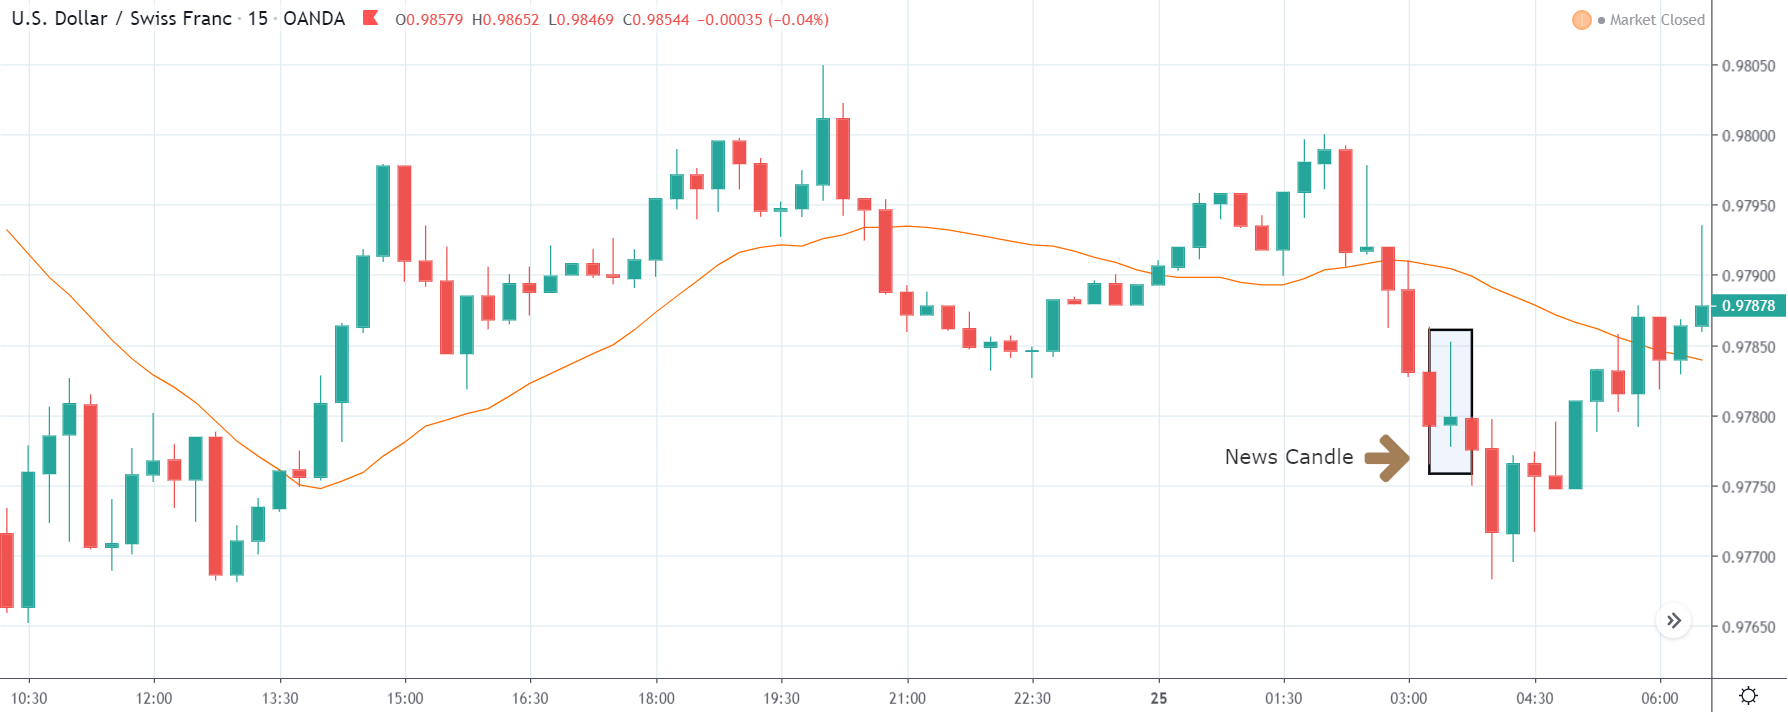
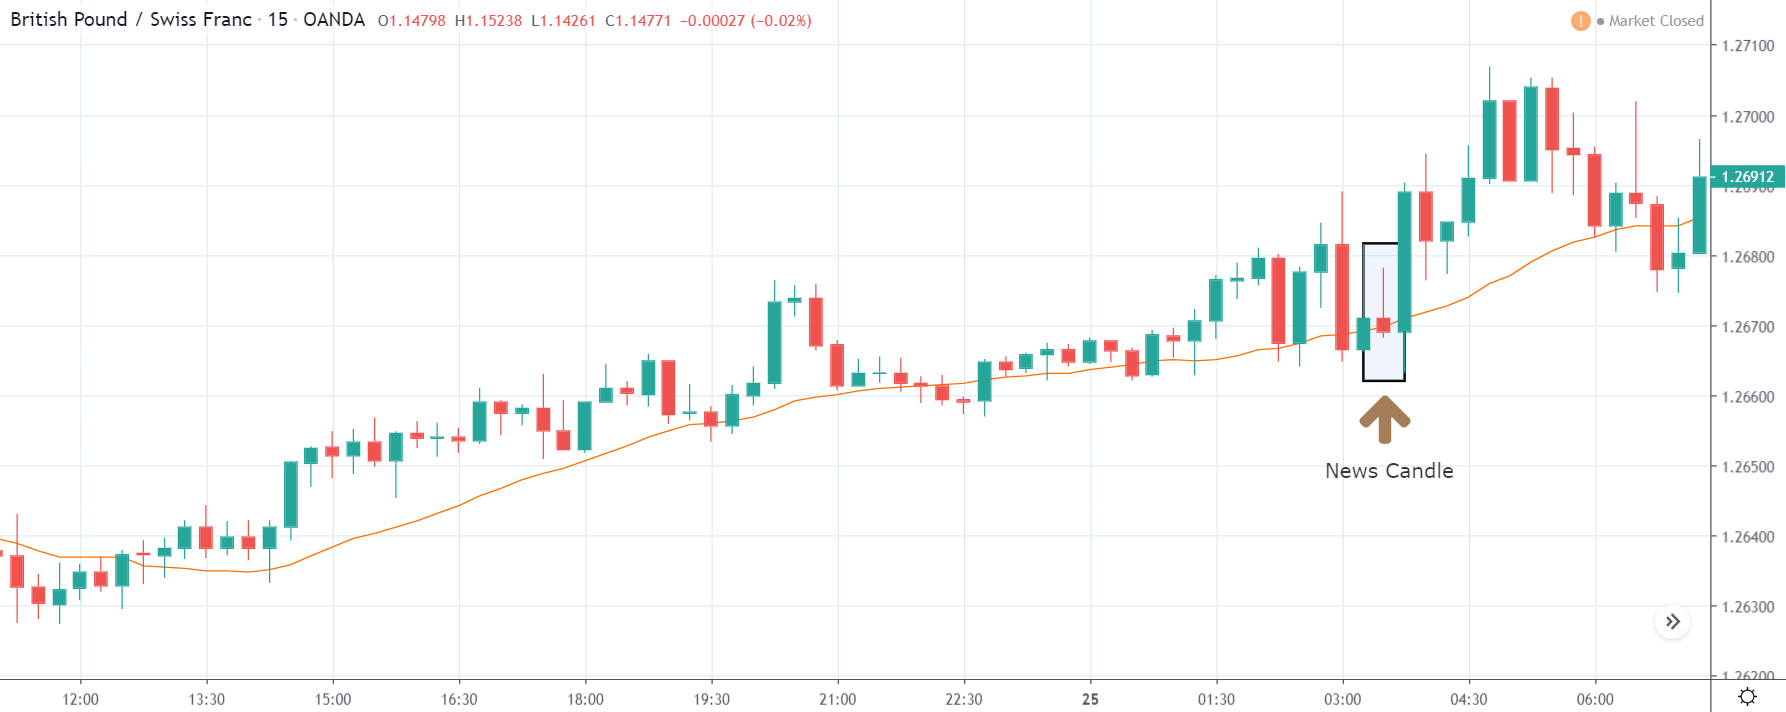
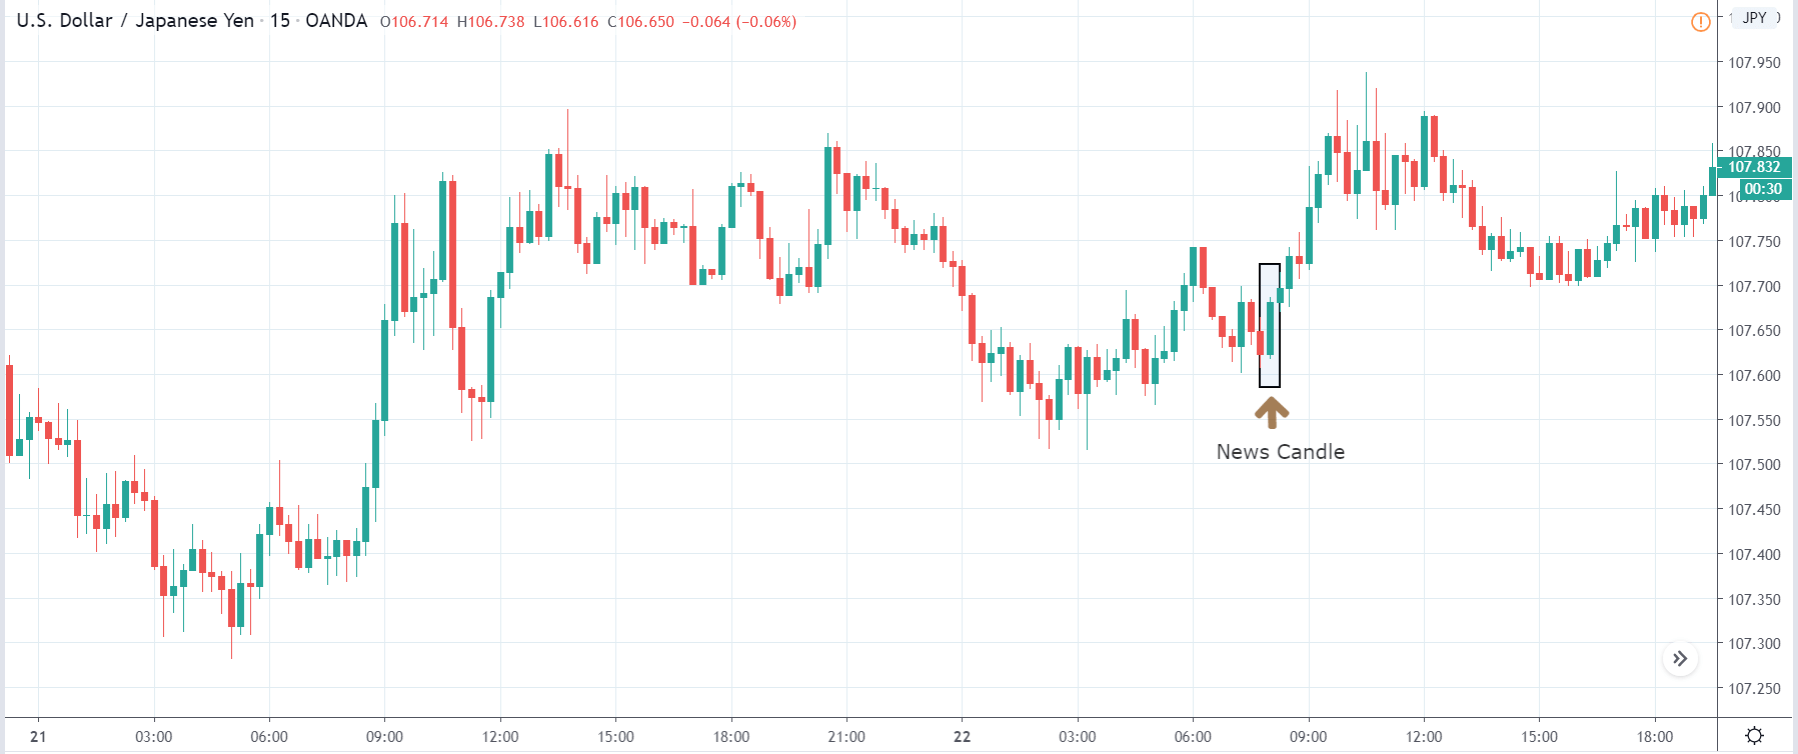
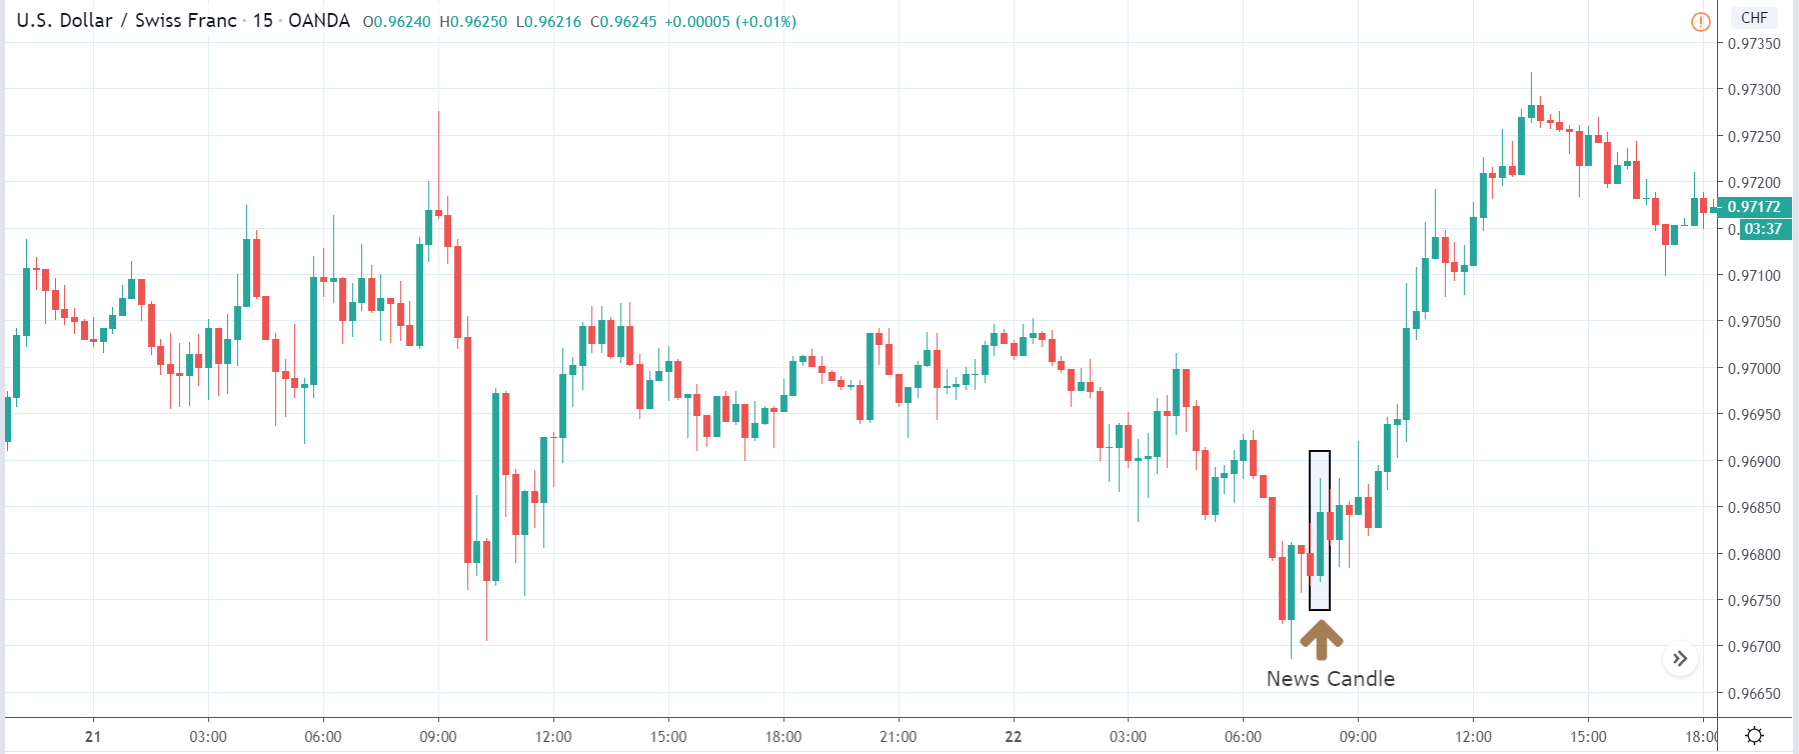
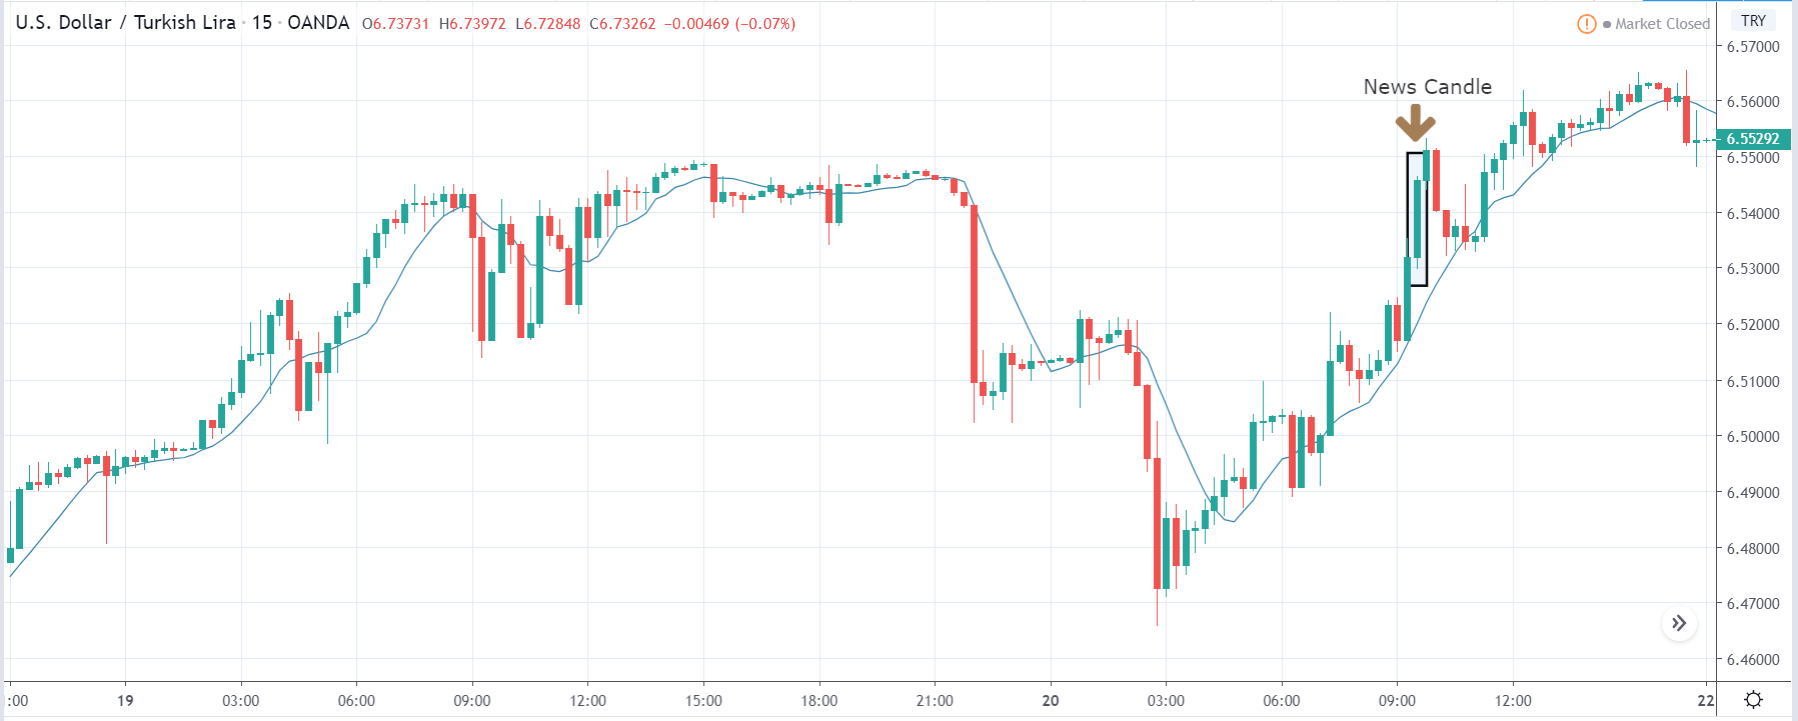
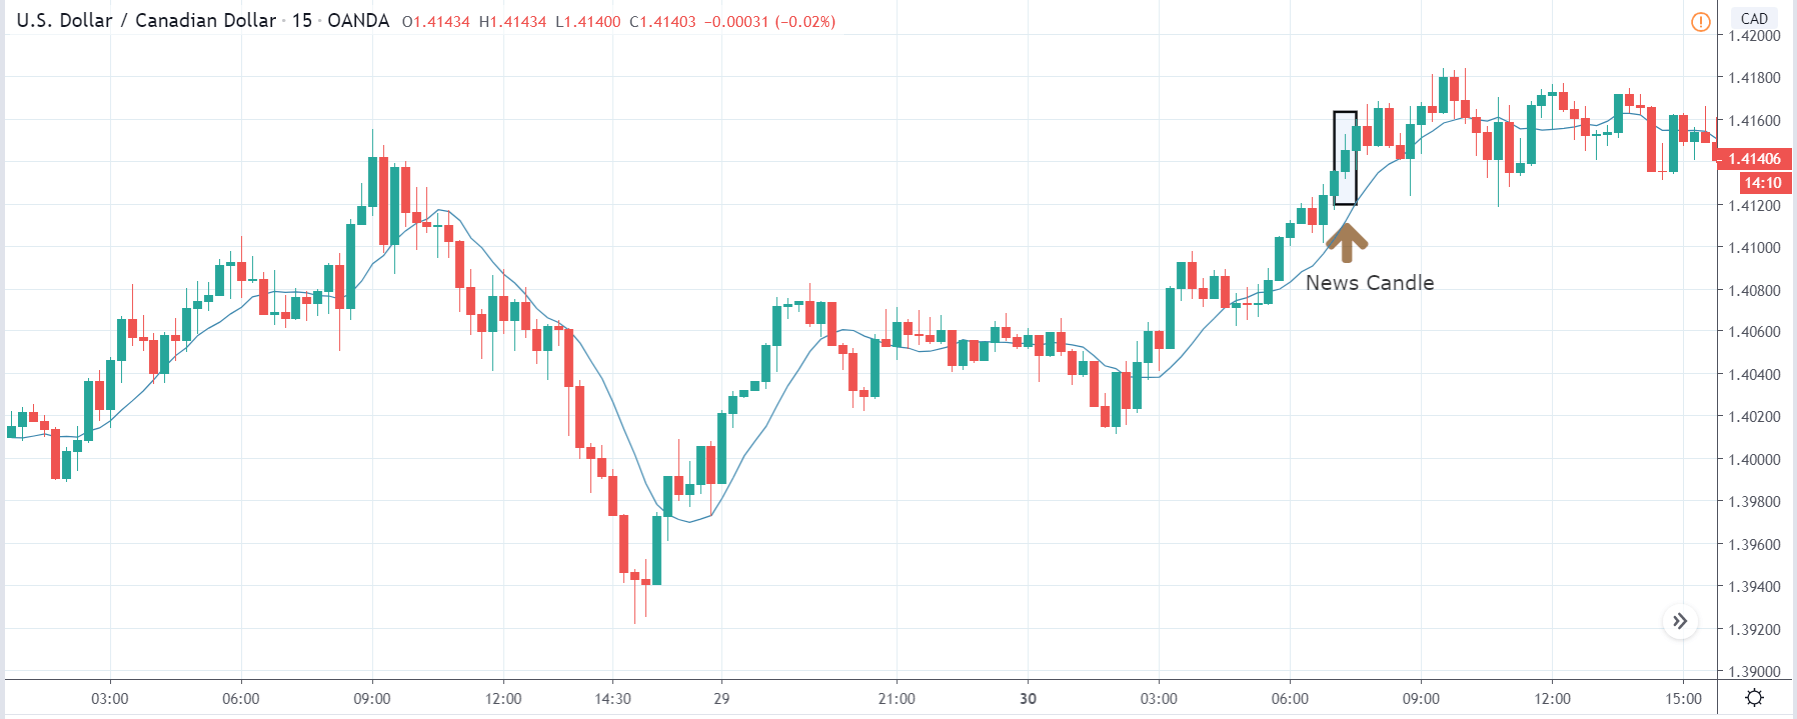
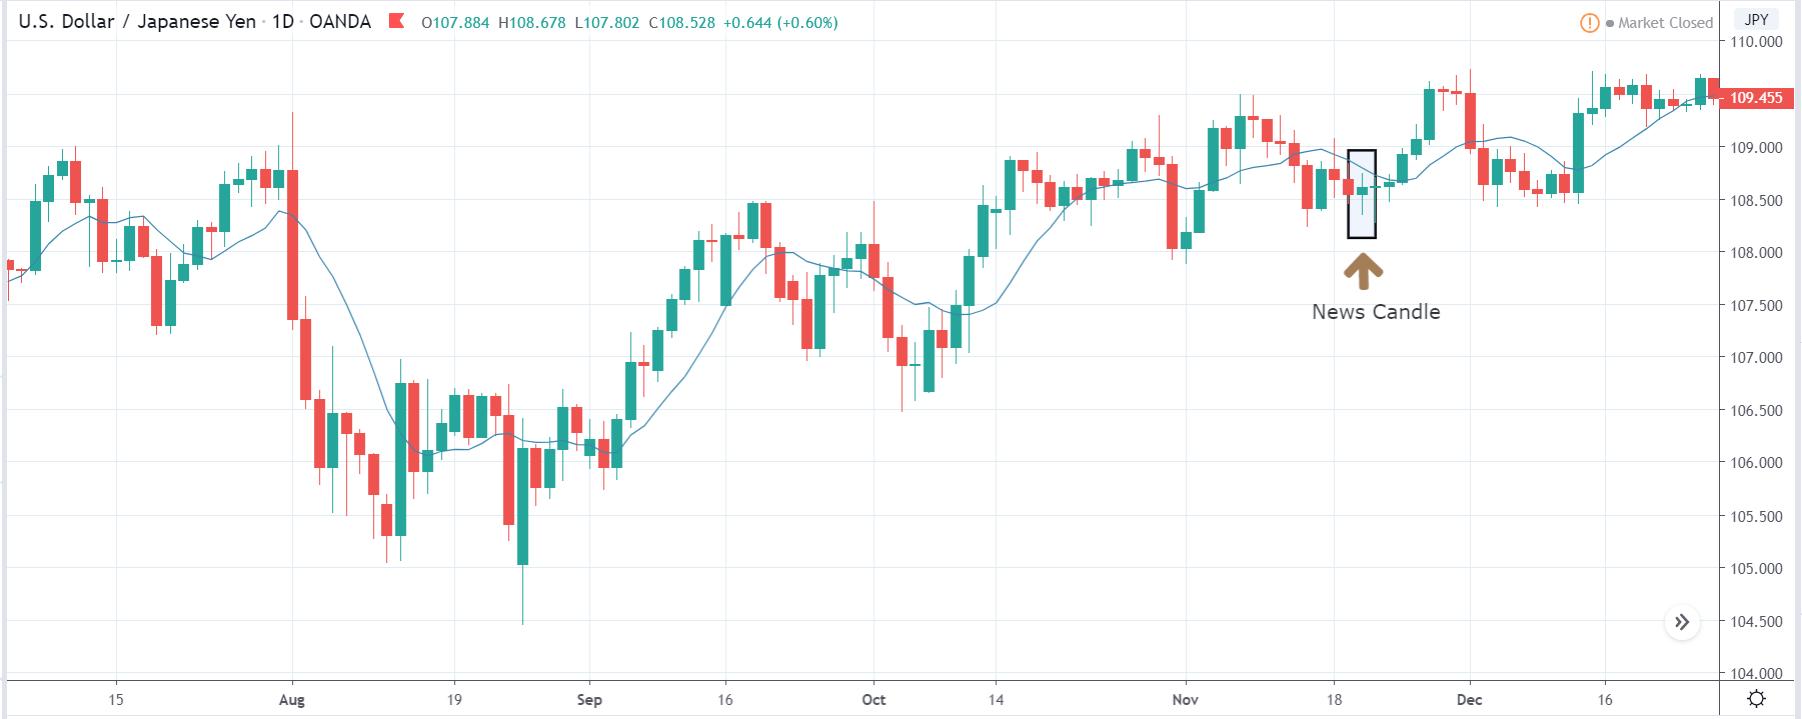
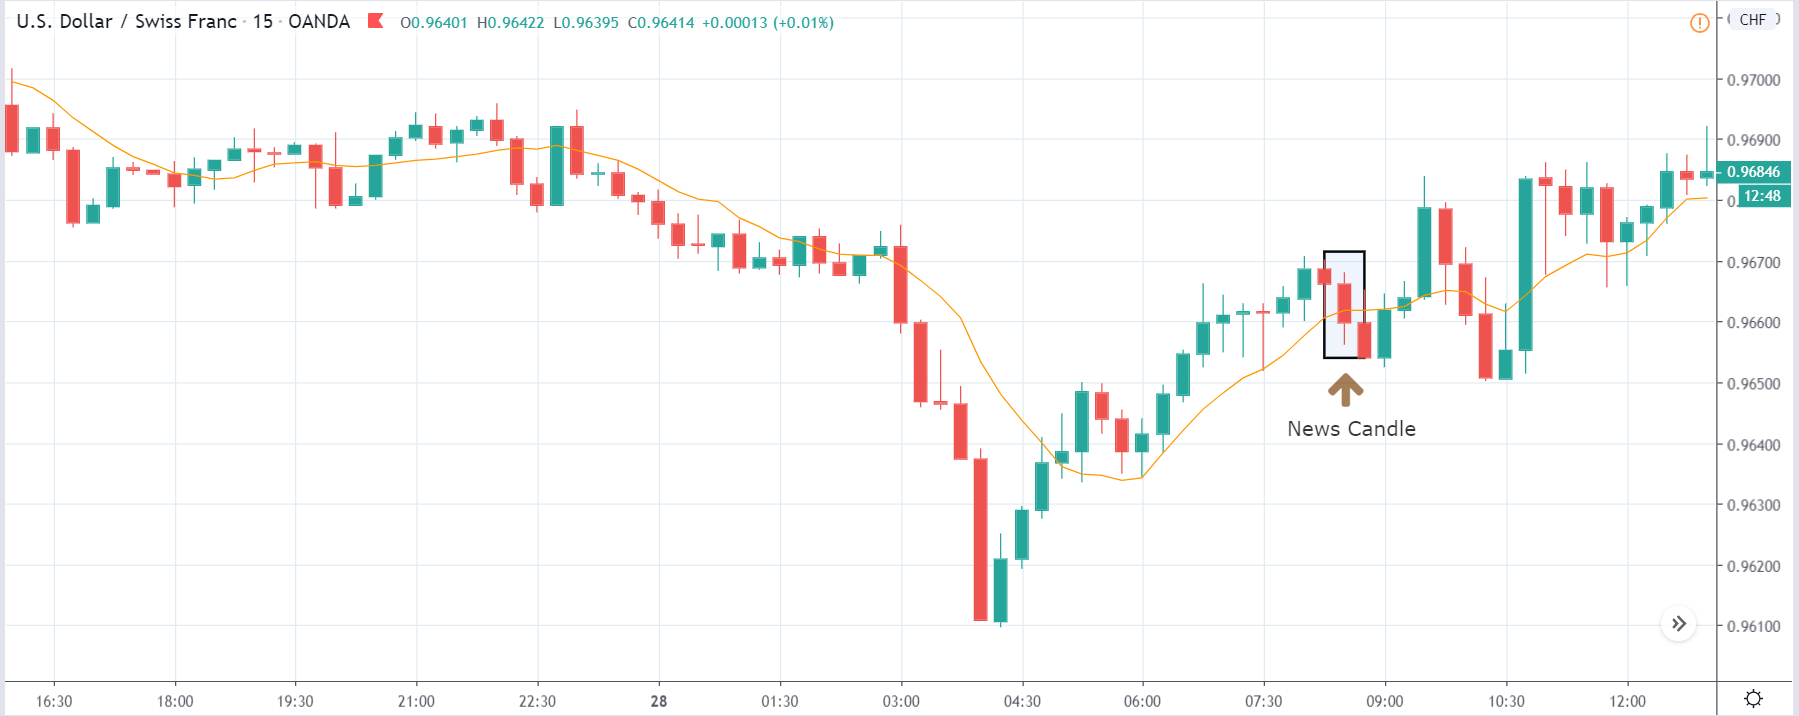
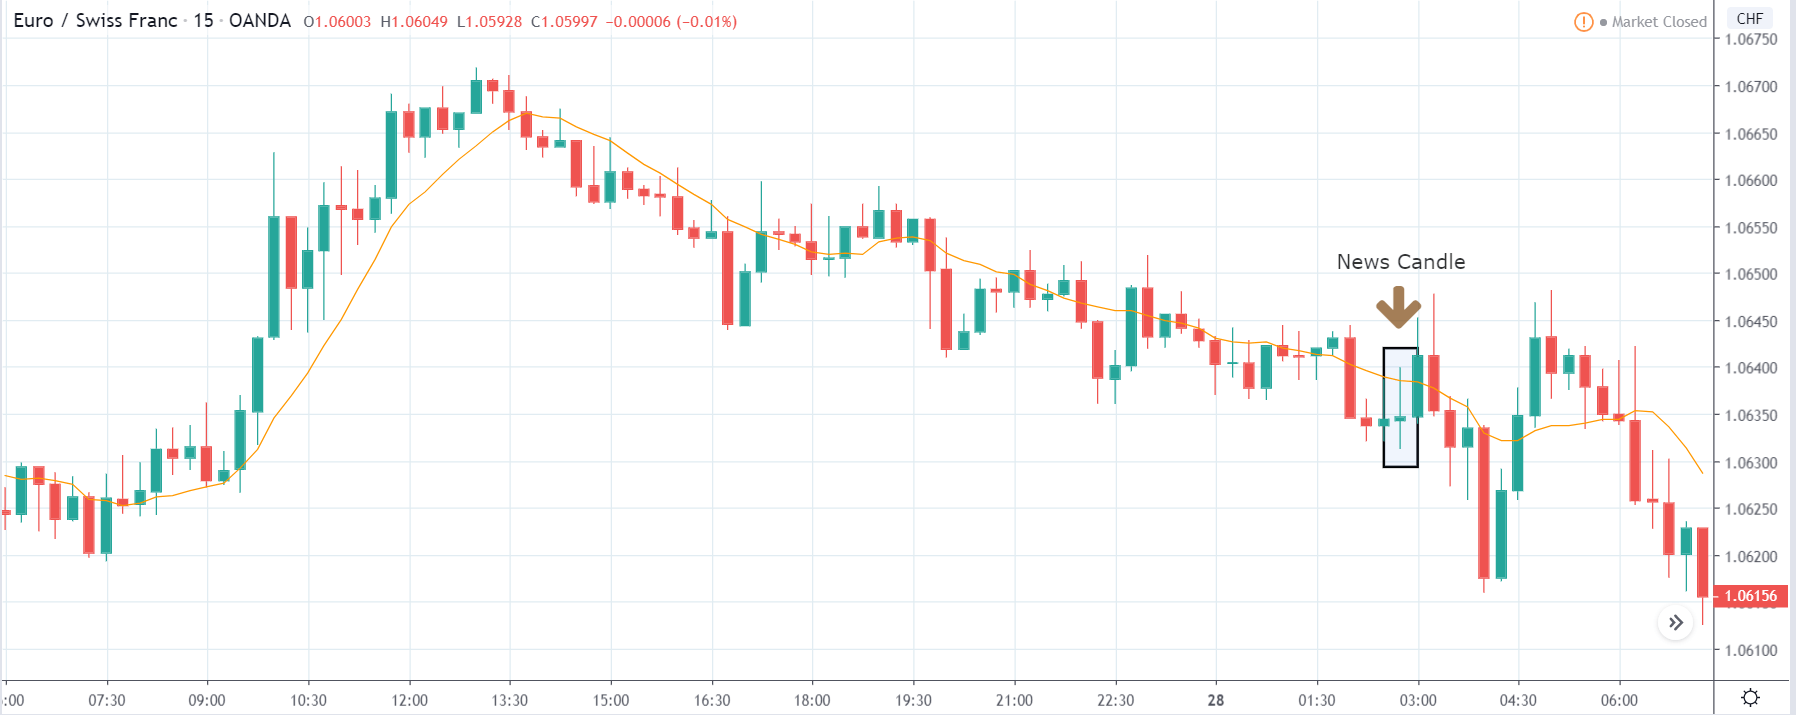
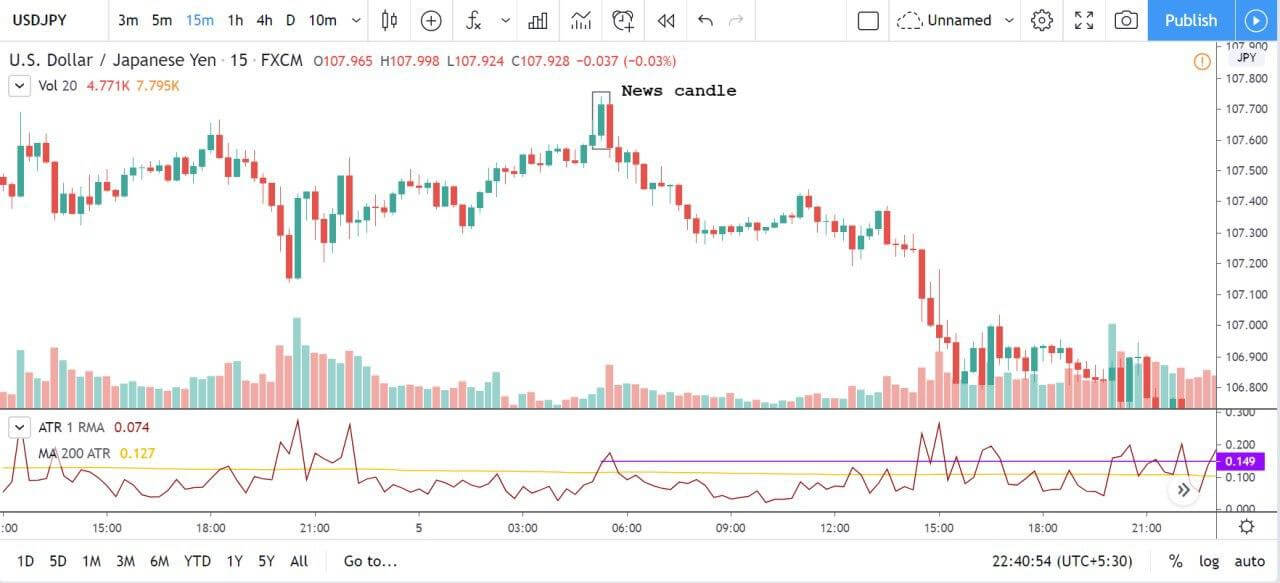
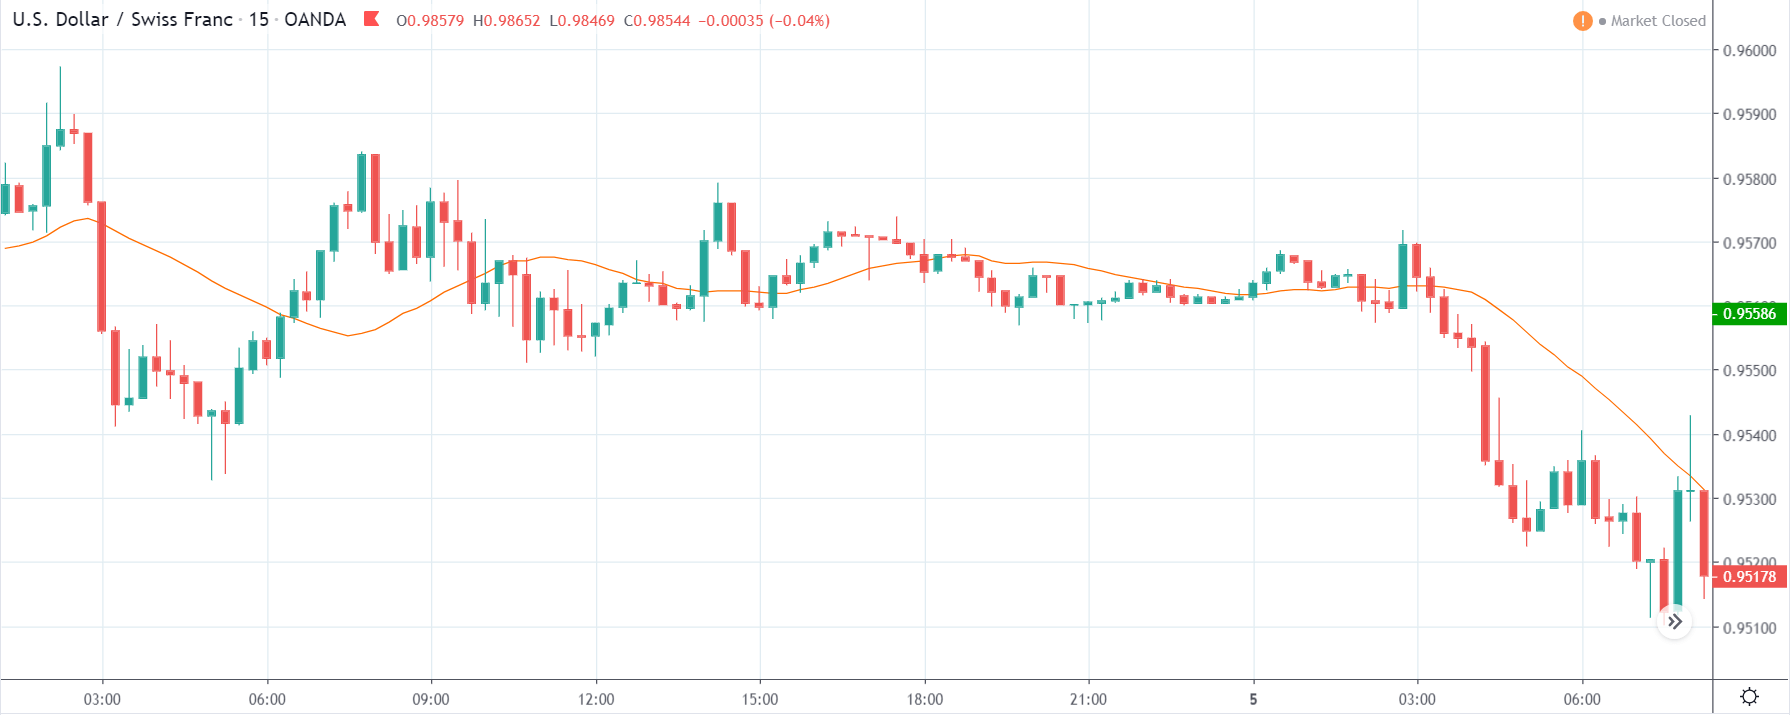
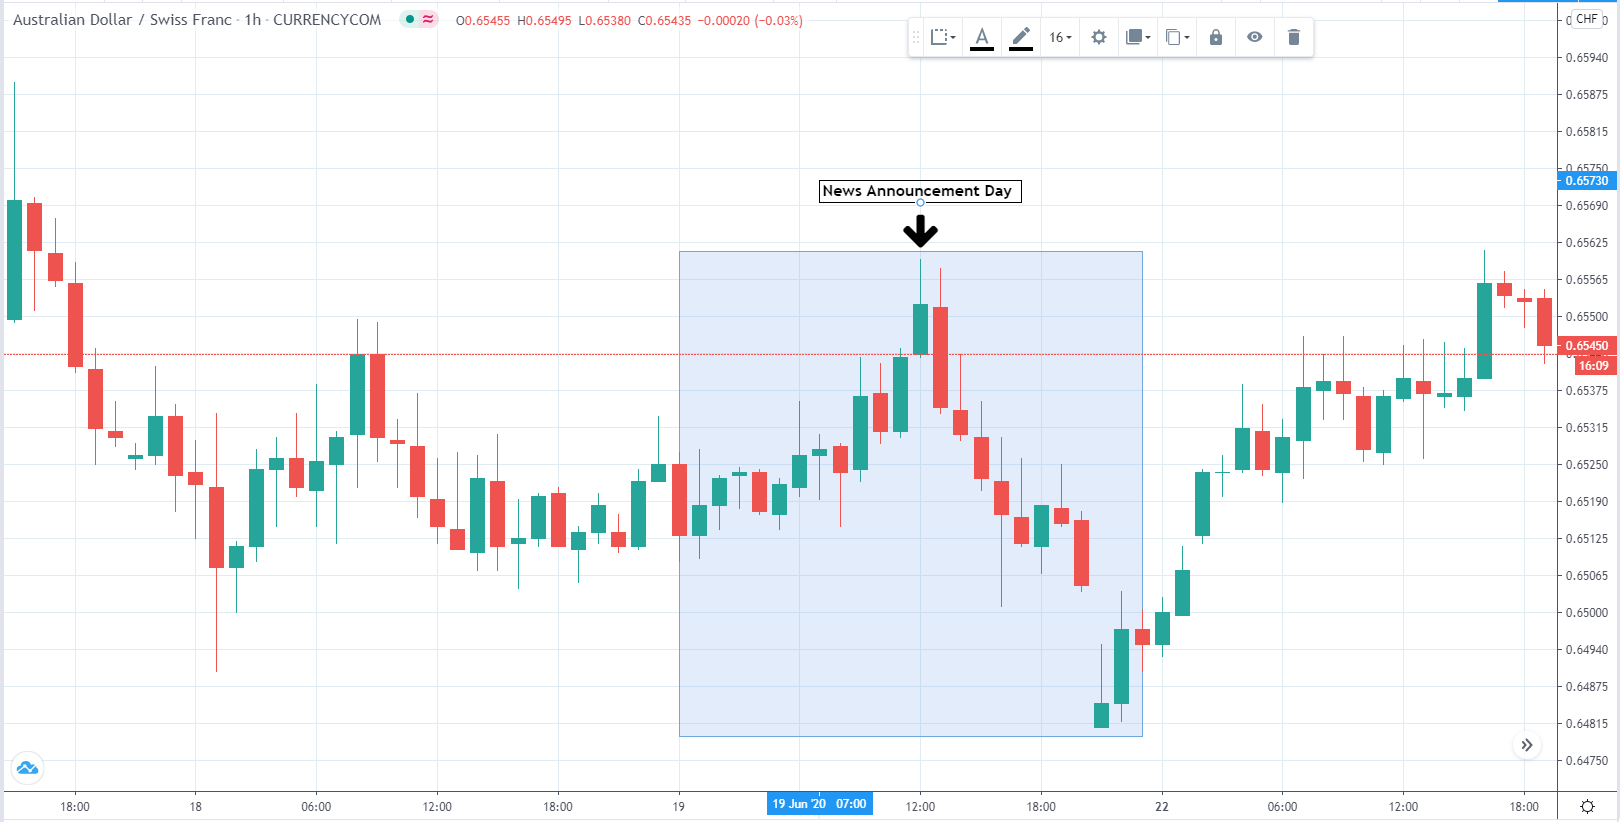
USDCHF – After the Announcement
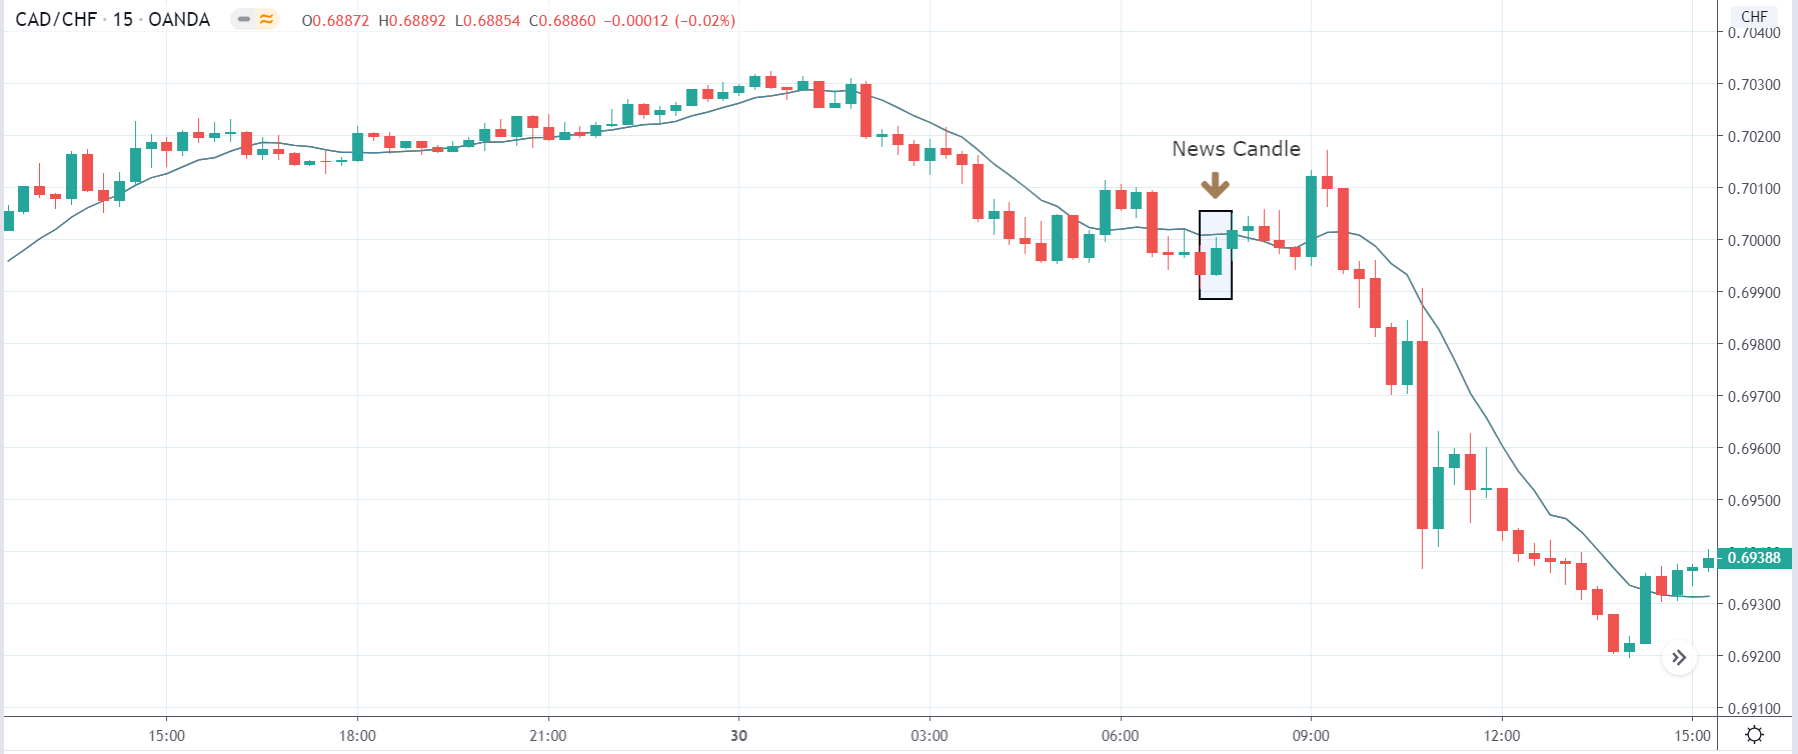
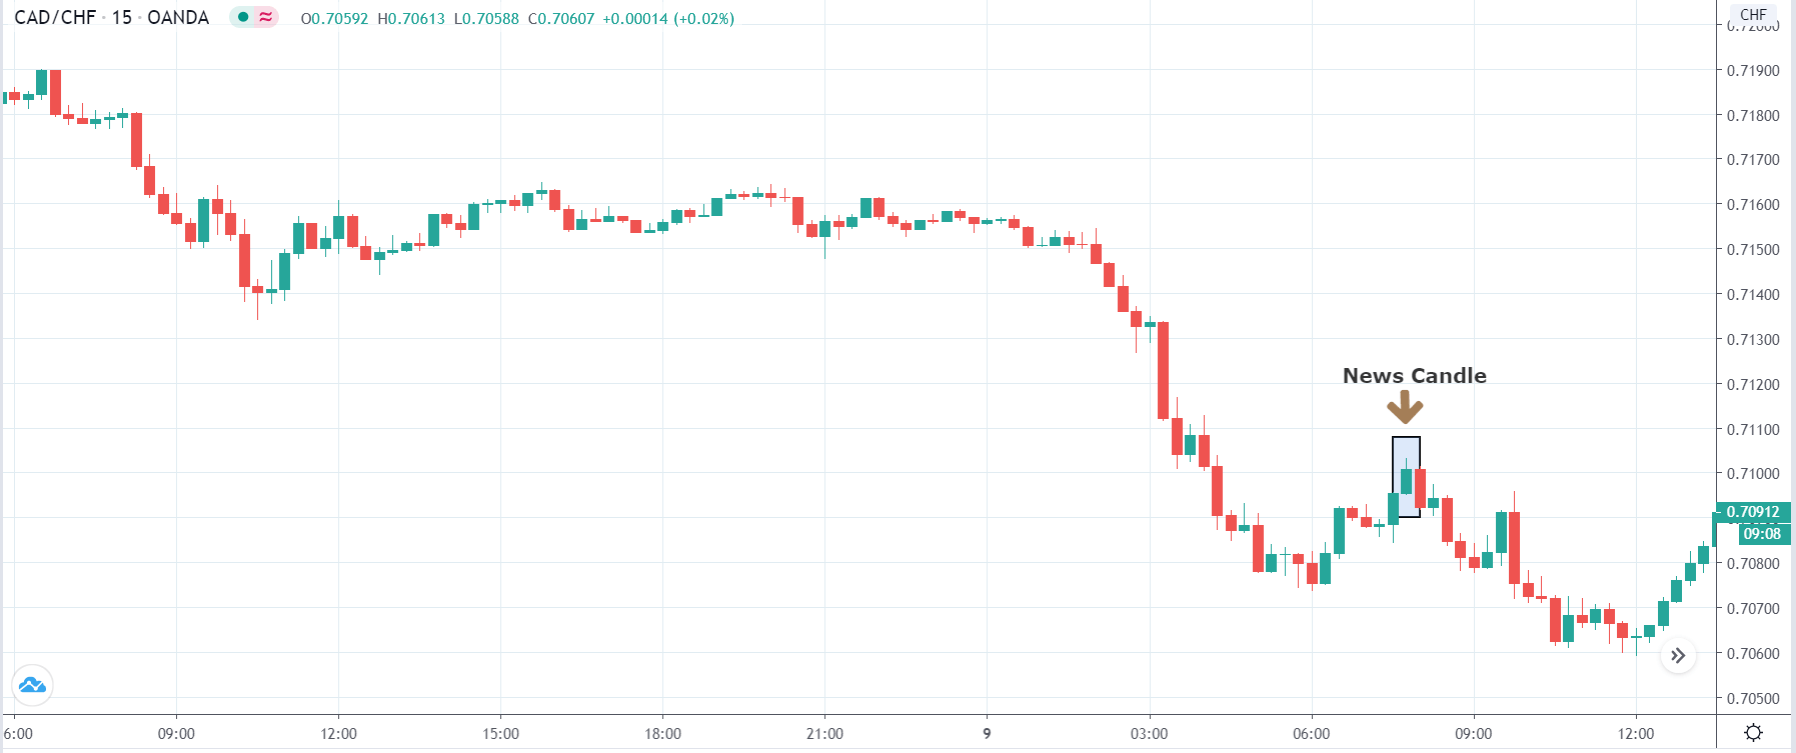
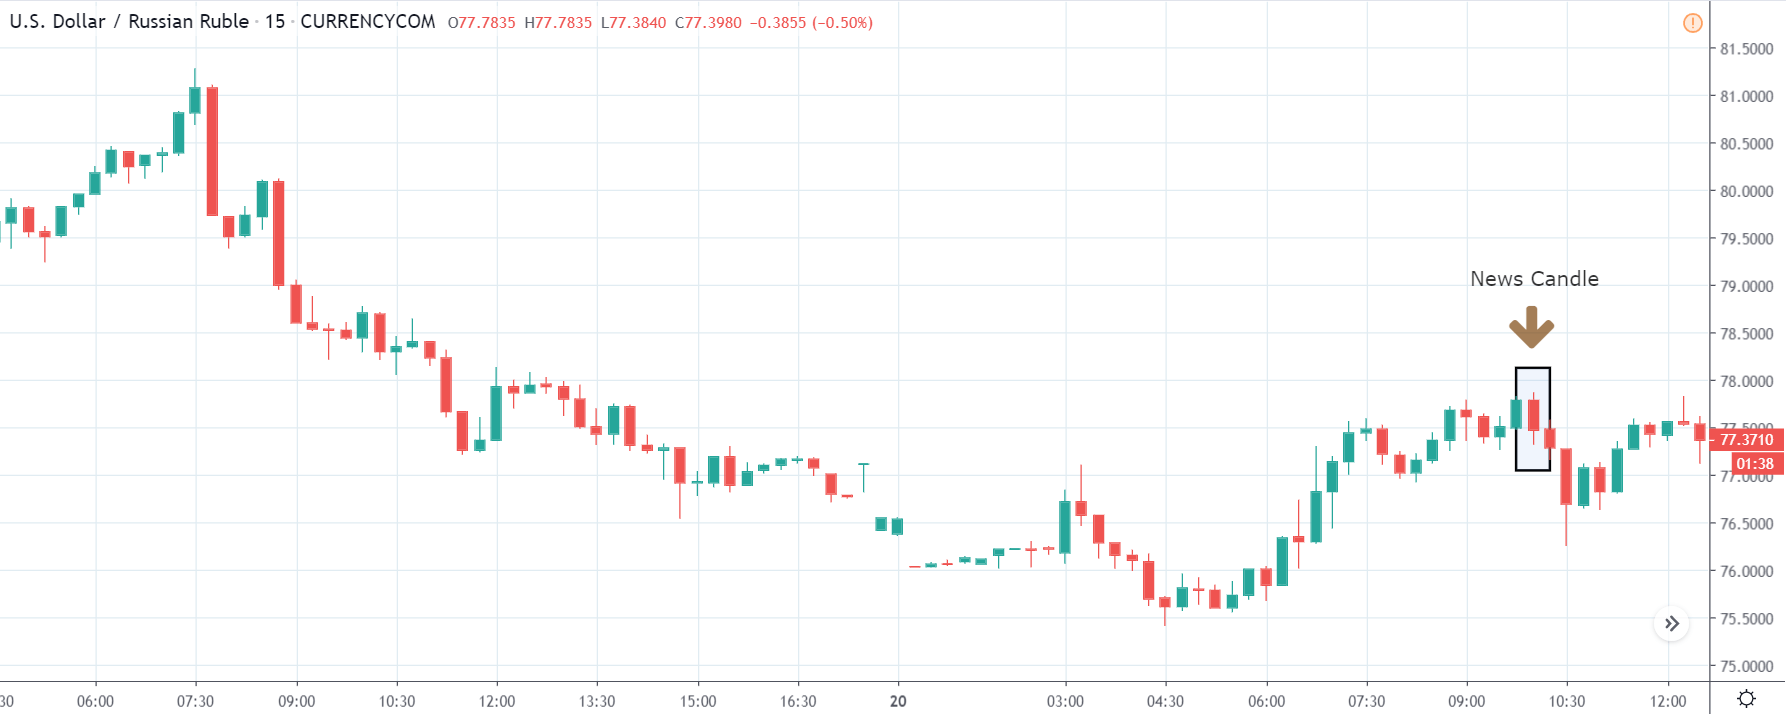
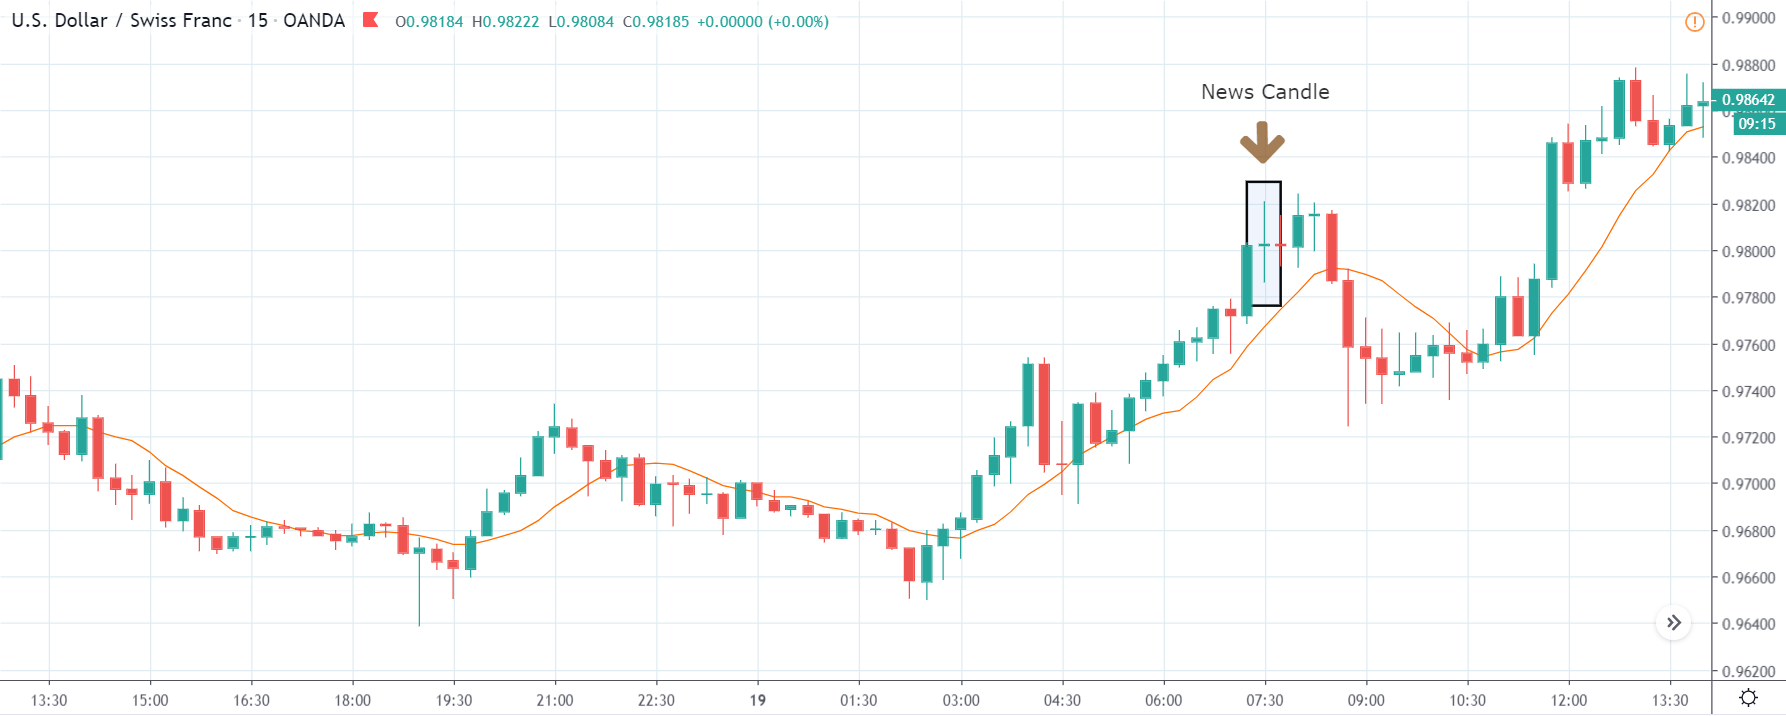
On the announcement day, the volatility of the market was feeble. The price pushed to the downside but with low volume that is typically seen during the announcement of major news events.

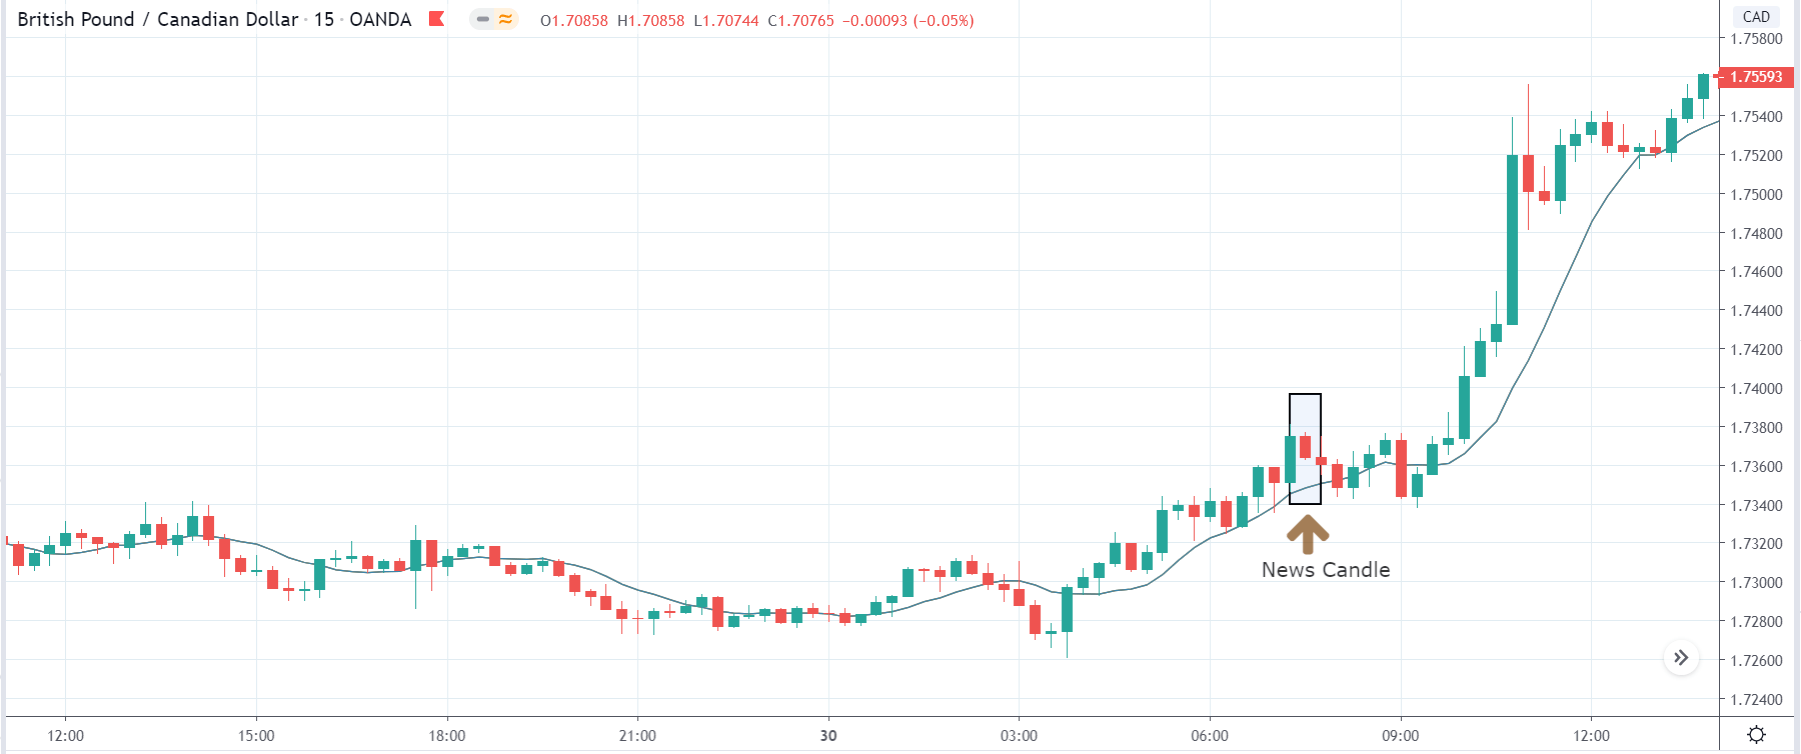
In the following trading days, the predominant downtrend continued where the price made a new low from 0.93828. This down move could be due to several factors; however, there could be a slight effect on the Imports by Country report. Cheers!


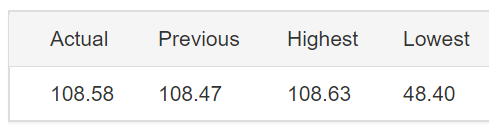


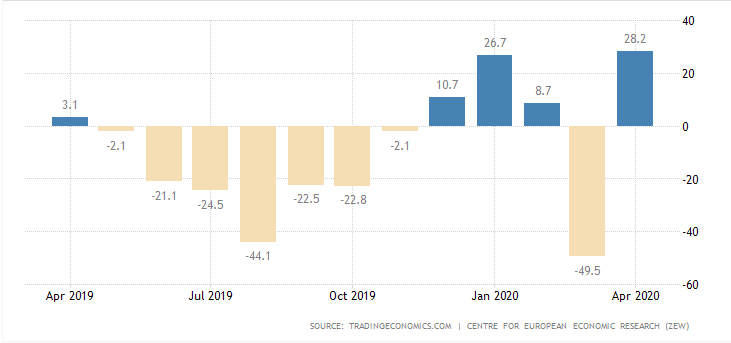
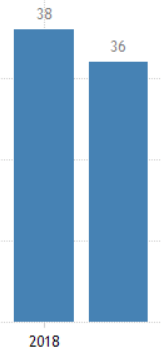
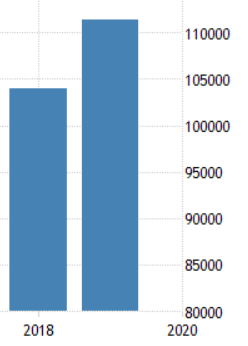
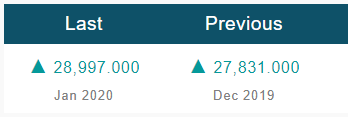
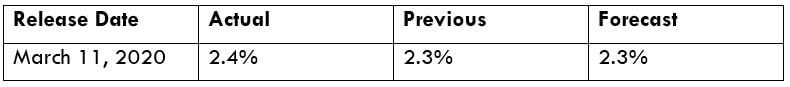
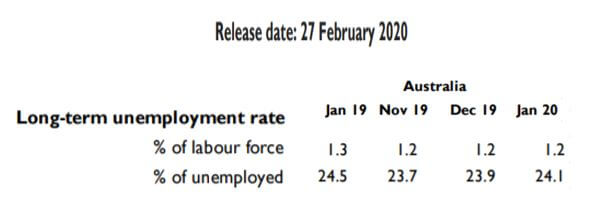
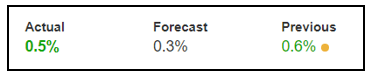
 The below image shows that the weekly wages were increased for Australian employees in 2020. Although the difference is not huge, it still is a positive step taken for the daily wage workers. Looking at the data, we should not expect significant volatility in the currency pairs during the announcement.
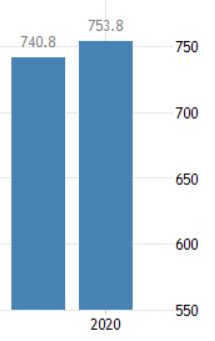


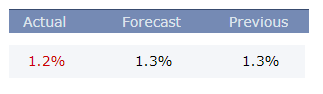


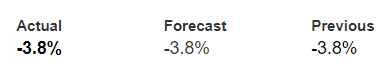


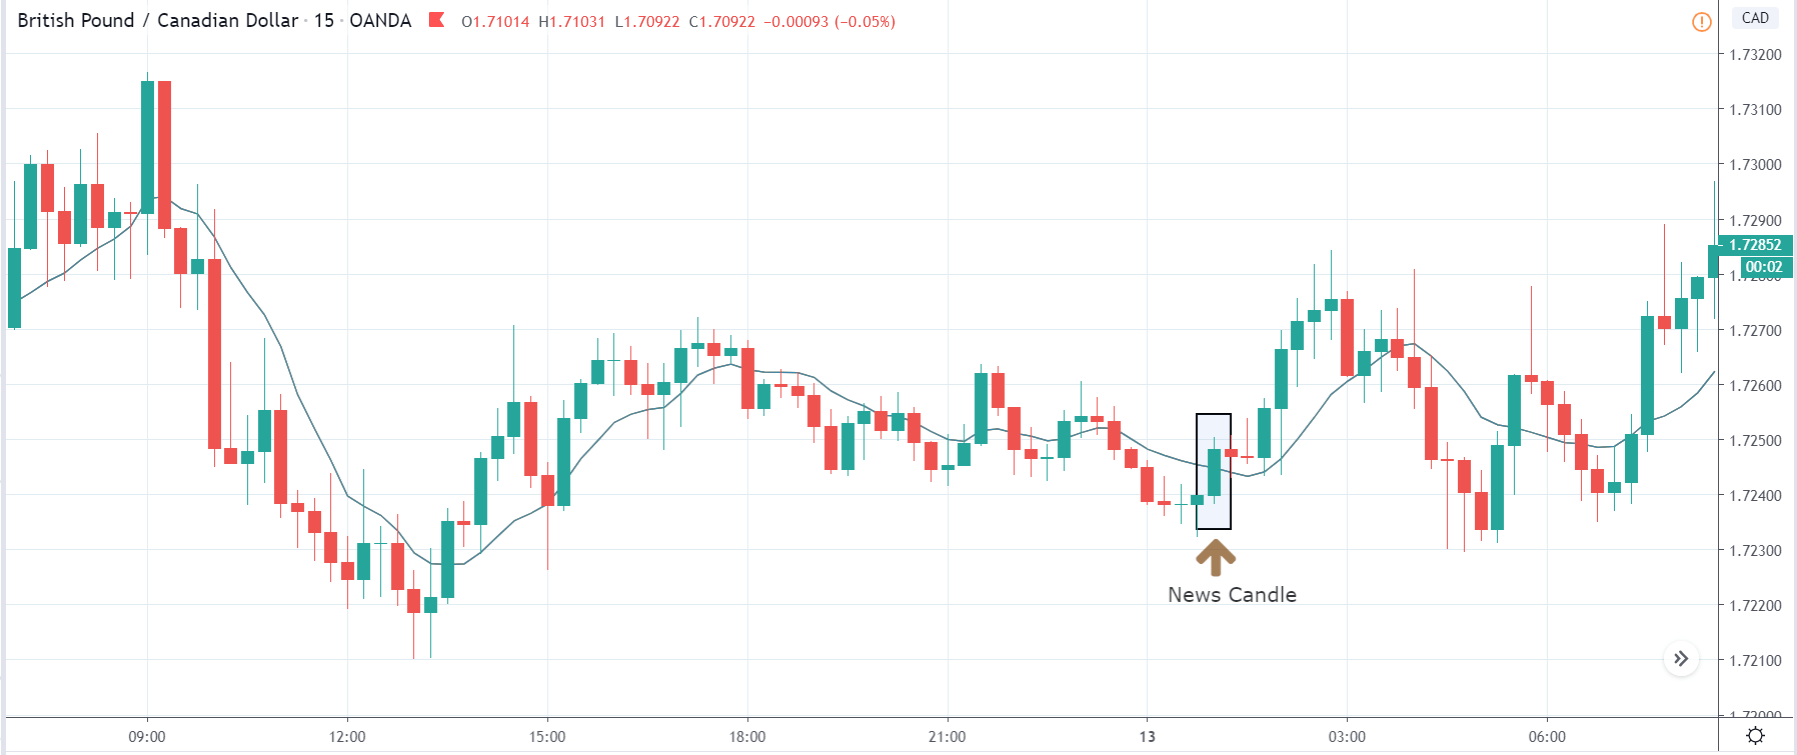

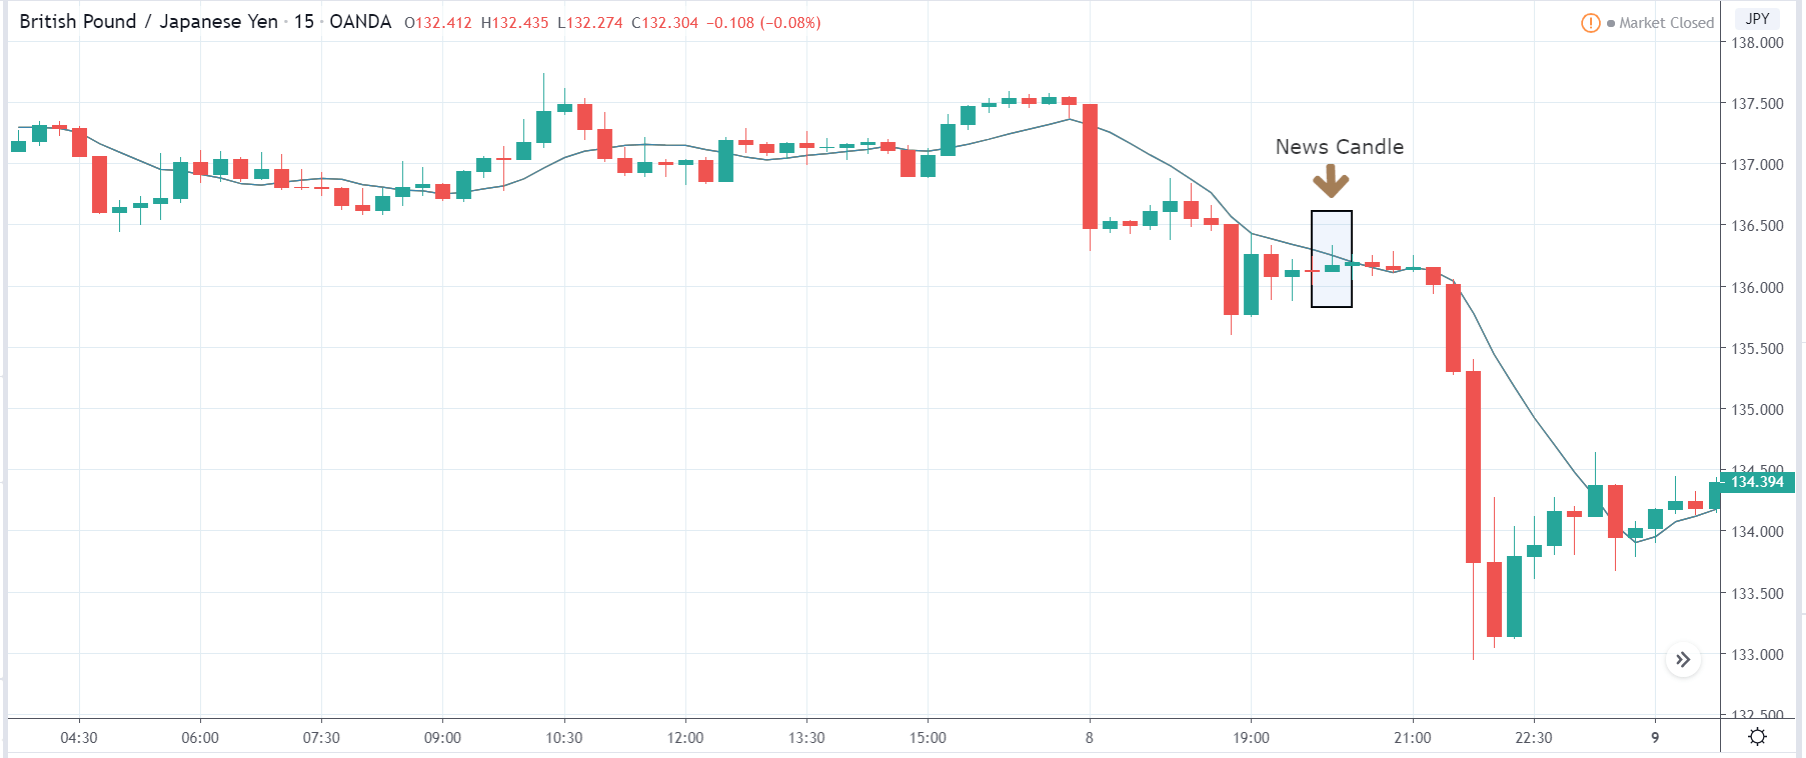

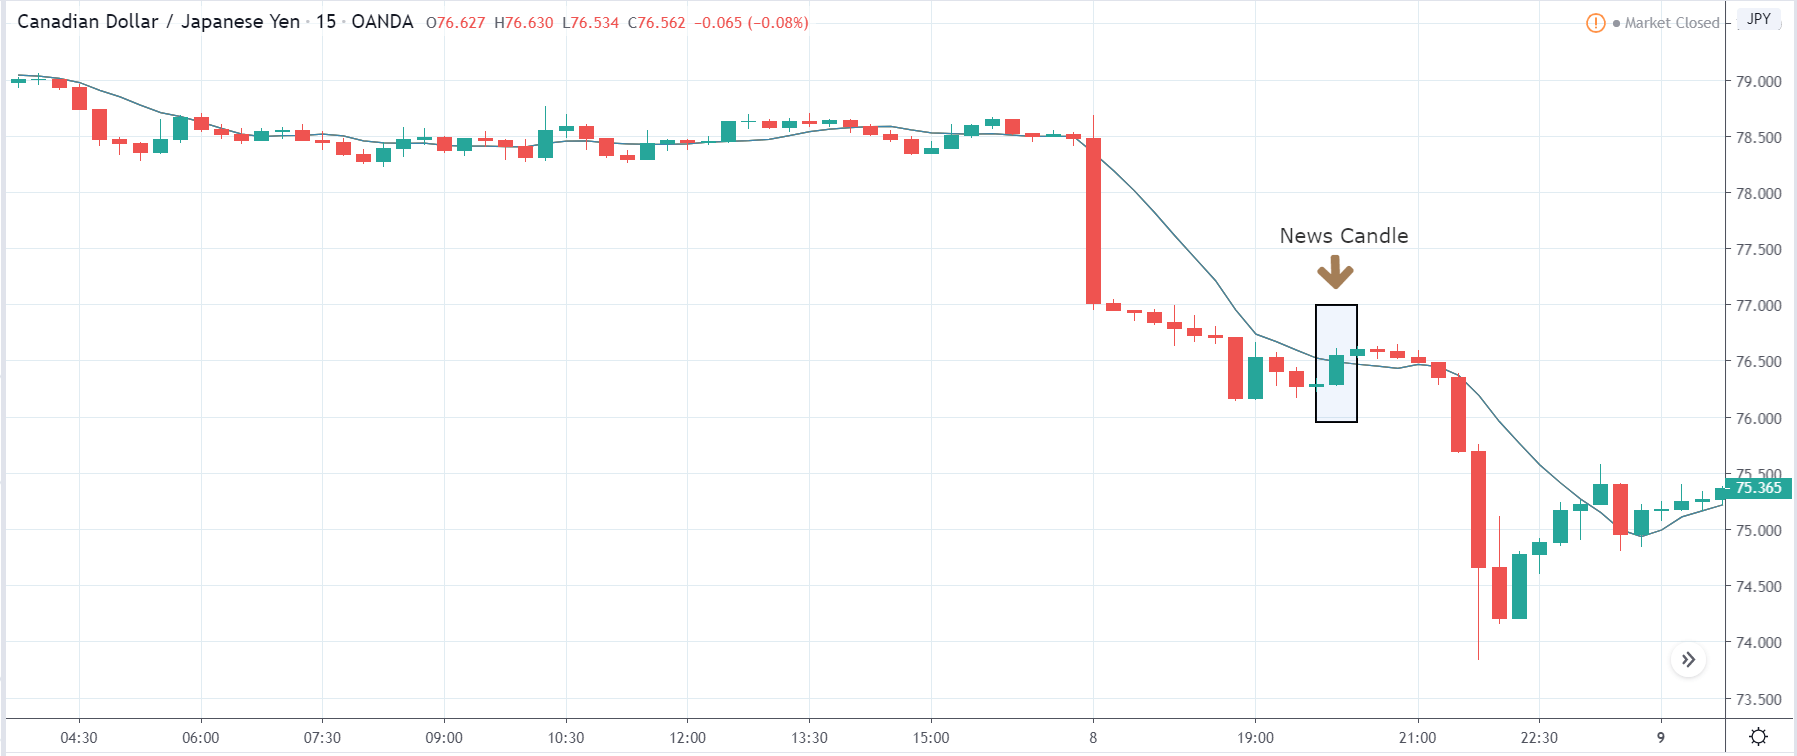


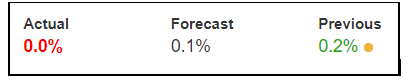
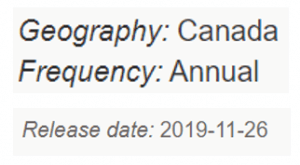
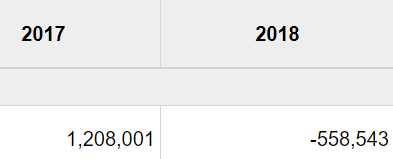
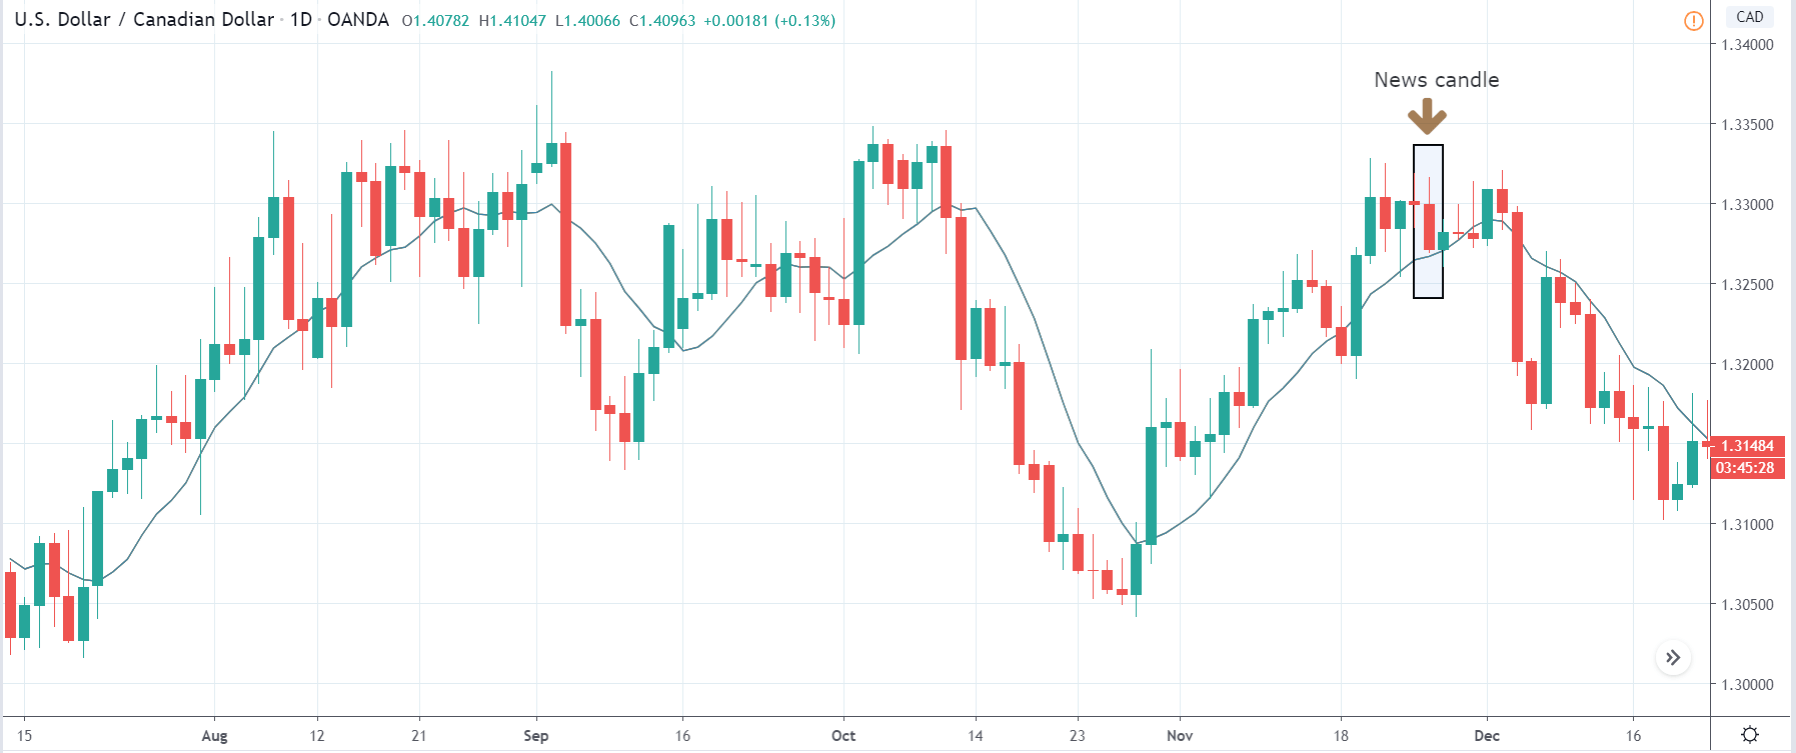
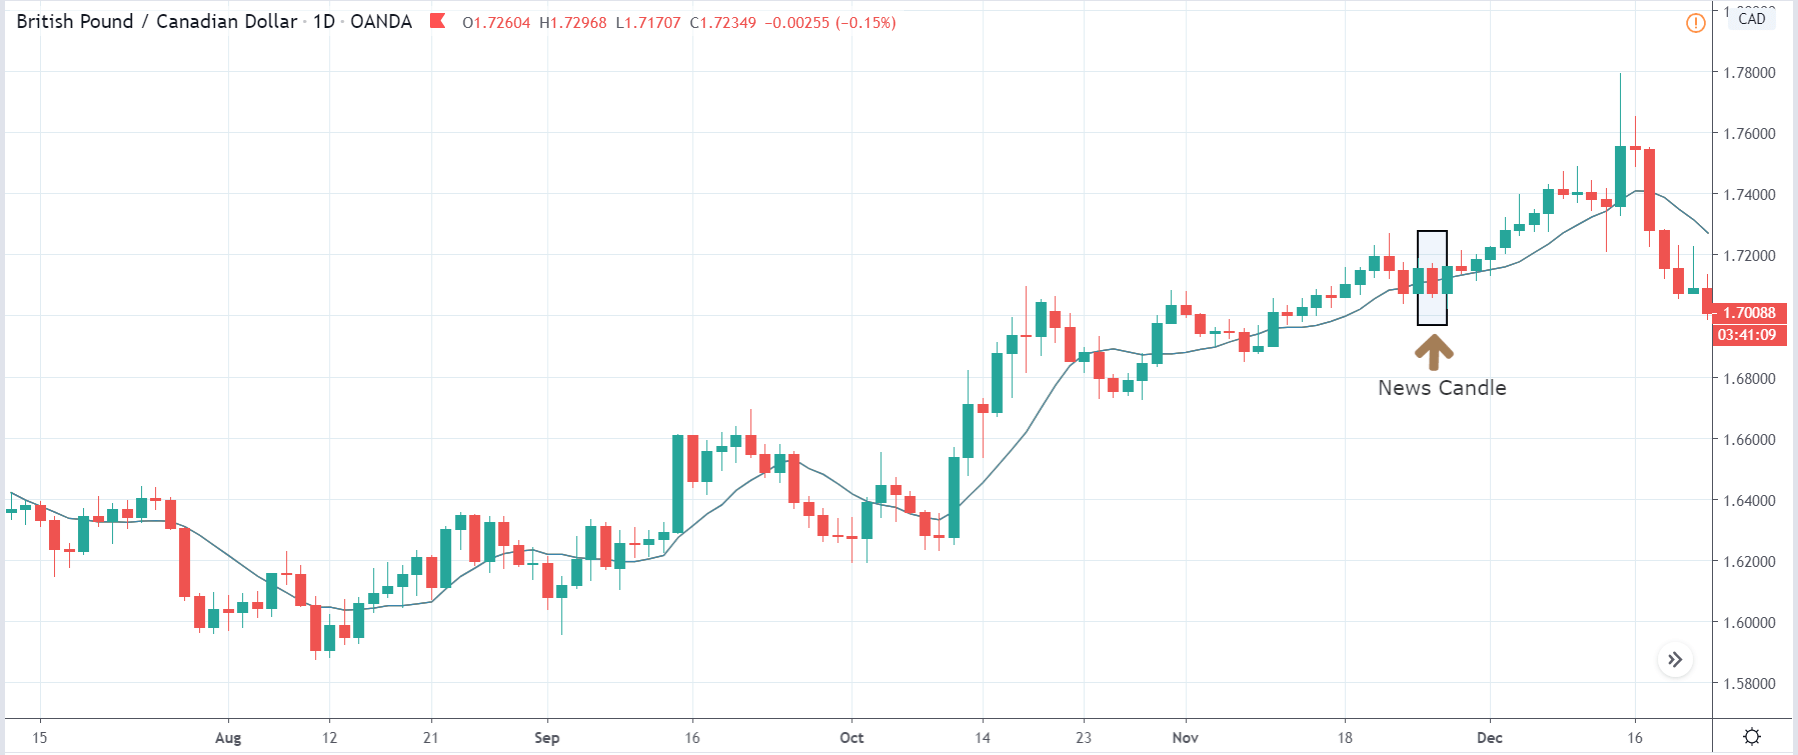
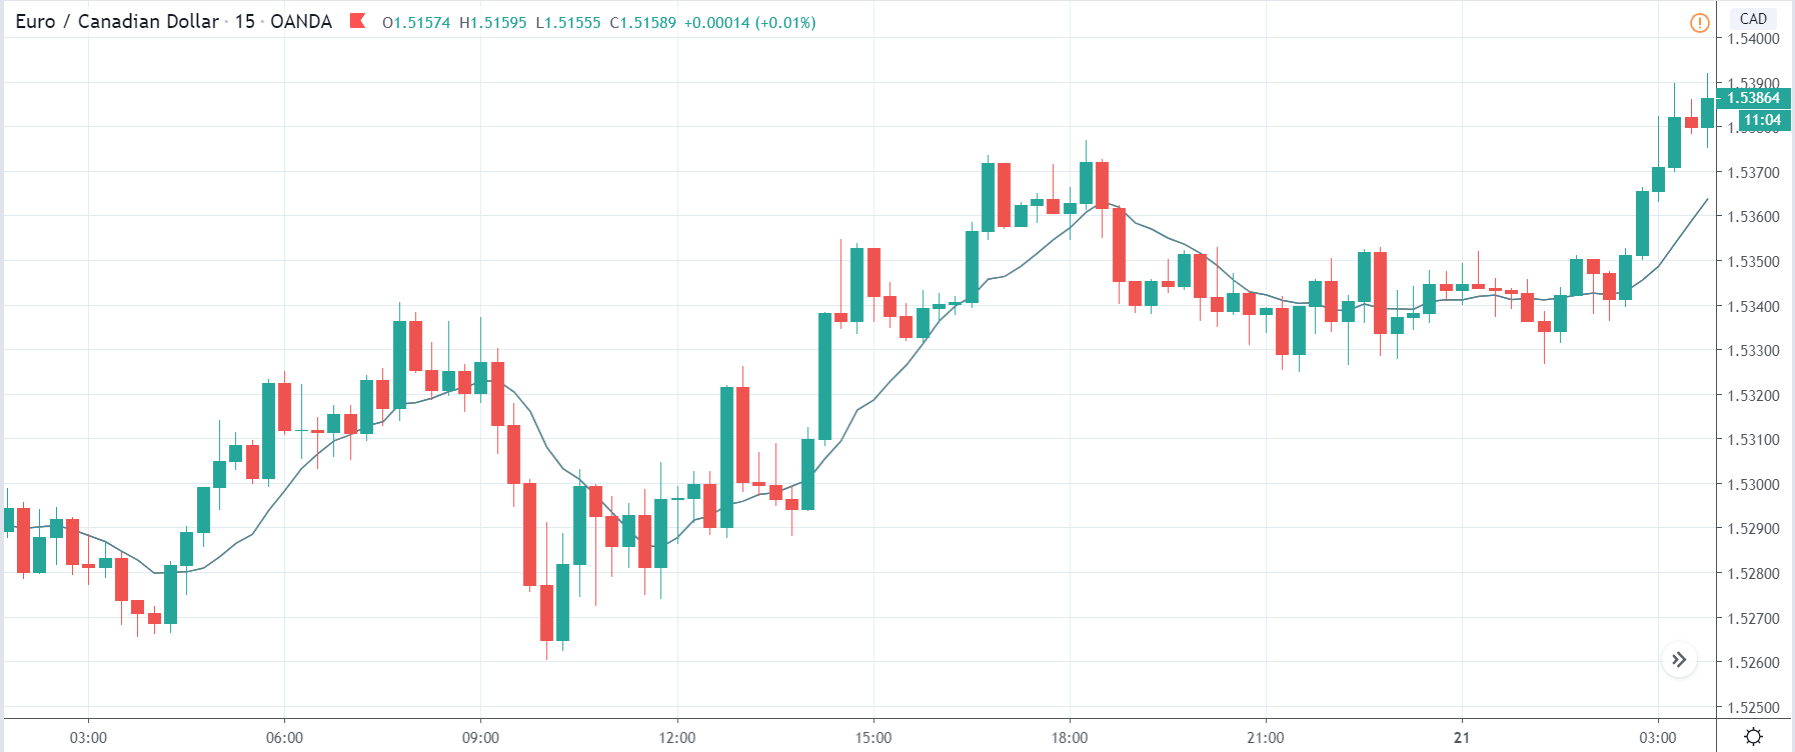
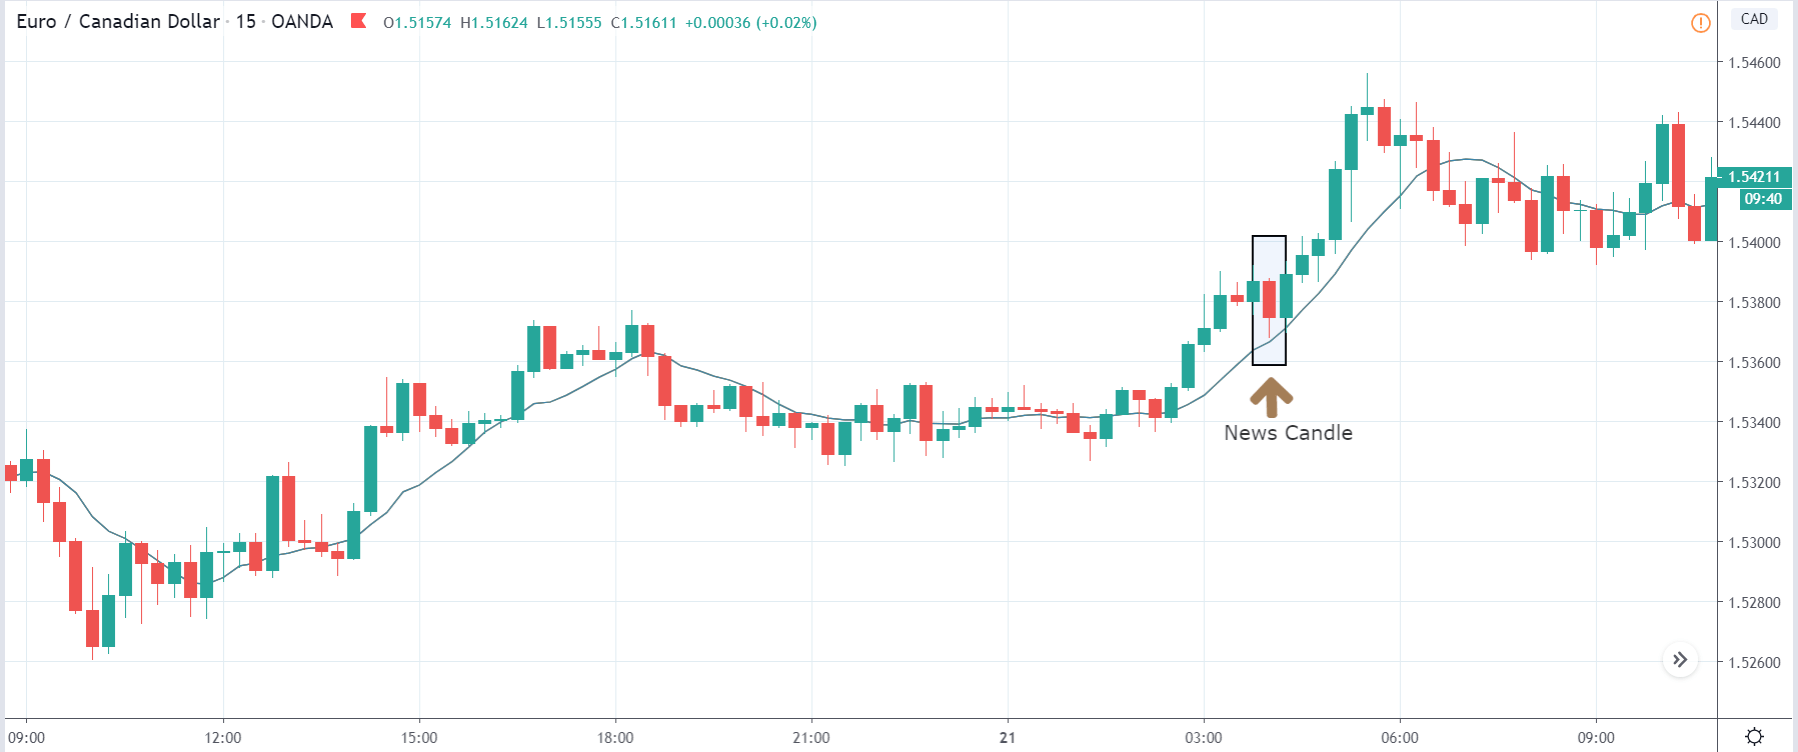
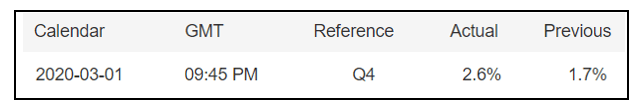
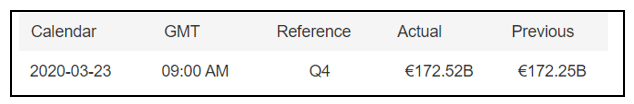
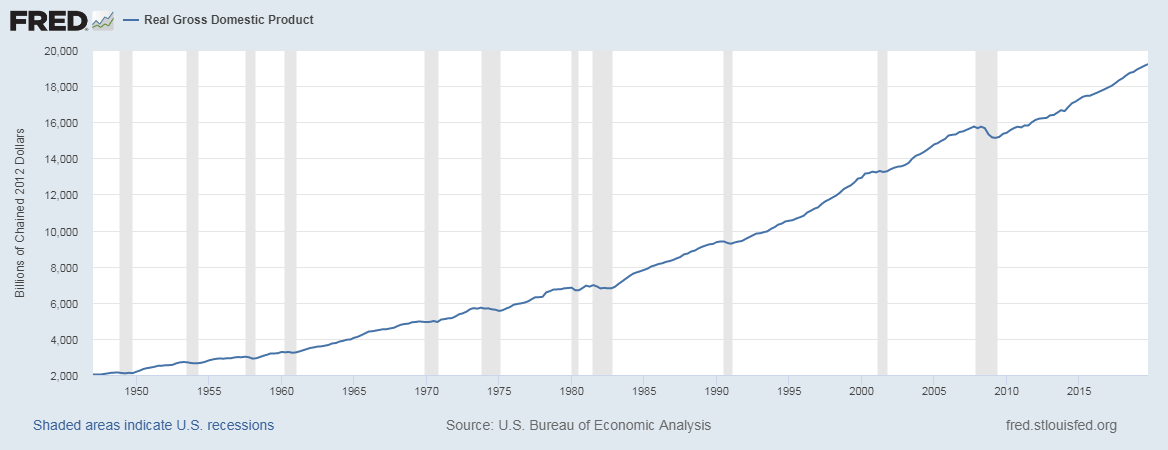
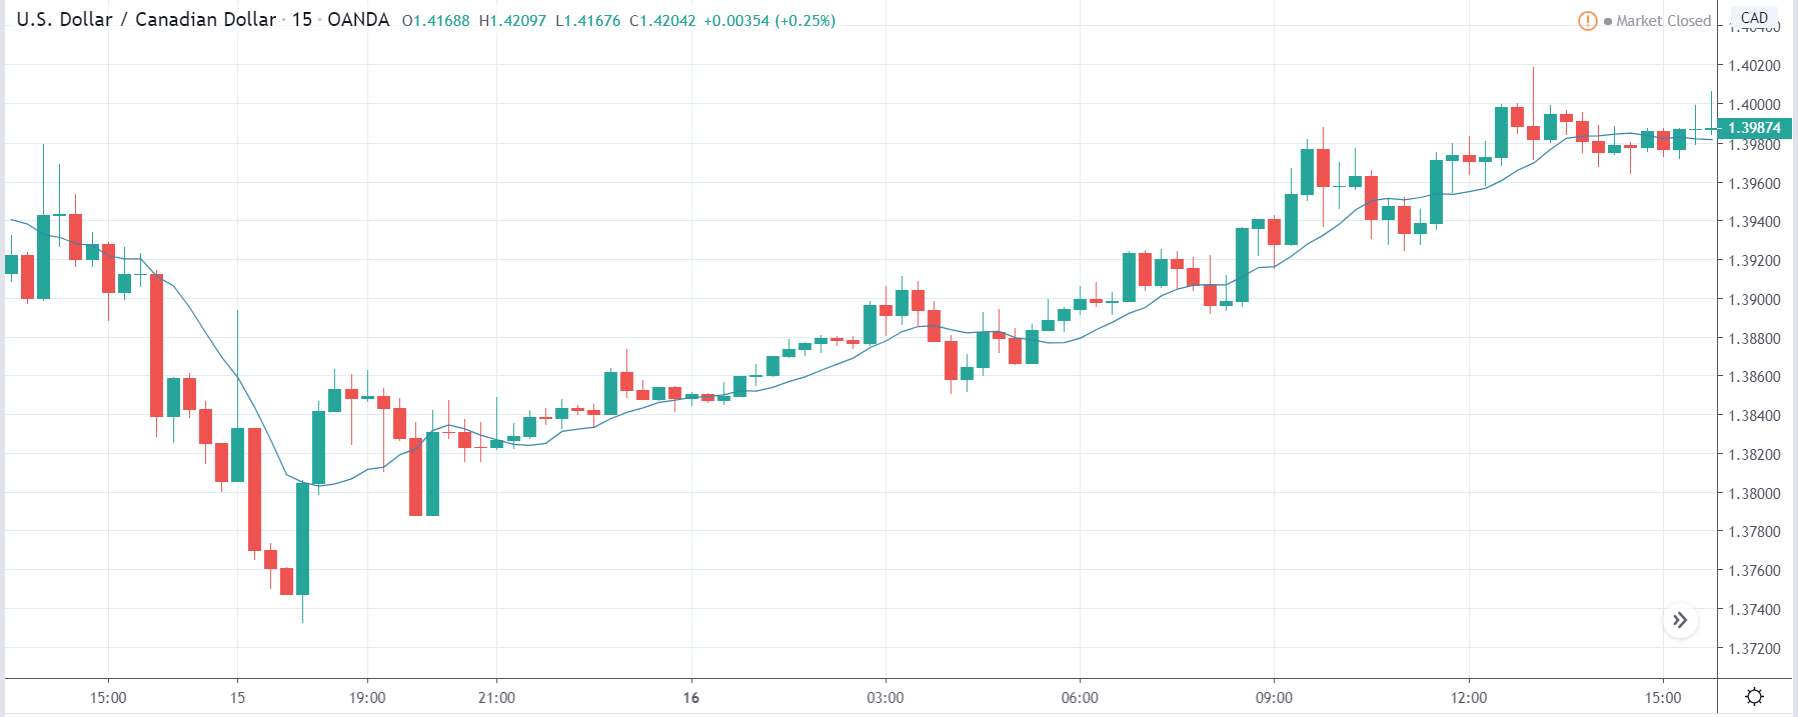
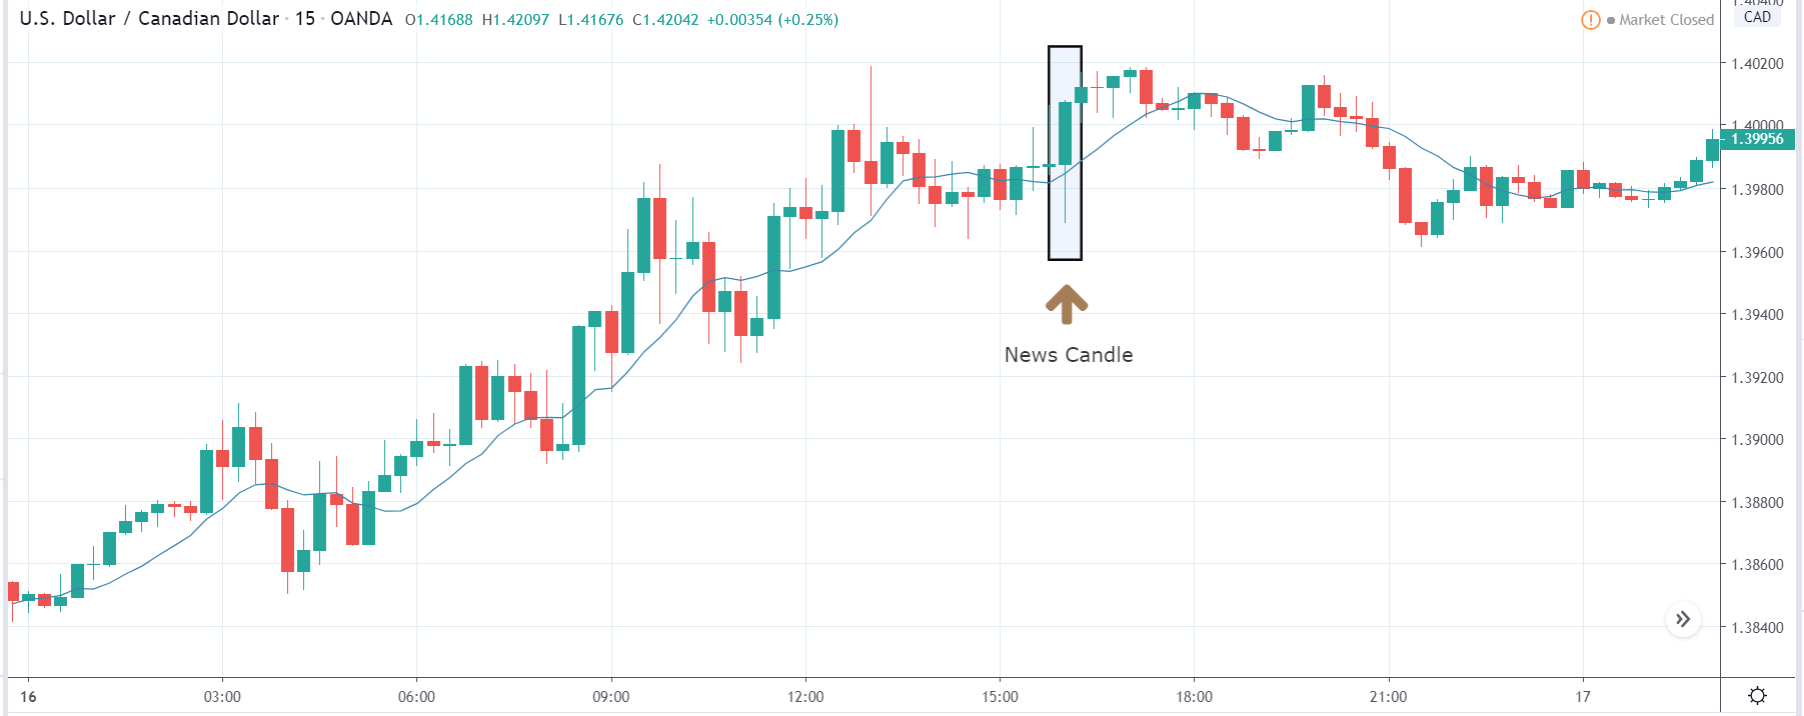
 In today’s lesson, we will analyze the impact of GDP on various currency pairs by observing the change in volatility before and after the news announcement. For that purpose, we have collected the GDP data of Canada, where the below image shows the month-on-month GDP data released recently. Let us find out the market’s reaction to this data.