On Friday, the U.S. dollar trades bearish after the U.S. dollar slid to a nearly eight-week low in the prior session, keeping gold prices underpinned.
European Union leaders collectively supported a new Brexit agreement with Britain on Thursday. The British Prime Minister Boris Johnson is facing a battle to ensure the U.K. parliament’s support for the deal if he is to get Britain outside of Europe on October 31.
The risk sentiment improved yesterday due to the announcement of the United Kingdom and the European Union that they looked the Brexit deal. Still, the Brexit deal concerns continued to increase because the markets are worrying about the United Kingdom Prime Minister Boris Johnson’s probabilities of getting the approval for the Brexit deal by the U.K. parliament.
Economic Events to Watch Today
Let’s took at these fundamentals.
XAU/USD– Daily Analysis
The safe-haven-metal prices dropped despite the weak China GDP data, and the drop came at the prices due to the markets were digesting headlines regarding Brexit and the US-China trade war.
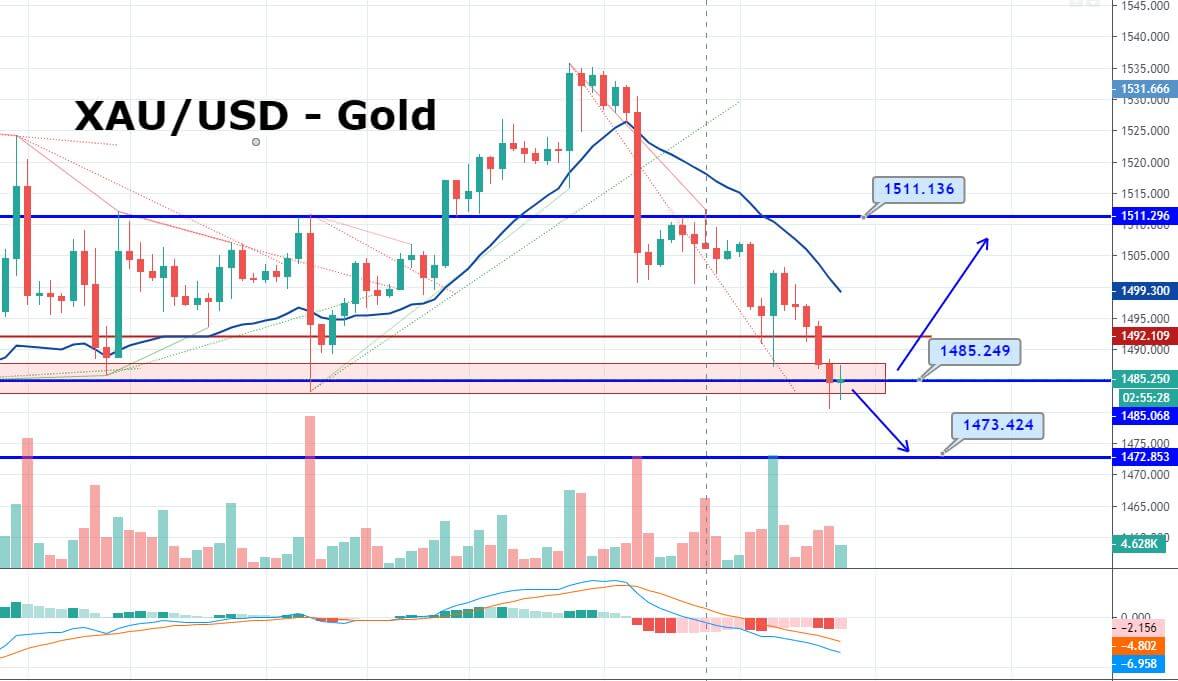
U.S. Gold Futures for December delivery dropped 0.2% to $1,494.95 per ounce by 1:05 AM ET (05:05 GMT).
The risk sentiment improved yesterday due to the announcement of the United Kingdom and the European Union that they looked the Brexit deal. Still, the Brexit deal concerns continued to increase because the markets are worrying about the United Kingdom Prime Minister Boris Johnson’s probabilities of getting the approval for the Brexit deal by the U.K. parliament.
Moreover, China’s 3rd-quarter GDP rose slower than expected. Chinese stocks dropped after the release of the data, but the safe-haven gold didn’t get any benefit from this.
Continuing trade tussle with the U.S. will keep under the eyes. Therefore, China said on Thursday that it believed to be in the last phase of the trade agreement with the United States. At the same time, China gave a warning that the United States has to cancel new tariffs for a full trade deal.
China’s Ministry of Commerce spokesman Gao Feng also said that we expect that both nations can continue to work together to more progress in discussions. As soon as possible, we will reach on a phased deal as well and make new progress with the help of canceling tariffs.
Daily Support and Resistance
S3 1462.89
S2 1476.9
S1 1484.38
Pivot Point 1490.91
R1 1498.39
R2 1504.92
R3 1518.93
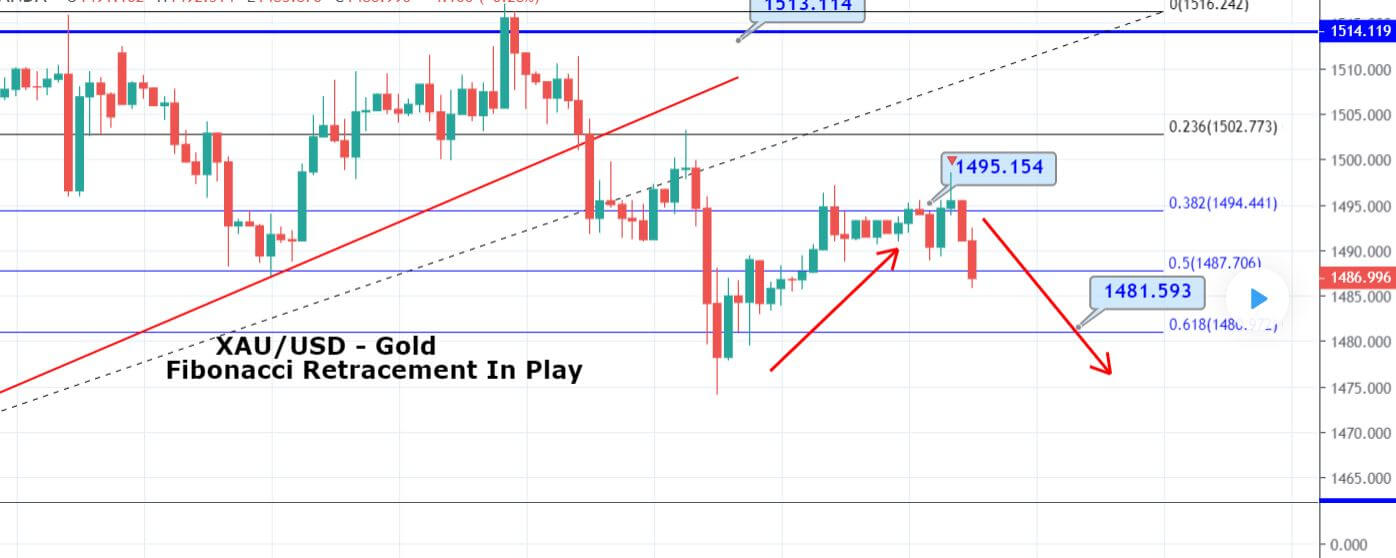
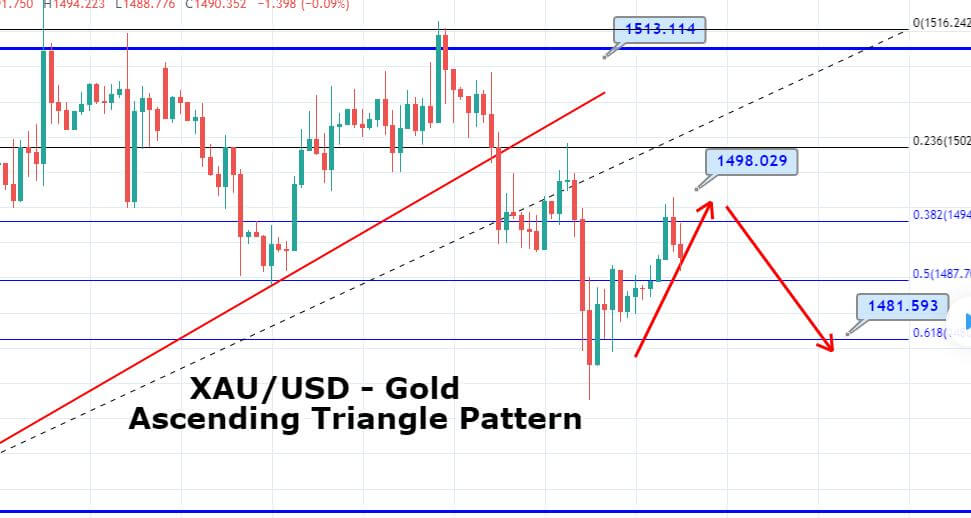
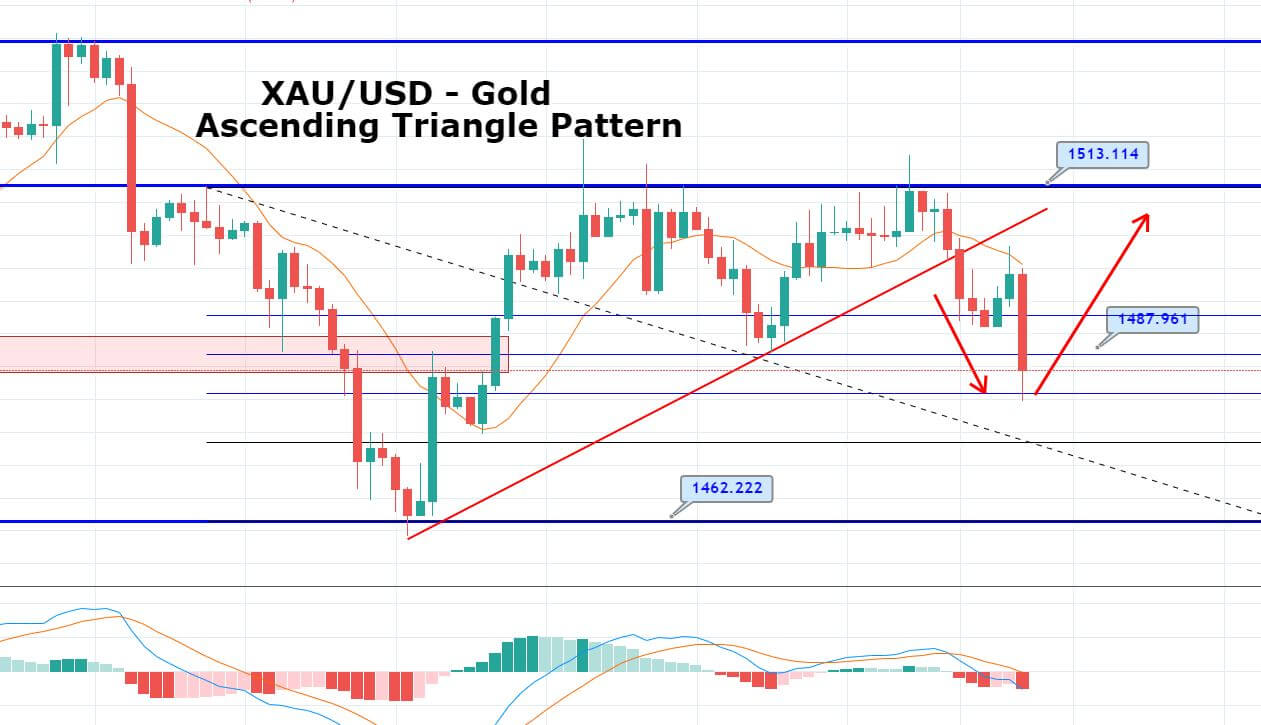
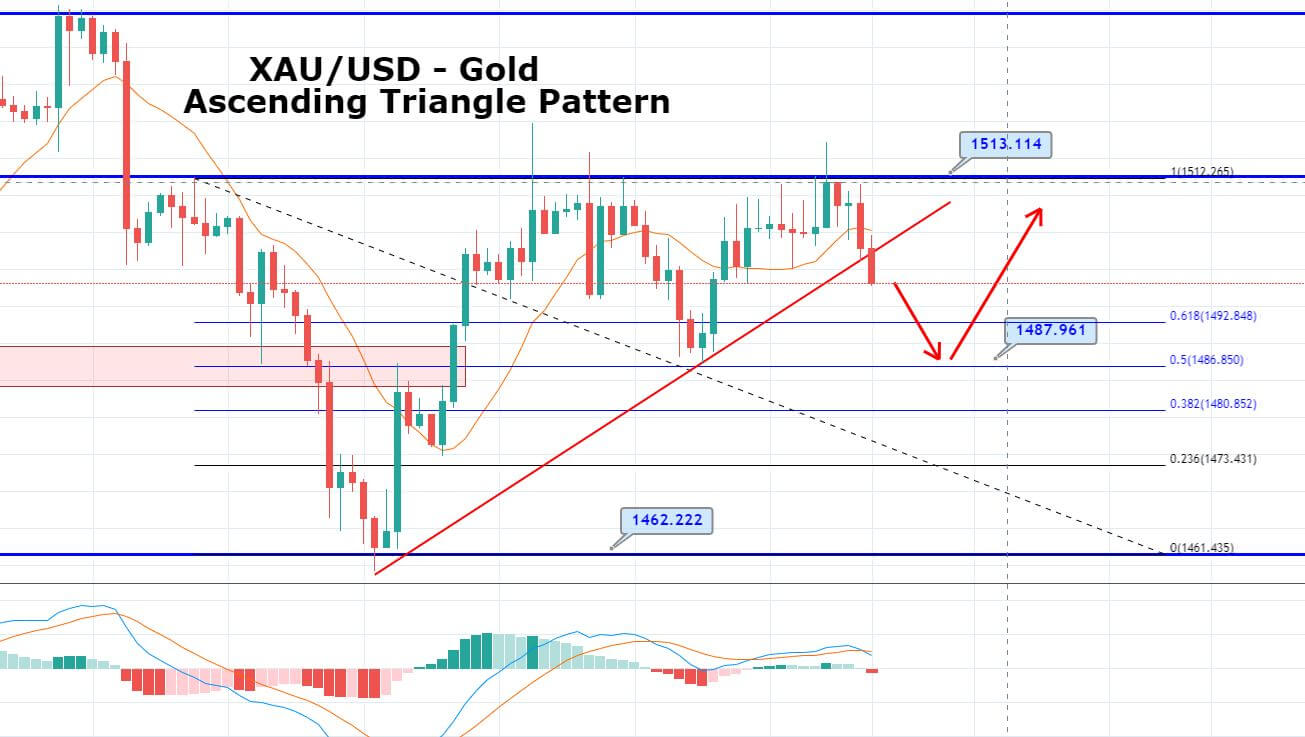
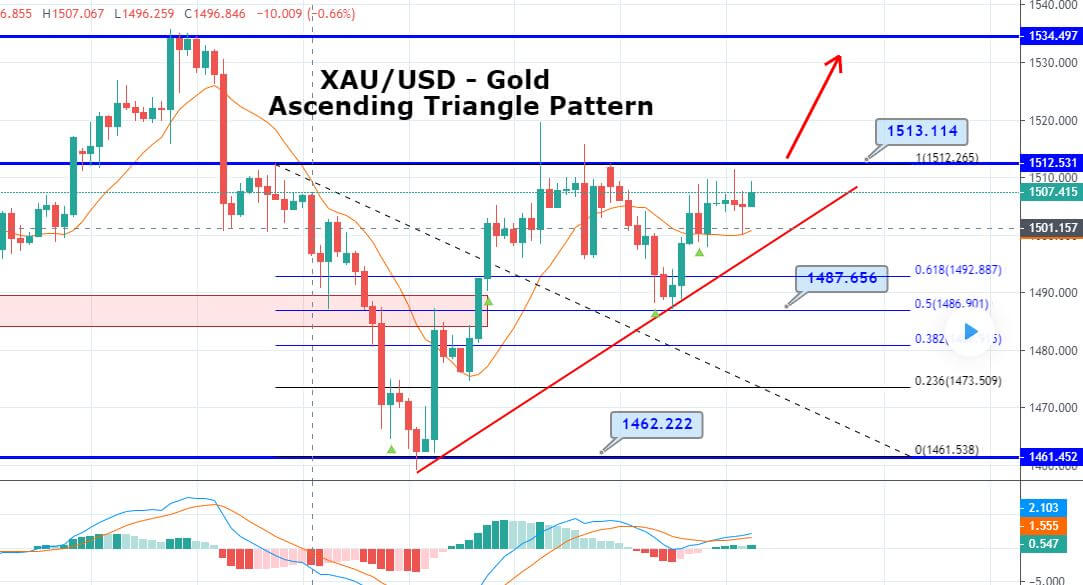
XAU/USD– Trading Tips
Gold prices continue to trade in the same range of 1,496 – 1,488 as investors focus mostly stay on the Brexit deal and Sterling pairs. Technically, the precious metal gold has formed an ascending triangle on the 4-hour timeframe, which is extending substantial resistance at 1,495. Thus, consider staying bearish below 1,496 level to target 1,488 and 1,484.
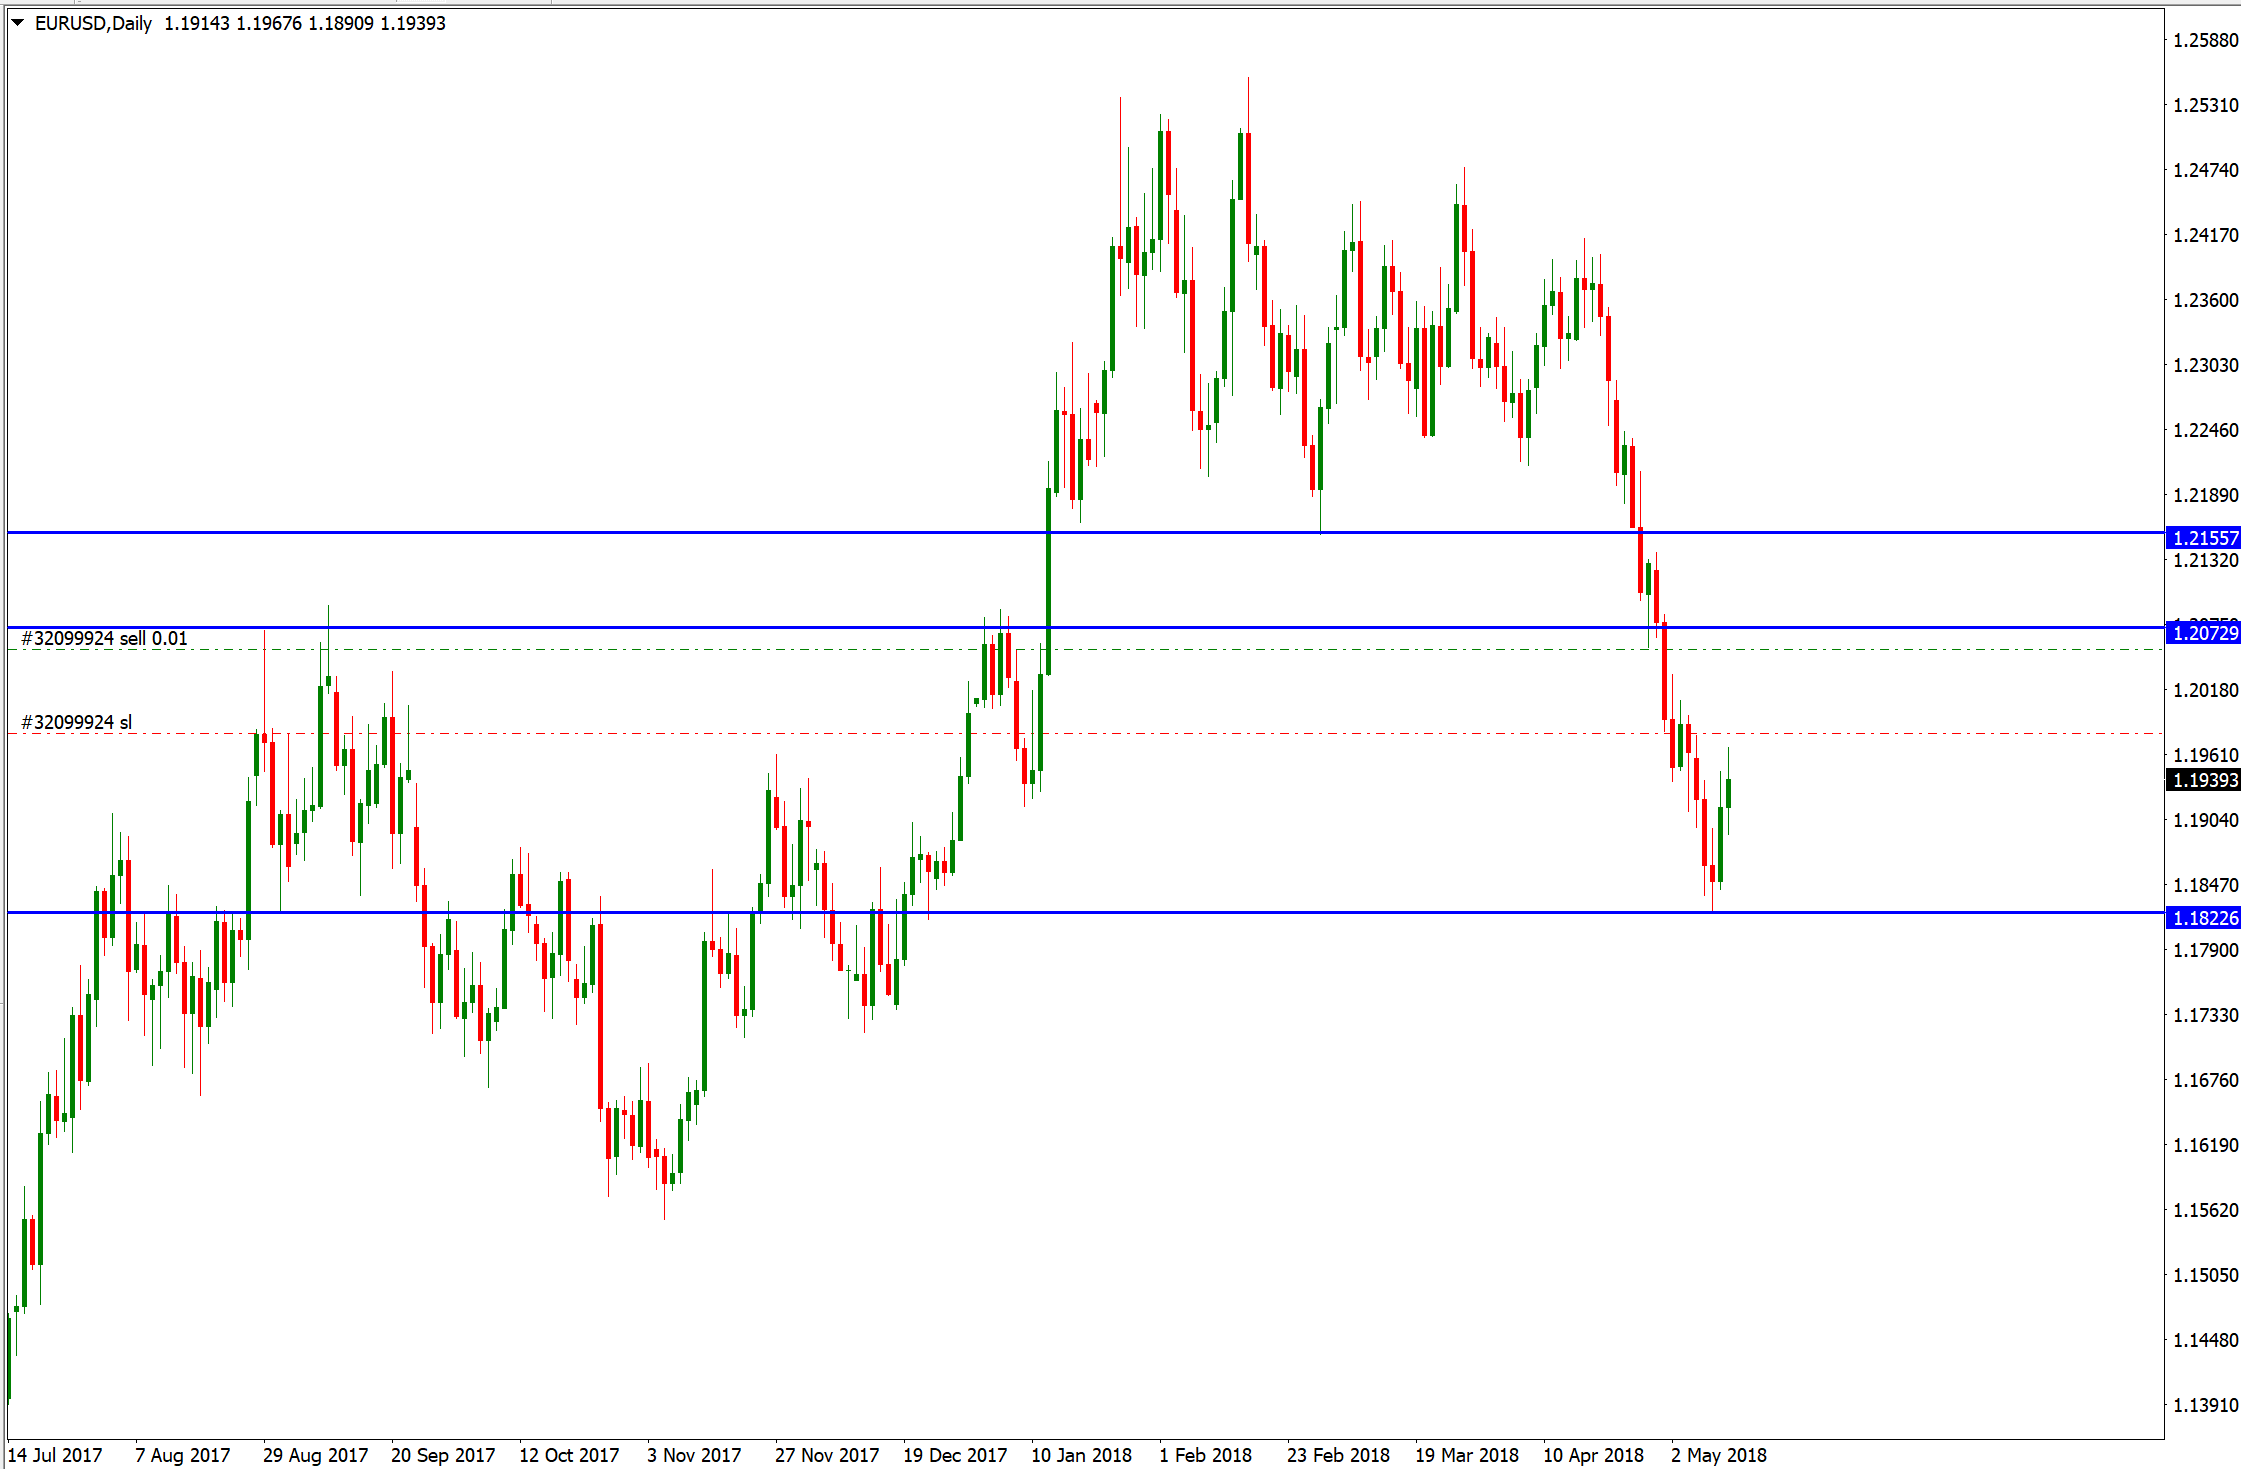
EUR/USD – Daily Analysis
The EUR/USD currency pair found below the 100-day Moving Average of 1.1137, and the pair hit the high of 1.1140 on Thursday due to the headline that the United Kingdom and European Union officials teams (E.U.) have reached a Brexit departure deal.
The upward rally suddenly stopped near the 100-day Moving Average in the overnight session, possibly due to the concerns that the United Kingdom Parliament may reject the deal.
Looking forward, Prime Minister Boris Johnson will face a strongly divided parliament on Saturday, because all the opposition will try to delay the agreement in parliament and another election. Moreover, Boris Johnson Brexit deal already rejected once by the Northern Irish ally, the Democratic Unioost Party.
According to the entire situation, we can say that the chances of the United Kingdom parliament approving the Brexit deal by Boris Johnson are too low. The E.U. currency may remain below the 100-day Moving Average due to uncertainty surrounding the Brexit deal.
On the other hand, the equities could remain under pressure in the wake of sluggish China data; as of data, the final data released in the Asin session which was showed Chinas economy improved 6.0% from a year ago in the 3rd quarter, the weakest data sine 27.5 years.
The E.U. and Pound, both of the currencies, will take a buying trend if the Domcarative Unionist Party gives a softening statement about the Brexit deal on Saturday. In such a case, the EUR/USD currency pair could close above the 100-day Moving Average for the 1st time since July 18.
Daily Support and Resistance
S3 1.0961
S2 1.1036
S1 1.1082
Pivot Point 1.1111
R1 1.1157
R2 1.1186
R3 1.1261
EUR/USD – Trading Tips
The EUR/USD has come out of the sideways range of 1.1020 – 1.1070. The pair is now holding above 1.1070 level, which is currently working as a support.
The bullish engulfing candle above 1.1100 level is suggesting the chances of further buying in the major currency pair. The RSI and MACD are indicating a buying trend, but the pair may show some correction until 1100 before showing a further bullish trend.
Consider staying bullish above 1.1100 level today to target 1.1160 on the upper side.
GBP/USD – Daily Analysis
The GBP/USD currency pair hit the bearish track, representing a 0.30% declines on the day, mainly due to the fears that Prime Minister Boris Johnson could fail to approve the new Brexit deal in the United Kingdom parliament on coming Saturday.
As of writing, the GBP/USD currency pair currently trading around the 1.2850, having hit a high of 1.2990 on Thursday. By the way, it was the highest level since May 13.
Moreover, the GBP currency took a strong buying trend during the European trading hours due to the report that the United Kingdom and the European Union have reached a Brexit departure deal.
The GBP/USD rose to 5-months highs, but it was short-timed because the optimism decreased on the realization that the United Kingdom parliament could deny the deal.
In an amazing Saturday meeting, the first since 1982, the parliament will vote on approving the new Brexit deal.
Looking forward, Prime Minister Boris Johnson will face a strongly divided parliament on Saturday, because all the opposition will try to delay the agreement in parliament and another election. Moreover, Boris Johnson Brexit deal already rejected once by the Northern Irish ally, the Democratic Unioost Party.
Daily Support and Resistance
S3 1.2396
S2 1.2636
S1 1.2764
Pivot Point 1.2877
R1 1.3004
R2 1.3117
R3 1.3357
GBP/USD – Trading Tips
The GBP/USD is trading within a bullish channel, which is extending support around 1.2850 level. The GBP/USD has from inside up bar pattern on the 4-hour chart, which is suggesting a bullish trend in the Cable.
The immediate support prevails at 1.2800, and resistance is likely to stay at 1.2900 today. Consider staying bullish above 1.2800, where the violation of 1.2870 can also lead the GBP/USD towards 1.2910.
All the best!