The U.S. Dollar Index gained 0.2% on the day to 97.68 on Thursday amid mixed U.S. economic data. The euro slid 0.3% to $1.1104. The European Central Bank held its benchmark rates unchanged as expected. ECB President Mario Draghi said risks to the outlook are “on the downside” compared with “tilted to the downside” previously.
On the other hand, the Markit eurozone manufacturing purchasing managers’ index was flat on the month at 45.7 in October (46.0 expected) while the Services PMI rose to 51.8 (51.9 expected) from 51.6.
The pound dropped 0.6% to $1.2838. U.K. Prime Minister Boris Johnson said he would call for an early general election for December 12. Meanwhile, the European Union is expected to decide the length of Brexit delay later today.
Economic Events to Watch Today
Let’s took at these fundamentals.
GBP/USD– Daily Analysis
The GBP/USD currency pair consolidating in the narrow range below the 200-hour Moving Average at 0.2852, due to the uncertainty intensified regarding the Brexit deal and the United Kingdom eclection. Notably, the pair may remain under pressure mainly due to increased risk.
British Prime Minister Boris Johnson admitted for the first time that he would not fulfill his (do or die) promise to get a departure between the U.K. and E.U. before October 31 and asked for a fresh election on December 12 to break Britain’s Brexit obstacle.
Although the opposition has rejected the election offer and LAbour leader Jermy Corbyn said that he would wait to observe what will the European Union decides regarding the Brexit delay before deciding that how to put the vote on Monday.
Moreover, the European Union is thinking of granting a 3-months delay. However, the decision may not come on Friday. The Brexit is moving in the uncertainty track, and Prime Minister Boris Johnson looks stuck in the middle. Therefore, traders are cautious about buying GBP.
On the technical side, the Technical charts are also indicating a move lower. It should be noted that Thursday’s bearish candlestick has opened the opportunities for a broader reversal, perhaps to the 200-day average at 1.2710.
Daily Support and Resistance
S3 1.2539
S2 1.2701
S1 1.2774
Pivot Point 1.2862
R1 1.2936
R2 1.3024
R3 1.3186
GBP/USD– Trading Tips
After violating the bullish channel, the GBP/USD pair is trading bearish at 1.2835 area. Overall, the Cable is maintaining a sideways range of 1.2950 – 1.2785. The bearish engulfing candle on the 4-hour timeframe is likely to lead the GBP/USD prices towards 1.2785 area today.
The MACD and RSI indicators are holding in the selling zone, supporting the bearish trend in the GBP/USD. Consider staying bearish below 1.2845 today.
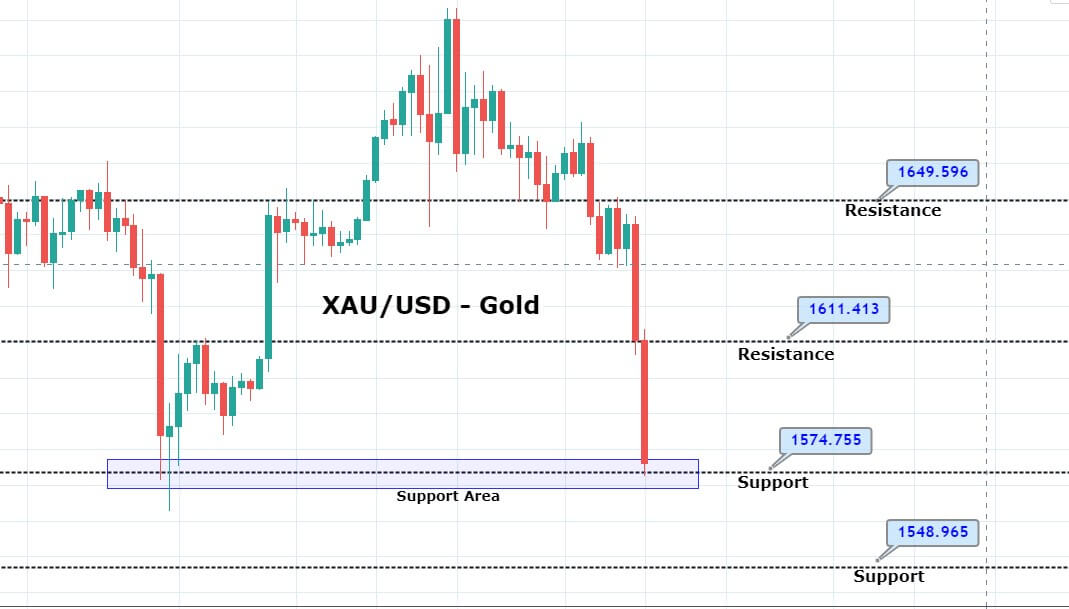
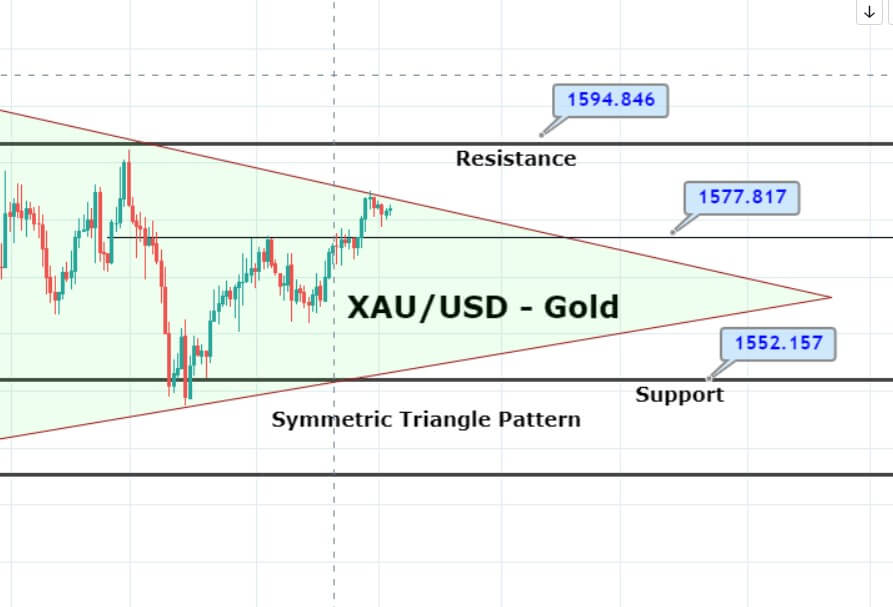
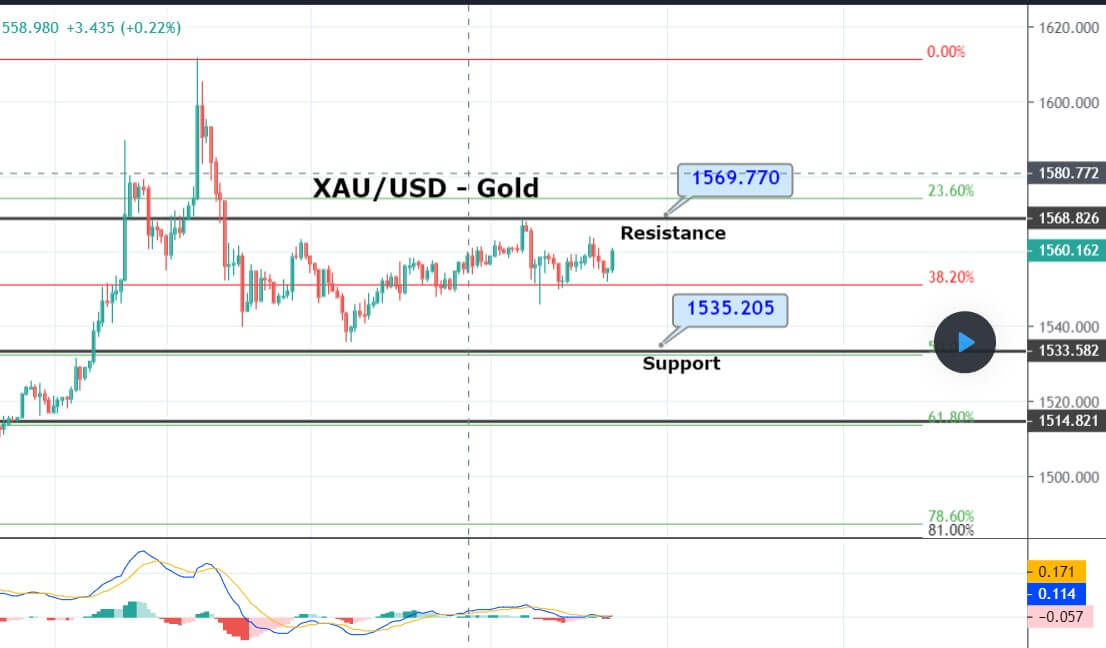
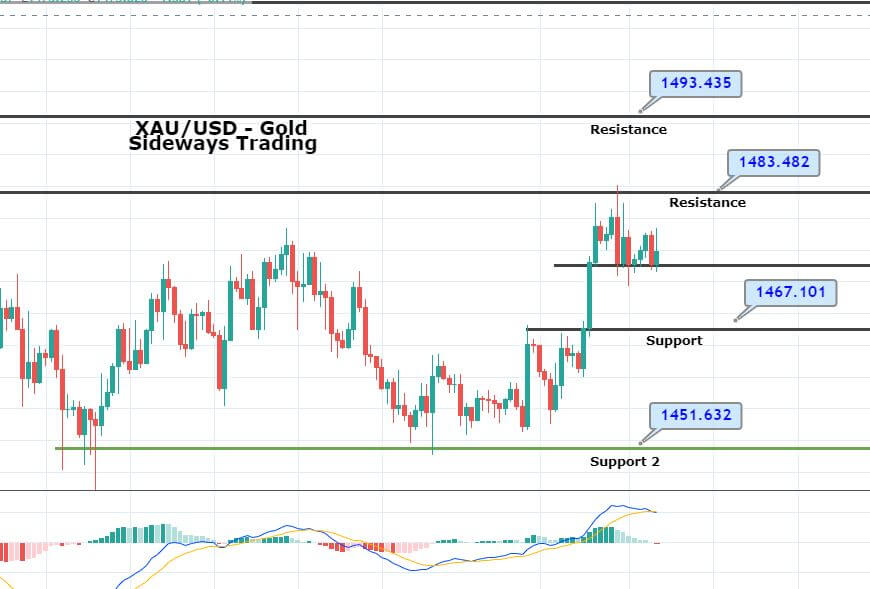
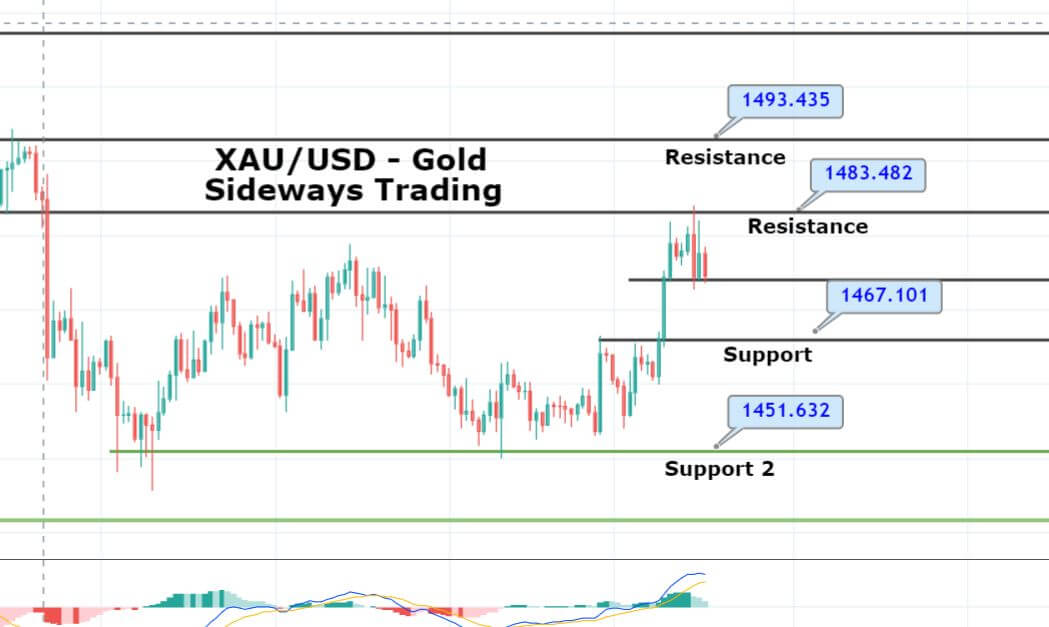
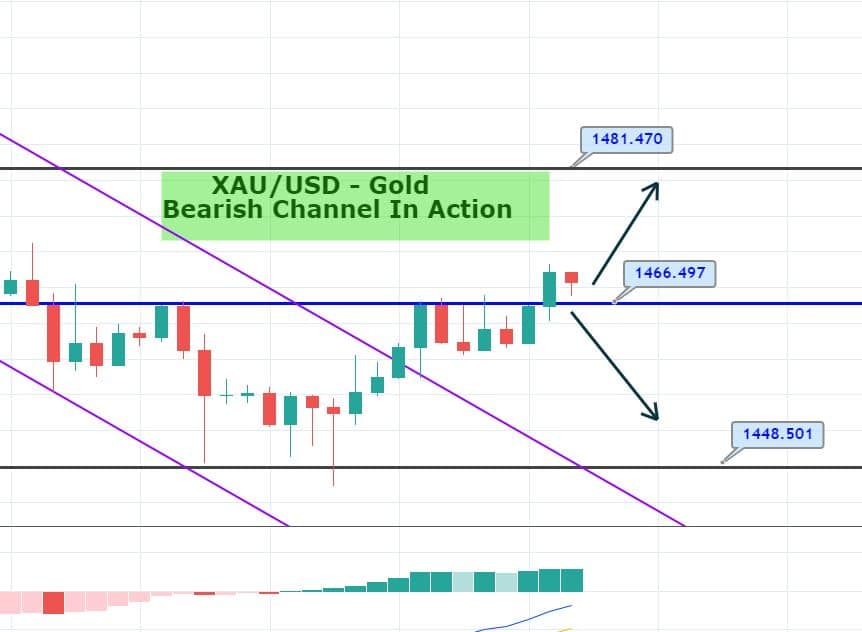
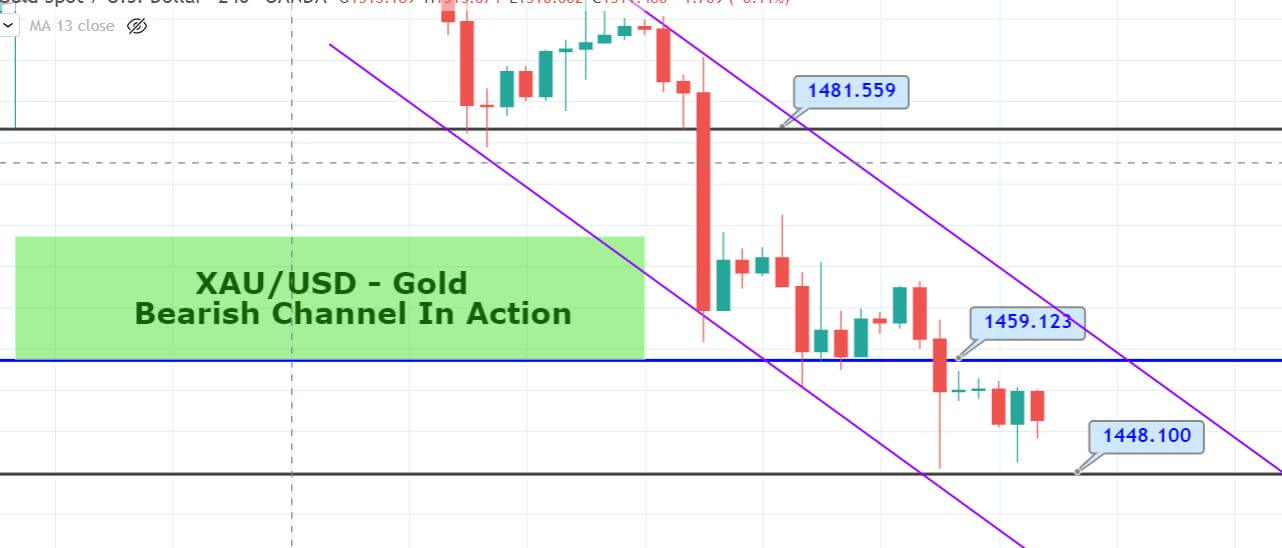
XAU/USD – Daily Analysis
The safe-haven prices rose somewhat due to traders are awaited the next weeks, the United States Federal Reserve policy conference.
The U.S. Federal Reserve’s policymakers will attend next week. Its Oct. 29-30 policy settlement is required to yield in a 3rd-straight quarter-point rate cut.
President Trump tweeted that, “The Federal Reserve is negligent in its duties if it doesn’t deliver the rate cut and even, ideally, stimulate.
Gold prices remain supported in the wake of Japan’s manufacturing activity, which declined at the fastest rate in 3-years. Meanwhile, The U.S. PMI opposed expectations for a drop and rose marginally, but with limited impact on the prices of the safe-haven gold.
Daily Support and Resistance
S3 1466.32
S2 1482.53
S1 1493.22
Pivot Point 1498.74
R1 1509.43
R2 1514.95
R3 1531.16
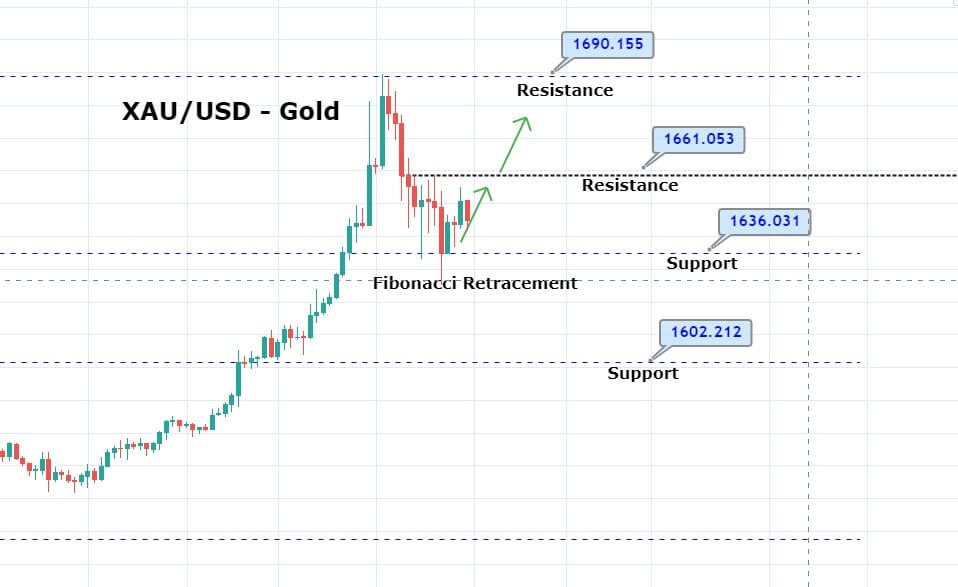
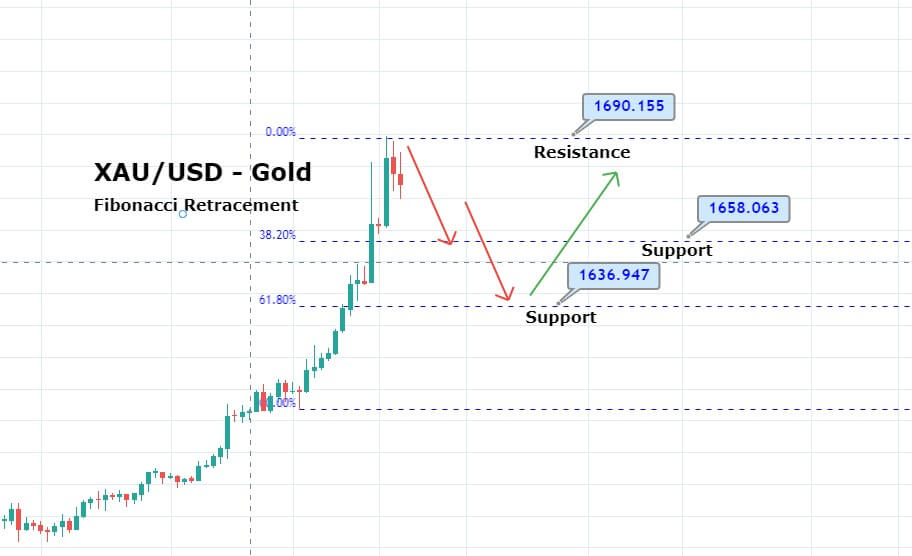
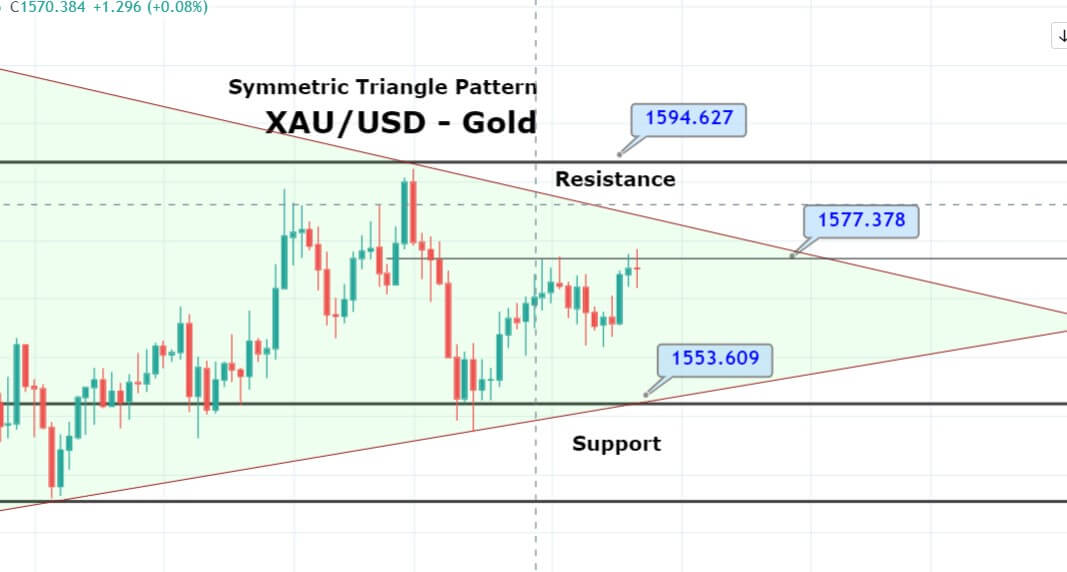
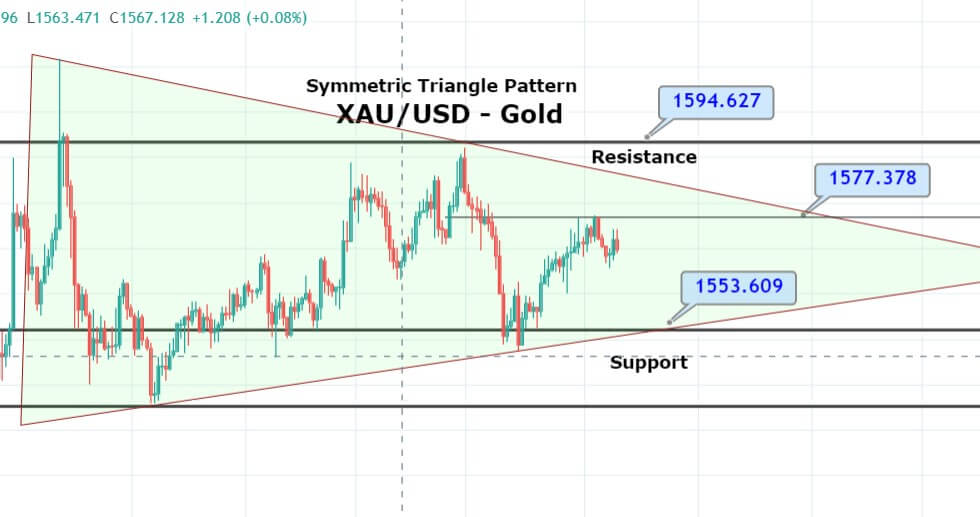
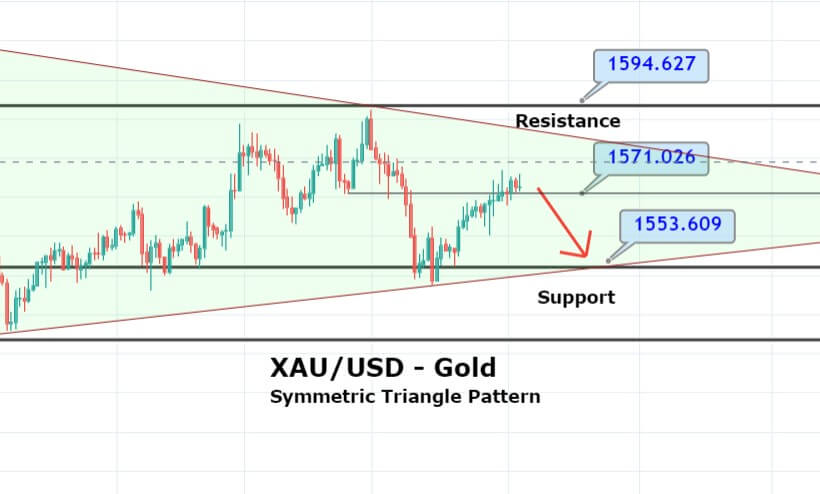
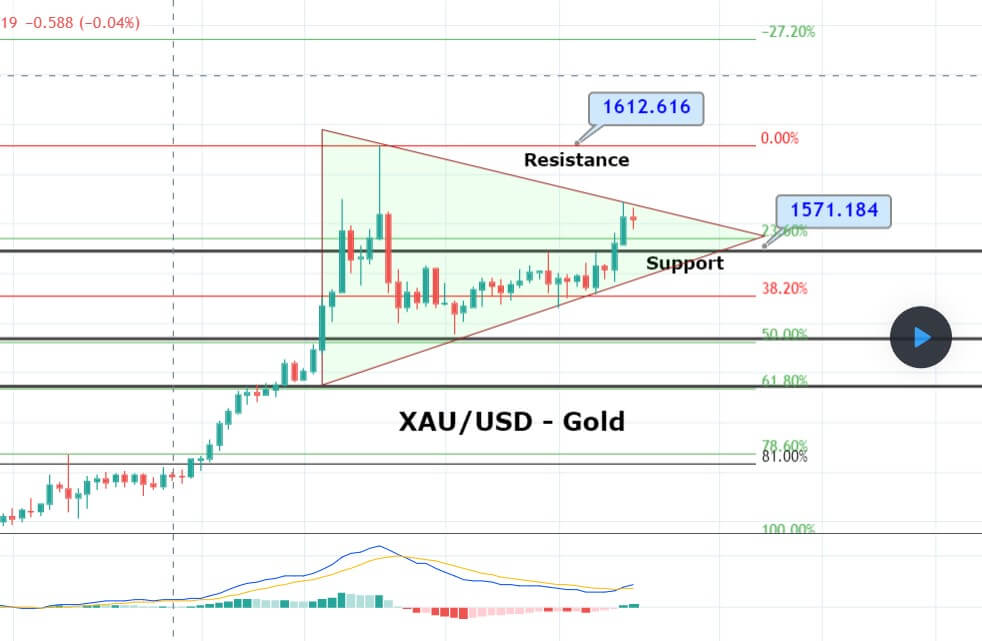
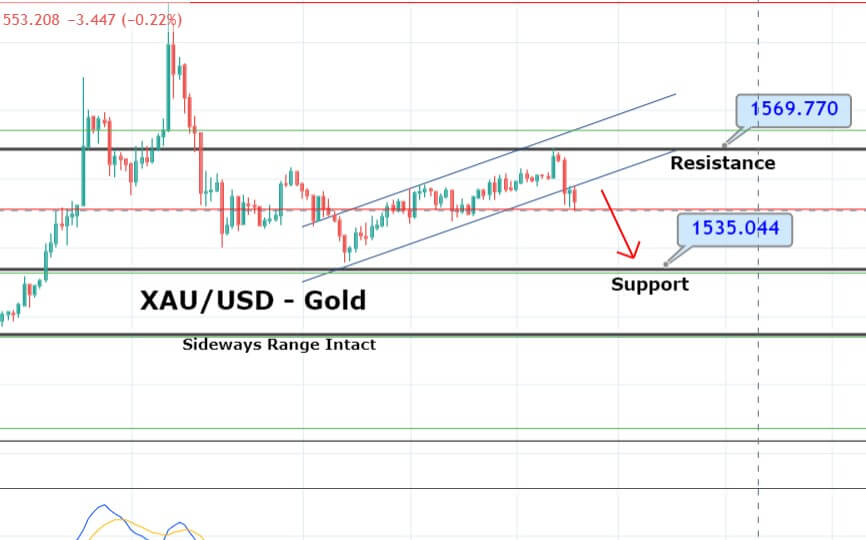
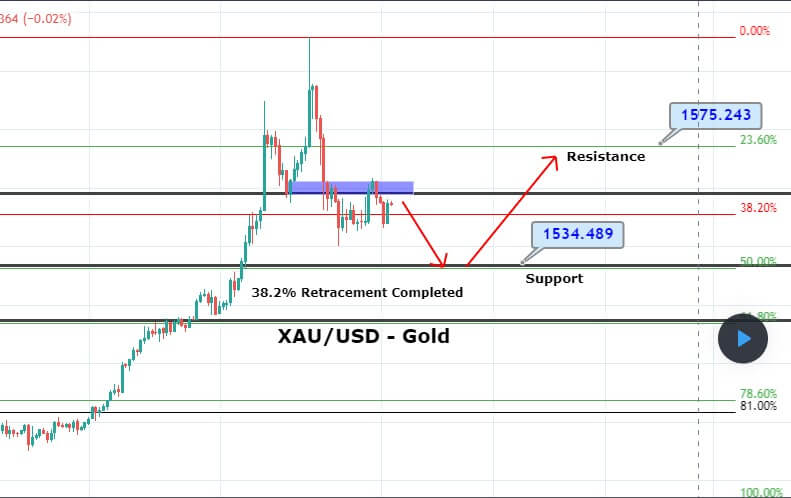
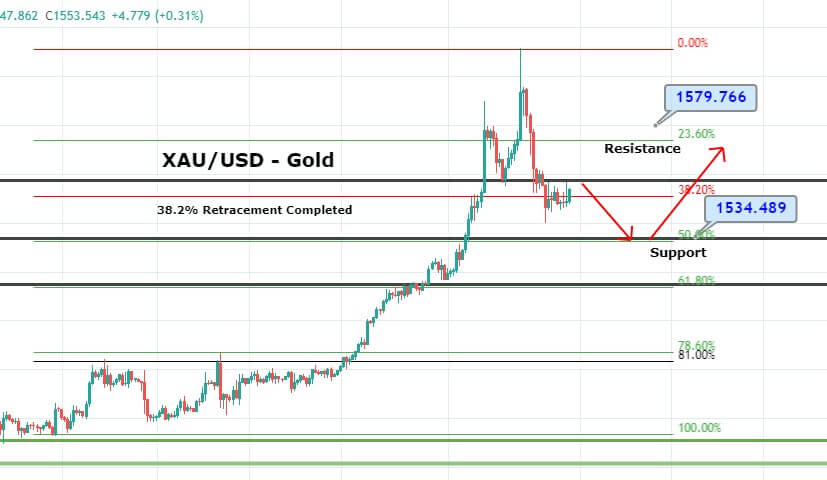
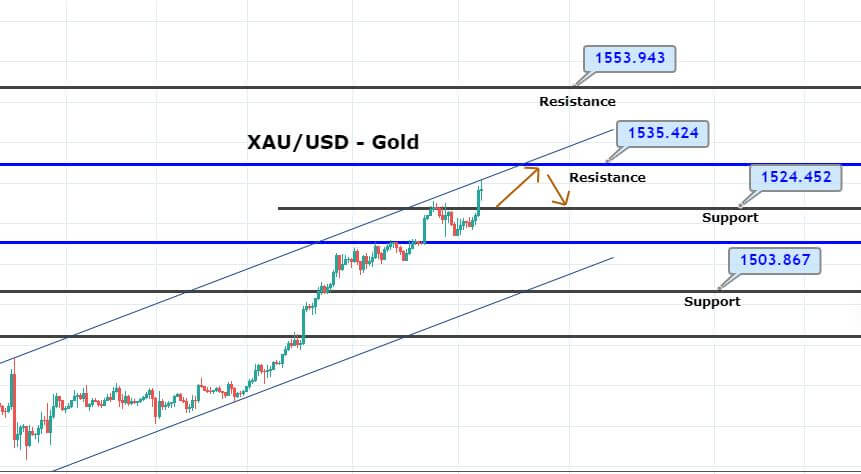
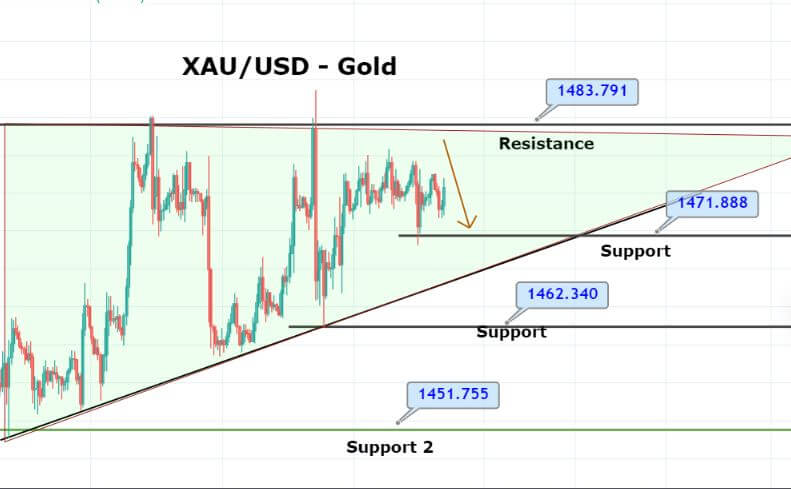
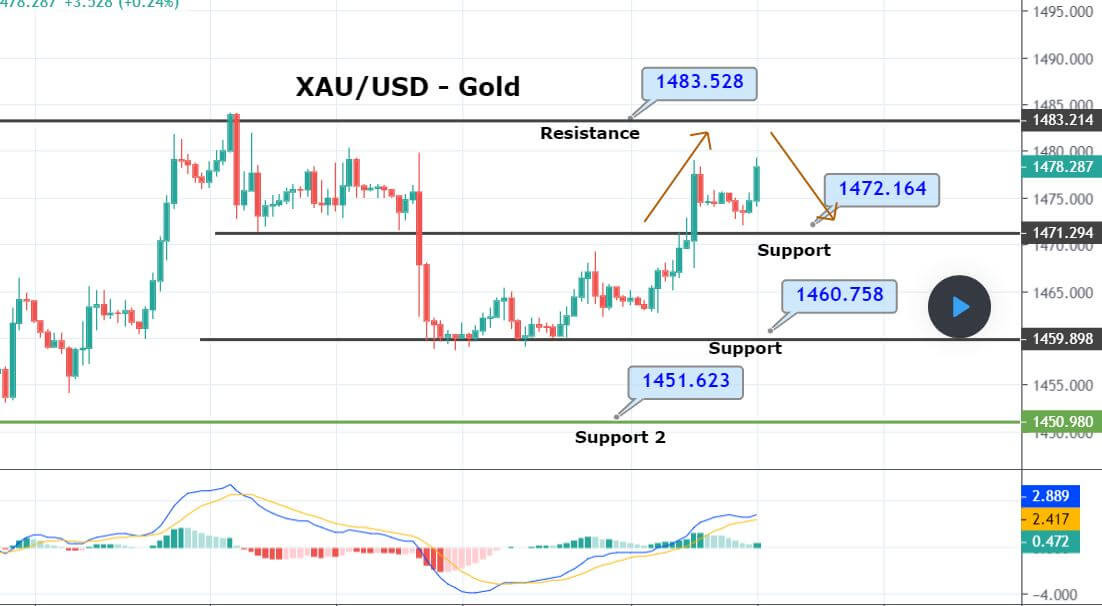
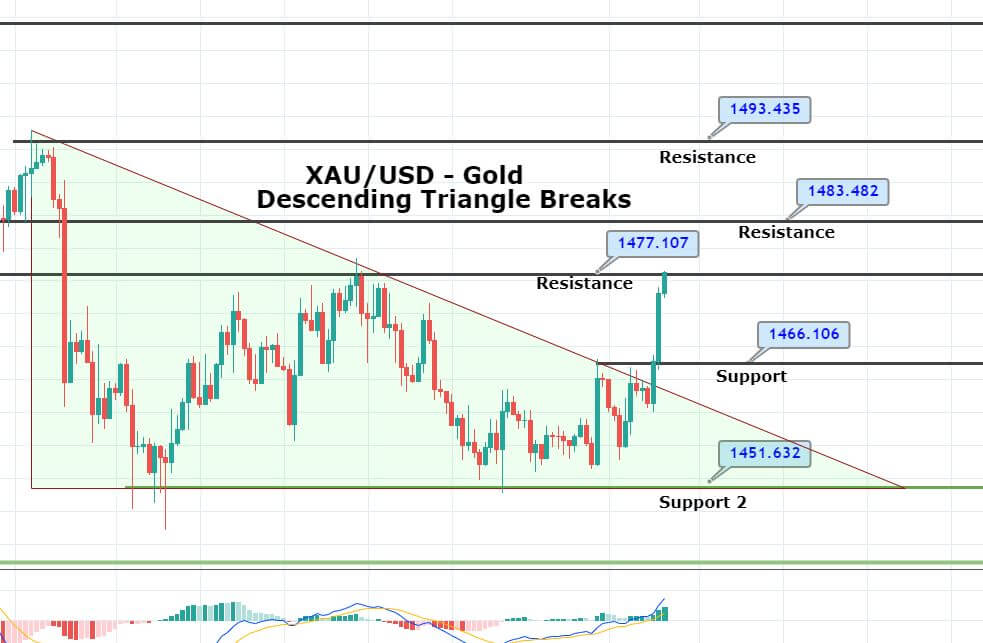
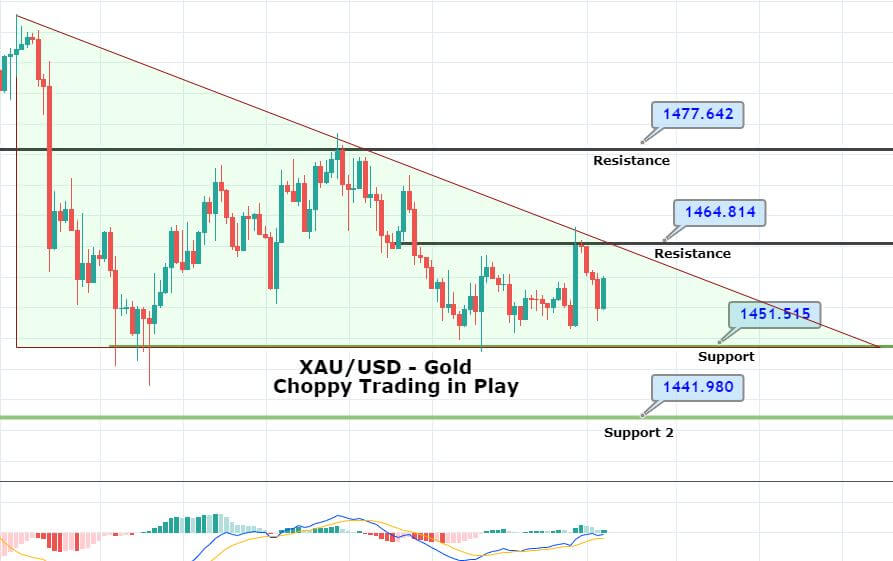
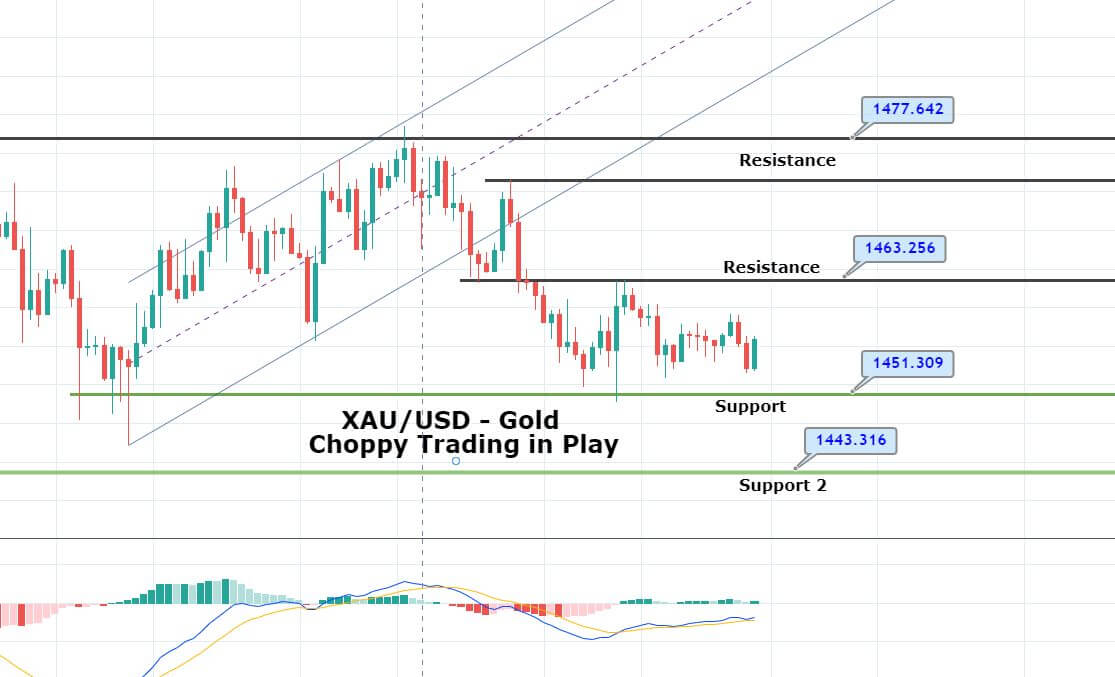
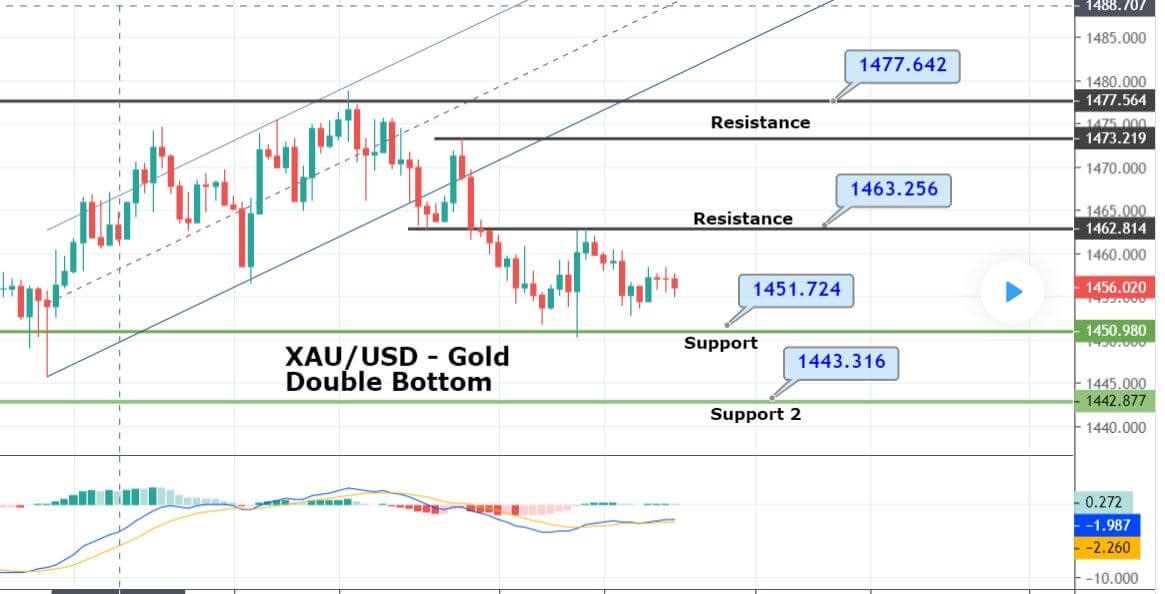
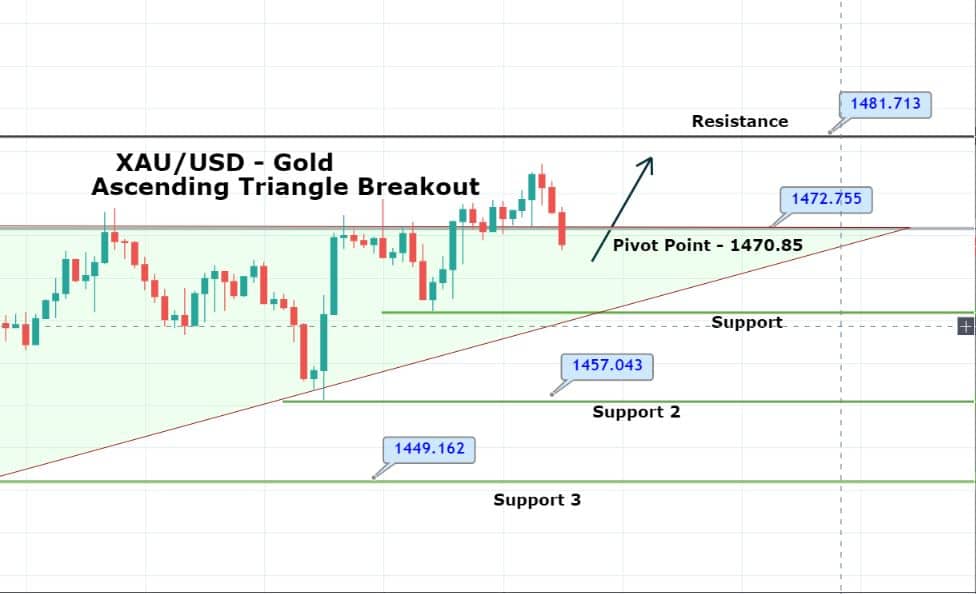
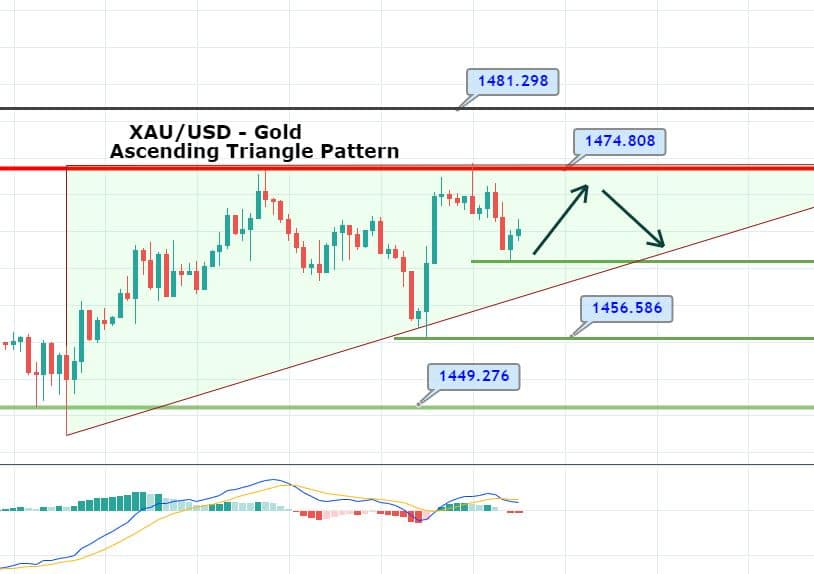
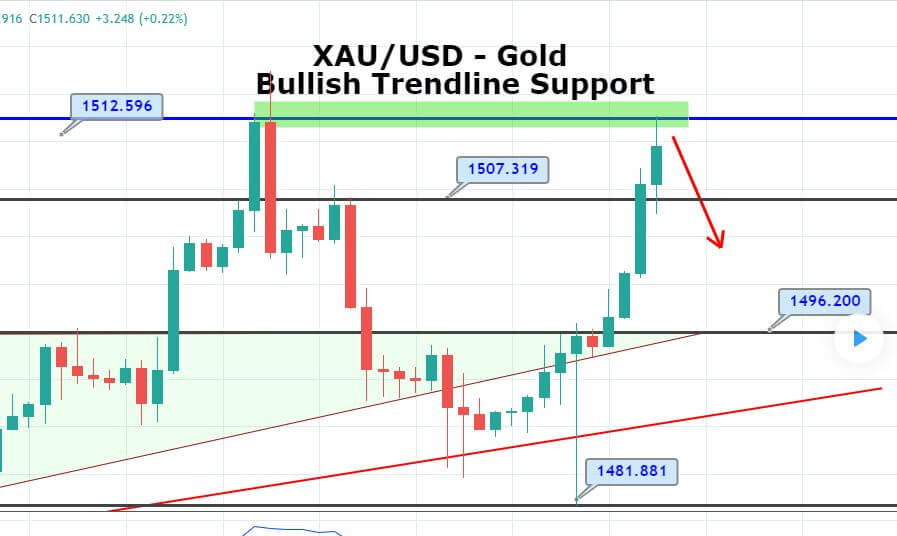
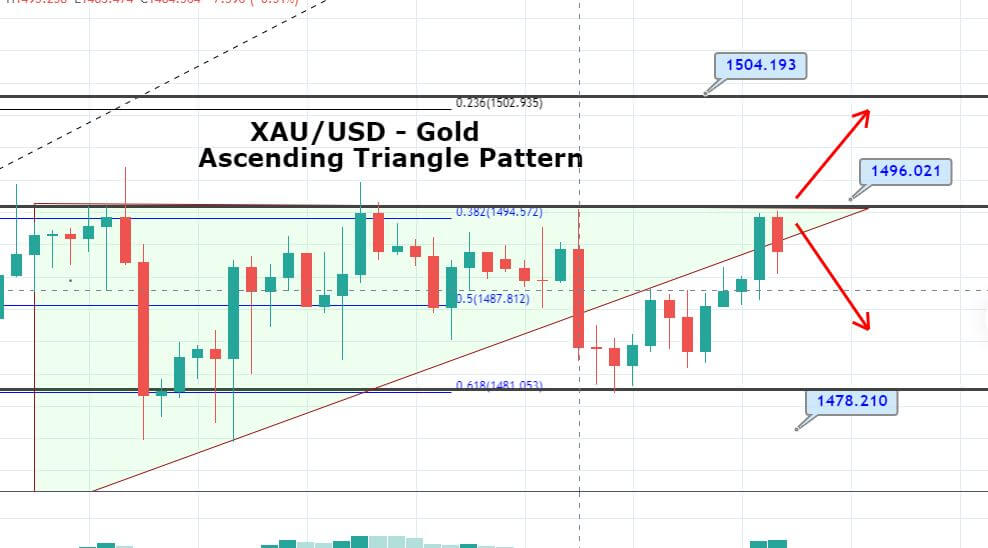
XAU/USD – Trading Tips
Gold’s bullish trend continues to dominate the market. Closing of 4-hour candles above 1,495 and 1,503 area is indicating chances of further buying in the gold. The precious metal has formed three white soldiers pattern, which typically drives the bullish trend in the market.
On the upper side, the next resistance is likely to be 1,511. Therefore, we should look for buying positions above 1,500 area to target 1508 today.
USD/JPY – Daily Analysis
The USD/JPY currency pair is sidelined below the 200-day moving average and consolidating in the narrow range of 108.50 and 108.7 overnight, even after the United Sateta data a geopolitical uncertainty.
As of writing, the USD/JPY currency pair is currently trading at 108.60, having ranged between the level of 108.56and 108.64.
At the Hong Kong front, the condition is dull in Asia right now, but the markets keep their eyes on how the Chinese can react to comments regarding the Honk Kong and China, where he criticized the Chinese over security and human rights.
At the U.S. data front, the United States September Durable Goods Orders were depressed, and the volatile headline dropped -1.1%m/m against an estimate of -0.7%m/m. Though, September New Home Sales found on the positive side, with an increase of 701,000 against 702,000, against the previous revised to 706k from 713k, though average annual prices continued to ease. Markit PMIs also held steady in October, whereby Manufacturing PMI rose to 51.5 and bat the estimates of 50.9 and prior 51.1. Services came in line with expectations with an increase in the composite level to 51.2 from 51.0.
Moreover, the United States’ two-year Treasury yields waited in normal ranges between 1.55% and 1.58%, and the ten-year return moved between 1.74% and 1.77%. Markets are expecting 22-basis points of a rate cut at the October 30 meeting and a terminal rate of 1.21% against 1.88% currently. President Trump tweeted that, “The Federal Reserve is negligent in its duties if it doesn’t deliver the rate cut and even, ideally, stimulate.
At the Brexit front, the British Prime Minister Boris Johnson admitted for the first time that he would not fulfill his (do or die) promise to get departure between the U.K. and E.U. before October 31, and asked for fresh elections on December 12 to break Britain’s Brexit obstacle.
While the European Union was expected to give its answer to the United Kingdom governments request for a delay of European Union membership beyond October. However, due to the conflict between the United Kingdom parliament members, the European Union will decide to prefer to get some transparency first because it is continuously creating uncertainty in U.K. politics and Brexit.
Daily Support and Resistance
S3 108.11
S2 108.37
S1 108.5
Pivot Point 108.63
R1 108.76
R2 108.88
R3 109.14
USD/JPY – Trading Tips
On Friday, the safe have currency pair USD/JPY is facing support at 108.280. This level has become a triple bottom level and pushed the USD/JPY higher for the third time. At the moment, the USD/JPY trend is mixed as it holds right below an immediate resistance level of 108.650. Violation of this level can extend buying until the next resistance level of 108.900.
Today, let’s keep an eye on 108.650 to stay bearish or bullish above this level to capture quick trade in the USD/JPY.
All the best!