Today in the early Asian trading session, the yellow metal prices extended its late-Friday pullback and moved below $2,030. Let me remind you, the gold prices fresh losses can be considered as an extension to Friday’s losses that were the highest in 2-months. The reason could be associated with fresh risk-on market sentiment, supported by Trump’s latest positive statement that refueled hopes of further stimulus.
As in result, the risk sentiment got a lift while the Asian equities trimmed their losses and held up near-daily highs that urged buyers to invest in riskier assets instead of safe-have assets. The risk-on market sentiment got additional support from upbeat China’s CPI, PPI, for July data. Elsewhere, the broad-based U.S. dollar reported losses on the day despite Friday’s better-than-expected U.S. payrolls report, which helped the bullion prices to limit its deeper losses. Meanwhile, the coronavirus (COVID-19) crisis gradually supported the safe-haven assets and capped its losses. The yellow metal prices are currently trading at 2,029.23 and consolidating in the range between 2,019.85 and 2,036.24.
Earlier today, U.S. President Donald Trump came out with positive news that “Democrats have called and want to get together.” This statement recently boosted hopes of the further stimulus package expired during the last week after policymakers canceled negotiations. However, this move is seen as a major factor that turned risk sentiment positive. Apart from this, U.S. President Donald Trump fulfilled his promise to take executive action as the U.S. Congress failed to offer any outcome over its latest stimulus measures. As a result, U.S. President Trump’s signed four executive orders to release unemployment claim benefits, help with student loans, and aid for those living in a rented house, which also exerted a positive impact on the market trading sentiment and contributed to the gold losses.
In the meantime, the risk-on market was further bolstered by upbeat China’s CPI, PPI for July data. At the data front, the China July CPI +2.7% YoY (Reuters poll +2.6%). China July PPI -2.4% YoY (Reuters poll -2.5%).
On the negative side, the gloomy updates concerning the US-China tension and the coronavirus (COVID-19) kept challenging the risk-on market sentiment and traders cautious. At the US-China front, the long-lasting tussle between the two biggest economies continued to worsen day by day as Trump banned U.S. firms from doing any business with TikTok, WeChat, or the applications’ Chinese owners in the wake of national security threat.
The tension between both parties was further bolstered after the U.S. imposed sanctions on senior Hong Kong and Chinese officials, including Hong Kong’s Chief Executive Carrie Lam, during last week. In the meantime, the White House National Security Adviser Robert O’Brien blamed China while saying that the “Chinese hackers have been targeting U.S. election infrastructure ahead of the 2020 presidential election.”
Also challenging the risk-on market sentiment was the COVID-19 crisis. As per the latest report, the U.S. crossed the grim milestone of five million COVID-19 cases as of August 10, according to Johns Hopkins University.
Whereas Australia’s 2nd-most populous state, the pandemic epicenter, Victoria, reported the biggest single-day rise in deaths. As per the latest figures, Australia’s coronavirus death losses crossed 314 as Victoria announces a daily record of 19 deaths and 322 new cases in the past 24 hours. Friday’s better-than-expected U.S. payrolls report also supported the risk-on market sentiments report. At the data front, the Non-farm payrolls increased by 1.763 million in July, against the predicted 1.6 million increase. In the meantime, the unemployment rate also dropped to 10.2% in July, vs. June’s reading of 10.5%.
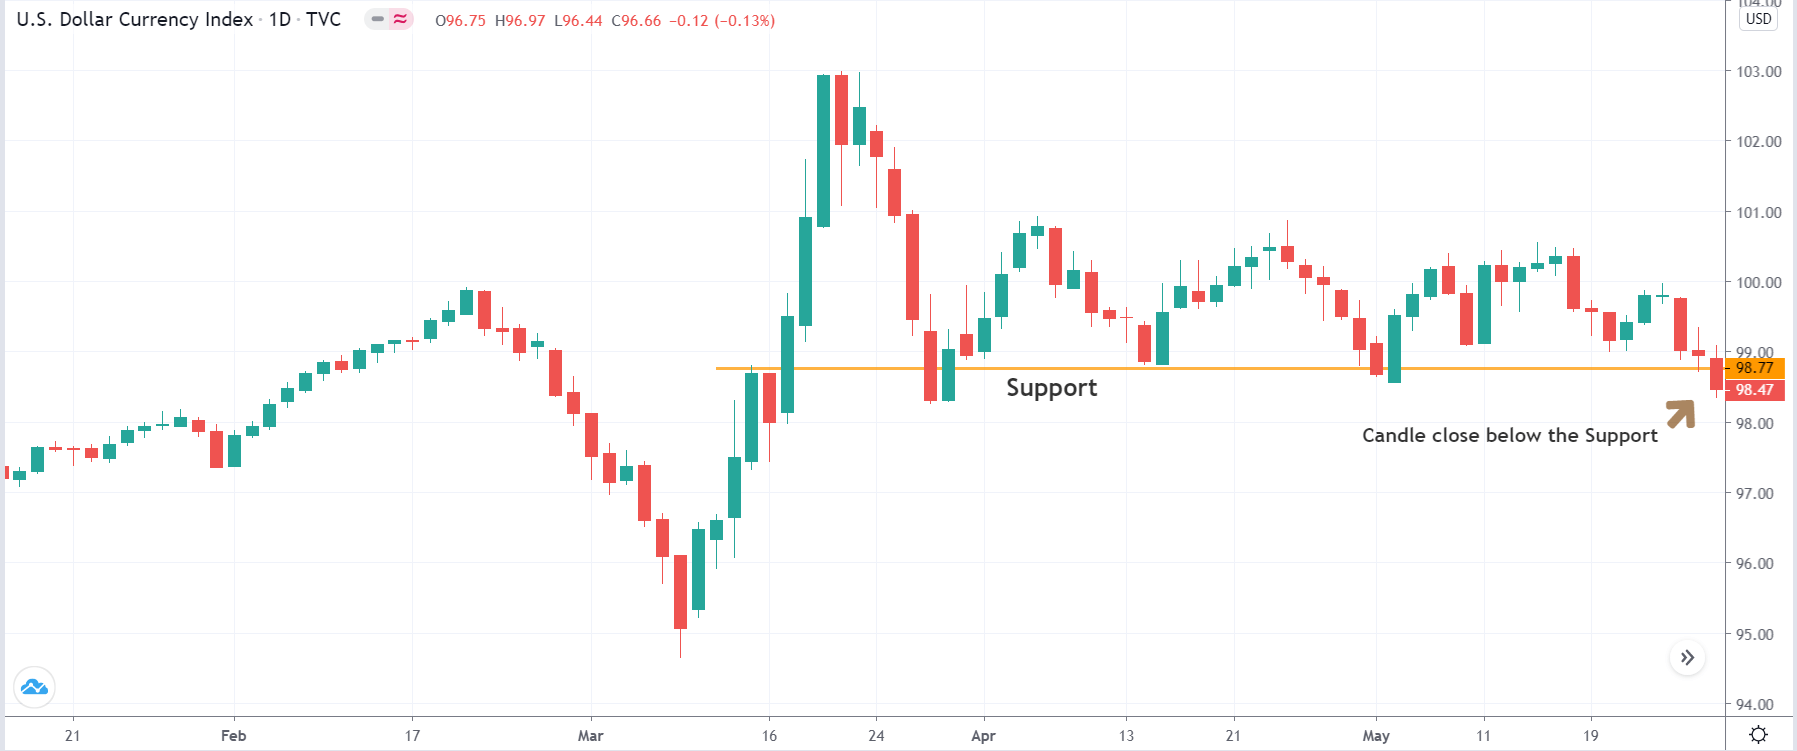
Despite this, the broad-based U.S. dollar failed to stop its losses. It took the further offer on the day as the United States still facing virus woes. It struggled to control a spike in coronavirus cases, which fueled fears that U.S. economic recovery from COVID-19 has diminished. As well as, the risk-on market sentiment also weighed on the American currency. However, the losses in the U.S. dollar helped the gold prices to stay higher as the price of gold is inversely related to the price of the U.S. dollar. Whereas, the U.S. Dollar Index that tracks the greenback against a basket of other currencies dropped by 0.11% to 93.308 by 10:16 PM ET (3:16 AM GMT).
Due to mixed headlines, the S&P 500 Futures failed to offer any clear direction while stocks in Australia and New Zealand stayed moderately positive. Moreover, the U.S. 10-year Treasury yields avoid moving as Japanese traders enjoy holiday due to Mountain Day.
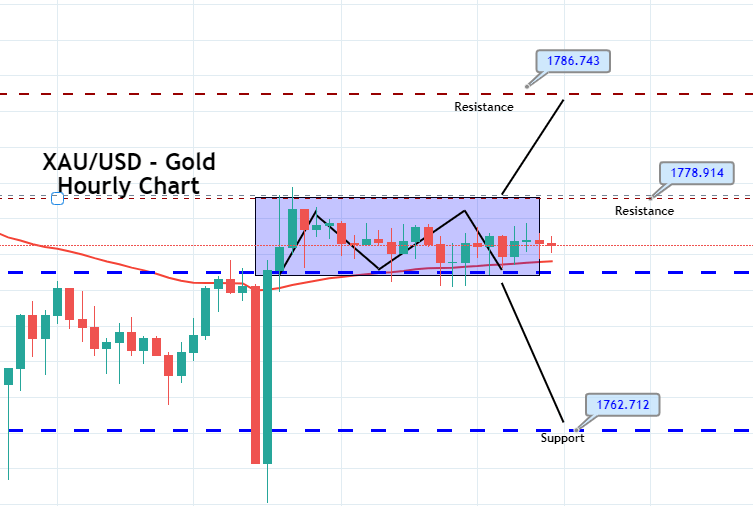
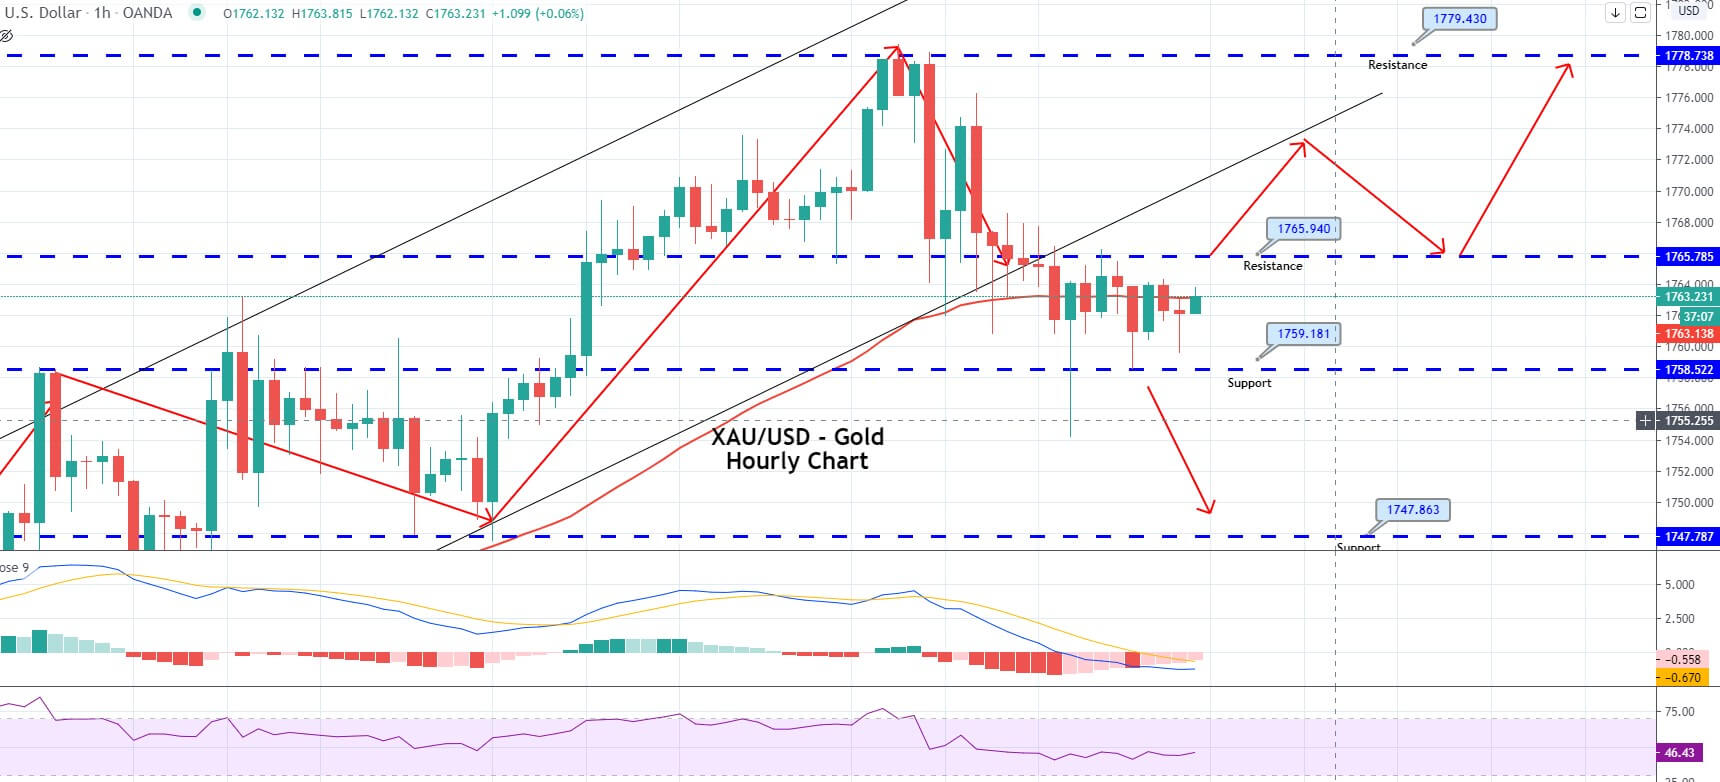
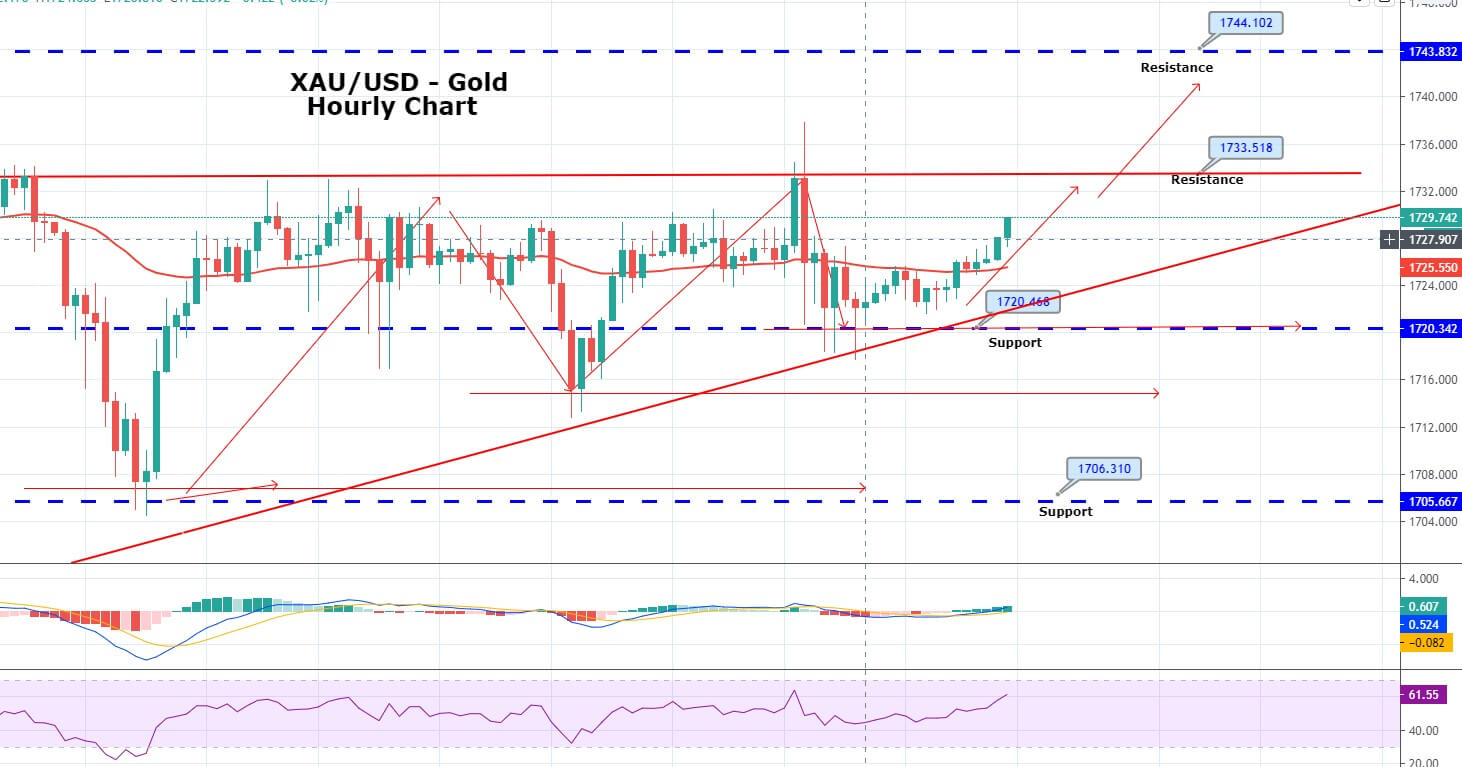
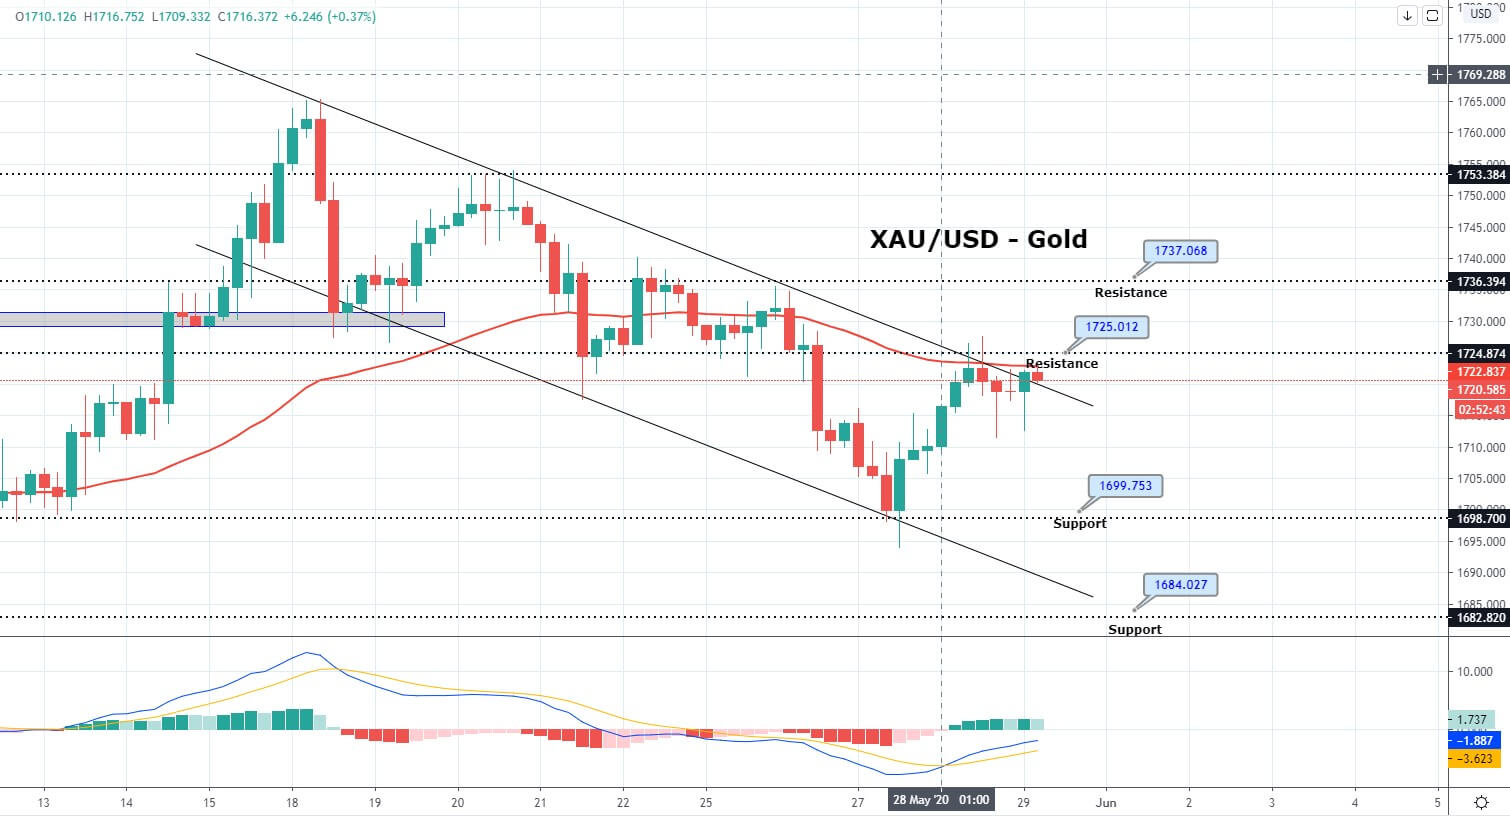
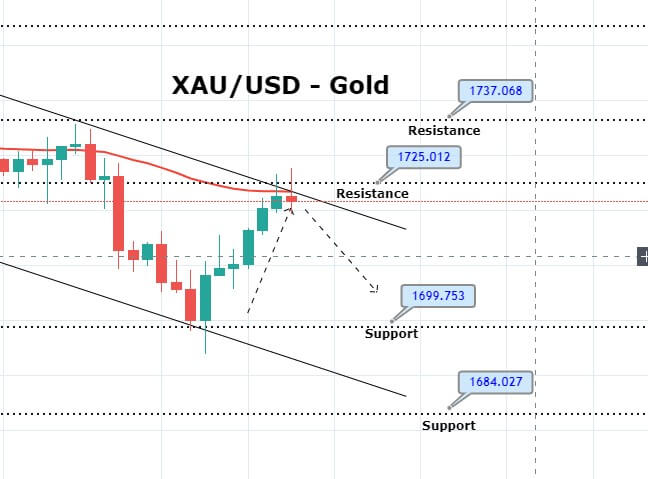
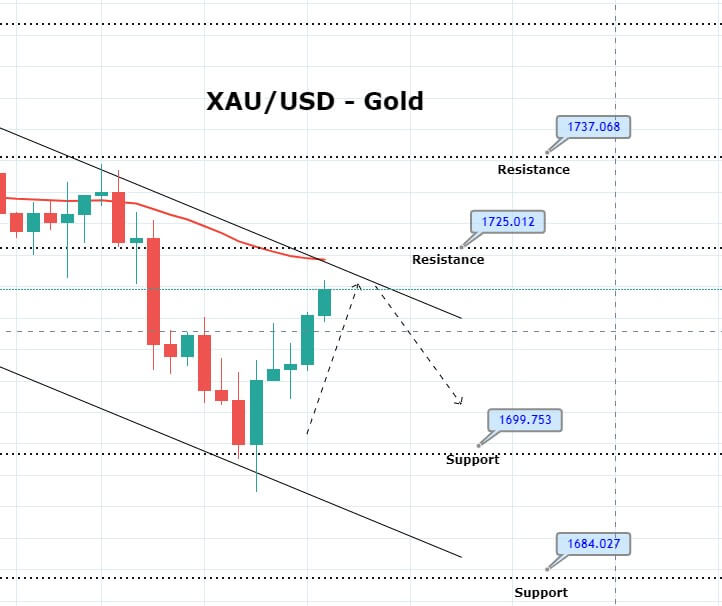
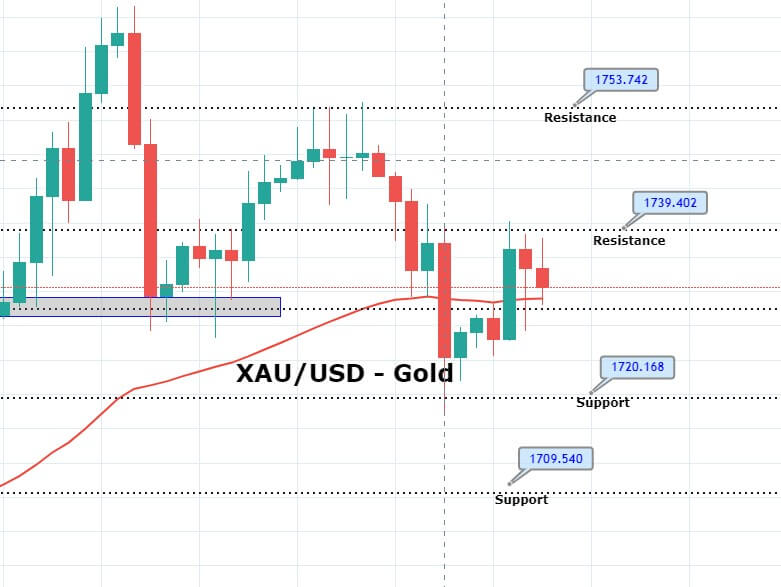
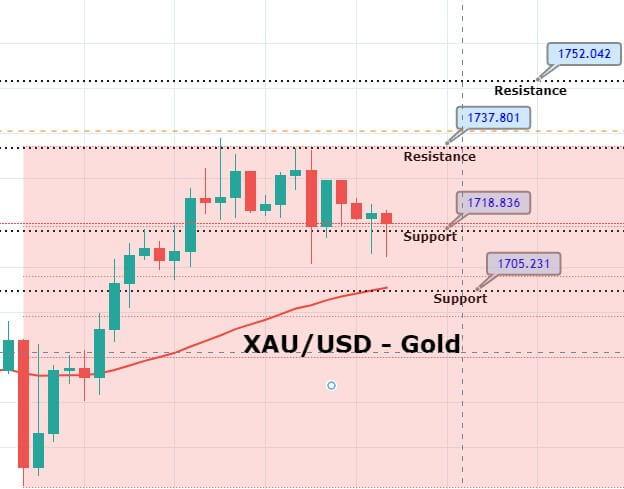
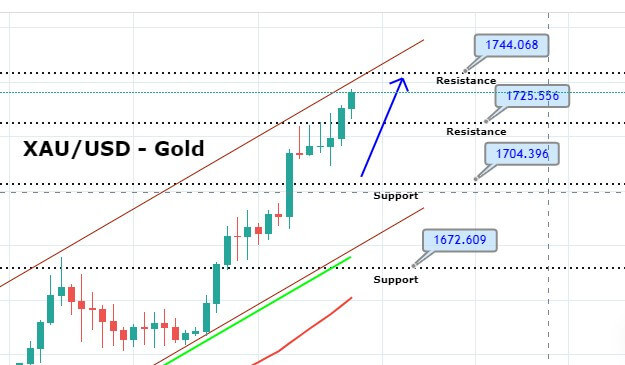
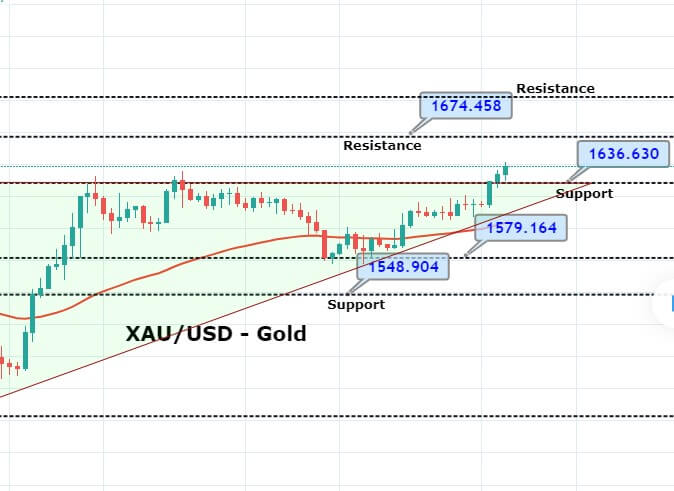
Daily Support and Resistance
| Support | Pivot | Resistance |
| 2019.8600 | 2027.4300 | 2035.9600 |
| 2011.3300 | 2043.5300 | |
| 2003.7600 | 2052.0600 |
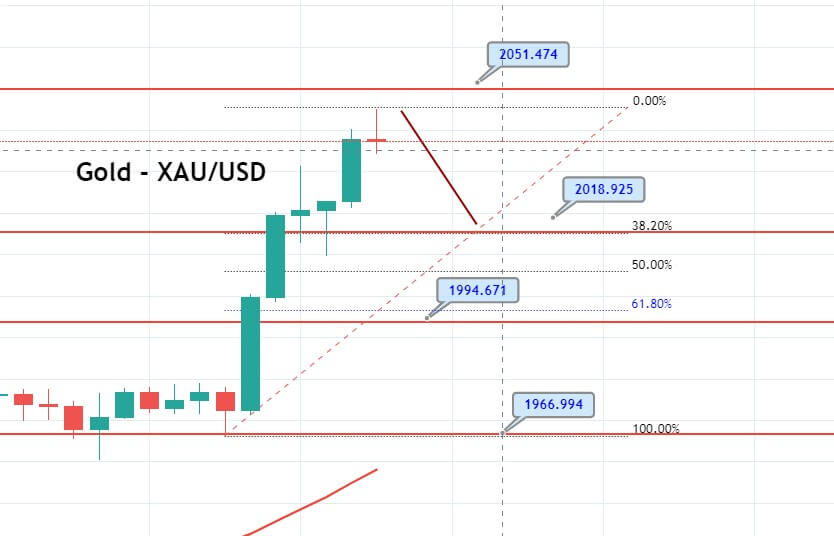
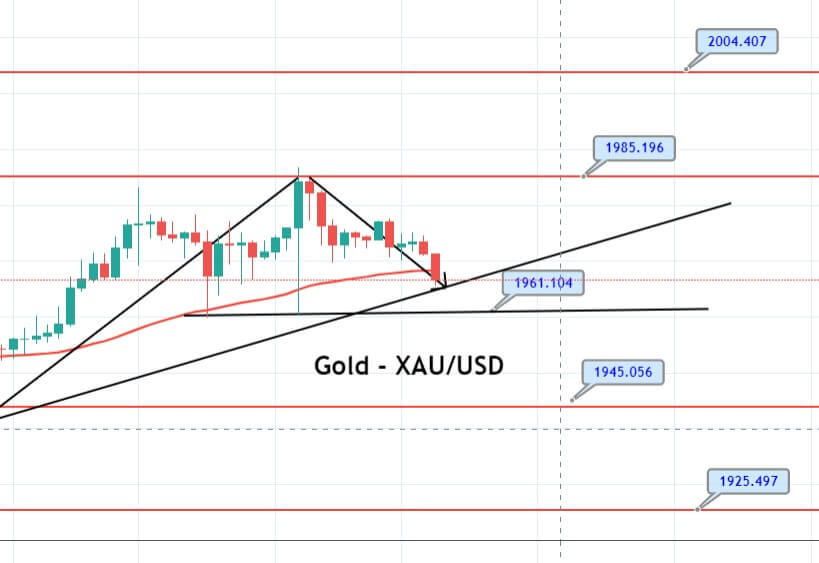
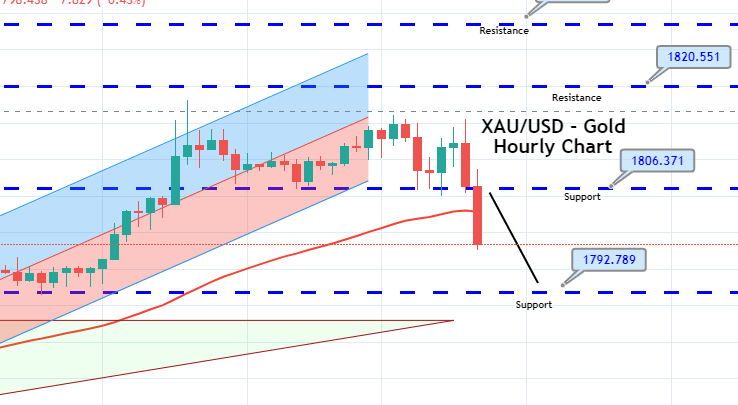
Gold is trading at 2034 level, and it has settled a Doji candle over the 2023 support zone. At the same time, resistance lingers at the 2036 level. Over this, gold prices can rise towards 2063 level, and bearish breakout of 2023 level can directly sell unto the 1998 level. We managed to close 29.6 green pips during the Asian session today, but the second signal later ended up in loss. Let’s wait for more signals later today. Good luck!