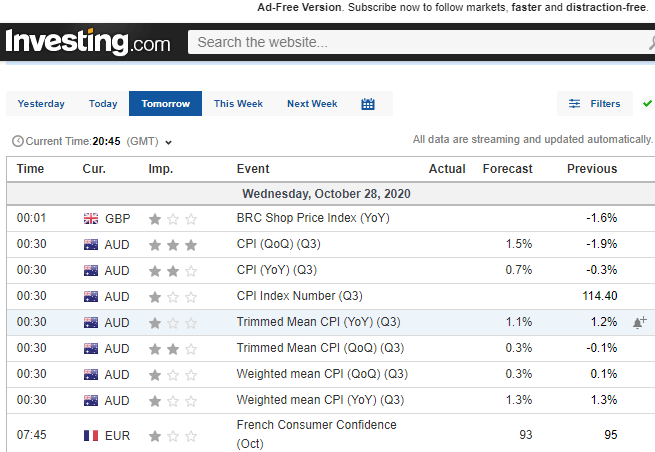
On Wednesday, the eyes will remain on the Fed Chair Powell Testifies, ADP Non-Farm Employment Change and Unemployment Rate from the Eurozone. A primary focus will remain on the ADP Non-Farm Employment Change as this will help investors determine the odds of actual NFP data, which is due on Friday.
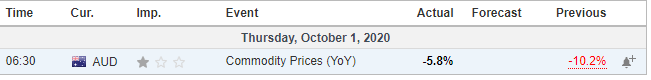
Economic Events to Watch Today
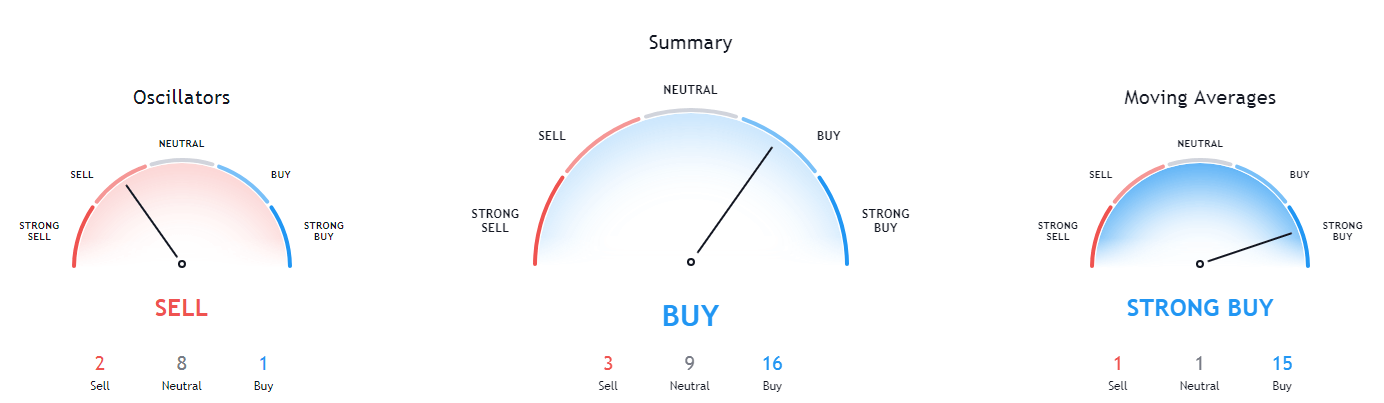
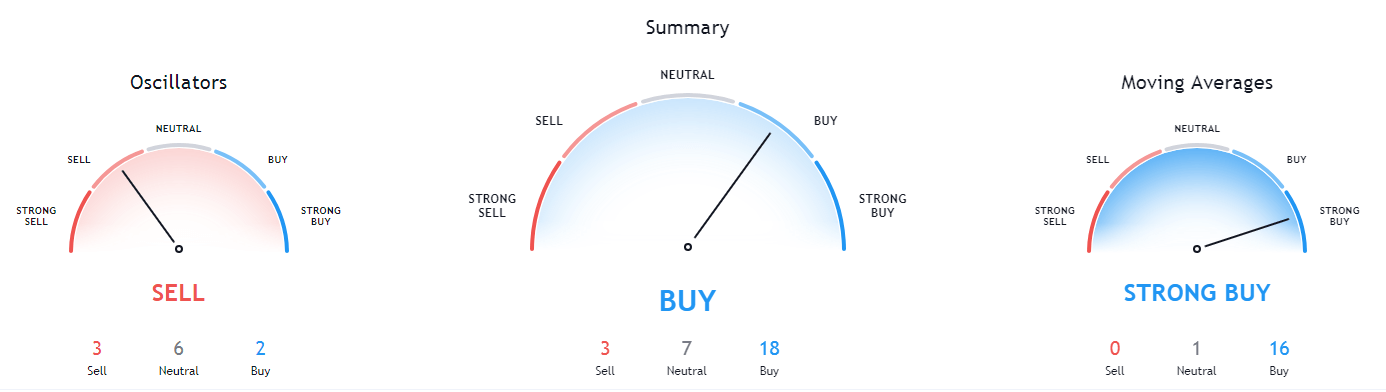
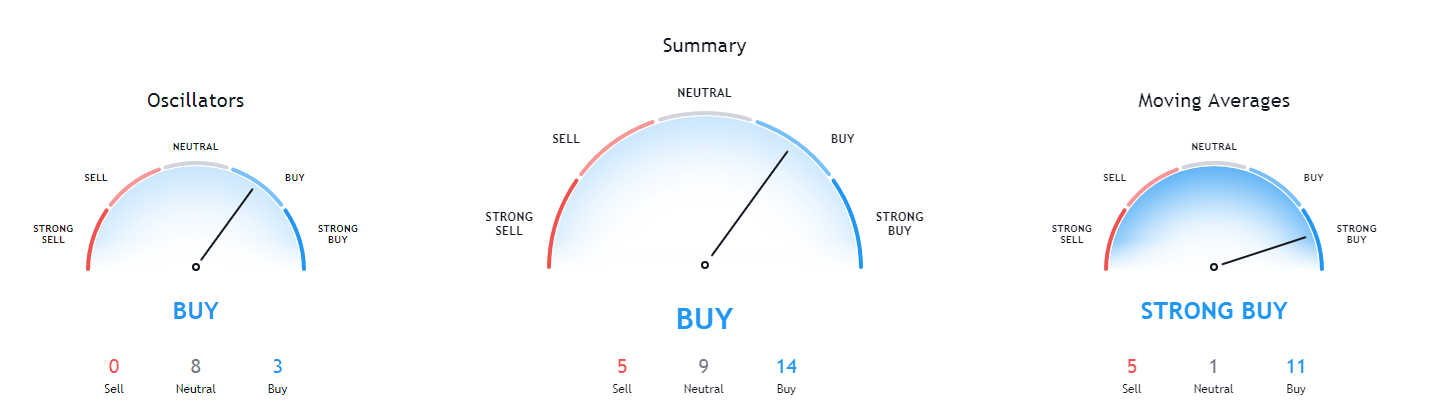
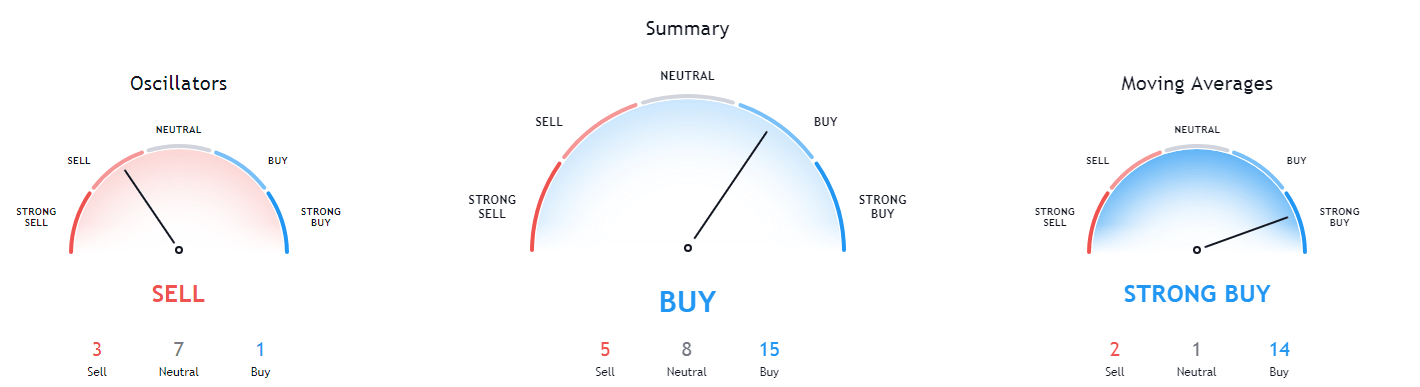
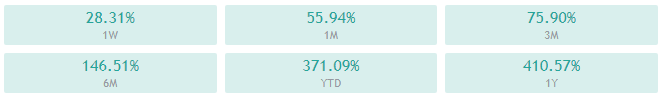
EUR/USD – Daily Analysis
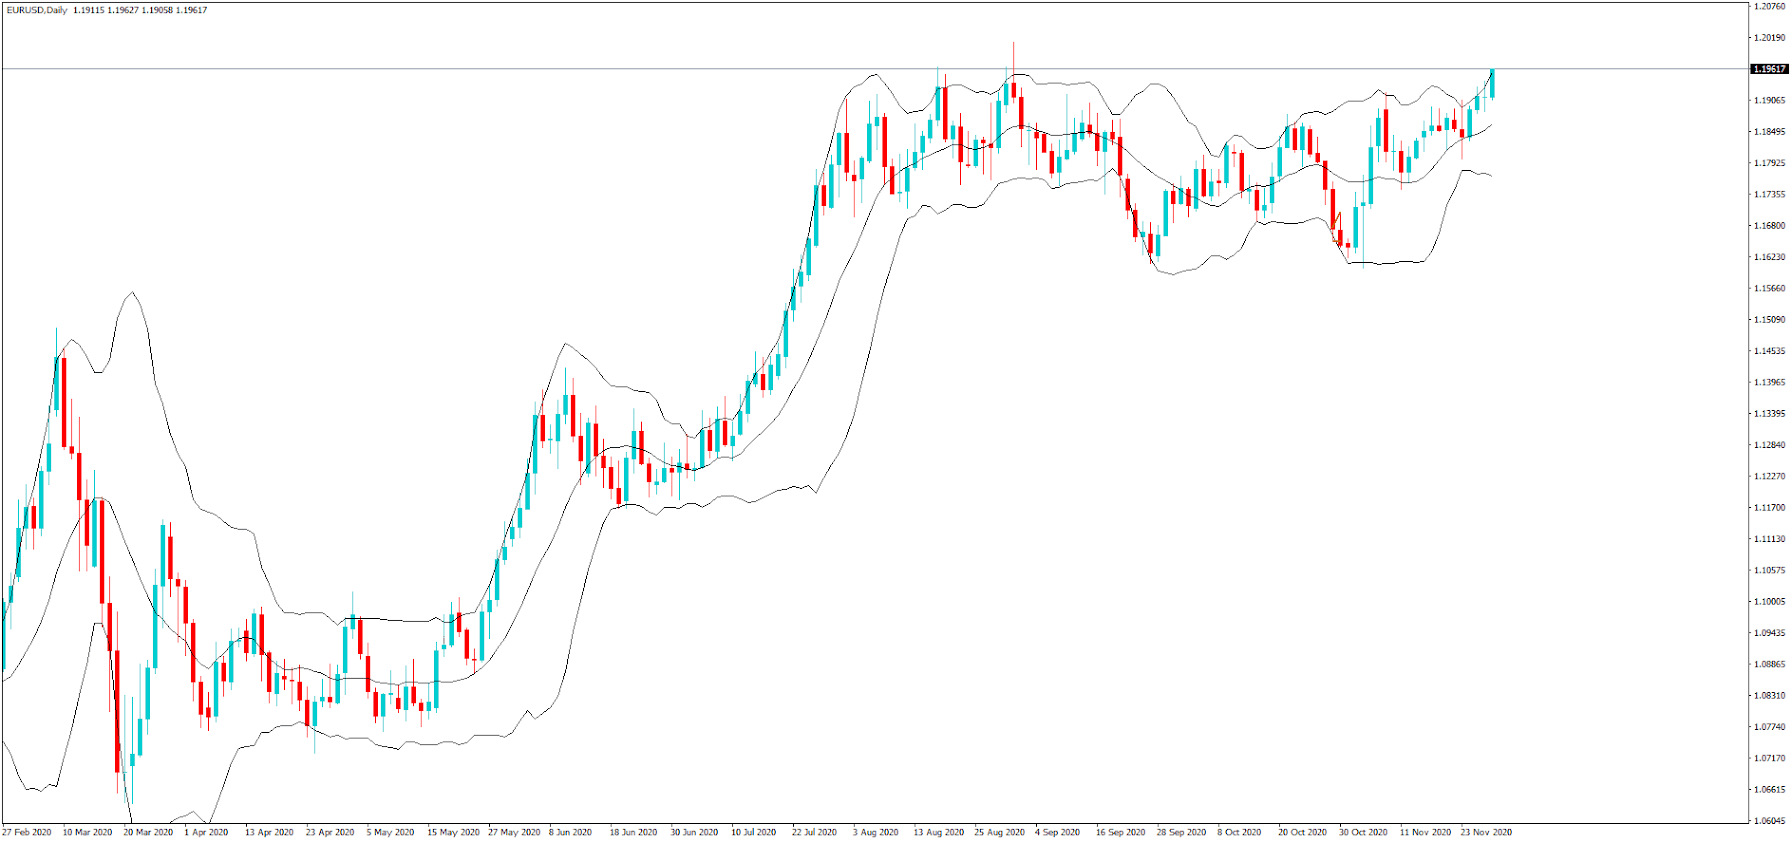
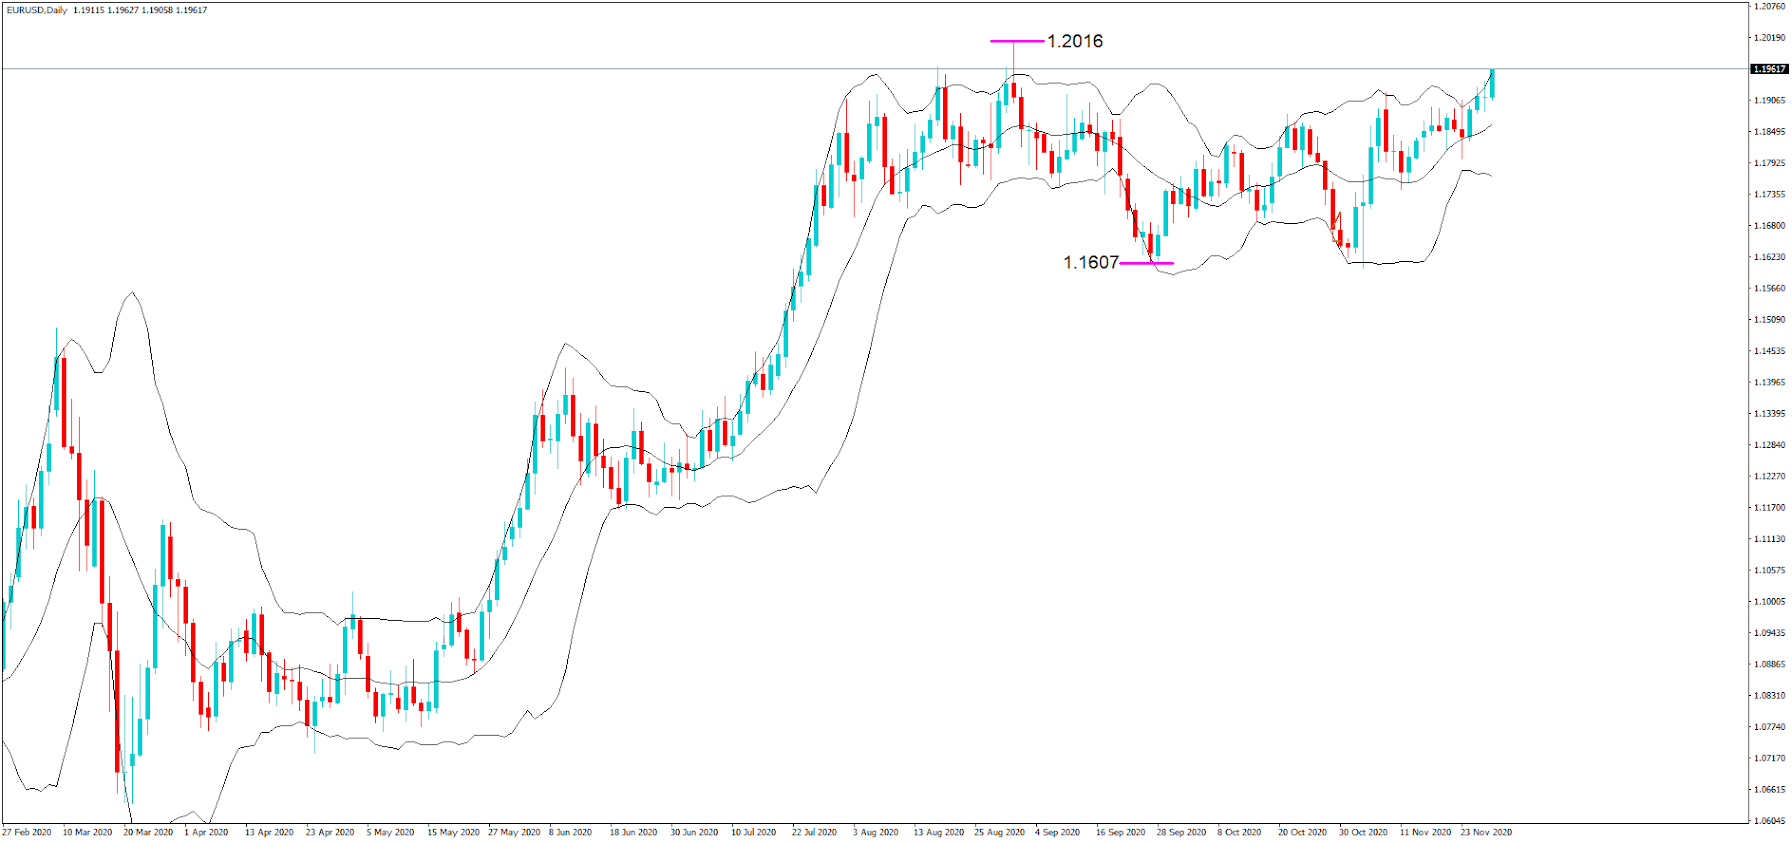
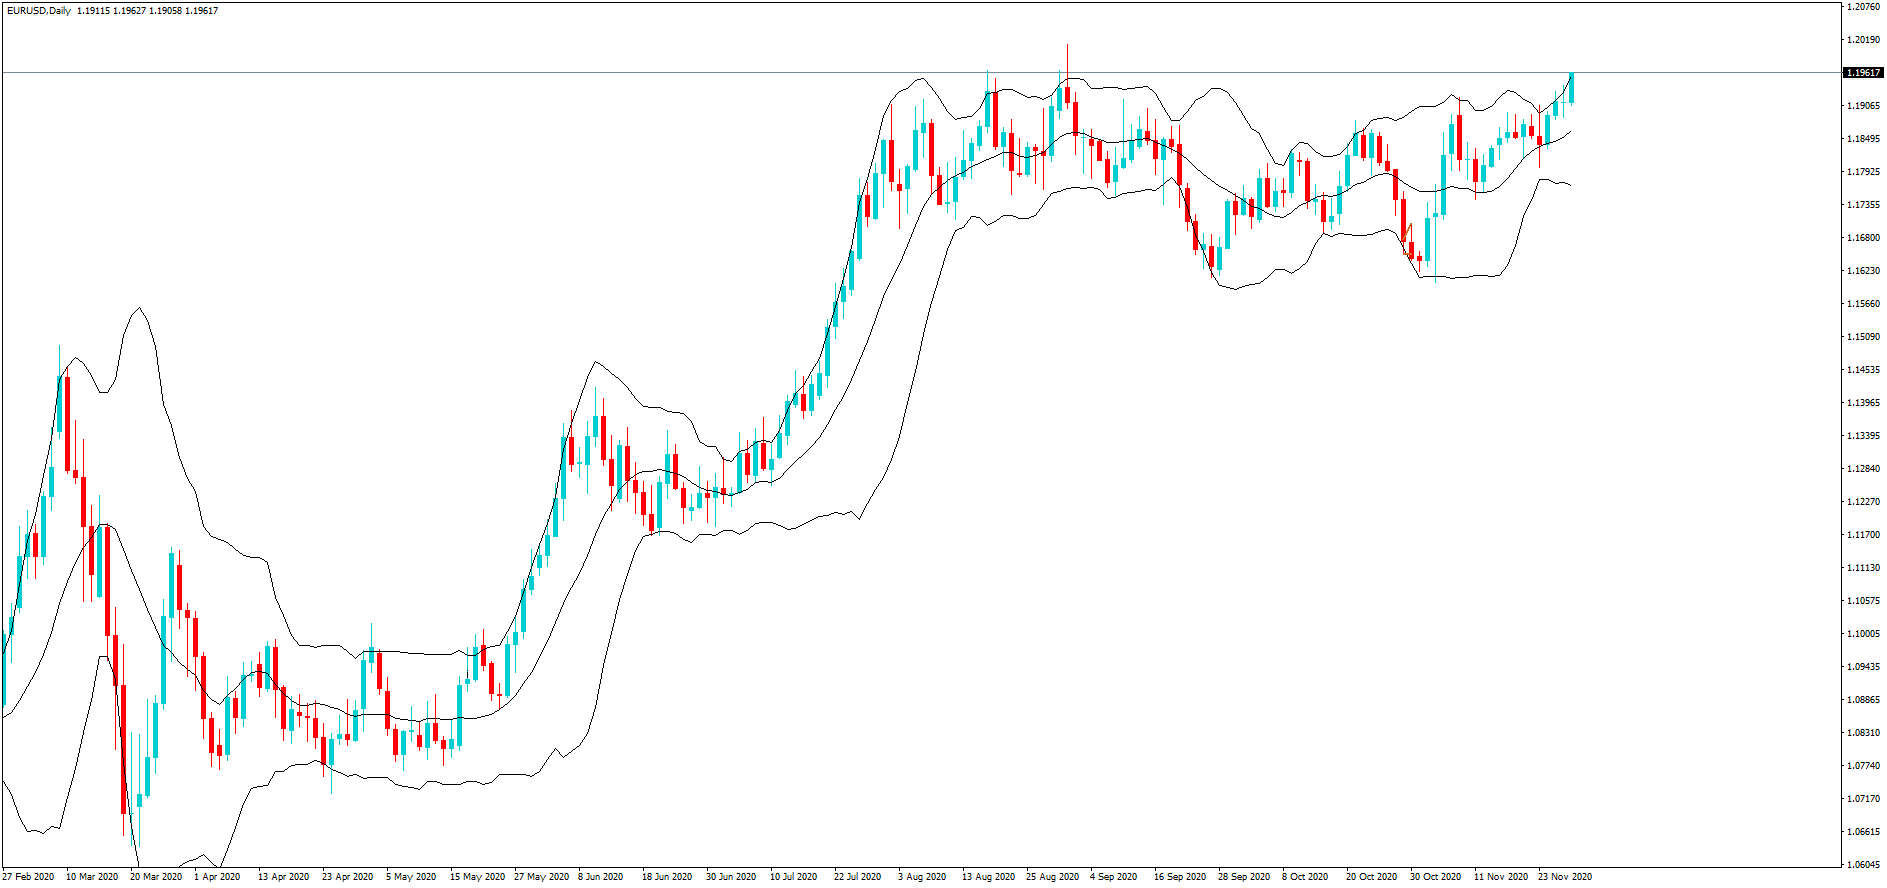
The EUR/USD closed at 1.20715 after placing a high of 1.20764 and a low of 1.19243. The EUR/USD surged above 1.2000 level and reached 1.20764 level, the highest level since May 2018 amid the optimism surrounding the coronavirus vaccine and broad-based U.S. dollar weakness.
Many factors were involved in the breakout of the EUR/USD pair on Tuesday above the 1.2000 level, including the latest optimism because of vaccine hopes, monetary stimulus from both sides, and the political certainty for a change.
Pfizer and BioNtech were the first to report a high efficacy of 95% in a phase-3 coronavirus immunization trial on November 09. After that, many drug companies, including Moderna, AstraZeneca, Novavax, and Oxford University, also followed them. Pfizer and Moderna have already applied for emergency use authorization from the US FDA, and soon after getting the approval, these vaccines will be available for usage. Even Pfizer has sent its first mass shipment of vaccine to Chicago on Monday. All this vaccine optimism pushed the safe-haven U.S. dollar down and raised the risk sentiment in the market that supported the upward momentum of the EUR/USD pair on Tuesday.
On the stimulus front, the European Central Bank and the U.S. Federal Reserve were set to expand their bond-buying schemes. Since the pandemic has started, the stimulus aid from ECB has supported the Eurozone’s economy by allowing governments to spend more. In the United States, the Federal Reserve’s dollar printing triggered a broad risk-on mood that also helped the riskier assets like EUR/USD pair to rise.
On the Political certainty front, the U.S. elections have declared a final winner- Joe Biden. While outgoing President Donald Trump has been continuously crying foul, his attempts to overturn the elections failed, and investors continued to price the Joe Biden victory and selling the U.S. dollar. Moreover, the nomination of Janet Yellen as Treasury Secretary was also reassuring.
On the E.U. front, the political development in the upcoming Brexit deal has entered a tunnel as an intense final round of talks is in progress, and the results of talks are yet to be declared. All these factors combined and supported the EUR/USD pair’s upward momentum on Tuesday.
On the data front, at 13:15 GMT, the Spanish manufacturing PMI for November declined to 49.8 against the forecasted 50.8 and weighed on Euro. At 13:45 GMT, the Italian Manufacturing PMI also dropped to 51.5 against the projected 52.0 and weighed on the single currency. At 13:50 GMT, the French Final Manufacturing PMI raised to 49.6 from the expected 49.1 and supported Euro. AT 13:55 GMT, the German Final Manufacturing PMI stayed the same at 57.8. The German Unemployment Change came in as -39K against the expected 9K and supported the single currency. At 14:00 GMT, the Final Manufacturing PMI from the Eurozone remained flat with the expected 53.8. At 15:00 GMT, the CPI Flash Estimate for the year dropped to -0.3% against the estimated -0.2% and weighed n Euro. The Core CPI Flash Estimate for the year came in line as expected 0.2%.
On the U.S. front, at 20:00 GMT, the ISM Manufacturing PMI for November fell to 5.75 against the forecasted 5.9 and weighed on the U.S. dollar and supported the upward momentum of the EUR/USD pair. The Construction Spending for October surged to 1.3% against the estimated 0.8% and supported the U.S. dollar. The ISM Manufacturing Prices for November also surged to 65.4 against the forecasted 65.0 and helped the U.S. dollar. The Wards Total Vehicle Sales from the U.S. declined to 15.6M against the estimated 16.1M and weighed on the U.S. dollar that added further gains in EUR/USD pair.
Given the above manufacturing data, the Eurozone economy’s outlook looks somewhat better than the United States outlook that added extra pressure on the U.S. dollar and helped the EUR/USD pair to place highs above the 1.200 level on Tuesday.
Daily Technical Levels
Support Resistance
1.1971 1.2122
1.1873 1.2175
1.1819 1.12273
Pivot point: 1.2024
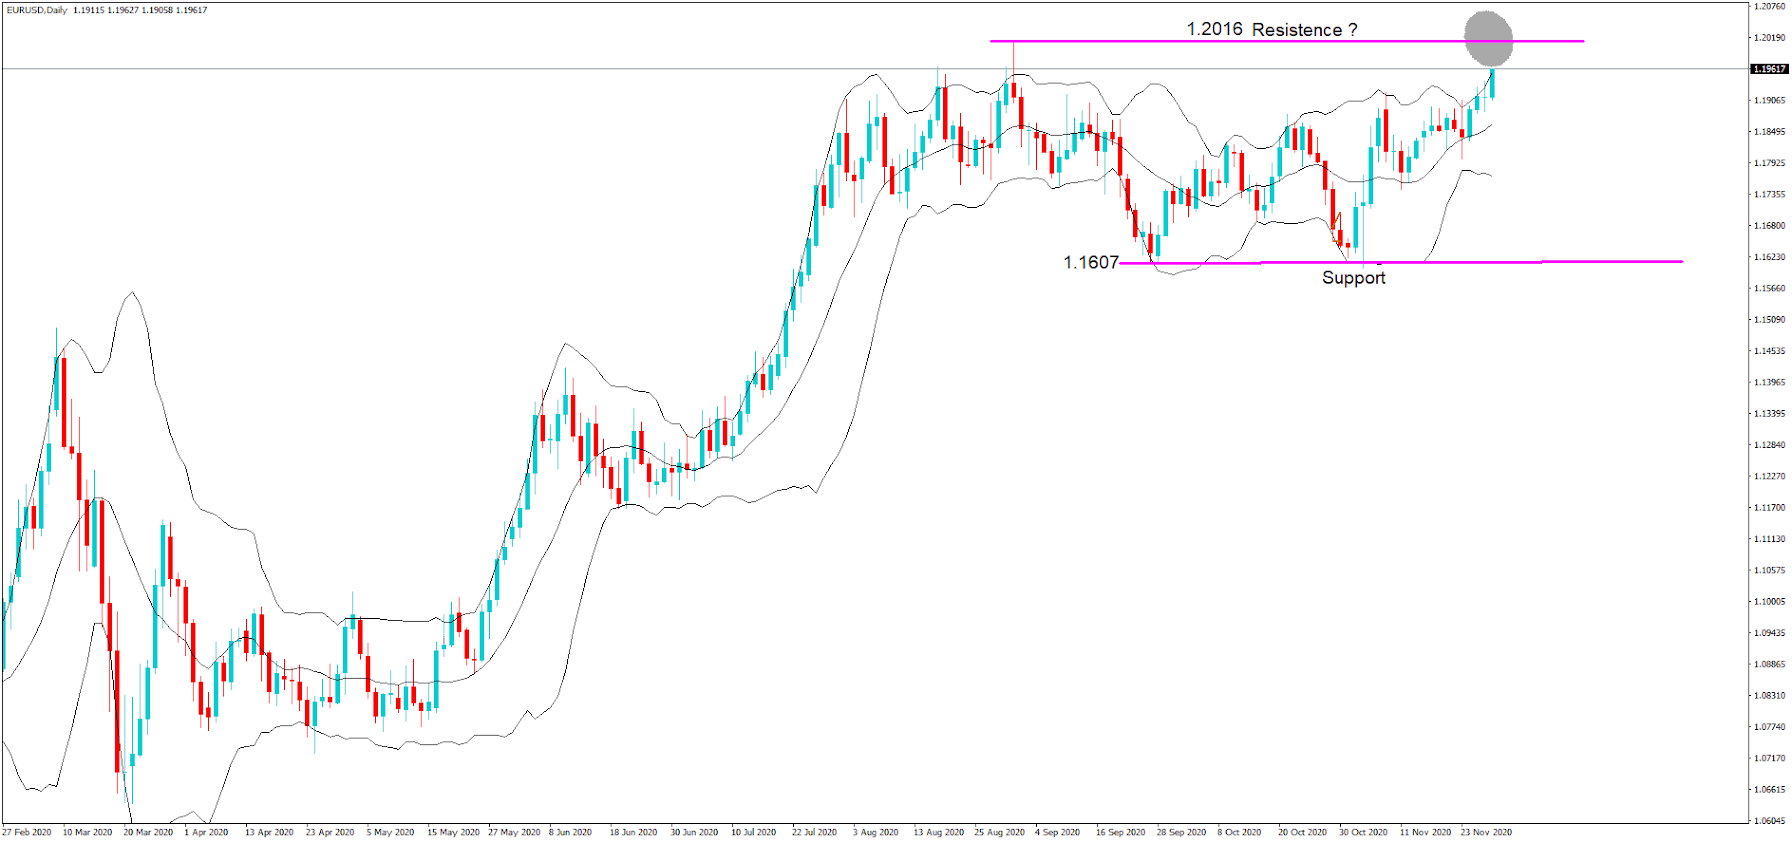
EUR/USD– Trading Tip
The EUR/USD surged dramatically on the back of risk-on sentiment amid positive reports over the COVID19 vaccine, which dragged the pair higher above the 1.2074 level. On the higher side, the violation of the 1.2010 resistance level is now working as a support, and it can lead the pair further higher until 1..2160. The bullish bias remains dominant today, especially over the 1.2015 level. However, the EUR/USD pair has recently formed a tweezers top pattern around 1.2076, suggesting the odds of bearish retracement. In this case, the EUR/USD can also drop until the support level of 1.2017 that marks 23.6% Fibonacci retracement. Let’s keep an eye on the 1.2060 support level today.
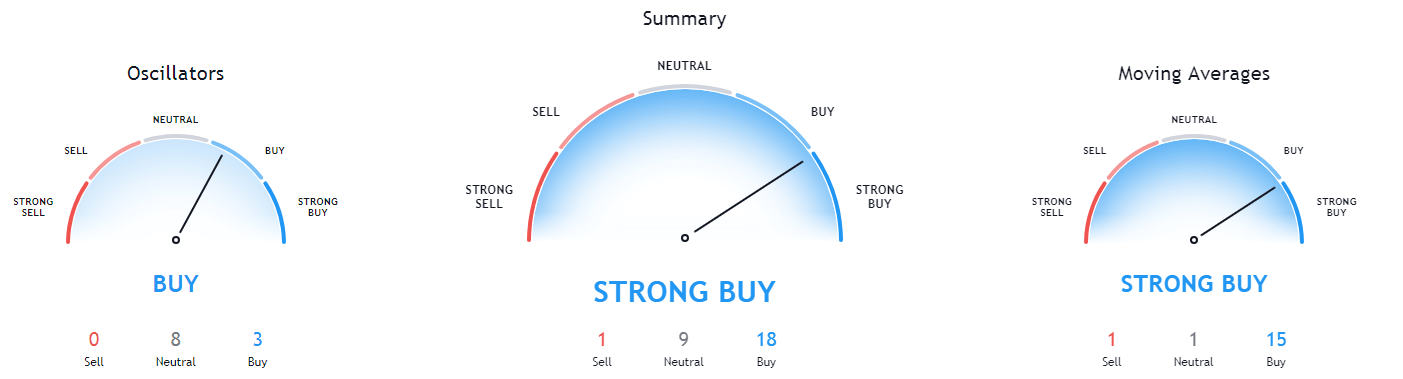
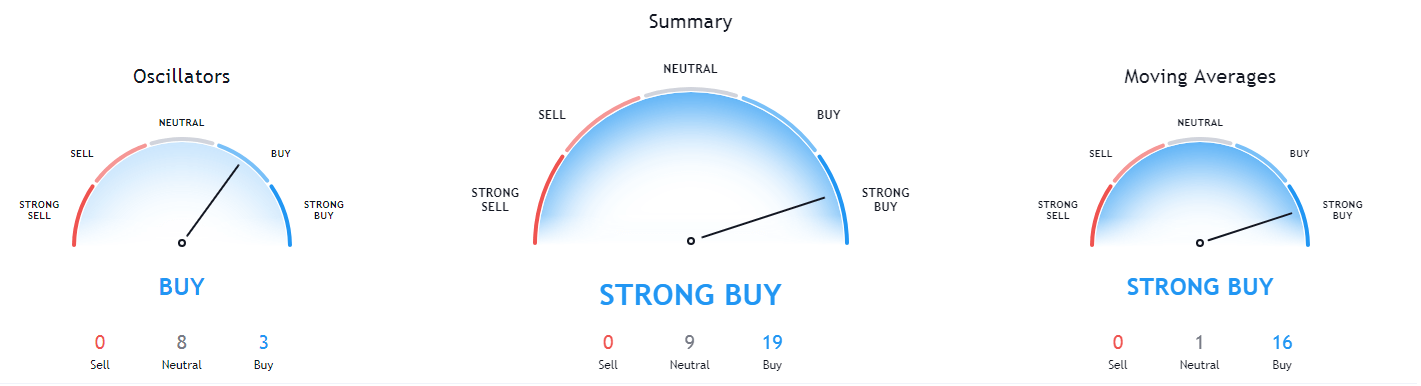
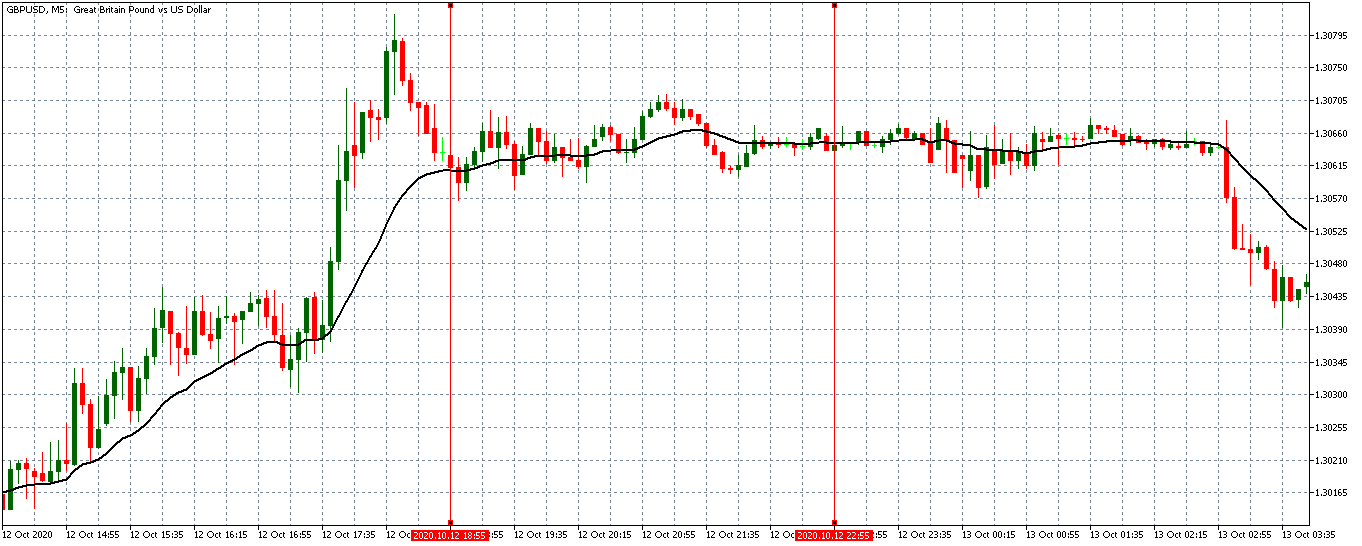
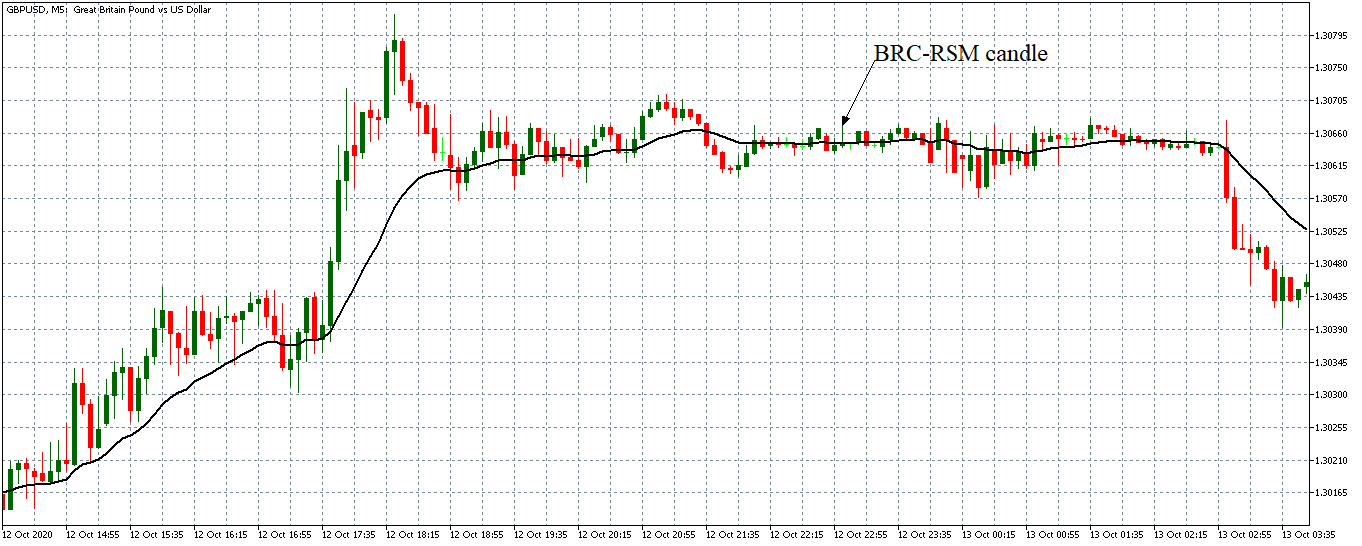
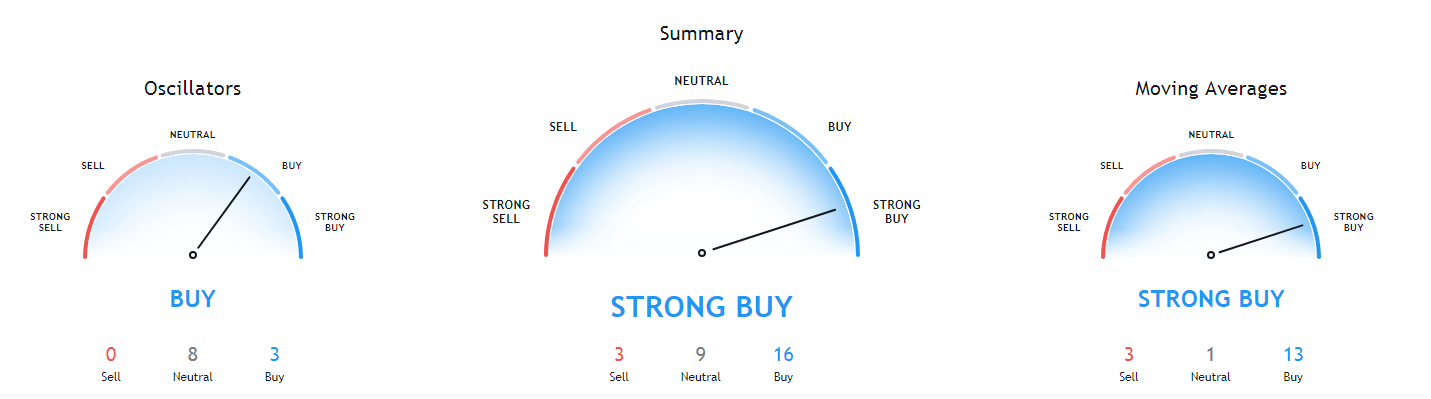
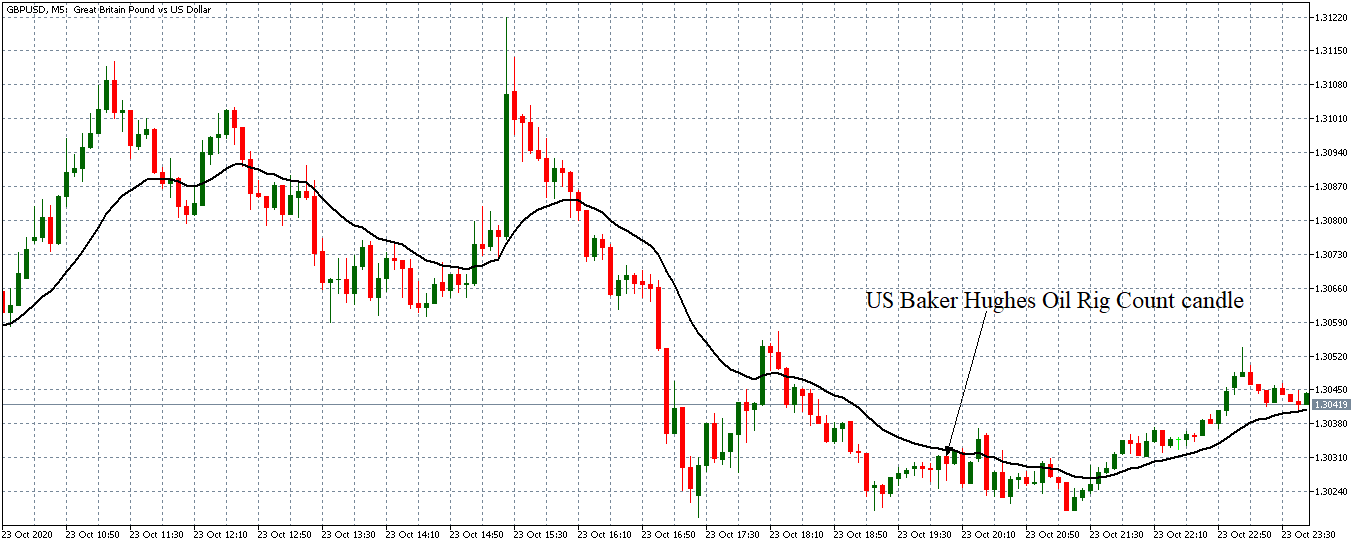
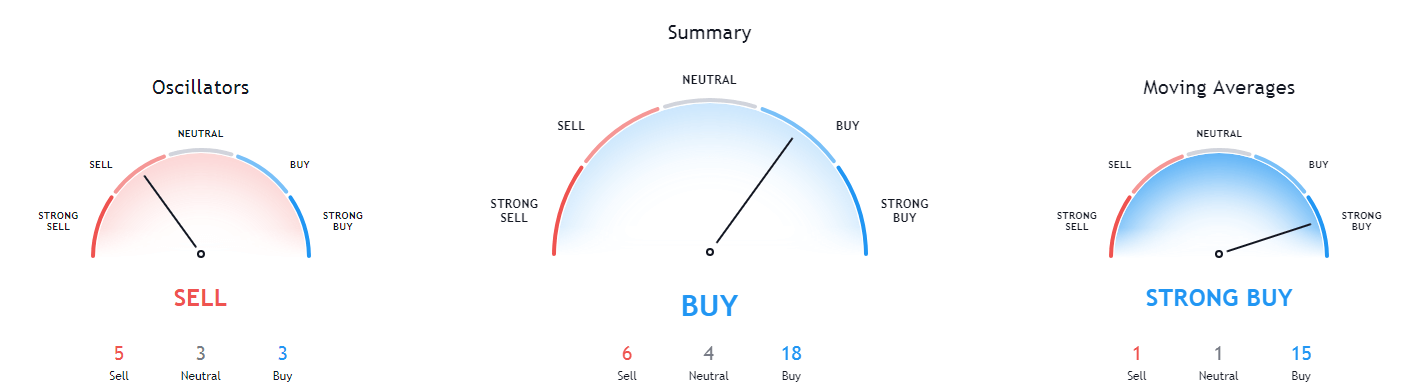
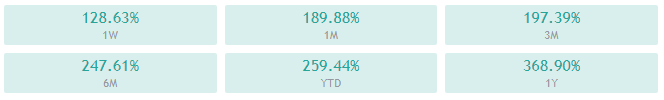
GBP/USD – Daily Analysis
The GBP/USD closed at 1.34224 after placing a high of 1.34424 and a low of 1.33149. After placing losses for three consecutive days, the GBP/USD pair rose on Tuesday and recorded gains on the back of broad-based U.S. dollar weakness and increased Brexit hopes. The GBP/USD pair hit the highs at 1.3400 level on Tuesday over the positive Brexit news after the Times Radio’s Chief Political Commentator Tom Newton Dunn tweeted the U.K. and E.U. trade deal talks have entered a mythical tunnel. Though either side formally confirmed or rejected the “tunnel” status of negotiations after his tweet.
The tunnel refers to a state of intense negotiation that essentially ends up having some agreement between both parties, and before that, neither side leaves. Though it does not guarantee a deal will be made, it shows a strong willingness/commitment from both sides to work as hard as possible to get a compromise. After this tweet by Dunn, the GBP/USD pair started to gain traction and rise in the financial market due to increased demand for British Pound.
On the other hand, the GBP/USD pair’s gains could also be attributed to the U.S. dollar’s weakness. The greenback was weak across the board after the release of poor macroeconomic data and the rising number of coronavirus cases in the U.S.
The top U.S. health officials announced plans on Tuesday to begin vaccinating Americans against the coronavirus as early as mid-December amid the increasing death from coronavirus. The nationwide deaths hit the highest number for a single day in six months in the U.S. and raised economic recovery fears that led to the U.S. dollar’s weakness and improved GBP/USD pair.
On the data front, at 20:00 GMT, the ISM Manufacturing PMI for November declined to 5.75 against the estimated 5.9 and weighed on the U.S. dollar and supported the bullish momentum of the GBP/USD pair. For October, the Construction Spending rose to 1.3% against the projected 0.8% and helped the U.S. dollar. The ISM Manufacturing Prices for November also raised to 65.4 against the estimated 65.0 and supported the U.S. dollar. The Wards Total Vehicle Sales from the U.S. fell to 15.6M against the anticipated 16.1M and weighed on the U.S. dollar that added further gains in GBP/USD pair.
On Britain front, at 12:00 GMT, the Nationwide HPI for November raised to 0.9% against the forecasted 0.2% and supported the British Pound that added further gains in GBP/USD pair on Tuesday. At 14:30 GMT, the Final Manufacturing PMI also raised to 55.6 against the expected 55.2 and supported the British Pound that added further gains in GBP/USD pair.
Daily Technical Levels
Support Resistance
1.3316 1.3342
1.3301 1.3353
1.3290 1.3368
Pivot point: 1.3327
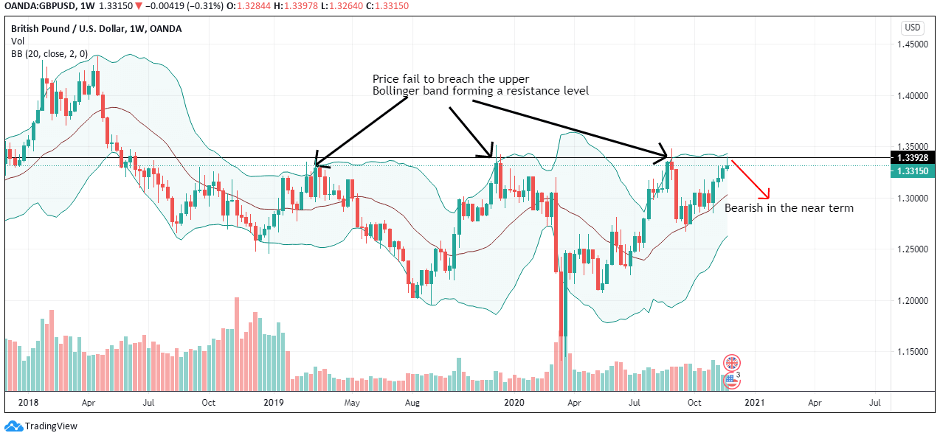
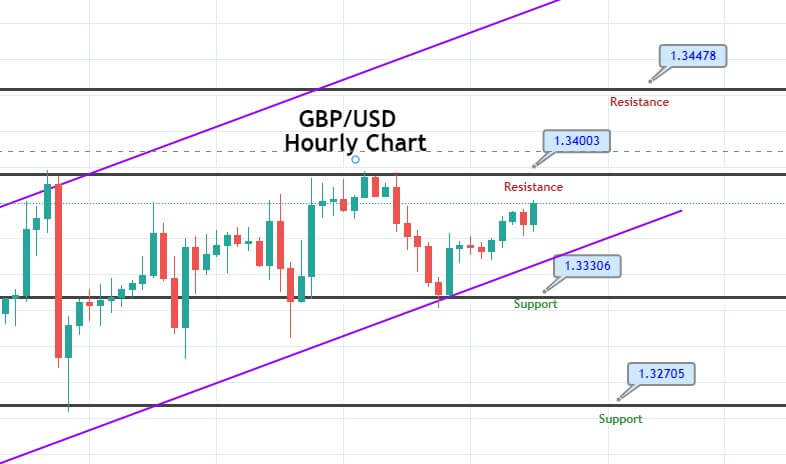
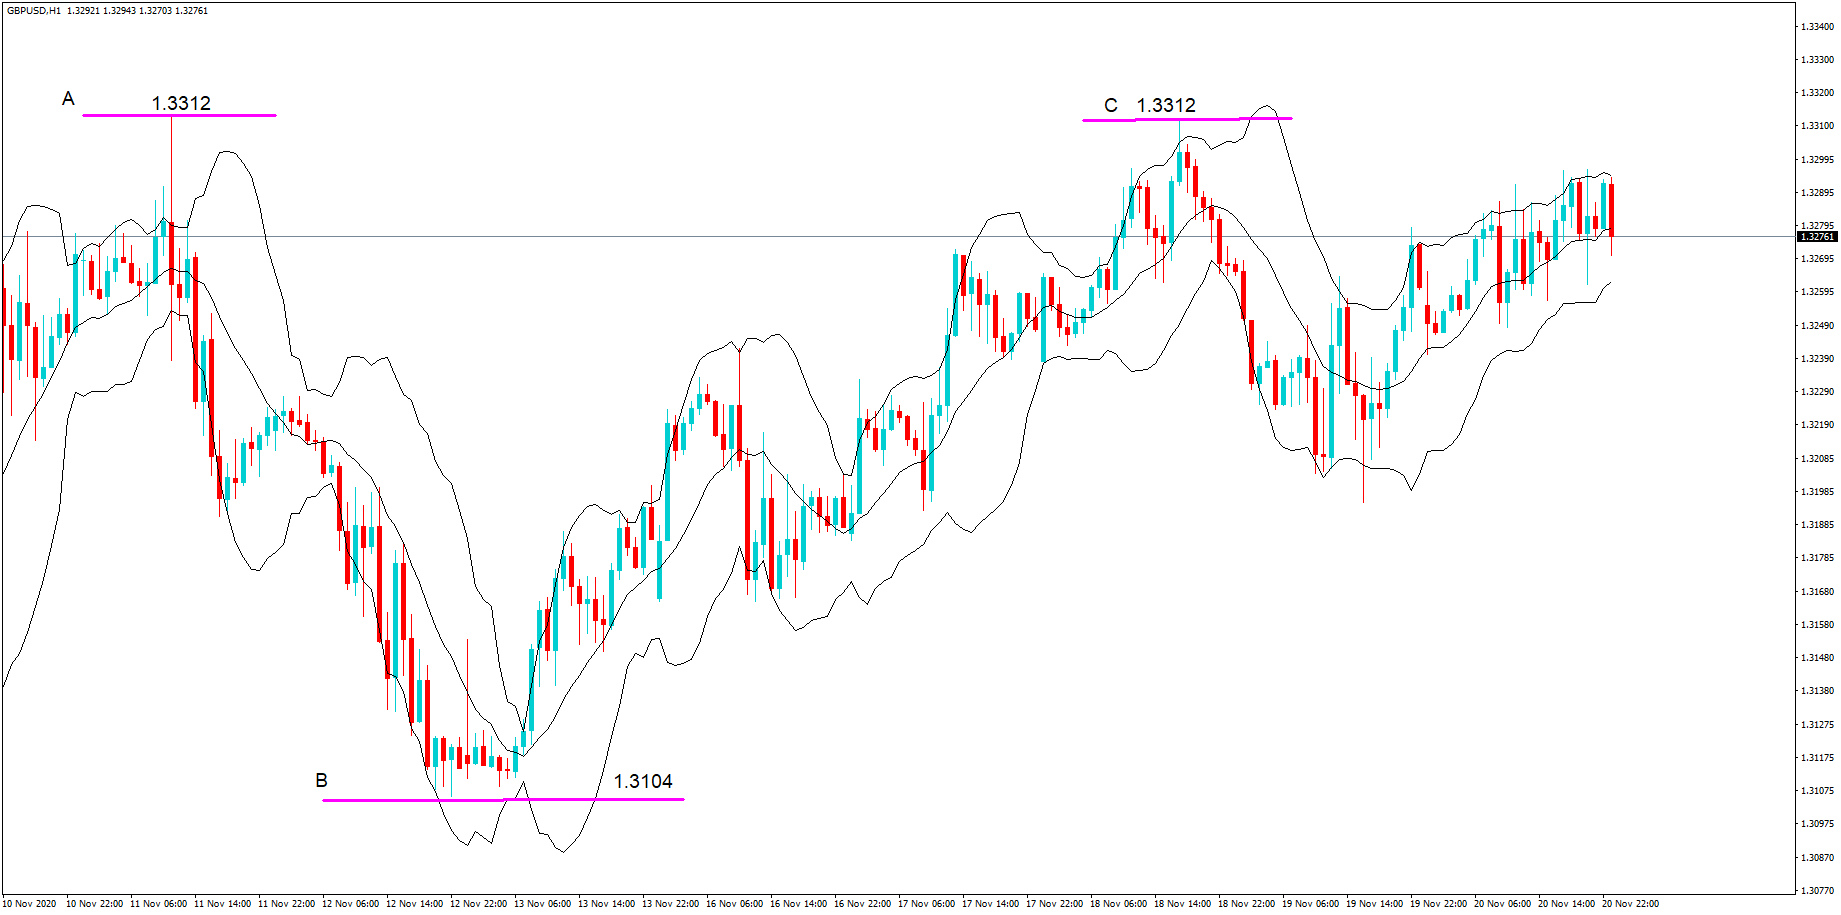
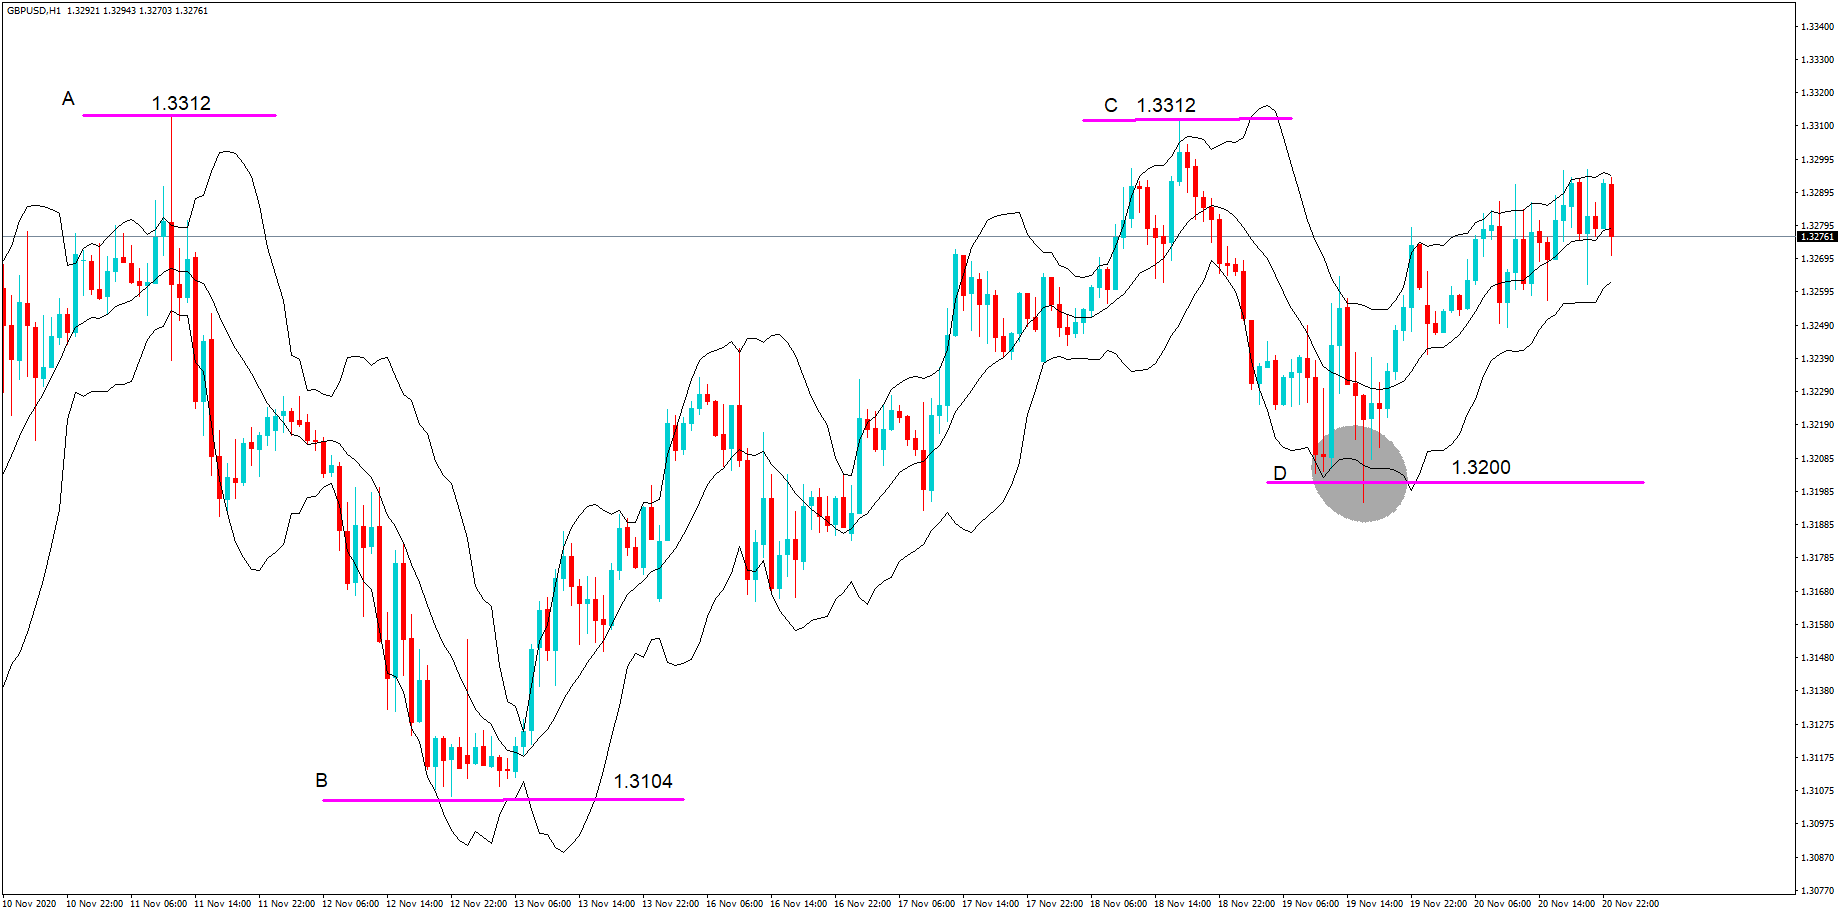
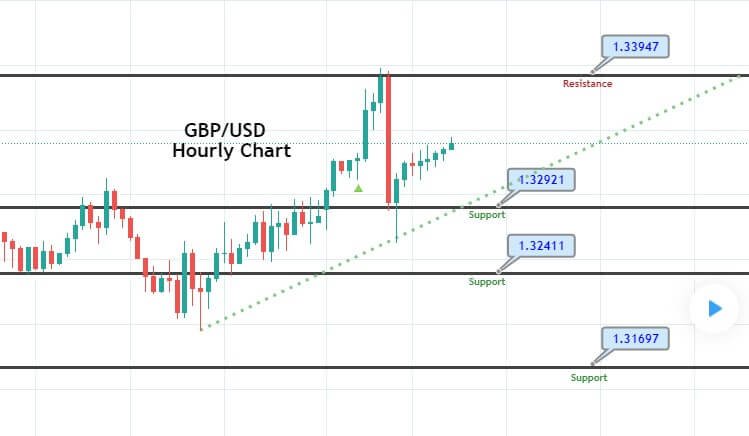
GBP/USD– Trading Tip
The GBP/USD is trading sideways, having violated the narrow trading range of 1.3397 – 1.3304. The market is expected to display choppy sessions with a new limited range of 1.3397 to 1.3452 level. The violation of a triple top resistance level of 1.3397 level is now working as a support, and it may trigger a bounce off in the Cable until 1.3452 and 1.3512 level. Let’s keep an eye on the 1.3397 level to stay bullish above this level today.
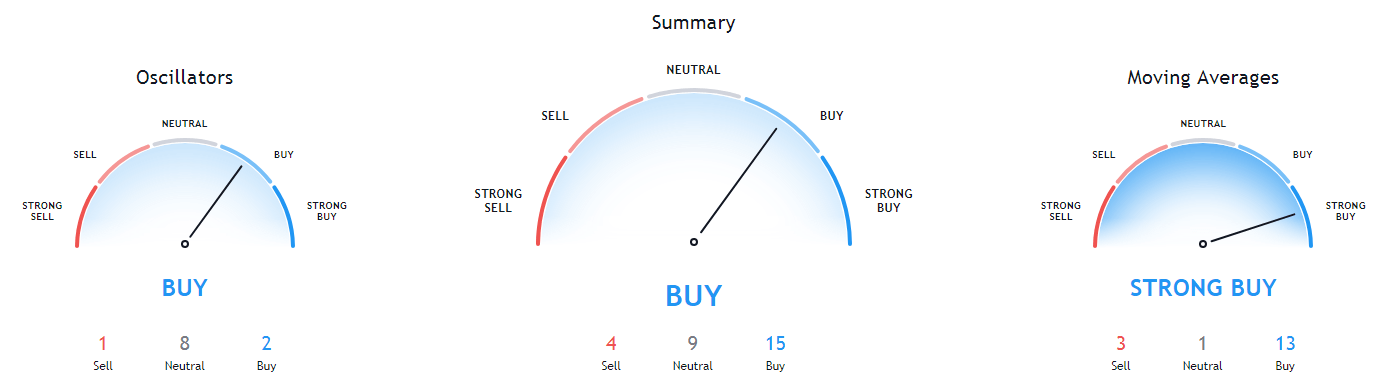
USD/JPY – Daily Analysis
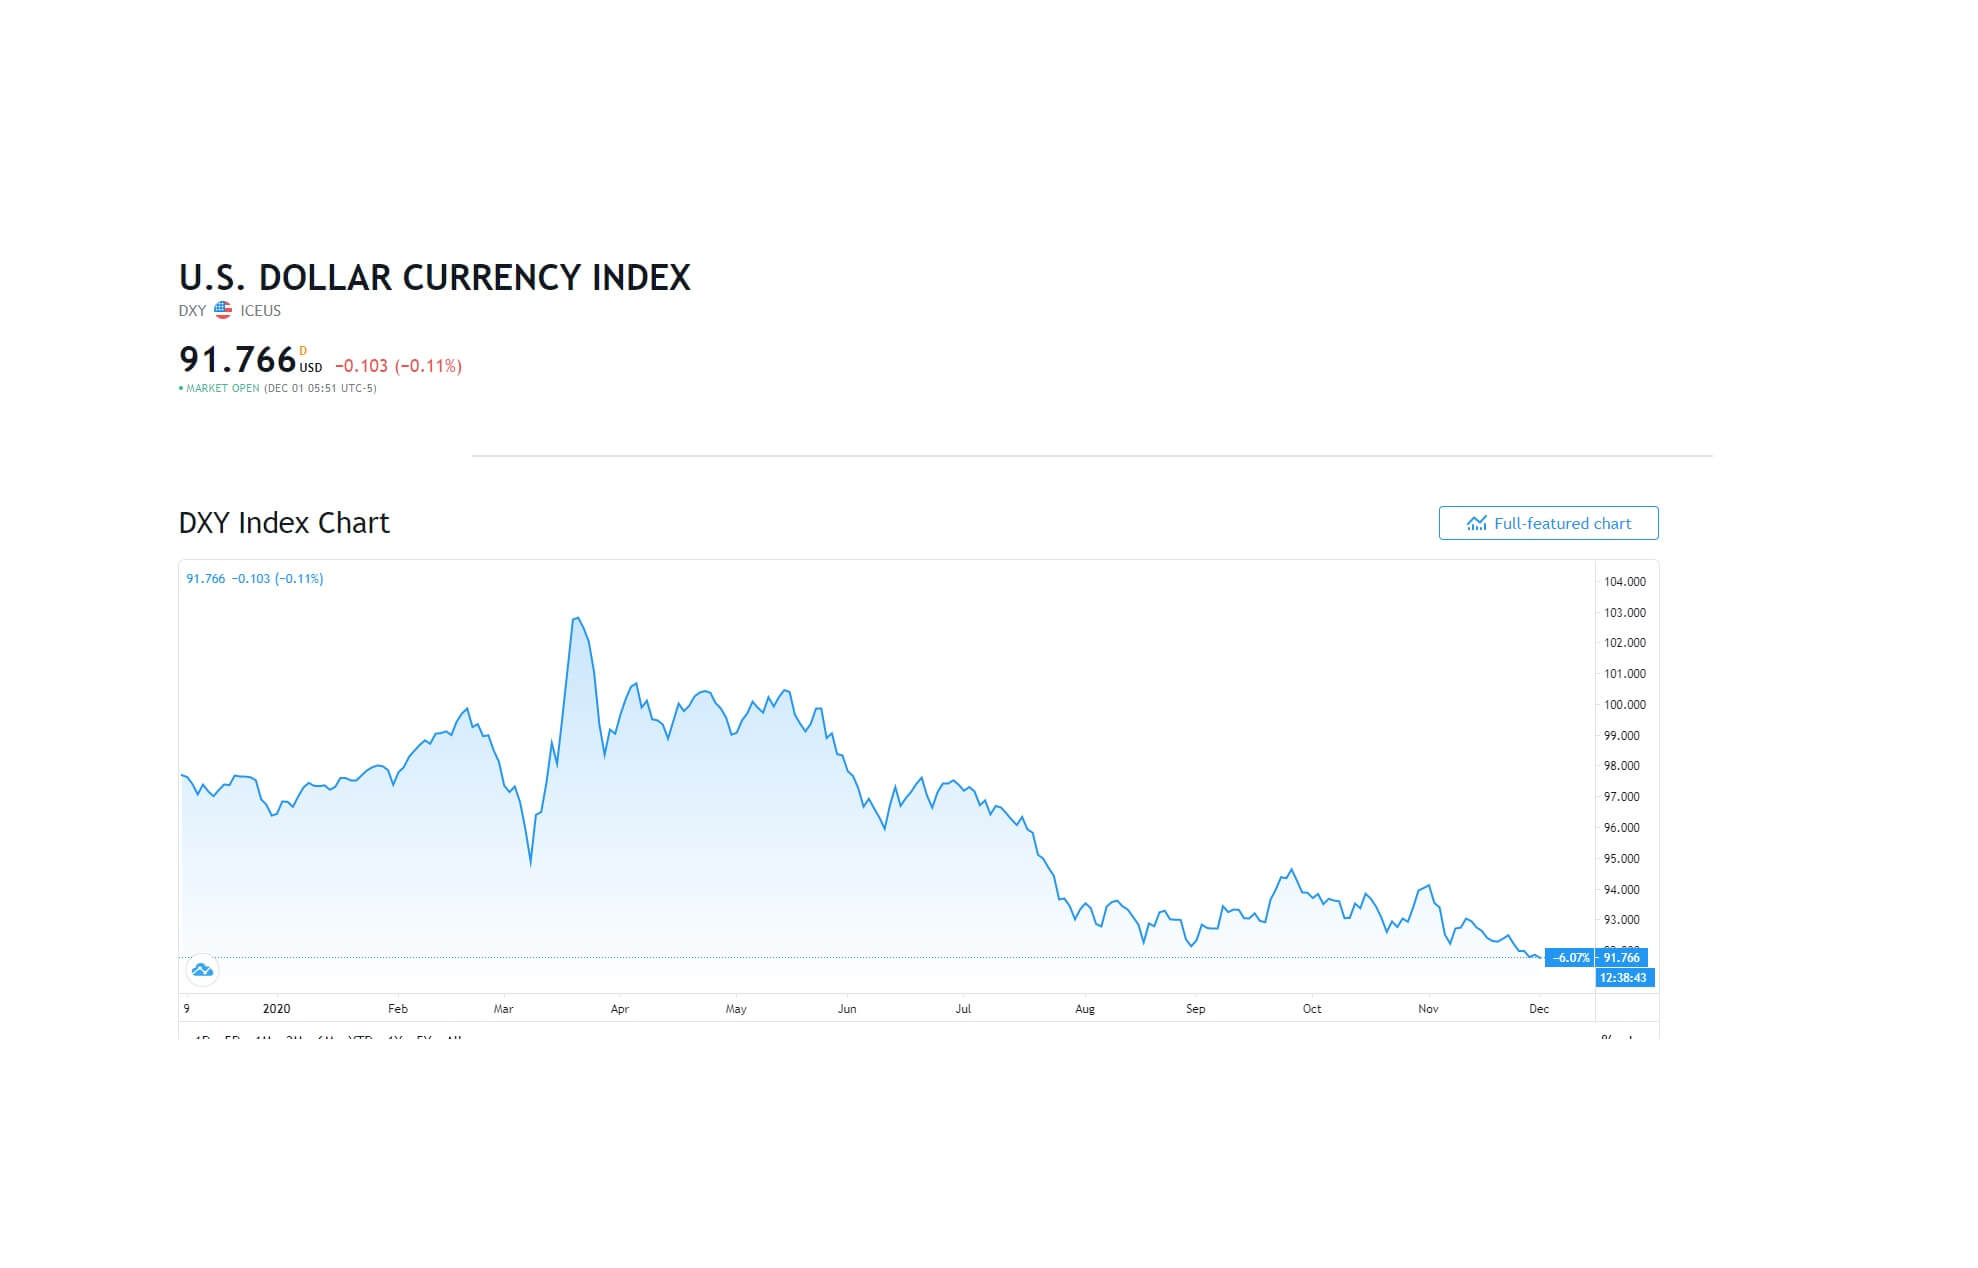
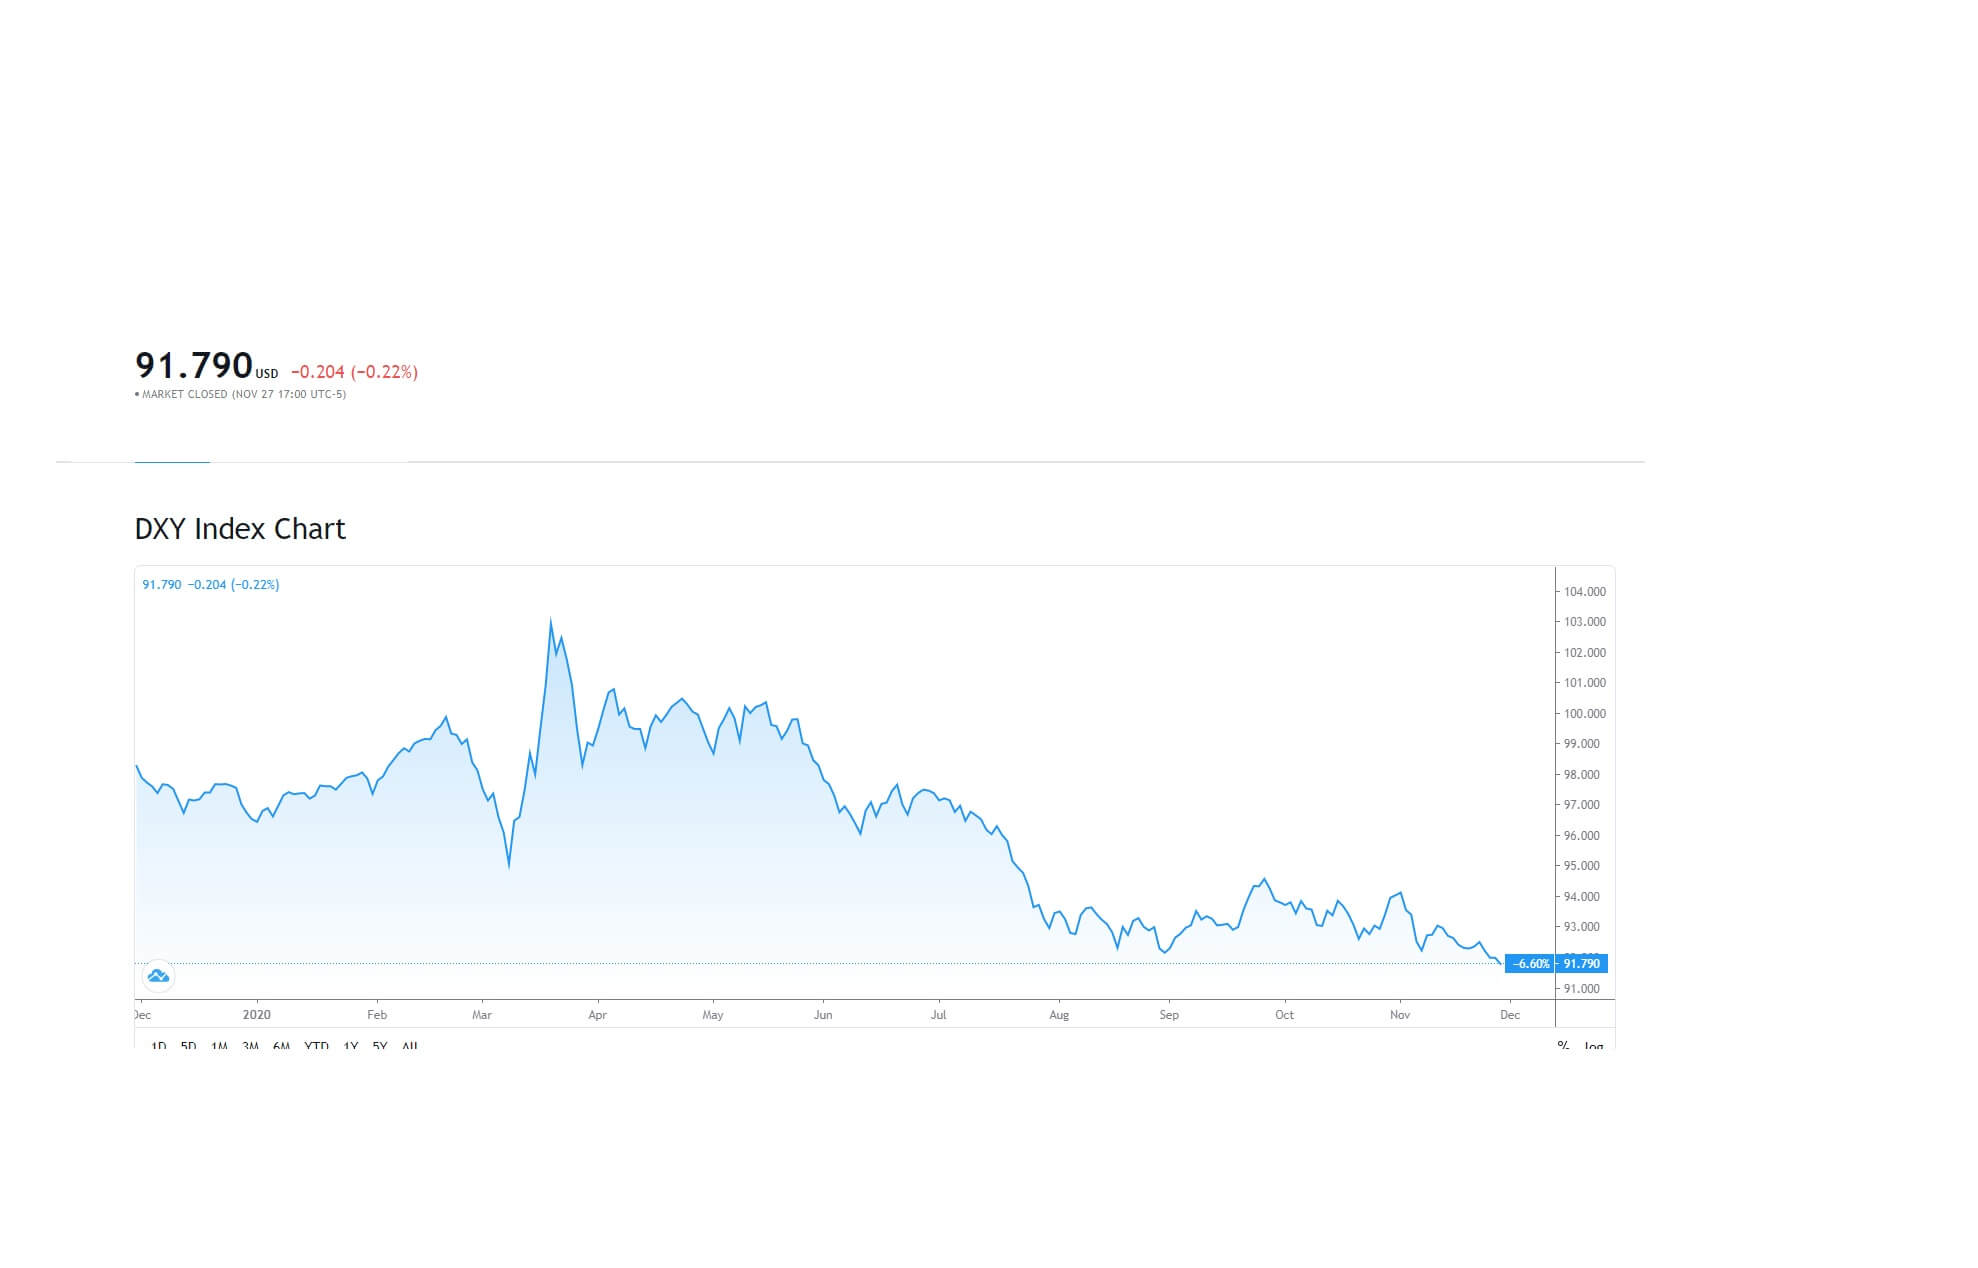
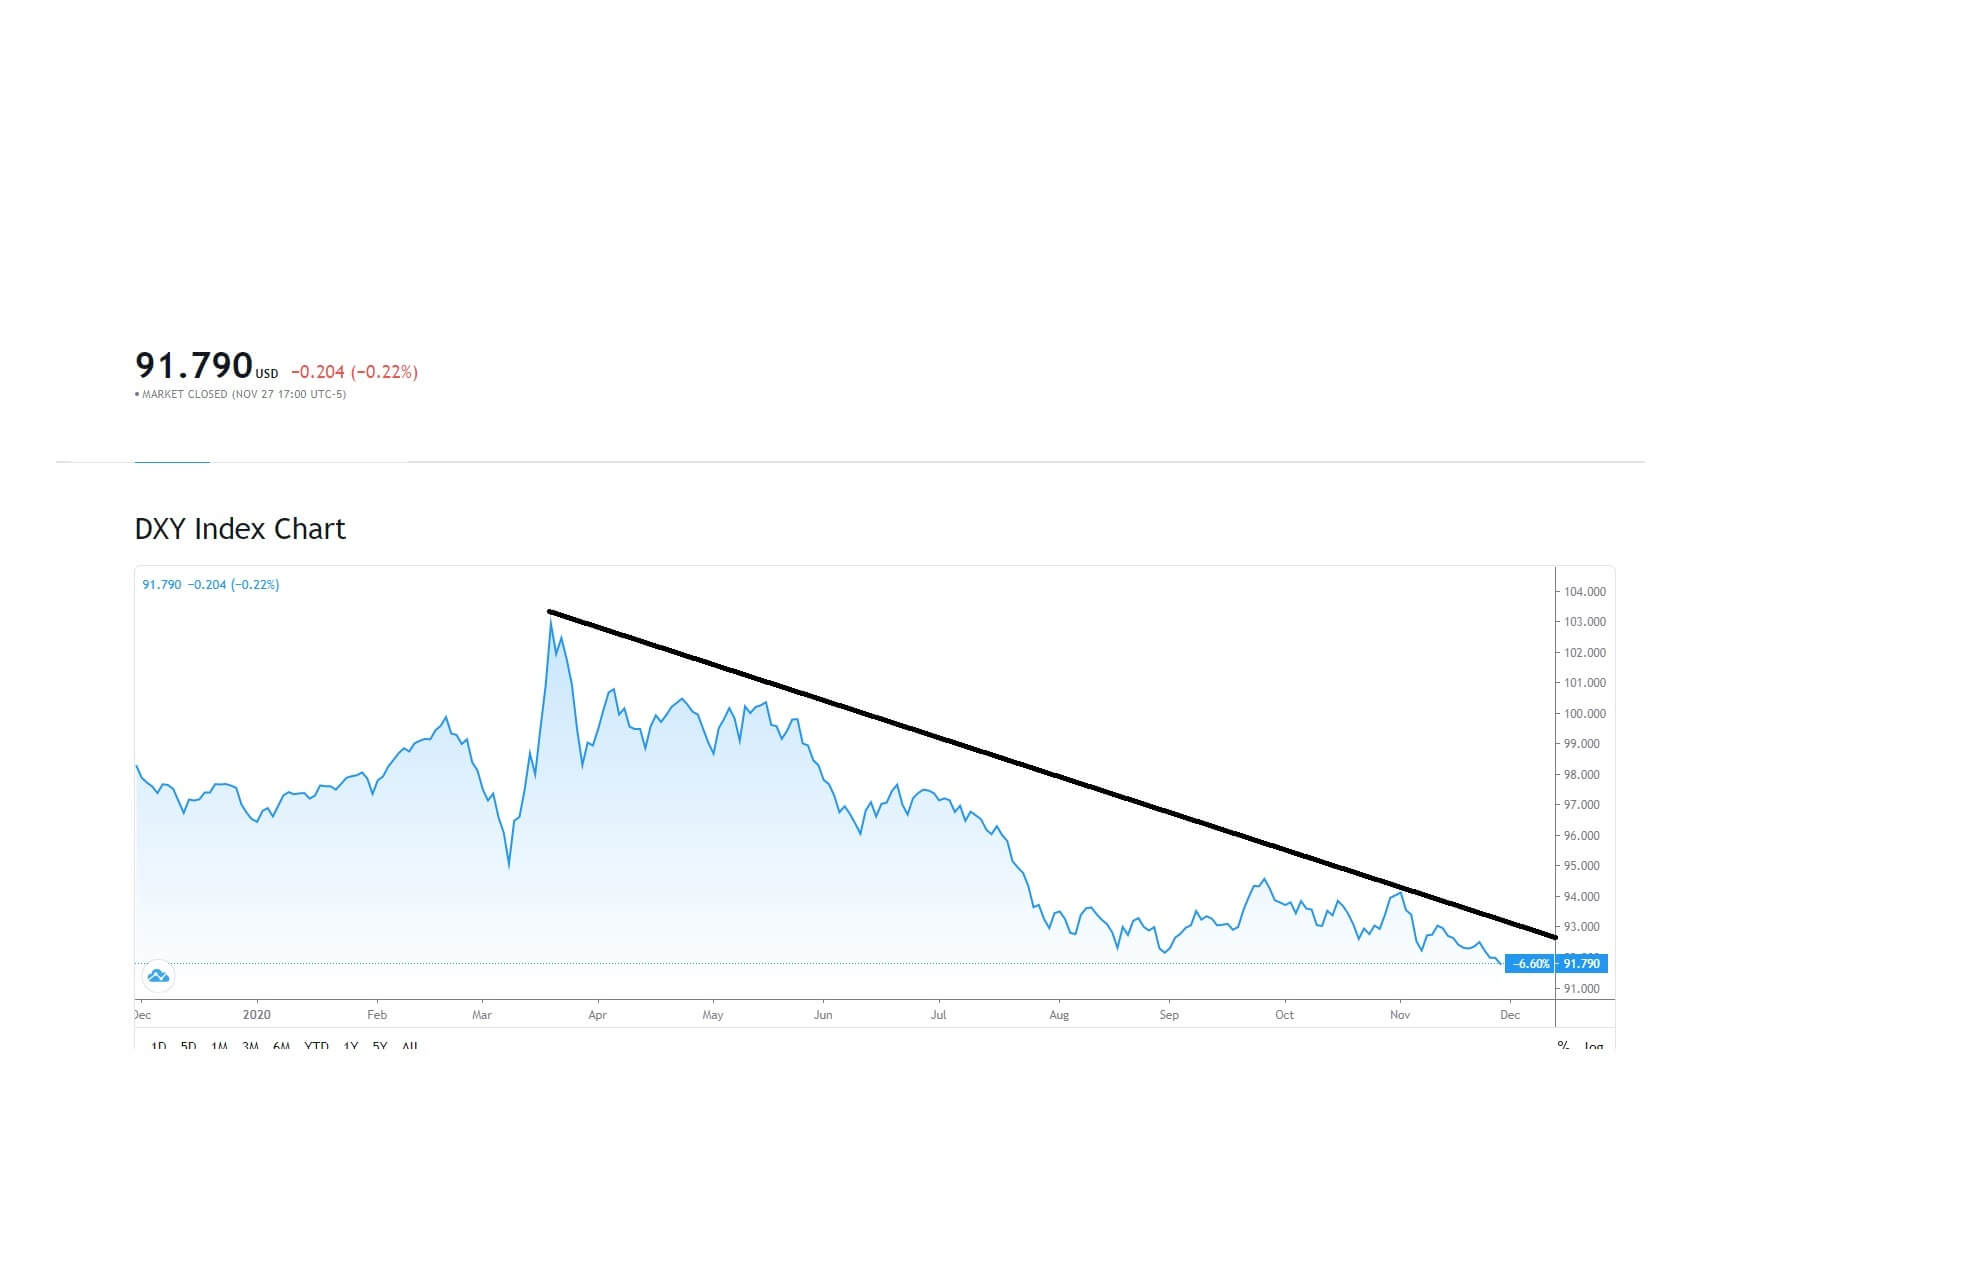
The USD/JPY pair was closed at 104.305 after placing a high of 104.576 and a low of 104.180. The USD/JPY pair stayed on a bullish track on Tuesday despite the broad-based U.S. dollar weakness due to increased risk flow in the market. The stock markets have been buoyed by the news that the first coronavirus vaccine could be administered by the end of the year. Despite the acceleration of the pandemic in the U.S. and many other parts of the world, the riskier assets gained on the back of improved risk sentiment due to vaccine hopes. The U.S. Dollar Index (DXY) that measures the U.S. dollar value against the six currencies basket fell to 92 levels on Tuesday.
The pair rose above 104.5 level on Tuesday amid the broad-based risk sentiment in the market over the optimism surrounding the vaccine hopes. However, the gains in USD.JPY pair started to fade away in the late trading session after the US ISM Manufacturing PMI release for November. In November, the declining manufacturing activity was the proof of halted manufacturing activity due to the rising number of restrictive measures in many states of America due to escalated second wave of coronavirus.
At 04:30 GMT, the Unemployment Rate from Japan for October remained flat with the expectations of 3.1%. At 04:50 GMT, the Capital Spending for the quarter from Japan came in as -10.6% against the expected -12.0% and supported the Japanese Yen that limited the USD/JPY pair’s gains. AT 05:30 GMT, the Final Manufacturing PMI from Japan also raised to 49.0 against the expected 48.3 and supported the Japanese Yen that capped further gains in the USD/JPY pair.
On the U.S. dollar front, at 20:00 GMT, the ISM Manufacturing PMI for November fell to 5.75 against the projected 5.9 and weighed on the U.S. dollar that capped further gains in the USD/JPY pair. For October, the Construction Spending surged to 1.3% against the estimated 0.8% and supported the U.S. dollar and added gains in the USD/JPY pair. The ISM Manufacturing Prices for November also rose to 65.4 against the expected 65.0 and helped the U.S. dollar that added additional gains in the USD/JPY pair. The Wards Total Vehicle Sales from the U.S. dropped to 15.6M against the expected 16.1M and weighed on the U.S. dollar that capped further gains in the USD/JPY pair.
Meanwhile, the U.S. death rate because of the COVID-19 virus has also increased to an alarming level as it posted the highest number for a single day in six months. The Top U.S. health official announced plans on Tuesday to begin vaccinating Americans against the coronavirus as early as mid-December. This statement also raised the risk sentiment and added weight on the Japanese Yen that supported the USD/JPY pair’s upward momentum on Tuesday.
Furthermore, On Tuesday, Federal Reserve Chairman Jerome Powell said that the United States economy’s outlook was extraordinarily uncertain due to increased numbers of coronavirus cases that have affected the U.S. economy hardly.
In his testimony to the U.S. Senate Committee on Banking, Housing and Urban Affairs, Powell said that the increasing number of COVID-19 cases in the U.S. and abroad were concerning. He said that until the people were confident about re-engaging the economic activities confidently, full economic recovery was impossible. At the same time, Powell was upbeat over the recent optimistic news on vaccine development worldwide.
Meanwhile, several programs set by the Federal Reserve in March are near to end of the year. In response to this, Powell stated that these programs would help unlock almost $2 trillion funding. After this report, the USD/JPY pair started losing its early daily gains as the greenback became weak across the board due to rising hopes for stimulus measure.
Furthermore, On Tuesday, the outgoing Treasury Secretary Steven Mnuchin also testified before the Senate and urged lawmakers to pass a second stimulus bill quickly. This also added in the U.S. dollar weakness and capped further gains in the USD/JPY pair on Tuesday.
Daily Technical Levels
Support Resistance
104.03 104.16
103.97 104.23
103.91 104.29
Pivot point: 104.10
USD/JPY – Trading Tips
The USD/JPY is trading with a sideways trading range of 104.600 – 104.200, holding below an immediate resistance level of 104.600. On the lower side, the safe-haven currency pair may find support at the 103.719 level. The pair seems to disrupt the resistance level of 104.600, and if this happens, the USD/JPY may soar until the next resistance area of 105.030 level. The MACD and RSI support the buying trend, but we should only take buying positions over the 104.600 level today. Good luck!


