Investor’s eyes will stay on the French Final CPI and Italian Trade Balance due from the European Economy. Economists are expecting no major changes in these inflation and trade balance data. Thus it may go muted. However, the Claimant Count Change and Unemployment Rate data from the U.K. is likely to drive market movements. Let’s keep an eye on U.K. labor market figures today.
Economic Events to Watch Today
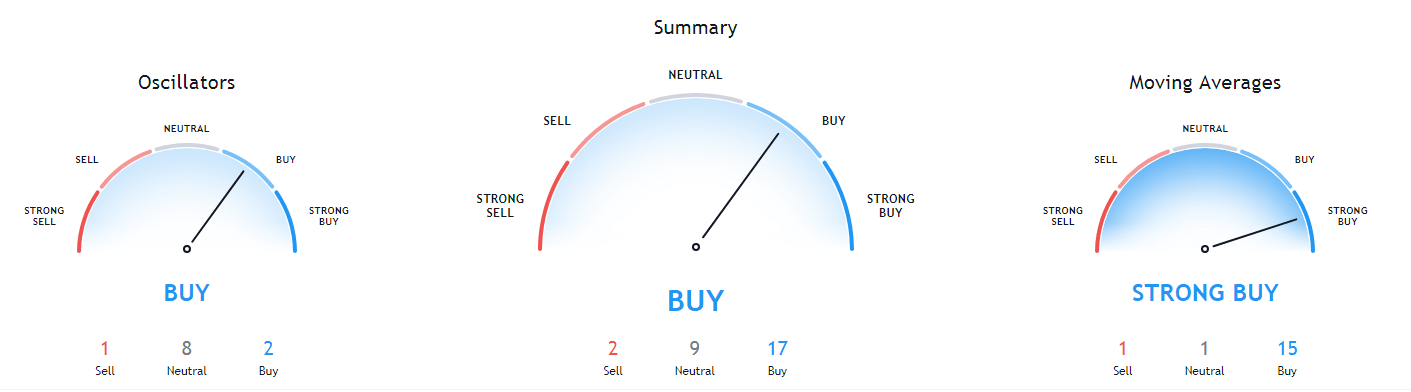
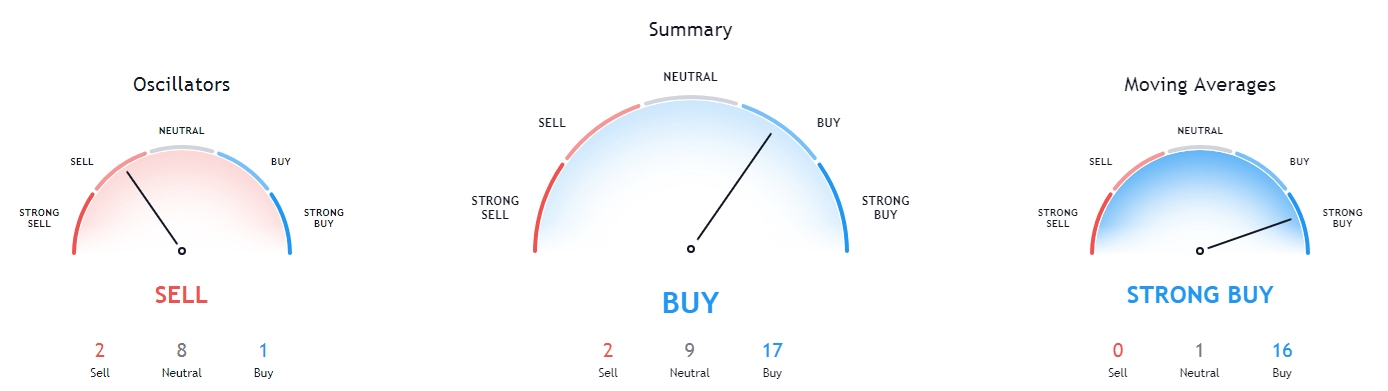
EUR/USD – Daily Analysis
During Tuesday’s Asian trading session, the EUR/USD currency pair managed to extend its overnight winning streak and sidelined near above the 1.2150 level mainly due to the risk-on market sentiment. That was supported by the upbeat China data and optimism over treatment for the highly infectious coronavirus, which weakens the safe-haven U.S. dollar and contributes to the currency pair gains. Moreover, the upbeat market tone was further boosted by the further U.S. stimulus package’s rising expectations, which add further burden around the U.S. dollar and boost the currency pair.
On the contrary, the ongoing concerns about increasing COVID-19 deaths and the possibility of economically-painful hard lockdowns become the key factor that kept the lid on any additional gains in the currency pair. As of writing, the EUR/USD currency pair is currently trading at 1.2149 and consolidating in the range between 1.2143 – 1.2165.
As we already mentioned, the market trading sentiment succeeded in extending its previous day bullish bias and still representing positive performance on the day as the bullish appearance of Asia-Pacific stocks and the gains of the U.S. stocks futures tends to highlight the risk-on mood. However, the risk-on market sentiment could be attributed to the vaccine optimism and upbeat China data, which showed the economic recovery increased in November. On the data front, China’s Retail Sales increased by 5.0% year-on-year in November, marking the 4th-successive month of growth. Industrial Production, a gauge of manufacturing, mining, and utility output, rose 7% year-on-year versus October’s 5.9% growth.
On the other hand, the renewed optimism over a possible vaccine for the highly infectious coronavirus disease also keeps supporting the market trading sentiment. It is worth recalling that the U.S. Food and Drug Administration (FDA) granted permission for emergency use to BNT162b2, the COVID-19 vaccine co-developed by Pfizer (NYSE: PFE) and BioNTech SE (F:22UAy) on December 11. The approval will see the first U.S. deliveries of BNT162b2 later in the day, which lifted hopes that the world’s largest economy will likely see a reduction in the COVID-19 cases. However, the positive developments over the covid vaccine keep favoring the market risk-on mood and undermine the safe-haven U.S. dollar.
As in result, the broad-based U.S. dollar failed to stop its previous day bearish bias and drew further offers on the day as demand for the safe-haven assets decreased amid progress toward agreeing on U.S. fiscal stimulus and optimism for a Brexit deal. On the other hand, the U.S. dollar losses were further bolstered by the Fed’s expectations to keep interest rates low for an extended period at its last policy meeting of 2020. However, the U.S. dollar losses helped the gold prices to deeper its losses as the gold price is inversely related to the U.S. dollar price. The U.S. Dollar Index Futures that tracks the greenback against a bucket of other currencies dropped to 90.642.
On the contrary, the concerns about rising COVID-19 deaths and the possibility of economically-painful hard lockdowns keep challenging the upbeat market performance, which becomes the key factor that kept the lid on any additional gains currency pair. As per the latest report, the growing virus cases recall the local lockdowns in the U.K. and the U.S. After New York, that was witnessed readiness to enter a second full lockdown as the number of COVID-19 cases surge. In addition to this, Germany also extended national activity restrictions. Across the ocean, the fears of a full-fledged trade/political war between the West and China also challenge the market’s upbeat mood. The tension between the two biggest economies in the world was fueled after the U.S. imposed back to back travel restrictions over the Chinese Communist Party members and their families.
In the absence of the major data/events on the day, the market traders will keep their eyes on the continuous drama surrounding the U.S. stimulus package. In the meantime, the risk catalyst like geopolitics and the virus woes, not to forget the Brexit, will also be key to watch for a fresh direction.
Daily Technical Levels
Support Resistance
1.2044 1.2133
1.2006 1.2186
1.1954 1.2223
Pivot point: 1.2096
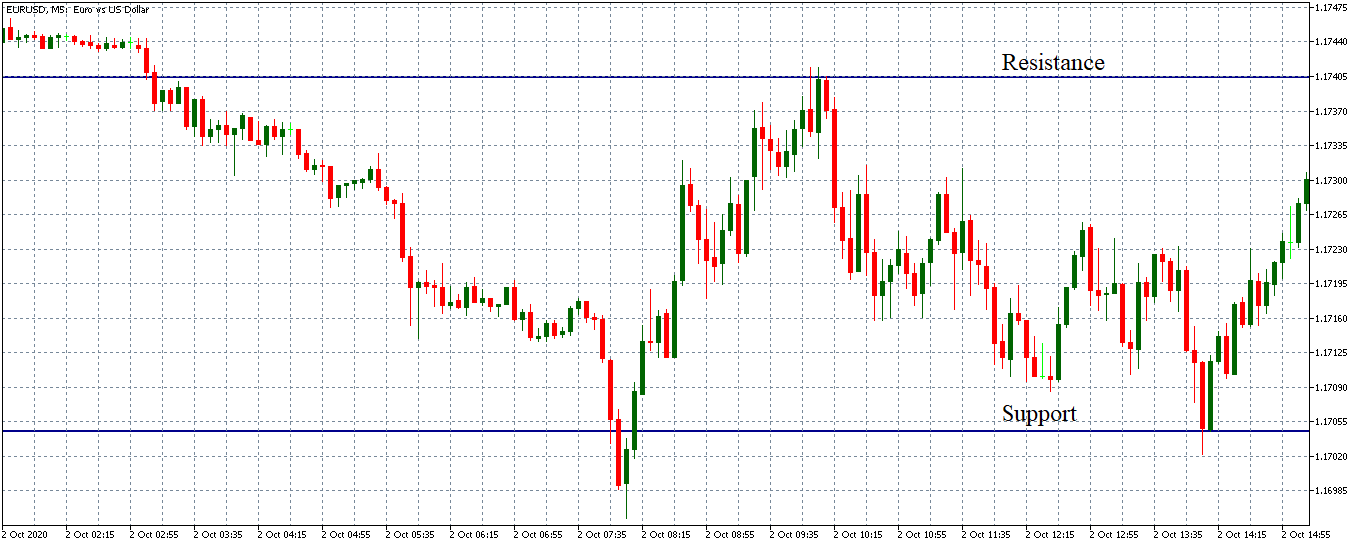
EUR/USD– Trading Tip
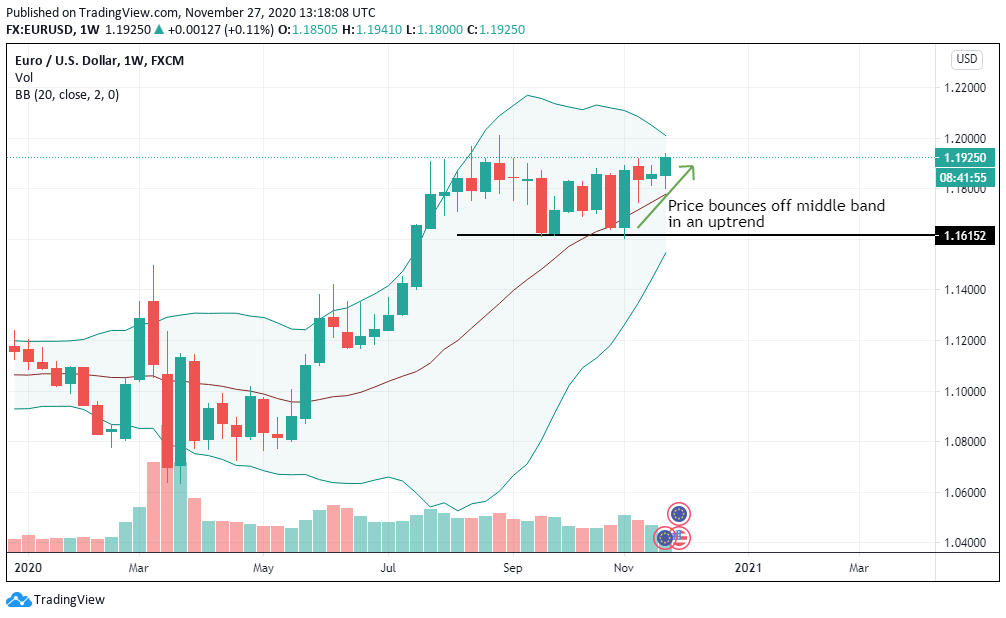
The technical side of the EUR/USD is still unchanged as it trades at the 1.2131 level, facing immediate resistance at 1.2160 and 1.2196 level along with a support level of 1.2085. Closing of candles below the 1.2103 level can send the EUR/USD pair further lower until 1.2080 and 1.2040. The 50 periods EMA supports a bullish bias, keeping the EUR/USD pair in a little bit of buying mode. Simultaneously, the MACD and RSI are also in support of a buying trend; thus, we should look for a buying trade over the 1.2175 level to target the 1.2265 level today.
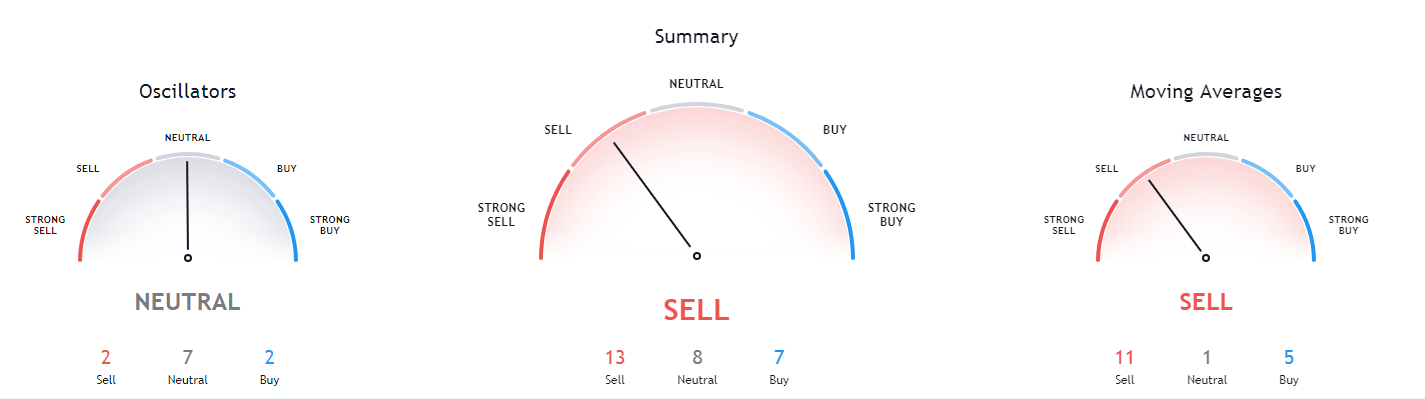
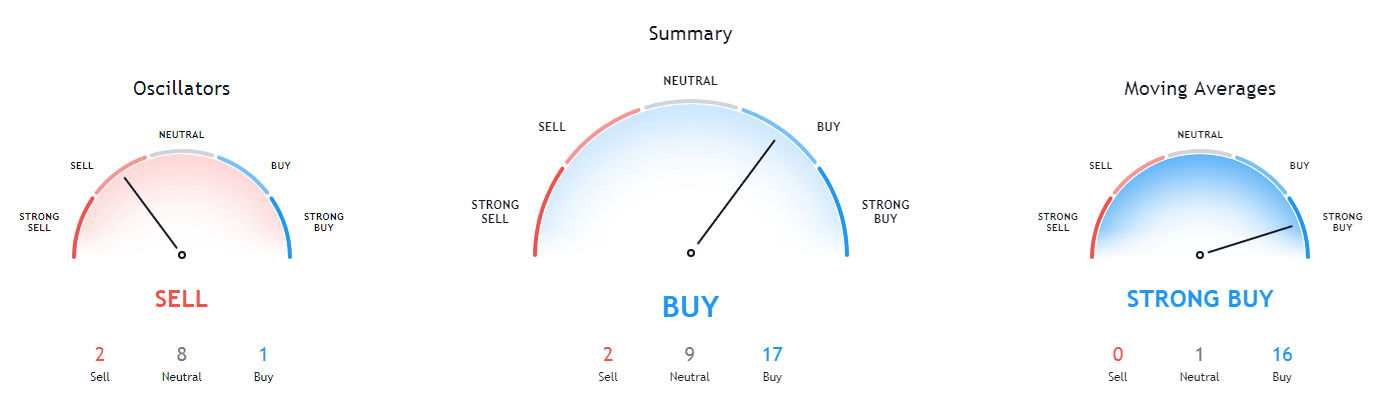
GBP/USD – Daily Analysis
During Tuesday’s Asian trading session, the GBP/USD currency pair maintained its strong bid tone through the first half of the Asian session and remained positive around the 1.3335 level mainly due to the reports suggesting that the U.K. and the E.U. agreed to extend Brexit talks. Furthermore, the bid tone surrounding the British pound was further bolstered after the E.U.’s chief Brexit negotiator, Michel Barnier, said that they could face every hurdle to reach a post-Brexit trade deal.
Across the ocean, the broad-based U.S. dollar fresh weakness, backed by the market risk-on mood, also played its major role in underpinning the currency pair. At a particular time, the GBP/USD currency pair is currently trading at 1.3333 and consolidating in the range between 1.3312 – 1.3348. Moving on, the traders seem cautious to place any strong position ahead of the U.K. jobs data, which is due to release later in the day.
It is worth recalling that the U.K. Prime Minister Boris Johnson and European Commission President announced that they discussed the key issues and decided to go for another round of discussions to reach a historic trade deal, which in turn, raised expectations for a free trade agreement before the end of Brexit transition period on December 31. However, these hopes were further fueled after the E.U.’s chief Brexit negotiator, Michel Barnier, told them to use every way to reach a post-Brexit trade deal.
Despite the prevalent doubts over the global economic recovery from coronavirus (COVID-19), the market trading sentiment managed to extend its previous day’s positive performance. It remained supportive by optimism over a potential vaccine/treatment for the highly infectious coronavirus. Let me remind you that the U.S. Food and Drug Administration (FDA) granted permission for emergency use to BNT162b2, the COVID-19 vaccine co-developed by Pfizer (NYSE: PFE) and BioNTech SE (F:22UAy) on December 11. However, the positive developments over the covid vaccine keep favoring the market risk-on mood and undermine the safe-haven U.S. dollar.
As in result, the broad-based U.S. dollar failed to stop its previous day bearish bias and drew further offers on the day as demand for the safe-haven assets decreased amid progress toward agreeing on U.S. fiscal stimulus and optimism for a Brexit deal. On the other hand, the U.S. dollar losses were further bolstered by the Fed’s expectations to keep interest rates low for an extended period at its last policy meeting of 2020. However, the U.S. dollar losses provided an additional boost to the GBP/USD currency pair and remained supportive of the strong intraday positive move. The U.S. Dollar Index Futures that tracks the greenback against a bucket of other currencies dropped to 90.642.
On the bearish side, the concerns about rising COVID-19 deaths and the possibilities of the economically-painful hard lockdowns keep challenging the upbeat market performance, which becomes the key factor that kept the lid on any additional gains in the currency pair. As per the latest report, the growing virus cases recall the local lockdowns in the U.K. and the U.S. After New York, that was witnessed readiness to enter a second full lockdown as the number of COVID-19 cases surge. In addition to this, Germany also extended national activity restrictions.
Moving on, the traders seem cautious to place any strong position ahead of the U.K. jobs data, which is due to release later in the day. From the projected view, the U.K. labor market report is anticipated to show that the average weekly earnings, including bonuses, in the 3-months to October, to increase from the previous 1.3% to 2.2%, while ex-bonuses, the wages are seen improving from 1.9% to 2.6% during the stated period.
In addition to this, the number of people asking for jobless benefits is expected to rise from -29.8K previous to +50K in November. Moreover, the ILO Unemployment Rate may rise from 4.8% to 5.1% during the 3- months ending in October. However, the positive earnings growth tends to underpin the GBP; conversely, the low figures would be seen as negative for the GBP currency.
In the absence of the major data/events on the day, the market traders will keep their eyes on the continuous drama surrounding the U.S. stimulus package. In the meantime, the risk catalyst like geopolitics and the virus woes, not to forget the Brexit, will also be key to watch for a fresh direction.
Daily Technical Levels
Support Resistance
1.3338 1.3466
1.3280 1.3536
1.3209 1.3594
Pivot point: 1.3408
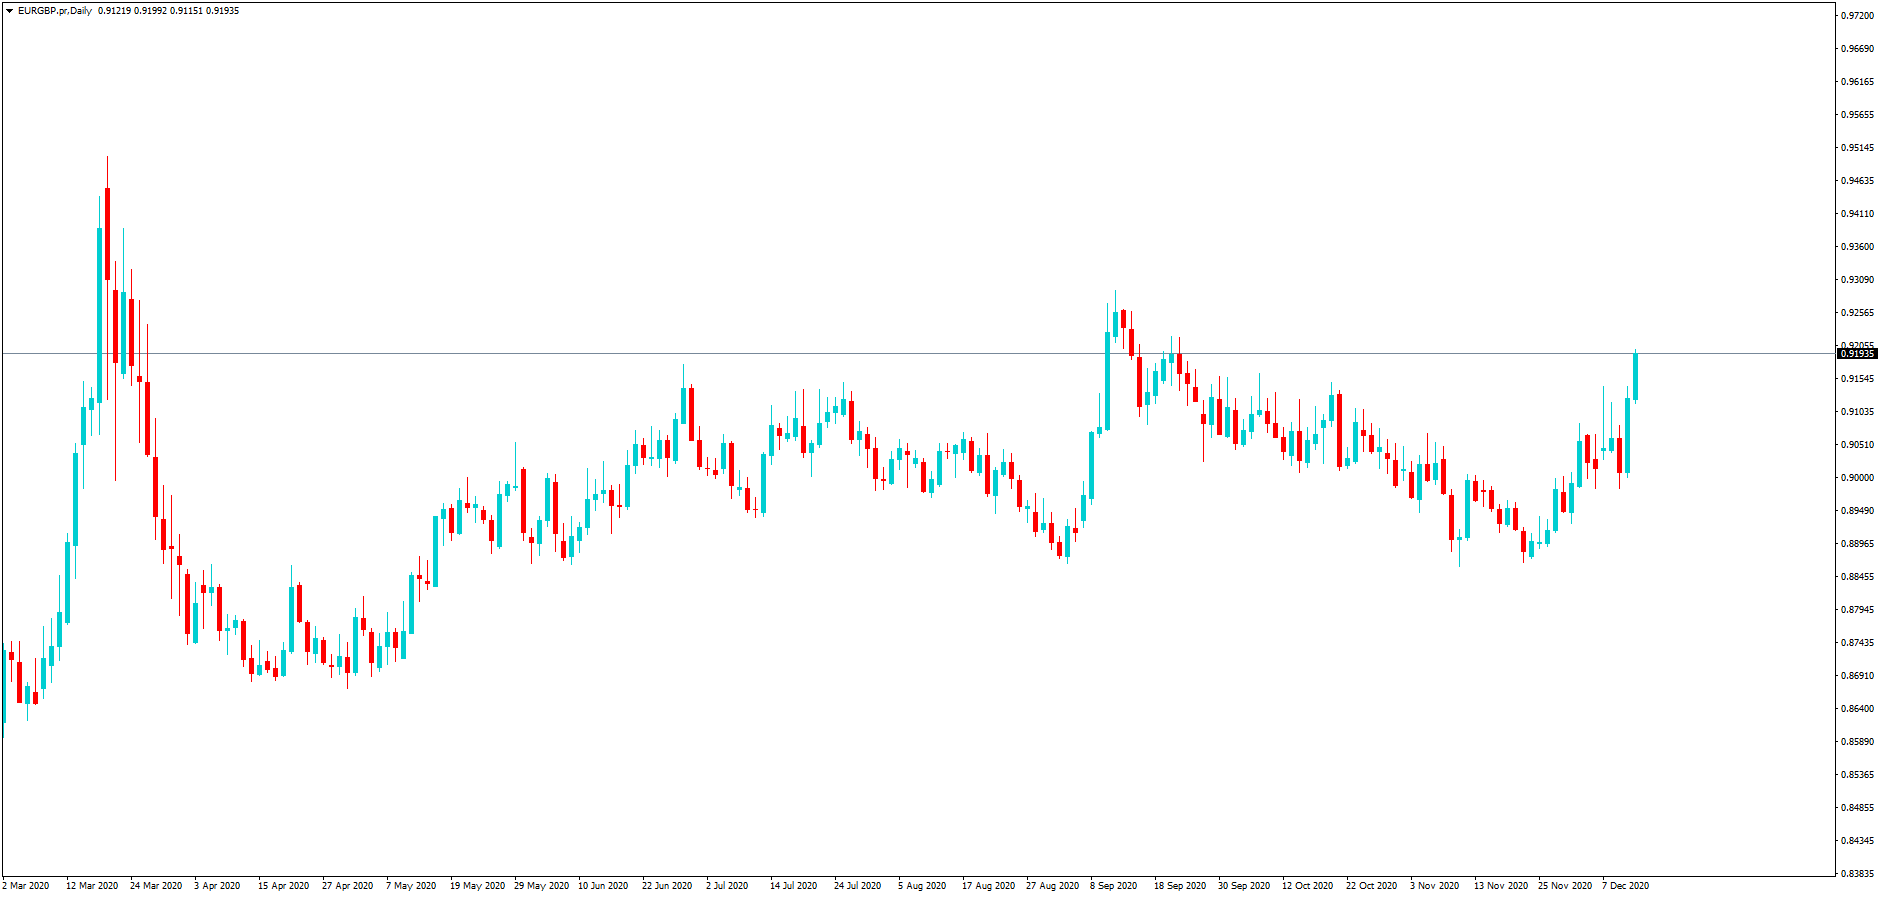
GBP/USD– Trading Tip
The GBP/USD is trading at the 1.3330 level, maintaining a narrow trading range of 1.3345 – 1.3309. A lack of high-impact economic data drives the choppy session; however, the market will be offering us labor market figures, which are expected to be worse than before, and it may drive selling in the Sterling. Technically, the bearish breakout of the 1.3309 level can extend the selling trend until the 1.3265 level, whereas a bullish breakout can lead it towards the 1.3409 mark. A choppy session can be expected until the pair violates the 1.3345 – 1.3309 range.
USD/JPY – Daily Analysis
During Tuesday’s Asian trading session, the USD/JPY currency pair managed to stop its previous day losing streak and drew some modest bids around well above the 104.00 level. However, the bullish sentiment around the currency pair was supported by the upbeat market mood, which undermined the safe-haven Japanese yen and contributed to the currency pair gains. Apart from this, the latest local lockdowns in the northern hemispheres and the surge in Tokyo’s virus figures added further pressure on the Japanese yen and boosted the currency pair. On the contrary, the broad-based U.S. dollar, triggered by the upbeat market mood, has become the key factor that capped further upside momentum for the currency pair. Currently, the USD/JPY currency pair is currently trading at 104.09 and consolidating in the range between 103.98 – 104.15.
As we already mentioned, market trading sentiment has been gaining positive traction since the day started and supported by the optimism over the U.S. President-elect Joe Biden’s victory in the Electoral College. As per the latest report, the U.S. President-elect Joe Biden recently won Electoral College and claimed his victory over President Donald Trump by achieving over 270 votes needed. In addition to this, the intensifying hopes of the U.S. covid stimulus also positively impacted the market trading sentiment. These hopes were triggered after Treasury Secretary Steve Mnuchin and House Speaker Nancy Pelosi urged policymakers toward an early aid package while also indicating good progress in the discussions.
Across the ocean, the reason behind the risk-on market sentiment could also be attributed to the upbeat China data, which showed the economic recovery improved in November. On the data front, China’s Retail Sales increased by 5.0% year-on-year in November, marking the 4th-successive month of growth. Industrial Production, a gauge of manufacturing, mining, and utility output, rose 7% year-on-year versus October’s 5.9% growth.
On the other hand, the renewed optimism over a possible vaccine for the highly infectious coronavirus disease also keeps supporting the market trading sentiment. It is worth recalling that the U.S. Food and Drug Administration (FDA) granted permission for emergency use to BNT162b2, the COVID-19 vaccine co-developed by Pfizer (NYSE: PFE) and BioNTech SE (F:22UAy) on December 11. The approval will see the first U.S. deliveries of BNT162b2 later in the day, which lifted hopes that the world’s largest economy will likely see a reduction in the COVID-19 cases. However, the positive developments over the covid vaccine keep favoring the market risk-on mood and undermined the safe-haven assets like the Japanese yen and U.S. dollar.
At the USD front, the broad-based U.S. dollar extended its previous session bearish bias. It failed to gain any positive traction during the Asian trading hours amid risk-on market sentiment. Apart from this, the greenback losses could also be associated with the Fed’s expectations to keep interest rates low for an extended period at its last policy meeting of 2020. However, the U.S. dollar losses might stop bulls from placing any strong position and keep a lid on any further gains for the USD/JPY currency pair. The U.S. Dollar Index Futures that tracks the greenback against a bucket of other currencies dropped to 90.642.
However, the market trading sentiment was rather unaffected by the fresh lockdown restrictions in Britain and Europe. As per the latest report, the growing virus numbers recall the local lockdowns in the U.K. and the U.S. After New York, a willingness to enter a second full lockdown as the number of COVID-19 cases surge. In addition to this, Germany also extended national activity restrictions.
In the absence of the major data/events on the day, the market traders will keep their eyes on the ongoing drama surrounding the U.S. stimulus package. In the meantime, the risk catalyst like geopolitics and the virus woes, not to forget the Brexit, will also be key to watch for a fresh direction.
Daily Technical Levels
Support Resistance
104.04 104.41
103.86 104.60
103.67 104.78
Pivot Point: 104.23
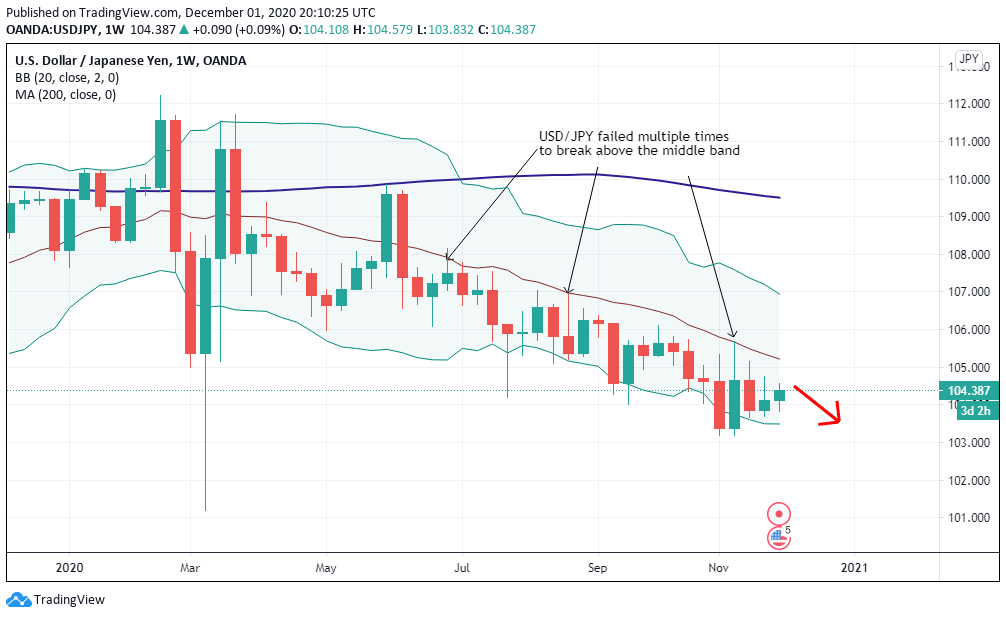
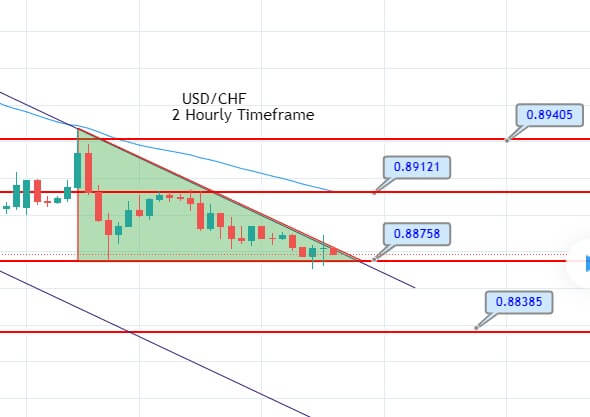
USD/JPY – Trading Tips
The USD/JPY is hardly moving as it continues to trade sideways below the 104.150 resistance area. This resistance area is extended by a double top level on the 2-hour timeframe. Bullish crossover of 104.156 level can open buying until 104.590 level. Conversely, the support holds around 103.910 level. A bearish breakout of this support can drive the selling trend until the next support area of 103.700 and 103.500. Let’s keep an eye on a breakout before placing any bullish or bearish bets. Good luck!