Categories
Forex Market Analysis

Daily F.X. Analysis, January 13 – Top Trade Setups In Forex – U.S. Inflation Report in Focus! 

On the news front, eyes will remain on the ECB President Lagarde Speaks as she may discuss the upcoming monetary policy event; however, the major focus will remain on the U.S. Inflation rates, which may help determine the further direction of the U.S. dollar.

Economic Events to Watch Today  


EUR/USD – Daily Analysis

The EUR/USD closed at 1.22077 after placing a high of 1.22095 and a low of 1.21369. After falling for three consecutive sessions, the EUR/USD pair rose on Tuesday as the U.S. dollar eased and U.S. Treasury declined. The U.S. Dollar had hit a more than two and half year lowest level in January after sliding for months as the U.S. Federal Reserve cut its interest rates and speculation of heavy rounds of fiscal stimulus under President-elect Joe Biden’s tenure. However, after Democrats won the Georgia runoff elections, the hopes for massive stimulus packages increased, and the U.S. Treasury yields started to rise that ultimately lifted the U.S. dollar.

This rise in the U.S. dollar weighed heavily on EUR/USD pair during last week; however, the recent rally in U.S. Treasury yields ran out of the stream, and the dollar came back to its previous levels. The U.S. Treasury yield on a 10-year note reached a 10-month high on Tuesday but ultimately had a reverse effect and weighed on the U.S. dollar. This slide-in U.S. dollar added gains in EUR/USD pair on Tuesday as the investors started taking profits. Meanwhile, on Tuesday, the Turkish President Recep Tayyip Erdogan said that country was ready to settle its frayed relationship with the European Union back on track and called on the 27 nation bloc to display the same determination. 

These new lockdown measures across Europe to fight the second wave of coronavirus raised the fears of a double-dip recession in the Eurozone that added weight on the single currency Euro and capped further upside in the EUR/USD pair on Tuesday.

On the data front, there was no macroeconomic data to be released from Europe while from the U.S., at 16:00 GMT, the NFIB Small Business Index for December dropped to 95.9 against the expected 100.1 and weighed on the U.S. dollar that ultimately added in the gains of EUR/USD pair. At 20:00 GMT, the JOLTS Job Openings for November rose to 6.53M against the expected 6.42M and supported the U.S. dollar that capped further gains in EUR/USD pair. At 20:02 GMT, the IBD/TIPP Economic Optimism came in line with the forecasts of 50.1.

Daily Technical Levels

Support   Resistance

1.2159     1.2234

1.2111     1.2259

1.2085     1.2308

Pivot point: 1.2185

EUR/USD– Trading Tip

The EUR/USD is gaining support at the 1.2200 level, and below this, it can dip further until the 1.2189 level. On the higher side, the pair may face resistance at the 1.2226 level, and a bullish breakout of this level can extend the buying trend until 1.2260. The RSI and MACD support a bullish trend, but there’s a chance of bearish correction upon the violation of 1.2190. On the 4 hour timeframe, the EUR/USD pair may face resistance at the 1.2220 level, which is extended by a downward trendline.


GBP/USD – Daily Analysis

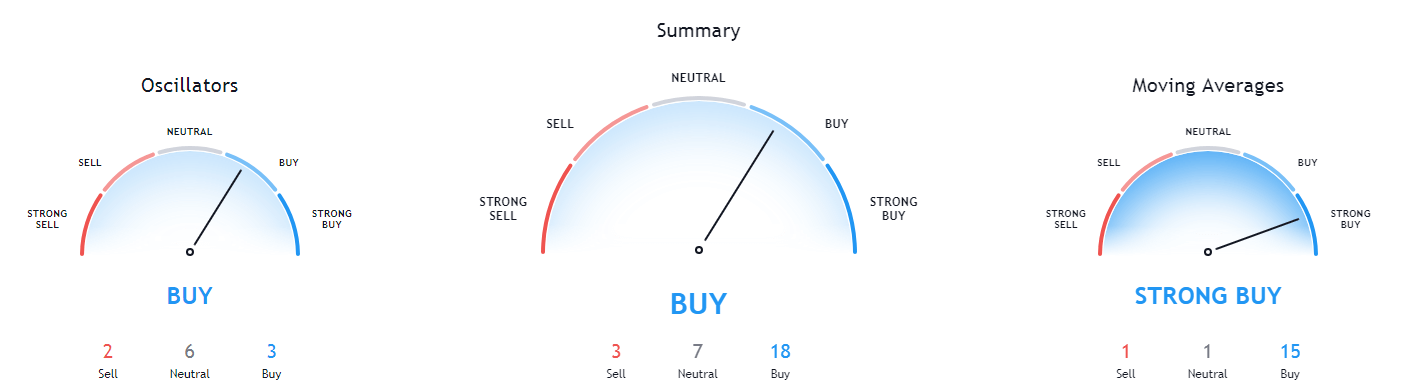
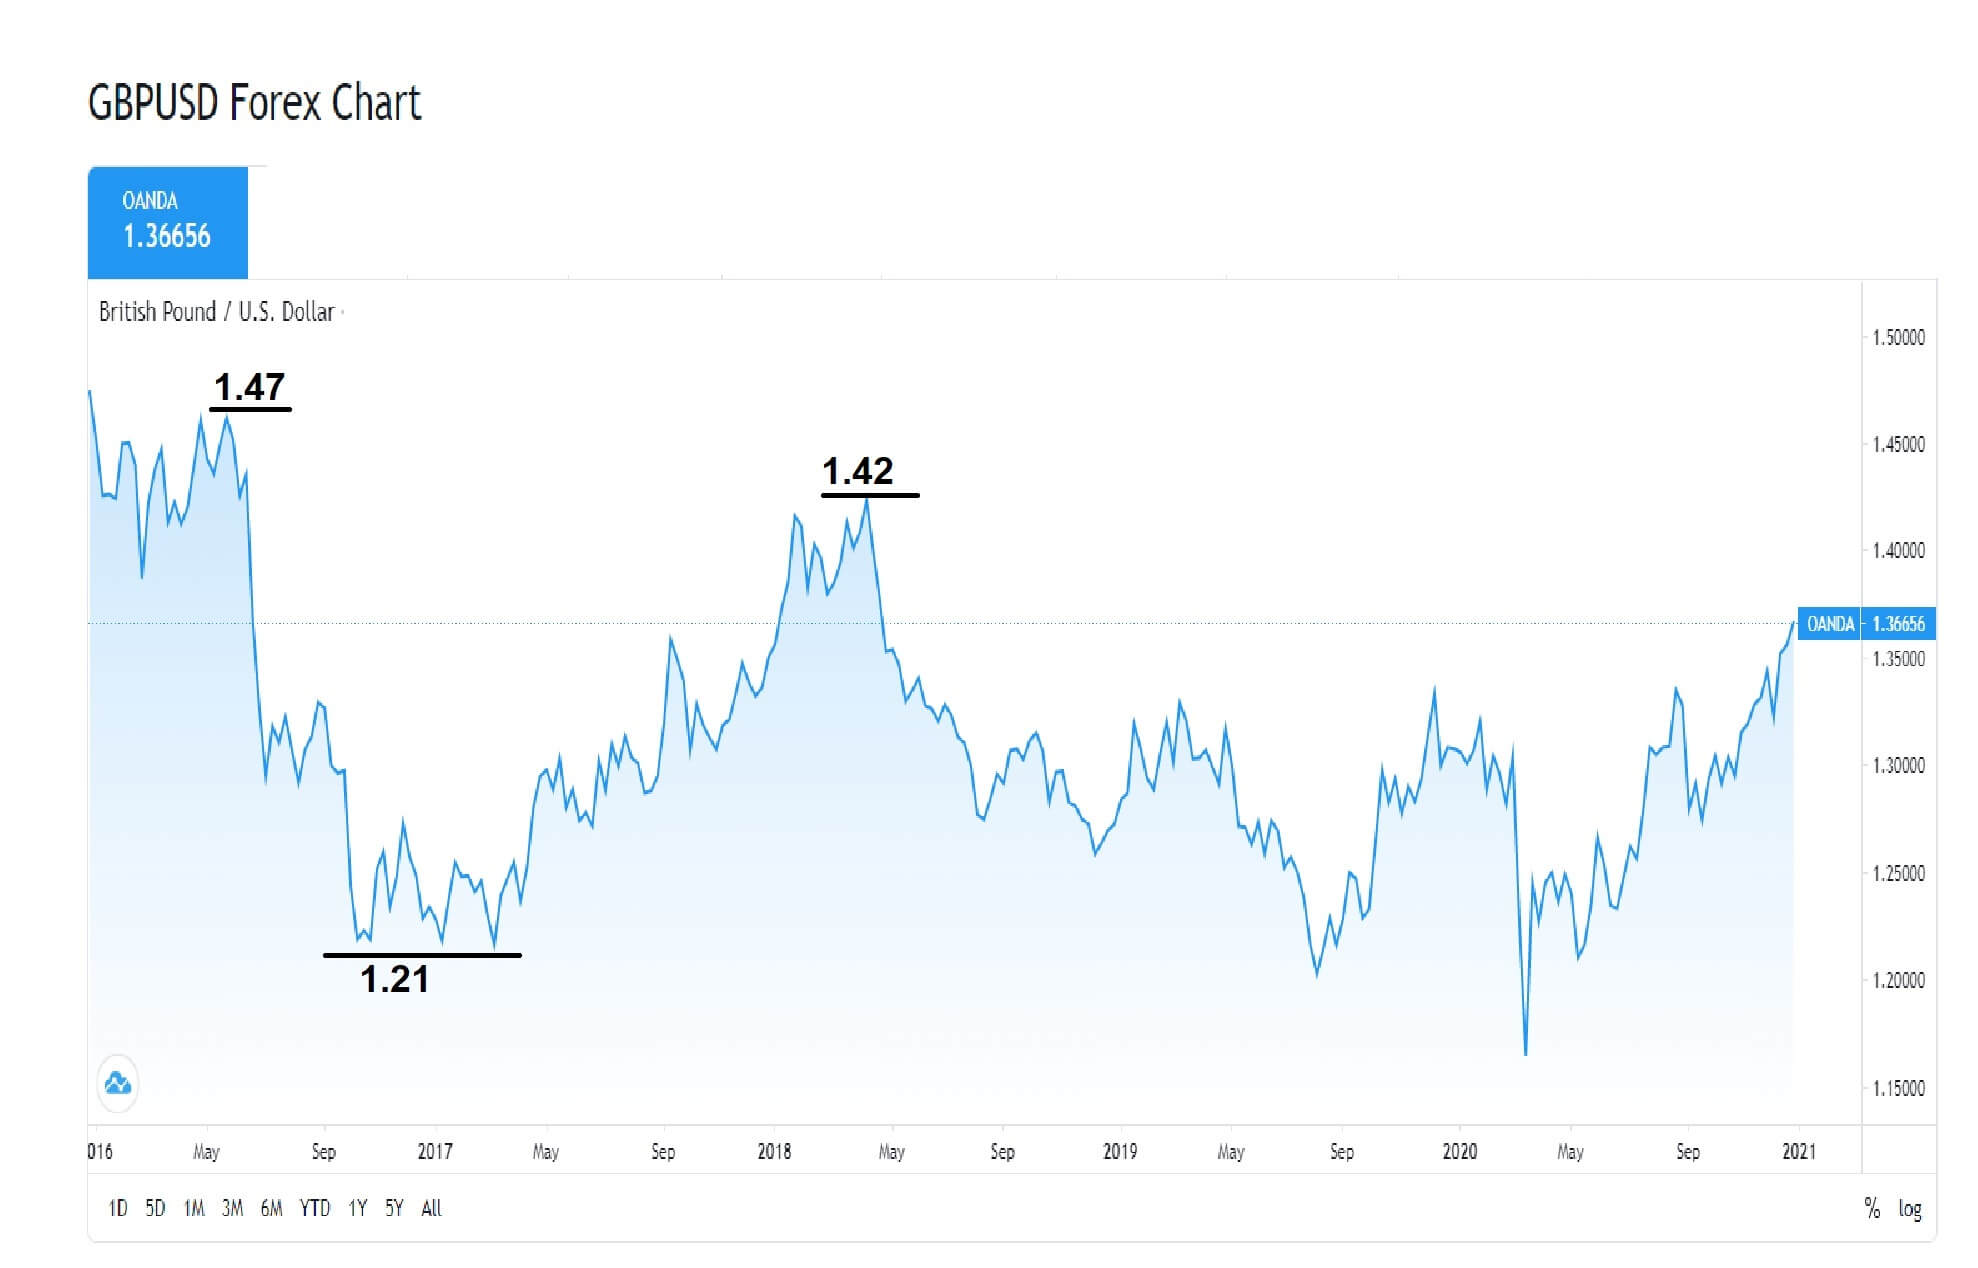
The GBP/USD closed at 1.36645 after placing a high of 1.36702 and a low of 1.34932. After falling for four consecutive sessions, the GBP/USD pair raised on Tuesday after Sterling strengthened amid the Bank of England’s positive comments. The Pound Sterling jumped against the U.S. dollar and the Euro on Tuesday as comments from the Bank of England’s governor Andrew Bailey on the viability of negative interest rates dampened some sub-zero rates’ expectations in the U.K. 

Bailey said that there were many issues with cutting interest rates below zero, and such a move could hurt banks. After these comments from Bailey, the British Pound gained traction and raised that ultimately pushed the GBP/USD pair higher on Tuesday.

Meanwhile, The Deputy Governor of Bank of England, Ben Broadbent, said on Tuesday that Britain’s coronavirus pandemic was likely to have a limited long-run impact on inflation and has led to less short-term downward pressure on prices than might have been expected from the slump in headline economic output. Broadbent said that a smaller slowdown in inflation reflected shifts in consumer demand during the pandemic that had led to temporary capacity constraints in businesses, as well as support to household incomes from government furlough schemes.

On the data front, at 05:01 GMT, the BRC Retail Sales Monitor for the year for December dropped to 4.8% against the expected 5.9% and weighed on British Pound and capped further upside in GBP/USD pair. From the U.S. side, at 16:00 GMT, the NFIB Small Business Index for December declined to 95.9 against the projected 100.1 and weighed on the U.S. dollar that ultimately added the gains of the GBP/USD pair. At 20:00 GMT, the JOLTS Job Openings for November surged to 6.53M against the projected 6.42M and supported the U.S. dollar that capped further GBP/USD pair gains. At 20:02 GMT, the IBD/TIPP Economic Optimism came in line with the projections of 50.1.

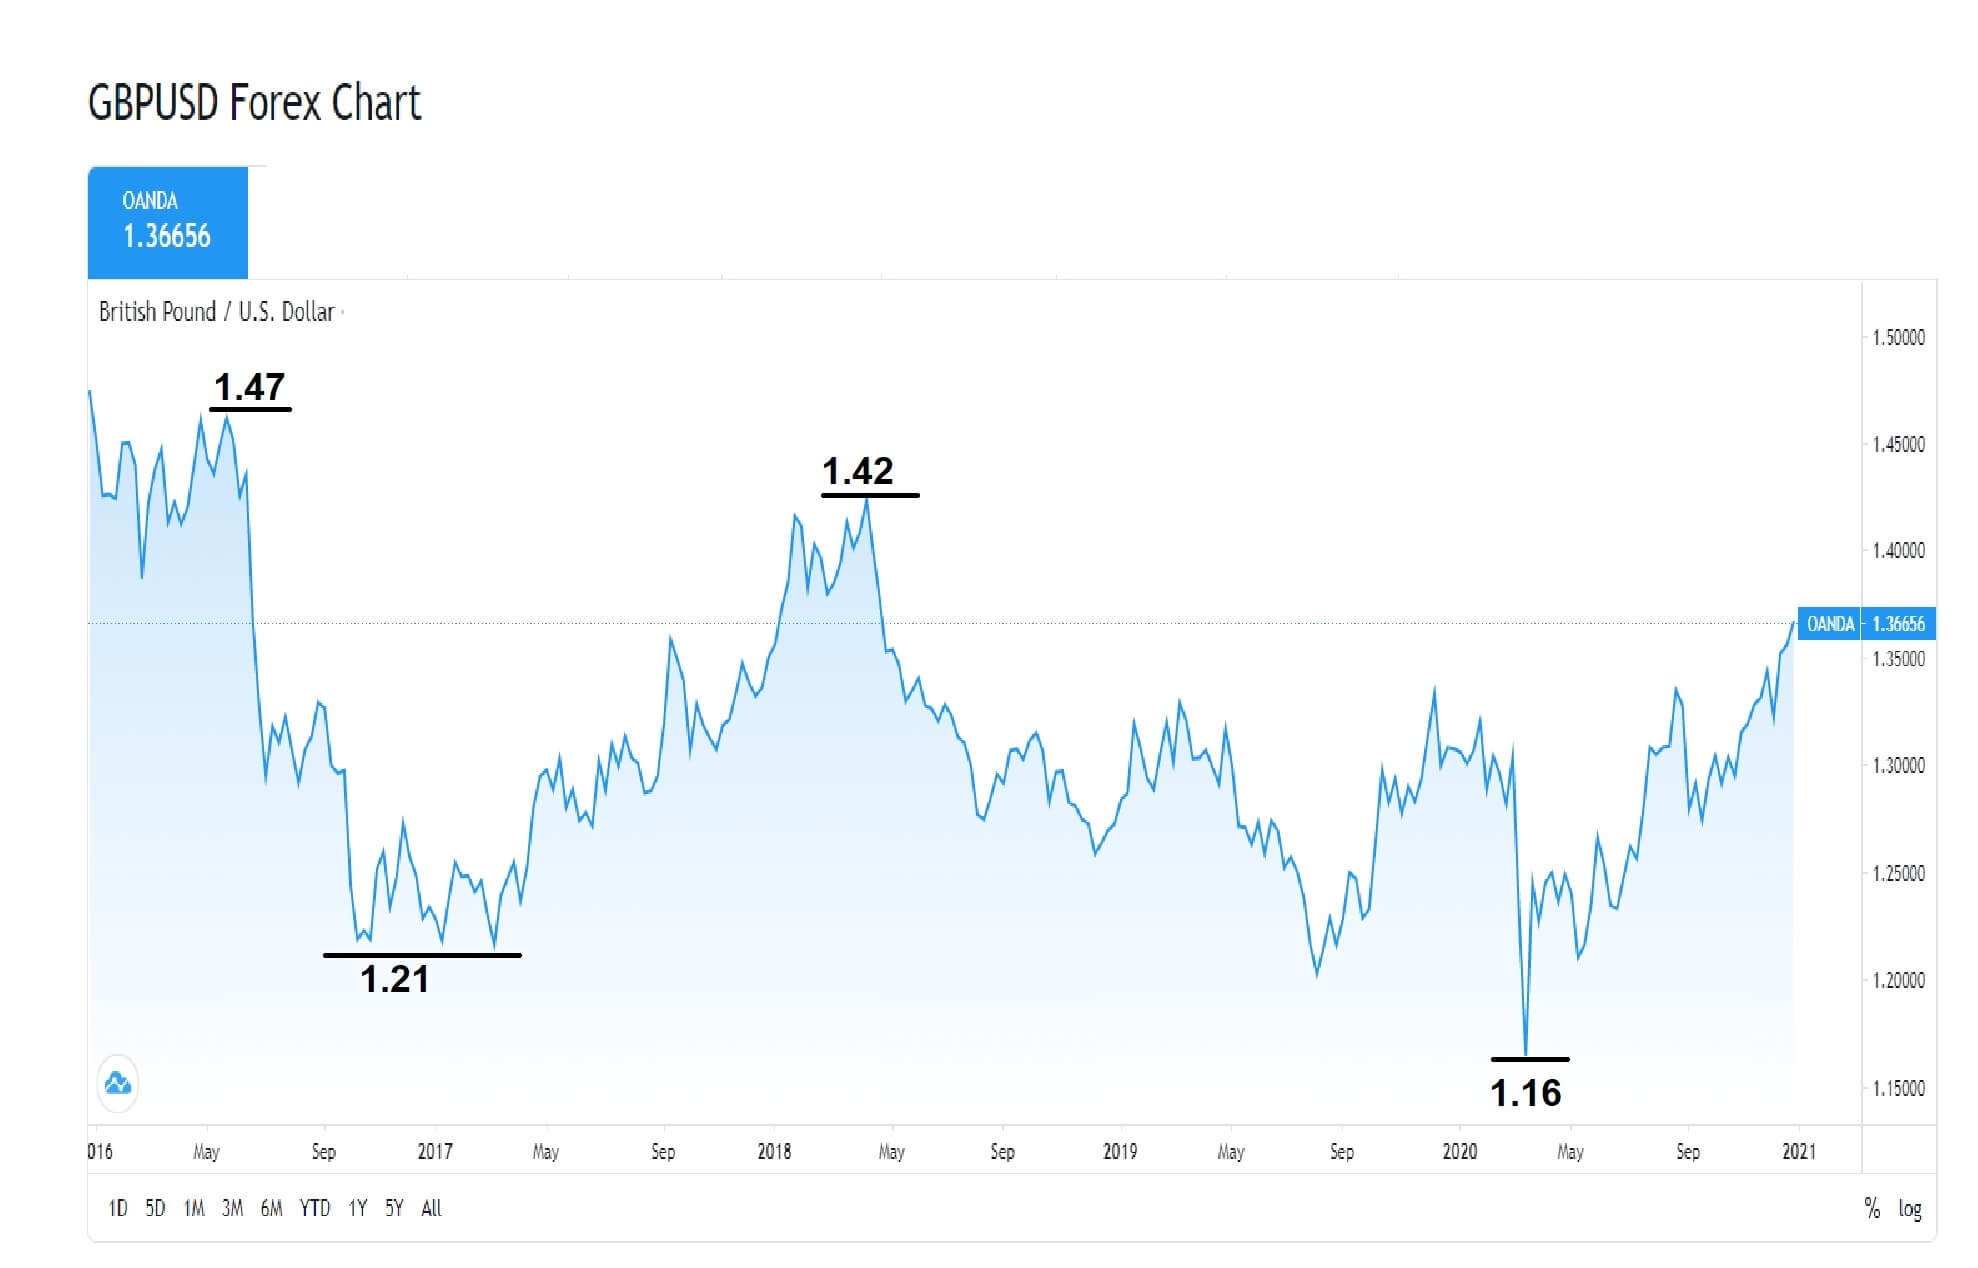
On the other hand, the U.S. dollar was also weak on Tuesday as the U.S. Dollar Index dropped as investors kept an eye on U.S. politics while pressure continued to grow to impeach President Donald Trump. Furthermore, the U.S. dollar was also weak as the prospects of massive stimulus packages from Joe Biden’s government raised as he has shown a willingness to add trillions in new relief bills that ultimately supported the upward momentum of the GBP/USD pair.

Daily Technical Levels

Support   Resistance

1.3555     1.3722

1.3445     1.3781

1.3387     1.3890

Pivot point: 1.3613

GBP/USD– Trading Tip

The GBP/USD is trading at 1.3692, and it has closed a doji candle on the four hourly timeframes, and it may extend a bearish correction in the GBP/USD pair. On the lower side, the support stays at 1.3636 and resistance at 1.3692 and 1.3720 today. The GBP/USD pair’s 10 & 20 periods EMA is supporting bullish bias in the Sterling. The MACD and RSI thesupport bullish bias; therefore, bullish bias dominates over the 1.3646 level today.


USD/JPY – Daily Analysis

The USD/JPY pair closed at 103.749 after placing a high of 104.333 and a low of 103.718. After rising for four consecutive days, the USD/JPY pair dropped on Tuesday amid the slide in the U.S. dollar. The U.S. dollar index dropped to fresh weekly lows in the 90.20 level as hopes for additional fiscal stimulus raised and provided support to high yielding equities. The House of Representatives introduced an impeachment article against U.S. President Donald Trump that weighed on the U.S. dollar and dragged the pair USD/JPY on the downside.

The U.S. Dollar Index (DXY) fell almost 0.3% on Tuesday against its rivals, while the 10-year U.S. Treasury yields dropped to a session’s low of 1.146%. The U.S. stocks opened higher on Tuesday and recovered from the previous session’s losses, with investors looking for additional fiscal stimulus amid continued political turmoil. The Dow Jones Industrial Average was down by 0.3%, and the S&P 500 was down by 0.6% lower while NASDAQ was low by 1.2%.

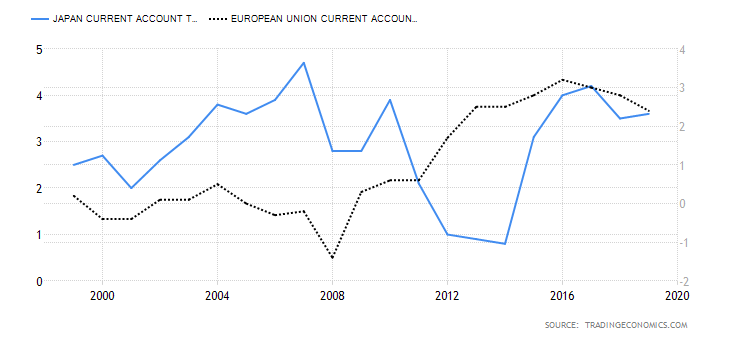
On the data front, at 04:50 GMT, the Bank Lending for the year from Japan dropped to 6.2% against the forecasted 6.5% and weighed on the Japanese Yen that capped further losses in the USD/JPY pair. The Current Account Balance from Japan for November raised to 2.34T against the forecasted 2.00T and supported the Japanese Yen that ultimately added the USD/JPY pair’s losses. At 10:00 GMT, the Economic Watchers Sentiment dropped to 35.5 against the expected 36.9 and weighed on the Japanese Yen, which capped further losses in the USD/JPY pair.

From the U.S. side, at 16:00 GMT, the NFIB Small Business Index for December decreased to 95.9 against the anticipated 100.1 and weighed on the U.S. dollar that ultimately added further losses in the USD/JPY pair. At 20:00 GMT, the JOLTS Job Openings for November increased to 6.53M against the anticipated 6.42M and supported the U.S. dollar that capped further losses in the USD/JPY pair. At 20:02 GMT, the IBD/TIPP Economic Optimism came in line with the anticipations of 50.1.

Meanwhile, the safe-haven appeal rose on Tuesday after fears rose that there could be further disruptions in the days leading up to Biden’s inauguration on January 20. FBI has said that it has received information specifying that armed protests were being planned at all 50 state capitols and Washington. The FBI’s comments raised the safe-haven appeal and supported the safe-haven Japanese Yen that ultimately added the USD/JPY pair’s losses on Tuesday.

On Tuesday, Federal Reserve Governor Lael Brainard said that the federal banking agencies were in the process of enlisting requests for information on the risk management of artificial intelligence applications in financial services. Whereas, the Boston Federal Reserve Bank President Eric Rosengren said that the U.S. economy could see a strong rebound in the second half of this year as vaccinations became widely available and that monetary policy will remain accommodative. However, the virus was still driving the economy. The losses in USD/JPY pair were also capped on Tuesday after the Donald Trump administration said that it was releasing millions of coronavirus vaccine doses and urged states to offer them to all Americans over age 65 or with chronic health conditions.

Daily Technical Levels

Support   Resistance

103.53     104.16

103.31     104.56

102.91     104.78

Pivot point: 103.94

USD/JPY – Trading Tips

The safe-haven currency pair USD/JPY slipped to trade at 103.623 level amid increased demand for safe-haven assets. On the lower side, the USD/JPY pair has completed 38.2% Fibonacci retracement at 103.611 level, and on the further lower side, the USD/JPY pair may find support at 50% Fibonacci level of 103.400 level. The MACD and RSI support selling bias; therefore, we may find support at the 103.283 level. Let’s consider taking the buying trade over the 103.283 level and selling below the same. Good luck! 

Categories
Crypto Videos

Biden’s $3T Stimulus Bill Could Make Bitcoin Explode!


Biden’s $3T Stimulus Could Create Another Bitcoin Skyrocket Scenario


The incoming Biden administration’s plan to print almost an infinite amount of money into the US economy and supply it with trillions of dollars could likely ignite the next leg of the Bitcoin bull market, as more investors seek refuge from the United States dollar.
Aan Arlington-based news outlet Axios reported that Joe Biden had asked Congress to provide Americans with a stimulus check of $2,000 to help offset the economic devastation caused by Covid-19. The incoming president has also proposed a tax and infrastructure package as part of his “Build Back Better” program. The package would be worth $3 trillion.

Biden also doubled down on his call for more direct relief to American citizens after Jan 8 disappointing jobs report showing a loss of over 140,000 positions in the last month of 2020.
He stated: “Economic research confirms that, with the current conditions such as the crisis today, especially with such low-interest rates, taking action immediately– even with deficit financing – is certainly going to help the economy overall.”
If 2020 is anything to go by, the new wave of stimulus could be another catalyst for Bitcoin’s rise as more money floods the market and makes prices into assets.

Even the current president Donald Trump, a Republican, has played a role in vast government outlays. Under his leadership, the US passed a historic $2 trillion stimulus package bill in March. Trump also signed a relief package worth $900 billion in December. This document would then pave the way for $600 stimulus checks coming to every American citizen.
The federal government’s inflation-increasing policies have coincided with interventionism coming from the Federal Reserve, which deployed trillions of dollars in 2020 to combat a liquidity crisis and keep overnight rates somewhat under control.

Although the aforementioned policies provided a strong backstop for risk-on assets – a category that has previously included Bitcoin – the emerging narrative surrounding Bitcoin is that it’s a hedge against inflation.
Institutions are currently buying Bitcoin with a clear purpose and are hoping to one day become the industry’s whales.


Bitcoin’s digital gold narrative has recently been one of the biggest catalysts for Bitcoin’s price increase, as well as the institutional shift towards it. This narrative helped fuel BTC’s 300% rally in the previous year, as well as it more than doubling in price in this year alone. This trend could increase in intensity in 2021 as the purchasing power of the US dollar continues to erode.
Even a giant such as JPMorgan Chase publicly acknowledged that Bitcoin is taking market share from gold.

Categories
Crypto Market Analysis

Daily Crypto Review, Jan 12 – XLM Back in the top10 Cryptos by Market Cap; Crypto Sector in the Green

The crypto sector has experienced a rally that brought the market to its feed after yesterday’s dip. One of the best daily performers was Stellar Lumens (XLM), which shot up in the past week on great fundamentals (and once again today), gaining over 30% just a couple of hours, reentering the top10 cryptocurrencies by market cap.

Bitcoin is currently trading for $35,887, representing an increase of 1.28% compared to yesterday’s value. Meanwhile, Ethereum’s price has increased by 1.89% on the day, while LTC lost 1.85% of its value.

Daily Crypto Sector Heat Map

Amun Bitcoin 3x Daily Short gained 1186.87% in the past 24 hours, making it the most prominent daily crypto gainer by far. It is followed by PengolinCoin’s 366.58% and Firdaos’s 330.42% gain. On the other hand, Zugacoin lost 94.92%, making it the most prominent daily loser. It is followed by the True Segniorage Dollar’s loss of 85.08% and Zero Collateral Dai’s loss of 62.33%.

Top 10 24-hour Performers (Click to enlarge)

Bottom 10 24-hour Performers (Click to enlarge)

Bitcoin’s market dominance has moved up very slightly since our last report, with its value currently being 68.7%. This value represents a 0.1% difference to the upside than the value it had when we last reported.

Daily Crypto Market Cap Chart

The cryptocurrency sector’s capitalization has increased since we last reported, with its current value being $964.21 trillion. This represents a $58.14 billion increase when compared to our previous report.

_______________________________________________________________________

What happened in the past 24 hours?

_______________________________________________________________________

_______________________________________________________________________

Technical analysis

_______________________________________________________________________

Bitcoin

Bitcoin managed to stop its descending move and push up slightly after pulling back to the $30,000 mark. The largest cryptocurrency by market cap has (on decreasing volume) seen a price increase to just below the $36,640 level. Many speculate that, while the drop was considered very healthy overall, the institutions bought even more BTC, which brought its price up without affecting the volume as much.

However, BTC/USD doesn’t seem like it currently has the strength to pass the $36,640 level, which may cause another downturn.

BTC/USD 1-hour chart

Bitcoin’s technicals on the daily and weekly time-frame are completely bullish. However, its monthly overview shows slightly less bullishness, while its 4-hour chart is completely bearish.

BTC/USD 1-day Technicals

Technical factors (1-hour Chart):

  • Price is between its 50-period EMA and its 21-period EMA
  • Price is near its middle Bollinger band
  • RSI is neutral (54.63)
  • Volume is descending to average

Key levels to the upside:          Key levels to the downside:

1: $36,640                             1: $33,200

2: $40,000                             2: $30,640

3: $42,000                             3: $27,960

Ethereum

Ethereum has once again matched Bitcoin in direction after hitting the $907 support level, and changed its price direction by pushing to the upside. The second-largest cryptocurrency by market cap is back at its peak from yesterday and seems like it cannot pass $1,129 with conviction at the moment.

Ethereum’s 21-hour and 50-hour moving averages play a major role and should be taken into account when looking for support or resistance levels.

ETH/USD 1-hour Chart

Ethereum’s technicals on the daily and weekly time-frame are completely bullish. However, its monthly overview shows slightly less bullishness, while its 4-hour chart is completely bearish.

ETH/USD 1-day Technicals

Technical Factors (1-hour Chart):

  • Price is between its 50-period and its 21-period EMA
  • Price is between its middle and top Bollinger band
  • RSI is neutral (53.69)
  • Volume is descending to average

Key levels to the upside:          Key levels to the downside:

1: $1,129                               1: $1,060.5

2: $1,211                               2: $1,047.5

3: $1,226.5                             3: $992

Litecoin

Even though Litecoin did follow Bitcoin’s price direction, it did so with less intensity, causing it to ultimately be in the red for the day. Its price is now at a major crossroads, as it is fighting for the $142.1 level. This pivot point will decide whether the price will immediately push towards the upside or downside.

Litecoin has created a strong resistance level near the $150 mark, and traders should pay great attention to it when trading.


LTC/USD 1-hour Chart

Litecoin’s technicals on the daily and monthly time-frame are completely bullish. However, its weekly overview shows slightly less bullishness, while its 4-hour chart is completely bearish.

LTC/USD 1-day Technicals

Technical factors (1-hour Chart):

  • Its price is between its 50-period EMA and its 21-period EMA
  • Price between its middle and bottom Bollinger band
  • RSI is neutral (50.33)
  • Volume is descending to average levels

Key levels to the upside:          Key levels to the downside:

1: $161.5                               1: $142.1

2: $181.3                               2: $128.42

3: $186.3                               3: $114.75

Categories
Forex Course

206. The Correlation Between The Stock and Forex Markets

Introduction

The stock market encompasses individual stocks that create an index or a sector. An active under trader must define an approach to the equity as it differs depending on what she or he trades. When purchasing individual shares of an enterprise, some factors such as voting rights, dividend date, earnings per share, earnings releases, etc., play an important role.

The Relationship Between Forex and Stocks

The primary principles theory behind this is when there is an increase in the equity market rise. The demand for that particular currency also rises, resulting in more fund inflow from international investors. Additionally, it generates higher demand for the specific currency, leading it to rally instead of other foreign currencies.

On the other hand, when a local stock market does not perform well, this confidence lowers, resulting in investors to take their funds and put them somewhere safer and more lucrative.

Currency Correlation

Correlation is referred to as the measurement of the degree to which prices of two things have moved in a similar direction at the same time. For instance, if A and B prices always move up and down in sync, they have a correlation coefficient of 1, which implies an ideal positive correlation.

Contrarily if the value of these things moves simultaneously in the opposite direction, then their correlation coefficient is -1, which signifies a negative correlation.

Example – Correlation between Stock & Forex Markets

If the USA stock market performs well, international investors will sell their local currency to purchase USD-denominated stocks. When the demand for the dollar rises, it experiences an increase in value. In the Foreign exchange market, USD pairs will move in favor of the dollar ( i.e., The EURUSD falling, the USDCAD rising); hence a strong US stock market will favor the value of the US Dollar.

On the other hand, if the USA’s stock market is not performing well, investors will sell their USD-denominated shares and buy stocks or ETFs in places where they can generate more yield. This shows that the economy in the USA is performing badly. Since the demand for the dollar is less, it adversely affects the value of the US dollar.

Possibility Of Negative Correlation

There is also a possibility that the currency market will rise in answer to a volatile stock market. This may happen due to tons of other factors that contribute to currency performance. We will discuss more related to this topic in the upcoming course lessons.

Don’t forget to take the quiz below before you go. Cheers.

[wp_quiz id=”100352″]
Categories
Forex Market Analysis

Daily F.X. Analysis, January 12 – Top Trade Setups In Forex – Stronger Dollar In Play! 

On the fundamental side, the economic calendar is likely to offer a thin trading volume, and it may offer thin volatility to the market. However, the focus can remain on the MPC Member Broadbent Speaks due to the European session today.

Economic Events to Watch Today  


EUR/USD – Daily Analysis

The EUR/USD closed at 1.21499 after placing a high of 1.22258 and a low of 1.21320. The currency pair extended its losses on Monday and dropped for the third consecutive day amid the broad-based U.S. dollar strength. On Monday, the rising risk-off market mood strengthened the U.S. dollar following the news that China was intensifying coronavirus measures to limit the nation’s rising infection rate. Whereas, greenback investors were also optimistic that President-elect Joe Biden would push for a multi-trillion-dollar stimulus package.

The growing concerns over an increasing number of coronavirus cases throughout Europe and China increased the demand for safe-haven, weighing on the risk perceived EUR/USD pair on Monday. The World Health Organization (WHO) has announced on European countries to curb a new variant of coronavirus that was first detected in the U.K.

The WHO Europe director Hans Kluge has said that coronavirus’s new variant has hit almost 22 European nations, and it was an alarming situation. Many countries have imposed a full national lockdown to stop it from spreading further. However, Hans said that tougher measures were needed to flatten the steep vertical line of rising cases in some countries. These warnings by WHO also raised safe-haven appeal and added losses in the risk-sensitive EUR/USD pair on Monday.

There was no data to be released from the U.S. side on the data front, while from Europe, at 14:30 GMT, the Sentix Investor Confidence dropped to 1.3 against the forecasted 2.0 and weighed on Euro that ultimately added further losses in EUR/USD currency pair. 

On the U.S. front, the recent hike in the greenback was largely a result of higher U.S. Treasury yields that has resulted in a U.S. dollar short squeeze and pushed the greenback to higher levels. The U.S. Dollar Index continued to move higher and has climbed to 90.67, up by 0.67% on the day that added more weight on EUR/USD pair on Monday. 

The greenback was also strong on Monday amid the optimism regarding the prospects of massive stimulus packages from the president-elect Joe Biden. The incoming President has vowed to deliver two major stimulus packages in 2021. He has also said that his first order after joining the office on January 20 will be to increase the number of direct payments to $2000. This has also supported the U.S. dollar and weighed on EUR/USD pair on Monday.

Daily Technical Levels

Support   Resistance

1.2171      1.2215

1.2155      1.2243

1.2127      1.2259

Pivot Point: 1.2199

EUR/USD– Trading Tip

The EUR/USD is obtaining support at the 1.2144 level, and below this, it can dip further until the 1.2100 level. On the higher side, the pair may face resistance at the 1.2216 level. The RSI and MACD support bullish correction and may prompt a bounce off in the EUR/USD pair until the 1.2216 level. Beneath 1.2216, we can again see a dip in EUR/USD. On the hourly timeframe, the EUR/USD pair may find resistance at 1.2170, but the bullish crossover may offer us a quick buy position as the MACD supports the buying trend in the EUR/USD pair today. 


GBP/USD – Daily Analysis

The GBP/USD closed at 1.35100 after placing a high of 1.35679 and a low of 1.34507. The GBP/USD pair lost ground on Monday and dropped to a fresh 2-weeks lowest level amid the broad-based U.S. dollar strength. The pair GBP/USD witnessed some selling for the fourth consecutive session on Monday and extended its retracement slide from 33-months highs. The momentum drew the GBP/USD pair further below as the strong rally in the U.S. Treasury bond yields supported the U.S. dollar. The greenback recovered from nearly three-year lowest level after the treasury yields rally amid the hopes of additional U.S. fiscal stimulus measures. Investors started pricing in the prospects for a more aggressive U.S. fiscal spending in 2021 after the Democratic sweep in the U.S. Senate runoff elections in Georgia.

Meanwhile, the concerns about the surge in new coronavirus cases and the new tougher restrictions in Europe and China to fight against the new variant also weighed on the market sentiment as the safe-haven appeal emerged and contributed to the GBP/USD pair’s decline on Monday.

On Monday, England’s chief medical officer Chris Whitty said that the United Kingdom was enrolling its most challenging weeks since the start of the coronavirus pandemic as hospitals were overrun. He said that the U.K. was now at the worst point of the pandemic, and although they will have the vaccine in the future, the numbers were higher than they were in the previous peak. 

The U.K. has already suffered more deaths due to the new variant than any European nation and recently became the fifth nation on earth to reach the grim milestone of three million cases. Whitty said that there were currently more than 30,000 patients in the hospital than 18,000 during the first peek of the virus in April. Despite the nationwide lockdown, the rising number of coronavirus cases in the U.K. also weighed on the British Pound that ultimately added losses in the GBP/USD pair.

Moreover, the Bank of England policymaker Silvana Tenreyro announced on Monday that skipping British interest rates beneath zero could promote the economy by more than increasing bond purchases. The Bank of England was currently looking at Britain’s financial system’s negative rates’ technical feasibility. She said that she was pushing back against arguments that negative interest rates would be ineffective in boosting demand or would cause significant damage to the bank’s profitability. 

These dovish comments from Tenreyro weighed on British Pound that added losses in the GBP/USD currency pair on Monday.

Daily Technical Levels

Support   Resistance

1.3496      1.3553

1.3475      1.3589

1.3439      1.3611

Pivot Point: 1.3532

GBP/USD– Trading Tip

The GBP/USD has disrupted the sideways trading range of 1.3531- 1.3505 range on the higher side. Closing of candles above this area can trigger buying until the next resistance level of 1.3585 level. On the higher side, the resistance continues to stay at the 1.3605 mark. The 10 & 20 periods moving averages are suggesting odds of bullish trend continuation today. 


USD/JPY – Daily Analysis

The USD/JPY pair was closed at 104.239 after placing a high of 104.396 and a low of 103.848. The currency pair USD/JPY rose for the fourth consecutive session on Monday and reached its highest level since December 10. The gains in USD/JPY were due to the stronger greenback as the U.S. Dollar Index was at weekly highs above 90.50 level on Monday. Wall Street’s main indexes were down on Monday, with Dow Jones down by 0.37% and the NASDAQ by 0.85%. The U.S. Treasury yield on a 10-year note hit the 1.136% level, which was the highest level since the March spike.

The rising treasury yields were due to the rising hopes of additional stimulus measures from the incoming Democratic President Joe Biden. He has promised to deliver two massive stimulus packages to aid the economy through the coronavirus pandemic in 2021. He also has said that his first order after joining the office on January 20 will be to increase the number of stimulus checks to $2000 from $600, which will be given to most Americans affected by the coronavirus pandemic.

Other than that, the USD/JPY pair continued to rise despite the rising risk-off market sentiment in the market. Mainland China saw its most significant daily rise in coronavirus cases in over five months. China’s health authority said on Monday that the new infections in Hebei province surrounding Beijing were continuously rising.

China saw almost 18 new imported infections from overseas, and on Monday, the country in northeastern Heilongjiang province moved into lockdown after reporting new coronavirus infections. These developments in the world’s second-largest economy added weight to risk sentiment that ultimately supported the safe-haven greenback and pushed the USD/JPY pair higher.

Meanwhile, the calls for Trump’s impeachment raised after he encouraged his supporters’ riots on Capitol Hill during the previous week that also kept the market sentiment soar. In Washington, the speaker of House of Representatives, Nancy Pelosi, called for Vice President Mike Pence and the cabinet to remove Donald Trump from office before moving to impeachment. This also helped raised the risk-off market sentiment and supported the USD/JPY pair’s upward momentum.

Furthermore, on Monday, the President and chief executive officer of the Federal Reserve Bank of Atlanta, Raphael Bostic, said that interest rates could rise sooner than anticipated as the economy was recovering more quickly than projected from the coronavirus damage. 

Fed had previously hoped that rates would remain unchanged until at least 2023, whereas Bostic believes that the Fed’s emergency measures to fight the pandemic can start to be rolled back within the next two years, if not sooner. These comments from Bostic supported the U.S. dollar and added gains in the USD/JPY pair. However, the Federal Reserve Chairman Jerome Powell will deliver a speech on Thursday and reaffirm interest rates to stay around zero through at least 2023.

Daily Technical Levels

Support   Resistance

103.90      104.17

103.74      104.26

103.64      104.43

Pivot Point: 104.00

USD/JPY – Trading Tips

On Tuesday, the safe-haven currency pair USD/JPY is trading at 104.123 level, facing resistance at 104.400. On the 4 hour timeframe, the USD/JPY pair implies bullish bias, and as the 10 and 20 EMA are in support of upward trend whereas the MACD stays over 0, suggesting a bullish trend in the safe-haven USD/JPY pair. An upward breakout of the 104.223 level can extend the buying trend until the 104.610 level today. Let’s consider taking the buying trade over the 104.223 level and selling below the same. Good luck! 

Categories
Forex Fundamental Analysis

EUR/CHF Global Macro Analysis – Part 3

EUR/CHF Exogenous Analysis

  • The EU and Switzerland Current Account to GDP differential

The ratio of the current account to GDP helps us determine the level of a country’s participation in the international market. When a country has net exports, it means that it will have a current account surplus; and, the larger the surplus, the higher the current account to GDP ratio. Conversely, a country with higher imports than exports; it means it has a current account deficit, and its current account to GDP ratio will be lower.

The domestic currency will be in higher demand in the forex market when a country is a net exporter.

In 2020, the Swiss Current Account to GDP is projected to reach 7.5% and that of the EU 3.4%. Thus, the current account to GDP differential between the EU and Switzerland is -4.1%. That means we should expect that the CHF will be in higher demand than the EUR. Thus, we assign a score of -5.

The interest rate differential for the EUR/CHF pair determines which of these currencies is preferable to investors and carry traders in the forex market. When the interest rate differential is positive, it means that investors will earn more by buying the EUR. Similarly, carry traders will be bullish on the EUR/CHF pair, thus driving the exchange rate higher. A negative interest rate differential implies that the Swiss Franc will be preferable to investors, while carry traders will be bearish on the pair.

The Swiss National Bank has maintained the interest rate at -0.75% throughout 2020, and the ECB interest rate has been at 0%. The interest rate differential for the EUR/CHF pair is 0.75%. We assign a score of 2.

  • The EU and Switzerland GDP Growth Rate differential

The GDP growth differential is the difference between the rate at which the EU and the Swiss economy are growing. This will help us identify which economy is growing faster. A positive GDP growth differential between the EU and Switzerland will result in a higher exchange rate for the EUR/CHF pair. A negative one will lead to a drop in the exchange rate for the pair.

In the first three quarters of 2020, the EU economy has contracted by 2.9% while the Swiss economy contracted by 1.5%. The GDP growth rate differential is -1.4%. We assign a score of -3.

Conclusion

The exogenous factors between the EUR/CHF pair have a score of -6; which implies that the pair can be expected to be on a downtrend in the short term.

As you can see above, the Technical analysis shows that the weekly chart for the EUR/CHF pair has failed to breach the upper Bollinger band successfully and has bounced off of it supporting our fundamental analysis. All the best.

Categories
Forex Fundamental Analysis

EUR/CHF Global Macro Analysis – Part 1 & 2

Introduction

In conducting the global macro analysis of the EUR/CHF pair, we’ll focus on endogenous economic factors that contribute to the growth of GDP in the EU and Switzerland. Exogenous factors that influence the exchange rate of the EUR/CHF in the forex market will also be analysed.

Ranking Scale

A sliding scale of -10 to +10 will be used to rank the impact of endogenous and exogenous factors.

The ranking of the endogenous factors will be based on their correlation analysis with the GDP growth rate. A negative score implies that they resulted in the contraction of the economy hence depreciating the domestic currency. A positive score implies that they led in economic expansion hence appreciation of the domestic currency.

The exogenous factors are ranked based on their correlation with the EUR/CHF exchange rate. A positive score means that the pair lead to an increase in the exchange rate, while a negative ranking means that the exchange rate has decreased.

EUR Endogenous Analysis – Summary

The EUR’s endogenous analysis has a score of -3. This implies that the Euro had marginally depreciated in 2020.

CHF Endogenous Analysis – Summary

The change in the level of employment covers the quarterly developments in the labour market in Switzerland. The statistic includes the changes in both fulltime and parttime employment. Typically, changes in employment is a result of changes in business activities.

In Q3 of 2020, 5.08 million people were employed in Switzerland compared to 5.02 million in Q2. The employment level is still below the 5.11 million registered in Q1. We assign a score of -4.

  • Switzerland GDP Deflator

Switzerland GDP deflator is used to calculate the change in real GDP in terms of prices of all goods and services produced within the country. This is a comprehensive measure of inflation compared to measures like CPI and PPI, which only focus on a small portion of the economy.

In Q3 2020, Switzerland GDP deflator rose to 98.8 from 98 in Q2.  Up to Q3, the GDP deflator has increased by 0.8 points. The increase in inflation can be taken as an indicator that the economy is bouncing back from the economic shocks of the coronavirus pandemic. We assign a score of 3.

  • Switzerland Industrial Production

This indicator shows the changes in output for firms operating in the manufacturing, mining, quarrying, and electricity production. Although Switzerland is not heavily dependent on industrial production, it is still an integral part of the economy.

In Q3 2020, the industrial production in Switzerland increased by 5% from a drop of 9% in Q2. The YoY industrial production for Q3 was down 5.1%. For the first three quarters of 2020, the industrial production is down 3.8%. We assign a score of -3.

  • Switzerland Manufacturing PMI

This is an indicator of the economic health of the Swiss manufacturing sector. The purchasing managers are surveyed based in a questionnaire which covers the output in the sector, suppliers’ deliveries, inventories, new orders, prices, and employment. A PMI of above 50 shows that the Swiss manufacturing sector is expanding, while below 50 shows that the sector is contracting.

In November 2020, Switzerland manufacturing PMI rose to 55.2 from 52.3 in October. This is the highest reading since December 2018 and the fourth consecutive month of expansion since July. We assign a score of 7.

  • Switzerland Retail Sales

The retail sales measure the consumption of final goods and services by households in Switzerland. The expenditure by households drives the aggregate demand in the economy, which results in the changes in GDP.

In October 2020, Switzerland retail sales increased by 3.2% from a drop of 3.2% in September. YoY retail sales increased by 3.1% in October from 0.4% in September. Up to October 2020, the average retail sales has increased by 0.84%. We assign a score of 1.

  • Switzerland Consumer Confidence

About 1000 Swiss households are surveyed in January, April, July and October. They are evaluated based on their opinions about the economy, job security, financial status, inflation, and purchases. Consumer confidence tends to be higher when the economy is expanding and low during recessions.

In Q4 2020, the Swiss consumer confidence dropped to -12.8 from 12 in Q3. Although it is higher than it was in Q2 at the height of the pandemic, it is still lower than in Q1. The expectations on households’ financial situation also dropped to -6.6 from -4.2 in Q2. Households were increasingly pessimistic about the labour market and their job security. this can be attributed to the uncertainties that surround the ongoing coronavirus pandemic. We assign a score of -2.

  • Switzerland Government Gross Debt to GDP

This is the total amount that the Swiss government owes to both domestic and international lenders is expressed as a percentage of the GDP. It helps us to understand and evaluate the size of the debt relative to the size of the economy. At below 60%, the government is seen as being able to service its debt obligations and have room to acquire more debt without straining the economy.

In 2019, the Switzerland government gross debt to GDP was 41% same as in 2018. In 2020, it is expected to range between 49% and 51% due to aggressive expenditure to alleviate the shocks of coronavirus pandemic. We assign a score of -1.

In the very next article, you can find the exogenous analysis of the EUR/CHF Forex pair. Please check that and let us know if you have any questions below. Cheers.

Categories
Forex Signals

AUD/USD Violates Ascending Triangle – Double Bottom Support! 

The AUD/USD closed at 0.77665 after placing a high of 0.77984 and a low of 0.77280. The currency pair AUD/USD remained flat throughout the day on Friday and closed its day at the same level it began its day with as the risk rally pushed the pair higher and the US dollar strength dragged the pair AUD/USD lower at the same time. 

The risk-sensitive Aussie just went with the flow and boosted by rallying equities and persistent hopes that the economic chaos triggered by the coronavirus pandemic was on its final stage. The risk sentiment in the market was also supported by the latest announcement from the UK on Friday. The UK announced that it’s medical regulatory has approved a third vaccine for coronavirus made by Moderna for emergency use authorization. 

The rising risk sentiment was also supported by the decreasing political risk in Washington related to power transition. The US President Donald Trump has agreed to a transition of power, and this has raised the risk sentiment in the market and supported the upward momentum in AUD/USD pair in the early trading session. However, the AUD/USD pair’s gains were lost in the late trading hours on Friday after the US Dollar became strong across the board. The greenback was high on Friday, with the US Dollar Index above the 90.00 level for the first time this week. The US treasury yields on the 10-year note were also high on Friday, with 3% up for the day and 21% up for the week. All these factors added to the US dollar demand that ultimately weighed on AUD/USD pair and forced the pair to lose its early daily gains.

On the data front, from the US side, at 18:30 GMT, the Average Hourly Earnings for December raised to 0.8% against the predicted 0.2% and supported the US dollar that added further weight to AUD/USD pair. In December, the Non-Farm Employment Change plunged to -140K against the predicted 60K and weighed on the US dollar. During December, the Unemployment Rate plunged to 6.7% against the predicted 6.8% and supported the US dollar that added further AUD/USD pair losses. At 20:00 GMT, the Final Wholesales Inventories for November came in as 0.0% against the predicted -0.1% and weighed on the US dollar.

The AUD/USD pair remained flat throughout Friday amid the mixed market sentiment and left the investors to await the publication of the final reading of November Retail Sales from Australia while China will provide an update on inflation that will also remain under close observation by AUD/USD investors. 

On Thursday, China will release its December Trade Balance that may also impact AUD/USD pair. The US’s CPI data on Wednesday and Retail Sales on Thursday will also affect the AUD/USD pair’s momentum in upcoming days.


Daily Technical Levels

Support Resistance

0.7700 0.7755

0.7679 0.7789

0.7645 0.7811

Pivot point: 0.7734

The AUD/USD pair has bounced off over the 0.7690 level, forming a bullish engulfing candle on the 2-hour timeframe. It may bounce off to trade until the 0.7740 level, where 10 & 20 periods EMA are likely to extend resistance at 0.7740. On the lower side, the AUD/USD may find support at the 0.7690 level. A bearish breakout of 0.7690 level can extend the selling trend until the next support area of 0.765 level today. Good luck! 

Categories
Crypto Market Analysis

Daily Crypto Review, Jan 11 – Crypto Sector Plummets as BTC Drops to $32k

The crypto sector experienced dipped over $100 billion in market cap as Bitcoin, and the rest of the market plummeted. Bitcoin is currently trading for $35,165, representing a decrease of 13.31% compared to yesterday’s value. Meanwhile, Ethereum’s price has dropped up to 20.64% on the day, while LTC lost 23.04% of its value.

Daily Crypto Sector Heat Map

Foglory Coin gained 589.61% in the past 24 hours, making it the most prominent daily crypto gainer by far. It is followed by NewsToken’s 175.33% and BELIEVER’s 166.3% gain. On the other hand, True Seigniorage Dollar lost 78.35%, making it the most prominent daily loser. It is followed by the 3x Long Bitcoin SV Token’s loss of 76.74% and 3x long EOS Token’s loss of 69.18%.

Top 10 24-hour Performers (Click to enlarge)

Bottom 10 24-hour Performers (Click to enlarge)

Bitcoin’s market dominance has moved down over a percent since our last report, with its value currently being 68.6%. This value represents a 1.2% difference to the upside than the value it had when we last reported.

Daily Crypto Market Cap Chart

The cryptocurrency sector capitalization has decreased slightly since we last reported, with its current value being $906.07 1,03 trillion. This represents a $2 billion decrease when compared to our previous report.

_______________________________________________________________________

What happened in the past 24 hours?

_______________________________________________________________________

_______________________________________________________________________

Technical analysis

_______________________________________________________________________

Bitcoin

Bitcoin has had an interesting weekend, with its price plummeting in recent hours. Its price dipped to the lows of $32,330 just a few hours ago as major buy positions got liquidated. The largest cryptocurrency by market cap slowly fell below the 21 and 50 moving averages, confirmed its position below then, and then headed straight to the downside with almost no pushback.

However, bulls picked up the pace and are currently fighting for the $35,000 level. Investors used this as a buying/accumulation opportunity, while most traders got liquidated (both short and long positions due to the sudden volatility).

BTC/USD 1-hour chart

Bitcoin’s technicals on the daily, weekly, and monthly time-frame show a tilt towards the buy-side with no or slight signs of neutrality, while its 4-hour overview shows a slight tilt towards the sell-side.

BTC/USD 1-day Technicals

Technical factors (1-hour Chart):

  • Price is below both its 50-period EMA and its 21-period EMA
  • Price is near its bottom Bollinger band
  • RSI is near the oversold territory (37.28)
  • Volume is above average

Key levels to the upside:          Key levels to the downside:

1: $36,640                             1: $33,200

2: $40,000                             2: $30,640

3: $42,000                             3: $27,960

Ethereum

Ethereum matched Bitcoin in direction, but did so with increased intensity. The second-largest cryptocurrency by market cap dipped over 20% on the day as its price fell to just above $1,000. This level seems to have held quite nicely, creating space for Ether to recover.

Ethereum is now trading above the $1,060.5 support level and shows no signs of falling again. However, Bitcoin’s movement will greatly affect the future price direction of ETH.


ETH/USD 1-hour Chart

Ethereum’s technicals on the daily, weekly, and monthly time-frame show a tilt towards the buy-side with no or slight signs of neutrality, while its 4-hour overview shows a slight tilt towards the sell-side.

ETH/USD 1-day Technicals

Technical Factors (1-hour Chart):

  • Price is below both its 50-period and its 21-period EMA
  • Price is near its bottom Bollinger band
  • RSI is near the oversold (31.12)
  • Volume is significantly above-average

Key levels to the upside:          Key levels to the downside:

1: $1,129                               1: $1,060.5

2: $1,211                               2: $1,047.5

3: $1,226.5                             3: $992

Litecoin

Litecoin was one of the major gainers today as well, with its price dropping from $172 all the way down to $124. While bulls did pick up the pace and returned its price to the ~$140 zone, Litecoin is still fighting to maintain its position and tackle the $142.1 level.

Litecoin seemingly got hit the hardest out of the three cryptocurrencies, with its price position still being fairly uncertain. This could prove to be a trading opportunity as the cryptocurrency might make a move independent of Bitcoin’s move in the short future (if Bitcoin itself doesn’t move first).


LTC/USD 1-hour Chart

Litecoin’s technicals on the daily, weekly, and monthly time-frame show a tilt towards the buy-side with slight signs of neutrality, while its 4-hour overview shows a strong tilt towards the sell-side.

LTC/USD 1-day Technicals

Technical factors (1-hour Chart):

  • Its price is currently below both its 50-period EMA and its 21-period EMA
  • Price near its bottom Bollinger band
  • RSI is in the oversold territory (29.68)
  • Volume is on above-average levels

Key levels to the upside:          Key levels to the downside:

1: $161.5                               1: $142.1

2: $181.3                               2: $128.42

3: $186.3                               3: $114.75

Categories
Forex Course

205. How Global Equity Markets Affect The Forex Market?

Introduction

The equity market is also referred to as the stock or share markets. This is an extensive marketplace where traders and investors purchase and sell shares of the publicly listed organizations. The company’s share, stock, or equity is an important financial instrument that denotes the company’s ownership. Contrary to the market, when you buy a share in the stock market, you own a percentage of the company’s overall shares.

Global equity markets have a direct impact on the Forex market. A stable equity market reflects a good currency. Generally, when the country’s equity market is performing well, it attracts higher foreign investors. Therefore, it increases the demand for the local currency, resulting in a boost in a positive trade balance as well as currency appreciation.

Contrarily, when the equity market is not performing well, the investors begin to pull out their money and invest in safer securities. This results in a decrease in the demand for a particular currency.

Impact Of Global Equity Markets On The Forex Market

Forex and equity markets trades center on the currency exchanges of various countries. In case there is a rise in the equity market, more international investors will want to put their money in that particular stock.

However, to do the same, they need to transfer their local currency to the currency of a particular country. This increases the currency demand for the nation. So when there is a huge demand for the currency, its value naturally increases in the market.

Example Of How The Equity Markets Impact Forex Market

If you are looking to invest in the UK’s stock market and your local currency is US dollars. So you need first to change the USD to GBP. This way, you are selling the US dollar while purchasing the GBP.

When more people sell the USD to buy GBP, it increases the demand for pounds, thereby boosting the value of the GBP. Additionally, it also contributes to a positive trade balance. On the other hand, since more US dollars are being sold, it increases the supply of USD, which results in a fall in the value of the dollar.

So when the demand for the currency rises, its value appreciates. This makes the forex market more bullish. Similarly, if the currency demand falls, its value will also fall. It will make the forex market more bearish.

We hope you got the gist of what we are talking about. In the upcoming course lessons, we will be learning more about various equity markets and how their movement can be used to predict the Forex price charts. Cheers.

[wp_quiz id=”101514″]
Categories
Forex Market Analysis

Daily F.X. Analysis, January 11 – Top Trade Setups In Forex – Stronger Dollar In Play! 

On the news side, the European Sentix Investor Confidence will be in focus, along with speeches from UK MPC Member Tenreyro, and the U.S. FOMC Member Bostic will remain in highlights. The U.S. dollar was also strong on the board, mainly because of the rising U.S. treasury yields that rose more than 3% on the day. The unemployment rate and average hourly earnings data from the U.S. support the greenback. 

Economic Events to Watch Today  


EUR/USD – Daily Analysis

The EUR/USD pair was closed at 1.22122 after placing a high of 1.22844 and a low of 1.21928. The EUR/USD pair dropped on Friday and extended its losses amid the broad-based strength of the U.S. dollar on the day amid the rising U.S. Treasury yields.

The U.S. dollar was also strong on the board, mainly because of the rising U.S. treasury yields that rose more than 3% on the day. The unemployment rate and Average Hourly earnings data from the U.S. also supported the greenback that ultimately added further losses in the currency pair EUR/USD. From the U.S. side, at 18:30 GMT, the Average Hourly Earnings for December rose to 0.8% against the forecasted 0.2% and supported the U.S. dollar and weighed on EUR/USD prices. In December, the Non-Farm Employment Change fell to -140K against the forecasted 60K and weighed on the U.S. dollar and capped further losses in EUR/USD pair. 

During December, the Unemployment Rate fell to 6.7% against the forecasted 6.8% and supported the U.S. dollar that added further EUR/USD pair losses. At 20:00 GMT, the Final Wholesales Inventories for November came in as 0.0% against the forecasted -0.1% and weighed on the U.S. dollar that limited the losses in EUR/USD pair on Friday.

Meanwhile, the fact that Democratic leader and incoming President Joe Biden will have complete control over all three legislative houses included the White House, the House of Representatives, and the Senate, also supported the U.S. dollar as it suggested a stable government ahead. The U.S. President Donald Trump also agreed to an orderly transition of power that also lifted the lingering political risk from the local currency and gave further strength to the U.S. dollar that ultimately added further pressure on the EUR/USD pair on Friday.

Daily Technical Levels

Support   Resistance

1.2228     1.2330

1.2186     1.2388

1.2127     1.2431

Pivot Point: 1.2287

EUR/USD– Trading Tip

The strength in the U.S. dollar also dragged the EUR/USD pair lower to the 1.2175 level. For the moment, the EUR/USD is gaining support at the 1.2175 level, and below this, it can dip further until the 1.2130 level. On the higher side, the pair may face resistance at the 1.2216 level. The RSI and MACD support bullish correction, and these may cause a bounce off in the EUR/USD pair until the 1.2216 level. Below 1.2216, we can again see a dip in EUR/USD.


GBP/USD – Daily Analysis

The GBP/USD pair was closed at 1.35606 after placing a high of 1.36356 and a low of 1.35382. The currency pair GBP/USD remained flat throughout Friday as it showed no movement and closed the day at the same level it started its day with. The pair GBP/USD raised during the early trading session on the day but faced some heavy pressure during the second half of the day and closed the trading week at the same level it started its day on Friday. The rise in the early trading session was caused after the U.K. announced the approval to use its third coronavirus vaccine. However, the downward pressure on the currency pair was caused by the relative strength of the U.S. dollar amid the rising U.S. Treasury yields on the day.

After the coronavirus press conference of the British Prime Minister Boris Johnson on Friday, the PM announced that the army would be brought in to help aid the vaccination rollout. On Friday, Britain’s medical regulatory approved Moderna’s coronavirus vaccine for emergency use. The U.K. also agreed to purchase an additional 10 million doses; however, the Moderna vaccine will not play a part in the first stage of Britain’s vaccine rollout.

The Health Minister of Britain, Matt Hancock, said that about 1.5 million people have already been vaccinated across the U.K. and Moderna’ ‘s vaccine will allow them to accelerate their vaccination program even further once doses become available in spring. These comments from the U.K. added optimism and supported the GBP/USD pair to rise in the early trading session on Friday.

However, the gains in GBP/USD currency pair could not live for long as the pair faced heavy pressure from the U.S. dollar’s strength and the rising number of coronavirus cases and deaths across the U.K. despite vaccine rollout. The U.S. Dollar was strong across the board after the U.S. Treasury yields rose on Friday to more than 3% amid the full sweep victory of Democrats over the Senate. The incoming President Joe Biden is expected to have full control over the White House, Senate, and House of Representatives added in the local currency as the incoming government will have more stability in rules.

In the capital, London’s mayor declared a major incident on Friday and issued a warning that hospitals in the city were close to being overrun. London’s situation was critical with the spread of the virus out of control as the city was declared to be at a crisis point. These developments in the U.K. also added pressure on British Pound and dragged the pair lower on Friday.

Daily Technical Levels

Support   Resistance

1.3496     1.3553

1.3475     1.3589

1.3439     1.3611

Pivot Point: 1.3532

GBP/USD– Trading Tip

The GBP/USD has violated the sideways trading range of 1.3625 – 1.3530 level, and closing of candles below this area can trigger selling until the next support level of 1.3452 level. On the higher side, the resistance continues to stay at the 1.3530 mark. On the hourly timeframe, the GBP/USD pair has violated the descending triangle pattern at the 1.3547 level, and now this level is likely to provide selling in the pair. Violation of the triangle pattern can extend selling bias today.


USD/JPY – Daily Analysis

The USD/JPY pair was closed at 103.951 after placing a high of 104.090 and a low of 103.602. The USD/JPY pair raised on Friday and extended its gains as the U.S. dollar was strong across the board amid the rising U.S. Treasury bond yields. The USD/JPY pair staged an impressive rebound and rose more than 150 pips in two days as the 10-year U.S. Treasury bond yield placed almost 13% gains in these two days. Over the week, the 10-year note U.S. Treasury yield has risen by about 21% and has supported the greenback since then. 

The U.S. dollar’s strength added further gains in the USD/PY pair and extended its upward momentum on Friday to its highest since December 15. The U.S. Dollar Index was also high beyond the 90.00 level for the first time in the week and supported the USD/JPY pair’s rise. Meanwhile, another factor involved in the rising demand for the U.S. dollar was Donald Trump’s comments, who agreed on a smooth transition of power. The political risk related to transition power that rose after Thursday’s attack was lifted and supported the local currency on Friday that eventually helped the USD/JPY pair to rise further n board. It means that the incoming President Joe Biden will have control over all three legislative bodies, the White House, the House of Representatives, and the U.S. Senate, to give his Democratic Party stability in rules. 

Despite all these positive sentiments, the incoming president promised to deliver two massive stimulus packages in 2021, and his first order is expected to increase the direct payment checks to $2000 kept the local currency USD under pressure and capped further upside in the USD/JPY pair. 

On the data front, at 04:30 GMT, the Household Spending from Japan in November raised to 1.1% against the expected -1.0% and supported the Japanese Yen that capped further upside in the USD/JPY pair. At 10:00 GMT, the Leading Indicators from Japan remained flat at 96.6%. 

From the U.S. side, at 18:30 GMT, the Average Hourly Earnings for December advanced to 0.8% against the projected 0.2% and supported the U.S. dollar that pushed the USD/JPY pair higher. In December, the Non-Farm Employment Change decreased to -140K against the projected 60K and weighed on the U.S. dollar. During December, the Unemployment Rate decreased to 6.7% against the projected 6.8% and supported the U.S. dollar that added further gains in the USD/JPY pair. At 20:00 GMT, the Final Wholesales Inventories for November came in as 0.0% against the projected -0.1% and weighed on the U.S. dollar that capped further upside in the USD/JPY pair on Friday. Furthermore, the USD/JPY pair’s upward momentum was also supported by the rising risk sentiment in the market. The risk flows were encouraged after the U.K. approved another vaccine from Moderna on Friday. U.K. became the first country to approve a third coronavirus vaccine for emergency use authorization that lifted the market’s risk sentiment that ultimately added weight on the safe-haven Japanese Yen and pushed the USD/JPY pair even higher on board.

Daily Technical Levels

Support   Resistance

103.18     104.19

102.56     104.58

102.16     105.21

Pivot Point: 103.57

USD/JPY – Trading Tips

The USD/JPY is trading at 104.123 level, facing immediate resistance at 104.223. On the 4 hour timeframe, the USD/JPY pair suggests bullish bias, and as the 10 and 20 periods, EMA is in support of buying trend while the MACD holds above 0, supporting bullish bias in the USD/JPY pair. A bullish breakout of the 104.223 level can extend the buying trend until the 104.610 level today. Let’s consider taking the buying trade over the 104.223 level and selling below the same. Good luck! 

Categories
Crypto Market Analysis

Daily Crypto Review, Jan 8 – Bitcoin Continues Its Rise as it Breaks the $40k Mark Briefly

The crypto sector pushed even higher as Bitcoin passed the $40,000 mark and created a new all-time high. Bitcoin is currently trading for $39,094, representing an increase of 5.35% compared to yesterday’s value. Meanwhile, Ethereum’s price has decreased by 1% on the day, while XRP gained 23.53% of its value.

Daily Crypto Sector Heat Map

COVER Protocol gained 2124.46% in the past 24 hours, making it the most prominent daily crypto gainer by far. It is followed by KIMCHI.finance’s 1159.97% and TAI’s 265.52% gain. On the other hand, Stand Share lost 74.11%, making it the most prominent daily loser. It is followed by the Receive Access Ecosystem’s loss of 61.71% and CY Finance’s loss of 56.34%.

Top 10 24-hour Performers (Click to enlarge)

Bottom 10 24-hour Performers (Click to enlarge)

Bitcoin’s market dominance has moved up half a percent since our last report, with its value currently being 69.8%. This value represents a 0.5% difference to the upside than the value it had when we last reported.

Daily Crypto Market Cap Chart

The cryptocurrency sector capitalization has decreased slightly since we last reported, with its current value being $1,03 trillion. This represents a $2 billion decrease when compared to our previous report.

_______________________________________________________________________

What happened in the past 24 hours?

_______________________________________________________________________

_______________________________________________________________________

Technical analysis

_______________________________________________________________________

Bitcoin

Bitcoin has continued moving up, with its price surpassing the $38,000 and $39,000 mark without much problem. The largest cryptocurrency by market cap reached as high as $40,402.5 level before crashing down as bulls could not sustain the price. The price instantly dipped to $36,388 but quickly recovered to the $39,000 area, where it is consolidating at the moment.

Bitcoin has positioned itself for another push towards the upside as it quickly found support in the 50-hour moving average, proving that it doesn’t even need to dip to the horizontal support levels to stabilize itself.


BTC/USD 4-hour chart

Bitcoin’s technicals on the 4-hour, daily, and weekly chart show a tilt towards the buy-side with no signs of neutrality or bearishness. On the other hand, its monthly overview shows slight bearishness in the oscillator sector opposing the overall bullishness.

BTC/USD 1-day Technicals

Technical factors (4-hour Chart):

  • Price is above both its 50-period EMA and its 21-period EMA
  • Price is between its middle and top Bollinger band
  • RSI is in the overbought territory (70.36)
  • Volume is above average

Key levels to the upside:          Key levels to the downside:

1: $40,402                             1: $38,140

2: $43,000                             2: $36,740

3: $46,500                             3: $35,610

Ethereum

Ethereum followed Bitcoin to the upside, pushing its price above its previous resistance levels and up to as high as $1292. Just like Bitcoin, Ethereum instantly dipped to $1,140 but quickly recovered. However, this is where the high correlation with Bitcoin ends, as Ethereum didn’t recover its recent highs but rather lost quite a bit of its value.

While it has recovered since the price dip, Ethereum is now right below the $1,211 resistance level. The cryptocurrency has a high possibility of passing it even if Bitcoin remains stagnant. Still, any moves that would contest the next resistance level would have to be backed by the largest cryptocurrency by market cap.


ETH/USD 1-hour Chart

Ethereum’s technicals on the daily time-frame show an overall bullish tilt with no hints of neutrality. On the other hand, the monthly, weekly, and 4-hour time-frames show some signs of neutrality or even bearishness.

ETH/USD 1-day Technicals

Technical Factors (4-hour Chart):

  • Price is above its 50-period and at its 21-period EMA
  • Price is near its middle Bollinger band
  • RSI has left the overbought area (63.27)
  • Volume is significantly above-average

Key levels to the upside:          Key levels to the downside:

1: $1,292                               1: $1,211

2: $1,420                               2: $1,180

3: $1,500                               3: $1,092

Litecoin

Litecoin followed the market as well, pushing its price further up and breaking its previous resistance level of $174.5. However, while LTC did manage to break this level and post a new high of $181.25 for a moment, the price was unsustainable, resulting in a classic price drop, followed by a failed attempt of recovering (the moment when LTC hit the $174.5 level after dropping below it) acting as a confirmation of a price drop, and then a full-on retracement towards the downside.

Litecoin has bounced off of the $152.25 level beautifully and is now attempting to pass the 50-hour and 21-hour moving averages and continue its move up.


LTC/USD 1-hour Chart

Litecoin’s technicals on the 4-hour, daily, and weekly time-frame are bullish but show some neutrality or even bearishness. On the other hand, its monthly overview is completely bullish.

LTC/USD 1-day Technicals

Technical factors (4-hour Chart):

  • Its price is currently above its 50-period EMA and at its 21-period EMA
  • Price at its middle Bollinger band
  • RSI is neutral (54.95)
  • Volume is on above-average levels

Key levels to the upside:          Key levels to the downside:

1: $174.5                               1: $163.7

2: $181.3                               2: $155.25

3: $195.5                               3: $149.3


Categories
Forex Market Analysis

Daily F.X. Analysis, January 08 – Top Trade Setups In Forex – U.S. NFP Figures Ahead! 

The eyes will remain on the U.S. NFP data on the news side, which is expected to report a slight drop from 638K to 500K during the previous month. Besides, the U.S. Average Hourly Earnings m/m and Unemployment Rate will also remain the main highlight of the day, and these may determine the USD trend for today and next week. Let’s wait for the news.

Economic Events to Watch Today  


EUR/USD – Daily Analysis

The EUR/USD pair was closed at 1.22690 after placing a high of 1.23442 and a low of 1.22449. The EUR/USD pair came under renewed pressure as the U.S. dollar rebounded after an increased 10-year U.S. treasury yield and the depressing economic data from the Eurozone. The U.S. Dollar was strong onboard after falling to the multi-year lowest level this week amid the rising U.S. Treasury yield on a 10-year note that raised by 1% for the first time since March. The rising demand for the greenback ultimately added weight on EUR/USD pair that fell on Thursday.

However, the strong demand for the U.S. dollar is expected not to live for a large time as the Democratic win in the U.S. Senate elections has raised the prospects for a larger stimulus package that will ultimately weigh on the local currency. Meanwhile, the European Central Bank released the regular economic bulletin on Thursday in which it said that the Eurozone economic indicators point to an economic contraction in the final quarter of 2020. 

The ECB said that high-frequency indicators and the latest survey results were consistent with a fall in GDP in the final quarter of 2020. The survey indicators point to a renewed contraction in activity mainly affecting the services sector. The ECB also said that the stat of vaccinations supports expectations for a rapid recovery. Still, it will take time before widespread immunity could be reached and the economy could return to normal. These depressing comments from ECB also added weight on the single currency Euro that added further pressure on EUR/USD pair on Thursday.

On the data front, at 12:00 GMT, the German Factory Orders in November raised to 2.3% against the expectations of -0.6% and supported the single currency Euro that capped further downside in EUR/USD pair. At 15:00 GMT, the CPI Flash Estimate for the year for December declined to -0.3% against the expected -0.2% and weighed on Euro that added losses in EUR/USD pair. The Core CPI Flash Estimate remained flat with expectations of 0.2%. The Italian Prelim CPI also raised to 0.3%against the forecasted 0.2% and supported Euro and capped further downside in EUR/USD pair. The Retail Sales from Eurozone dropped to -6.1% against the forecasted -3.4% and weighed heavily on Euro that added further downside pressure on EUR/USD pair.

The Challenger Job Cuts for the year in December rose to 134.5% compared to November’s 45.4%. At 18:30 GMT, the Unemployment Claims from last week were dropped to 787K against the expected 798K and supported the U.S. dollar that added losses in EUR/USD pair. The Trade Balance from November showed a deficit of -68.1B against the expected -66.7B and weighed on the U.S. dollar that capped further downside in EUR/USD pair. The ISM Services PMI rose in December to 57.2 against the expected 54.5 and supported the U.S. dollar that added further losses in EUR/USD pair on Thursday.

Daily Technical Levels

Support   Resistance

1.2228      1.2330

1.2186      1.2388

1.2127      1.2431

Pivot Point: 1.2287

EUR/USD– Trading Tip

The EUR/USD continues trading with a bullish bias at 1.2367, facing resistance at the 1.2350 level. On the lower side, the support continues to hold around the 1.2278 level. Simultaneously, the bullish breakout of the 1.2350 resistance level can extend buying until the 1.2435 level. The leading indicators such as RSI and MACD support selling, but the EUR/USD 50 periods EMA is likely to support at 1.2289. 


GBP/USD – Daily Analysis

The GBP/USD pair was closed at 1.35641 after placing a high of 1.36330 and a low of 1.35324. The GBP/USD pair extended its losses on Thursday amid the broad-based U.S. dollar recovery amid the rising safe-haven demand and the British Pound’s weakness due to the rising deaths from a new coronavirus variant. Since March, the U.S. Dollar was high on board after the U.S. 10-year Treasury yield rose by more than 1% for the first time. The U.S. Dollar Index that measures the value of the greenback against the basket of six major currencies also recovered from the multi-year lowest level and supported the U.S. dollar that ultimately added weight on the GBP/USD pair on Thursday.

Moreover, the U.S. dollar gains were limited as the pressure of prospects of a larger stimulus package in 2021 from the Democratic government held the local currency down. The Democratic win in the U.S. Senate elections raised the anticipations that President-elect Joe Biden will stand true to His promises for delivering two major stimulus packages in 2021. 

However, the losses in the GBP/USD pair could also be attributed to the rising number of deaths in the U.K. from the new UK coronavirus variant. The U.K. reported a further 1041 fatalities due to coronavirus, which is the highest daily death toll since April. 

On Thursday, about 62,322 new coronavirus cases were recorded, which was also the highest daily rise since mass testing began. The rising spread of coronavirus due to its new variant and the increased number of deaths despite the nationwide lockdown and vaccine rollout raised fears for the newly independent nation Great Britain’s economy that ultimately weighed on the local currency Sterling and dragged the currency pair GBP/USD on the downside.

Furthermore, the World Health Organization (WHO) called on European countries to intensify coronavirus measures as the region deals with the new UK-detected variant. On Thursday, the WHO Europe director Hans Kluge said that further measures were needed to flatten the steep vertical line of rising cases in some countries. Moreover, the French Prime Minister Jean Castex said that France’s border with the U.K. will remain shut and that it was out of the question to lower their guard in weeks to come. These statements also weighed on British Pound and affected the GBP/USD pair’s movement on Thursday.

The Construction PMI for December from Great Britain came in line with the expectations of 54.6. At 14:32 GMT, the Housing Equity Withdrawal for the quarter also remained flat with the expectations of -7.0B. The Challenger Job Cuts for the year in December surged to 134.5% compared to November’s 45.4%. At 18:30 GMT, the Unemployment Claims from last week fell to 787K against the projected 798K and supported the U.S. dollar that added losses in GBP/USD pair. The Trade Balance from November showed a deficit of -68.1B against the projected -66.7B and weighed on the U.S. dollar that capped further downside in GBP/USD pair. The ISM Services PMI surged in December to 57.2 against the projected 54.5 and supported the U.S. dollar that added further GBP/USD pair losses on Thursday.

The GBP/USD pair’s losses were limited as the U.K. government was trying to increase the vaccination supply to control coronavirus spread. The health minister Matt Hancock has said on Thursday that the Britain government was working with both Pfizer and AstraZeneca to increase supplies as the pace of Britain’s rollout of coronavirus vaccines was being limited by the supply of shots. He said that the government must quickly ramp up the rate of vaccinations to meet an ambitious target to protect more than 13 million people who were elderly, vulnerable, or frontline workers by mid-February. 

Daily Technical Levels

Support   Resistance

1.3518      1.3620

1.3474      1.3678

1.3416      1.3722

Pivot Point: 1.3576

GBP/USD– Trading Tip

The GBP/USD pair continues to consolidate in a narrow trading range of 1.3625 – 1.3556. The Sterling may face immediate resistance at the 1.3625 level, and the continuation of an upward trend can lead the Cable towards the 1.3700 resistance level. On the lower side, the breakout of 1.3545 support can extend the selling trend until the 1.3468 level.


USD/JPY – Daily Analysis

The USD/JPY pair was closed at 103.824 after placing a high of 103.955 and a low of 102.948. The USD/JPY pair rose to its highest level since mid-December on Thursday amid the broad-based strength of the U.S. dollar. The USD/JPY pair’s bullish momentum was supported by the stronger U.S. dollar driven by the rising 10-year U.S. Treasury yields. The U.S. 10-year Treasury yields rose to 1.085% on Thursday that was the highest level since March. On Wall Street, the main indexes were also at record highs as Dow Jones gained about 1.7% and NASDAQ gained about 2.25% on Thursday.

The rising risk sentiment because of the rally in the stock market and the U.S. treasury yield, along with the rising crude oil prices, added weight on the safe-haven Japanese Yen that ultimately pushed the currency pair USD/JPY higher onboard to 4 weeks highest level. The U.S. Dollar Index was also up from the multi-year lowest level on Thursday and moved near 89.85 and was up 0.35% for the day. The rising demand for the greenback pushed the currency pair USD/JPY higher on the board.

However, the U.S. dollar demand is expected not to live for a longer period as the Democratic win in U.S. Senate elections has raised the prospects for a larger stimulus package. Joe Biden, who will begin his term from January 20th, has promised to deliver about two large stimulus measures this year, ultimately hurting local currency.

On the data front, at 04:30 GMT, the Average Cash Earnings for the year from Japan dropped to -2.2% against the projection of -0.9% and weighed on the Japanese Yen that ultimately added further gains in the USD/JPY pair. From the U.S. side, at 17:30 GMT, the Challenger Job Cuts for the year in December increased to 134.5% compared to November’s 45.4%. At 18:30 GMT, the Unemployment Claims from last week were decreased to 787K against the anticipated 798K and supported the U.S. dollar that added further gains in the USD/JPY pair. The Trade Balance from November showed a deficit of -68.1B against the anticipated -66.7B and weighed on the U.S. dollar that capped further upside in the USD/JPY pair. At 20:00 GMT, the ISM Services PMI increased in December to 57.2 against the forecasted 54.5 and supported the U.S. dollar that added further gains in the USD/JPY pair.

Meanwhile, on Thursday, the Federal Reserve released its FOMC December meeting minutes that revealed that the Federal Reserve officials consistently backed, holding the pace of asset purchases stable, while some were open to future adjustments if needed. Minutes also revealed that all participants judged that it would be appropriate to continue those purchases at least at the current pace. Nearly all members favored keeping the current arrangement of purchases. The Federal Open Market Committee kept interest rates near zero. It supported its commitment to bond-buying at the meeting after vowing to maintain a $120 billion monthly pace of purchases until there will be considered further progress towards inflation goals and employment. The FOMC meeting minutes also supported the local currency U.S. dollar and added further upside in the USD/JPY pair on Thursday.

Daily Technical Levels

Support   Resistance

103.18     104.19

102.56     104.58

102.16     105.21

Pivot Point: 103.57

USD/JPY – Trading Tips

The USD/JPY consolidates below 103.950 level, after bouncing off above 103.528 support level. A bullish breakout of 103.950 can lead the USD/JPY pair to the 104.322 level. The 50 periods EMA is expected to keep the USD/JPY support at 103.355, which is very far from the current market price; thus, we can also expect some bearish correction. The market may show further movements upon the release of U.S. NFP figures today. Good luck! 

Categories
Crypto Market Analysis

Daily Crypto Review, Jan 7 – Crypto Sector Market Cap Over $1 Trillion as BTC Approaches the $40k Mark

Most of the cryptocurrency sector ended up in the green as Bitcoin passed $38,000. Another thing to mention is that the overall industry market cap has reached past $1 trillion for the first time in the history of cryptocurrencies. Bitcoin is currently trading for $38,400, representing an increase of 10.78% compared to yesterday’s value. Meanwhile, Ethereum’s price has increased by 7.78% on the day, while XRP skyrocketed, gaining 46.55% of its value.

Daily Crypto Sector Heat Map

X Infinity gained 896.37% in the past 24 hours, making it the most prominent daily crypto gainer by far. It is followed by 7up Finance’s 298.93% and EveryCoin’s 278.57% gain. On the other hand, COVER Protocol lost 99.48%, making it the most prominent daily loser. It is followed by UniMex’s loss of 97.1% and Team Heretics Fan Token’s loss of 91.66%.

Top 10 24-hour Performers (Click to enlarge)

Bottom 10 24-hour Performers (Click to enlarge)

Bitcoin’s market dominance has moved down slightly since our last report, with its value currently being 68.6%. This value represents a 0.7% difference to the downside than the value it had when we last reported.

Daily Crypto Market Cap Chart

The cryptocurrency sector capitalization skyrocketed and passed the one trillion mark since we last reported, with its current value being $1,005 trillion. This represents a $33.51 billion increase when compared to our previous report.

_______________________________________________________________________

What happened in the past 24 hours?

_______________________________________________________________________

_______________________________________________________________________

Technical analysis

_______________________________________________________________________

Bitcoin

Bitcoin continued the upward trajectory and pushed past the previous all-time high with confidence, reaching a new high of $38,510 at one point. While the price did retrace after hitting the 37,800 at one point, but the 50-hour moving average created strong support, and BTC pushed back up to contest the all-time high level once again.

As we have mentioned many times, shorting of any kind and trading against the overall trend is most likely not optimal, and traders might find a good opportunity to long BTC each time it breaks the all-time high, as this is when it gets a large influx of buyers.

BTC/USD 1-hour chart

Bitcoin’s short-term technicals (4-hour and daily) are completely bullish, while its long-term overview is a bit more tilted towards neutrality.

BTC/USD 1-day Technicals

Technical factors (4-hour Chart):

  • Price is above both its 50-period EMA and its 21-period EMA
  • Price is near its top Bollinger band
  • RSI is in the overbought territory (72.04)
  • Volume is above average

Key levels to the upside          Key levels to the downside

1: $37,800                                 1: $35,880

2: $40,000                                 2: $34,800

3: $43,220                                 3: $33,100

Ethereum

Ethereum’s chart looks pretty similar to Bitcoin’s, as they both moved to the upside in the same manner. The second-largest cryptocurrency by market cap pushed past many support levels and reached $1,225 before descending slightly. Alongside Bitcoin’s move to new all-time highs, this move contributed the most to the overall crypto sector market cap passing the $1 trillion mark.

Ethereum is currently trading within a narrow range, bound by $1,169 to the downside and $1,211 to the upside. If ETH decides to move up, the next most likely resistance level will be the $1,341.5 level. If, however, it breaks this range to the downside, it has many support levels.

ETH/USD 1-hour Chart

Ethereum’s technicals on the daily, weekly, and monthly time-frames are fully tilted towards the buy-side, while its 4-hour technicals are slightly more neutral.

ETH/USD 1-day Technicals

Technical Factors (4-hour Chart):

  • Price is above both its 50-period and its 21-period EMA
  • Price is at its top Bollinger band
  • RSI is in the overbought area (73.41)
  • Volume is significantly above-average

Key levels to the upside          Key levels to the downside

1: $1,211                                    1: $1,169

2: $1,341.5                                 2: $1,080

3: $1,425                                    3: $1,050

Litecoin

Litecoin increased in price as well, but while its chart looks similar to Bitcoin’s and Ethereum’s, it’s important to notice that it did not break the high it made on Jan 4. In fact, Litecoin almost got to the $174.5 level but quickly pulled back to $165.

Litecoin found strong support in its 50-hour moving average, which held it above $165 and kept it from possibly breaking $163.7 to the downside.

Litecoin’s next move will most likely be highly dependent on Bitcoin’s short-term movement.

LTC/USD 1-hour Chart

Litecoin’s technicals are fully bullish on every single time frame and vary from “buy” to “strong-buy” indicators.

LTC/USD 1-day Technicals

Technical factors (4-hour Chart):

  • Its price is currently above both its 50-period EMA and its 21-period EMA
  • Price between its middle and top Bollinger band
  • RSI is nearing the overbought area (63.82)
  • Volume is above-average but descending

Key levels to the upside          Key levels to the downside

1: $163.7                                      1: $155.25

2: $174.5                                      2: $149.3

3: $195.5                                      3: $143.5


Categories
Forex Market Analysis

Daily FX Analysis, January 07 – Top Trade Setups In Forex – Eyes on Series of US and European Events! 

It’s going to be a busy day from the news front, as the market will be focusing on the German Factory Orders m/m, ECB Economic Bulletin, Retail Sales, and CPI figures from the Eurozone economy that can drive price action in the Euro pairs during the UK session. On the other hand, the dollar’s movement can be influenced by Unemployment Claims and ISM Services PMI scheduled to be released during the US session.

Economic Events to Watch Today  


EUR/USD – Daily Analysis

The EUR/USD pair was closed at 1.23259 after placing a high of 1.23492 and a low of 1.22653. The depressed US dollar after the signs of a Democratic win in the US Senate runoff elections and the rebounded risk-on market sentiment helped EUR/USD pair to post gains on Wednesday.
The markets anticipated a Democratic win in the US Senate election in Georgia that would evacuate the track for a bigger fiscal stimulus package; the greenback came under pressure. Democrats won one US Senate race in Georgia and led in another on Wednesday, moving closer to a sweep in a Deep South state. The result will be announced on late Wednesday, and winning both seats by Democrats will give Congress control to power the President-elect Joe Biden’s policy goals.

Biden has said that he wanted two fiscal stimulus packages in 2021 to support his economy through the pandemic. His first order is expected to increase the stimulus paychecks amount to $2000 rejected by Republicans. These hopes kept the US dollar under pressure and supported the upward momentum in the EUR//USD pair.

On the data front, at 10:00 GMT, the German Prelim CPI for December dropped to 0.5% against the expected 0.6% and weighed on Euro and capped further upside in EUR/USD pair. At 12:45 GMT, the French Prelim CPI for December also dropped to 0.2% against the forecasted 0.4% and weighed on Euro. At 13:15 GMT, the Spanish Services PMI for December raised to 48.0 against the expected 44.5 and supported the single currency Euro and added further EUR/USD pair gains. At 13:45 GMT, the Italian Services PMI for December declined to 39.7 against the estimated 45.0 and weighed on the single currency Euro.

At 13:50 GMT, the French Final Services PMI came in line with the expectations of 49.1. At 13:55 GMT, the German Final Services PMI dropped to 47.0 against the anticipated 47.7 and weighed on Euro and capped further upside in EUR/USD pair. At 14:00 GMT, the Final Services PMI from Europe also fell to 46.4 against the forecasted 47.4 and weighed on Euro. At 15:00 GMT, the PPI for November from the Euro area raised to 0.4% against the expected 0.2% and supported Euro and gave strength to the EUR/USD pair’s rising prices.

From the US side, at 18:15 GMT, the ADP Non-Farm Employment Change for December declined to -123K against the forecasted 60K and weighed on the US dollar that gave further gains to EUR/USD pair. At 19:45 GMT, the Final Services PMI for December also declined to 54.8 against the forecasted 55.2 and weighed on the US dollar and helped EUR/USD to rise further. At 20:00 GMT, the Factory Orders for November rose to 1.0% against the forecasted 0.7%, supported the US dollar, and capped further gains in EUR/USD pair.

Meanwhile, the market’s risk sentiment was improved after the resurgence in global manufacturing as shown in various surveys this week despite the rising coronavirus cases, which also gave strength to the risk perceived EUR/USD pair on Wednesday.


Daily Technical Levels

Support   Resistance

1.2257      1.2318

1.2220      1.2344

1.2195      1.2380

Pivot point: 1.2282

EUR/USD– Trading Tip

The EUR/USD continues trading with a bullish bias at 1.2367, facing resistance at the 1.2350 level. On the lower side, the support continues to hold around the 1.2278 level. Simultaneously, the bullish breakout of the 1.2350 resistance level can extend buying until the 1.2435 level. The leading indicators such as RSI and MACD support selling, but the EUR/USD 50 periods EMA is likely to support at 1.2289. 


GBP/USD – Daily Analysis

The GBP/USD pair was closed at 1.36075 after placing a high of 1.36711 and a low of 1.35380. The currency pair came under pressure on Wednesday amid the rising number of coronavirus cases in the UK, depressing comments from Andrew Bailey, and the poor macroeconomic data from Great Britain.

The UK has more new coronavirus cases per capita than any other major country globally as the number of daily cases topped 60,000 for the first time this week. The latest data suggested that around one in 50 people in the UK currently have the virus. Only the US has a per capita infection rate nearly equivalent to the UK of any country with more than 1 million cases.

Since December 06, the average number of new daily cases has risen from around 15,000 to above 55,000. PM Boris Johnson said on Tuesday that about 1.3 M people have so far received a coronavirus vaccination. The rising number of coronavirus made the UK the worst-hit country in Europe in terms of cumulative cases and weighed on its local currency British Pound, which ultimately added weight to the GBP/USD pair.

Meanwhile, on Wednesday, the Governor of Bank of England Andrew Bailey risked reigniting the politically charged debate over Brexit by predicting that the trade deal struck with the European Union could end up costing the UK economy the equivalent of more than 80 billion pounds.
During his first public comments since Britain completed its withdrawal from the bloc on December 31, Bailey endorsed warnings from the Office for Budget Responsibility, the fiscal watchdog, that gross domestic product will be as much as 4% lower in the long term than it would be had the country remained in the EU.

These comments from the Bank of England governor right after the Brexit completion raised fears and added weight on Sterling that eventually dragged the GBP/USD currency pair on the downside. On the data front, at 14:30 GMT, the Final Services PMI from Great Britain for December dropped to 49.4 against the expected 499 and weighed on British Pound and added more losses on the currency pair GBP/USD.

From the US side, at 18:15 GMT, the ADP Non-Farm Employment Change for December fell to -123K against the anticipated 60K and weighed on the US dollar and capped further losses in GBP/USD pair. At 19:45 GMT, the Final Services PMI for December also fell to 54.8 against the anticipated 55.2 and weighed on the US dollar. At 20:00 GMT, the Factory Orders for November surged to 1.0% against the anticipated 0.7% and supported the US dollar that added further GBP/USD pair losses.

However, the GBP/USD pair’s losses were somewhat recovered in the late trading session over the positive sentiment that was mostly driven by the rising expectation that the Democrats will win both seats in Georgia’s Senate runoff. A clean sweep for the Democrats would hand charge of both houses of Congress to the incoming administration that would pave the way for Joe Biden to push through more stimulus. This left the US dollar under pressure and supported the GBP/USD pair in late trading hours.


Daily Technical Levels

Support   Resistance

1.3572      1.3660

1.3518     1.3696 

1.3483      1.3749

Pivot Point: 1.3607

GBP/USD– Trading Tip

The GBP/USD pair continues to consolidate in a narrow trading range of 1.3625 – 1.3556. The Sterling may face immediate resistance at the 1.3625 level, and the continuation of an upward trend can lead the Cable towards the 1.3700 resistance level. On the lower side, the breakout of 1.3545 support can extend the selling trend until the 1.3468 level.


USD/JPY – Daily Analysis

The USD/JPY pair was closed at 103.049 after placing a high of 103.442 and a low of 102.590. The higher US yields and the market’s risk appetite boosted the USD/JPY prices on Wednesday. Since March, the currency pair bounced from the lowest levels, near 102.50, and peaked at 103.43, a one-week high.

The main driver of the pair USD/JPY remained the US yields followed by the elections to decide the US Senate’s composition. The 10-year yield reached 1.05%, its highest since March, and supported the US dollar that ultimately pushed the USD/JPY pair higher on board. The market sentiment was not affected by the weaker than expected US economic data as the Dow Jones was at record highs, up by 1.55%, and the NASDAQ gained 0.51%.

Markets were pricing the prospects of a Democratic win in the US Senate runoff elections in Georgia. The Democrats already have the House of Representatives, aka lower chamber of Congress, in their control. Winning the Senate elections will also give them control over the upper chamber that means they will have a complete majority in the US legislative assembly and the power to push forward their agenda.

The term of Joe Biden will begin on January 20. He has hinted that he wanted at least two stimulus packages in 2021 to overcome the damage caused and expected to continue from the coronavirus pandemic. Markets were also pricing their bets on the prospects of Biden’s first order that is expected to push out $2000 checks to most Americans that had been strictly opposed by the Republicans.

On the data front, at 10:00 GMT, the Consumer Confidence from Japan for December dropped to 31.8against the anticipated 32.6 and weighed on the Japanese Yen that added more gains in the USD/JPY pair.
From the US side, at 18:15 GMT, the ADP Non-Farm Employment Change for December decreased to -123K against the projected 60K and weighed on the US dollar that capped further gains in the USD/JPY pair. At 19:45 GMT, the Final Services PMI for December also decreased to 54.8 against the projected 55.2 and weighed on the US dollar that limited additional USD/JPY pair gains. At 20:00 GMT, the Factory Orders for November increased to 1.0% against the projected 0.7% and supported the US dollar that added further gains in the USD/JPY pair.

Furthermore, some of the USD/JPY pair’s gains were lost in late trading hours of Wednesday as the rising number of coronavirus cases kept the global economic recovery under pressure and safe-haven demand intact. On Wednesday, Japan’s number of coronavirus cases reached its highest level as the government faced mounting pressure from health experts to impose a strict state of emergency for Tokyo.

In Portugal, about 10,027 new cases on Wednesday were reported, which was the highest since the pandemic started. Ontario reported 3266 new coronavirus cases that brought the total number of coronavirus in the region to 200,626. All these fears kept the safe-haven Japanese yen supportive that ultimately weighed on the USD/JPY pair and lost most of its gains for the day on Wednesday.


Daily Technical Levels

Support   Resistance

102.49      103.08

102.24      103.44

101.89      103.68

Pivot Point: 102.84

USD/JPY – Trading Tips

The USD/JPY bounced off to violate the resistance level of 102.960 level, and now it’s working as a support for the USD/JPY pair. The pair may find resistance at the 103.430 level. Overall, the bullish bias seems strong as the USD/JPY pair has crossed over 50 EMA at the 103.063 level. Taking a look at the 2-hour timeframe, the USD/JPY has closed a bullish engulfing candle over 102.962 level that can drive the further bullish trend in the USD/JPY pair. Let’s consider taking a buy trade over the 102.960 level today. Good luck!

Categories
Forex Videos

Brexit Is Done – How To Profit Trading Forex GBPUSD


Brexit done – where now for Cable?

Thank you for joining this forex academy educational video.  in this section, we will be looking at the aftermath of the Brexit future trade deal agreement negotiations, which have finally concluded.  And what this might mean for the GBPUSD pair.

After 4 years of wrangling over a future trading arrangement between the European Union and the United Kingdom, which left EU membership back in June 2016, by way of a national referendum, a free trade deal has been agreed between the UK and EU on Christmas Eve 2020. 

The markets will be grateful for a breather in the now finalised divorce, which has finally been settled after years of; will they, or won’t they get a future treading deal completed in time before the UK was forced to end the transition period on wt20 trading regulations, which was seen as potentially very bad for the British economy.  As many had predicted, the negotiations went down to the wire, and an agreement was set in place with hardly any time to spare.

The referendum, which took place on the 23rd of June 2016, and where the British people voted to leave the EU, caused the pound against the dollar to crash from 1.47 to a low of 1.21 during the following year, as the markets tried to decipher how this may play out for the British economy.

The pear rallied up to 1.42 in April 2018 as hopes were raised of a negotiated trade free trade deal, which was dashed. 

And we had the crash to 1.16 in march 2020 as the pandemic gripped the United Kingdom.

The pair has been rallying up to its current position at 1.36 – at the time of writing – based on the market anticipation that a free trade agreement would be reached.  This extremely bumpy road has been smoothed by the free trade agreement, but what now for the British economy and the pound, as it finally goes its own way as an independent nation?

There is no doubt that the bulls are in control of the pair at the moment, and some institutional traders will be looking for the previous highs, as shown here on the chart of 1.42 and 1.47.

However, things to consider are that the free trade agreement only takes up 20% of the British economy, with the remaining 80% of the gross domestic product being attributed to financial services, which does not form part of the agreement, and which still has to be negotiated between the EU and UK.  It is unlikely that issues in this sector will cause a major upset; however, there is potential for a spanner in the works should the two sides diverge from current alignments in trading standards.

The other critical component, which will affect the pound, is the United States dollar currency index, or DXY, which measures the dollar against the most commonly traded currencies known as the majors and which includes the British pound and Euro.

The dollar index has fallen from a high of 103.00 in march 2020 to its current level at just under 90.00 at the time of writing, as the federal reserve and United States’ government implement stimulus measures by pumping more and more dollars into the system to shore up the failing US economy, which is still in the grips of the pandemic.

While traders wonder if Cable has run out of steam at 1.36, traders will also be wondering if there is further room for a continued slide in the dollar index, perhaps down to 88.00 in the short term, as the market opens to a new year and a first new quarter, with institutions and investors adjusting their portfolios for the new financial year ahead.

On a market sentiment basis, a fundamental basis, and on a technical analysis basis, it would appear that there is scope for a push higher in Cable to reach some of the previous levels mentioned at 1.42 and 1.47, especially while the US dollar index is generally under pressure.


Categories
Forex Signals

USD/CAD Descending Triangle in Play – Quick Trade Idea! 

The USD/CAD pair was closed at 1.26689 after placing a high of 1.27909 and a low of 1.26556. The currency pair USD/CAD fell to its lowest since 2018 April on rising crude oil prices and the US dollar weakness. Despite Canada’s negative economic data and positive data from the US side, the currency pair USD/CAD still moved in the downward direction on Tuesday as investors’ focus was shifted on the OPEC meeting and Georgia’s runoff elections.

On the data front, at 18:30 GMT, the IPPI for November from Canada dropped to -0.6% against the expected -0.2% and weighed on the Canadian dollar that capped further losses in the USD/CAD pair. The RMPI for November also dropped to 0.6% against the expected 0.9% and weighed on the Canadian dollar that capped further losses in the USD/CAD pair on Tuesday. From the US side, at 20:00 GMT, the ISM Manufacturing PMI from December surged to 60.7 against the predicted 56.6 and supported the US dollar, and capped further losses in the USD/CAD pair. The ISM Manufacturing Prices also rose to 77.6 against the expected 66.0 and supported the US dollar that limited further losses in the USD/CAD pair. The Wards Total Vehicle Sales rose to 16.3M against the anticipated 15.8M and supported the US dollar that ultimately limited further losses in the USD/CAD pair.

The West Texas Intermediate (WTI) crude oil prices rose above $50 per barrel on Tuesday as Russia and the Organization of Petroleum Exporting Countries remained deadlocked over how much oil to produce from February. Russia and its neighbor Kazakhstan were both pressuring for the scheduled output increase of 500,000 barrels a day to come into effect, while OPEC, with what appears to be total unanimity, wanted to kept output at its present level due to short-term weakness in demand caused by the latest surge in coronavirus and imposed lockdowns in various countries.

The rising prices of crude oil gave strength to the commodity-linked currency Loonie and added weight on the currency pair USD/CAD. Meanwhile, Georgia’s runoff elections that will decide the US Senate’s future also kept the US dollar under pressure on Tuesday. The result of the elections is expected to announce on Wednesday, and investors were cautious ahead of it, and the selling pressure surrounding the greenback increased that ultimately weighed on the USD/CAD pair.


Daily Technical Levels

Support Resistance

1.2619 1.2758

1.2568 1.2844

1.2481 1.2896

Pivot Point: 1.2706

The USD/CAD’s technical side is trading at 1.2690, disrupting the support area of 1.2725 level, which is now working as a resistance for the USD/CAD pair. On the lower side, the support stays at the 1.2647 level, and a bearish breakout of this level can extend selling trend until 1.2591. Let’s wait for opening a sell trade below the 1.2725 level today. Good luck! 


Categories
Crypto Market Analysis

Daily Crypto Review, Jan 6 – Bitcoin Retraces after Creating a New All-Time High; Sector in the Green

Most of the cryptocurrency sector ended up in the green as Bitcoin pushed towards the upside and created a brand new all-time high. Bitcoin is currently trading for $34,801, representing an increase of 12.63% compared to yesterday’s value. Meanwhile, Ethereum’s price has increased by 9.47% on the day, while LTC gained 6.53% of its value.

Daily Crypto Sector Heat Map

Foglory Coin gained 3809.54% in the past 24 hours, making it the most prominent daily crypto gainer by far. It is followed by COVER Protocol’s 2102.06% and Birdchain’s 683.22% gain. On the other hand, MINDOL lost 74.94%, making it the most prominent daily loser. It is followed by Scanetchain loss of 71.12% and XLMDOWN’s loss of 55.53%.

Top 10 24-hour Performers (Click to enlarge)

Bottom 10 24-hour Performers (Click to enlarge)

Bitcoin’s market dominance has moved up slightly since our last report, with its value currently being 69.3%. This value represents a 1.1% difference to the upside than the value it had when we last reported.

Daily Crypto Market Cap Chart

The cryptocurrency sector capitalization has increased over 100 billion since we last reported, with its current value being $967.49 billion. This represents a $122.12 billion decrease when compared to our previous report.

_______________________________________________________________________

What happened in the past 24 hours?

_______________________________________________________________________

_______________________________________________________________________

Technical analysis

_______________________________________________________________________

Bitcoin

Bitcoin has had another amazing bull run, with its price pushing from just below $30,000 all the way up to $35,879, setting a brand new all-time high. However, this is where the price hit a wall, and Bitcoin started retracing. The largest cryptocurrency by market cap is now trading right below the previous all-time high of $34,800 and is seemingly going further down.

With the volume being as high as it is, the most does not seem like it’s done yet. Traders should pay attention to how the price reacts to certain levels.

BTC/USD 4-hour chart

Bitcoin’s technicals show a strong tilt towards the buy-side with some neutral characteristics, with only the 4-hour time-frame showing full bullish tilt.

BTC/USD 1-day Technicals

Technical factors (4-hour Chart):

  • Price is slightly above both its 50-period EMA and its 21-period EMA
  • Price is near its top Bollinger band
  • RSI is near the overbought territory (65.11)
  • Volume is above average

Key levels to the upside          Key levels to the downside

1: $34,800                                 1: $30,807

2: $35,000                                 2: $28,337

3: $35,890                                 3: $26,340

Ethereum

Ethereum also moved to the upside, with its price slowly but surely going from $975 all the way up to $1,139 before retracing slightly. Its move, however, didn’t seem as forced as Bitcoin’s.

While the overall sentiment around Ethereum is bullish, the fact that it hit nearly the same high three times without passing it could indicate a possible short-term top and a retracement.

Traders should pay great attention to the area around above $1,125 and how ETH reacts to it.

ETH/USD 1-hour Chart

Ethereum’s technicals on the daily and weekly time-frames show an overall bullish tilt with no hints of neutrality coming from oscillators. On the other hand, the monthly and 4-hour time-frames show some signs of neutrality or even bearishness.

ETH/USD 1-day Technicals

Technical Factors (4-hour Chart):

  • Price is above both its 50-period and its 21-period EMA
  • Price is between its middle and top Bollinger band
  • RSI is in the overbought area (72.01)
  • Volume is significantly above-average

Key levels to the upside          Key levels to the downside

1: $1,047                                     1: $1,009

2: $1,080                                     2: $960

3: $1,169                                      3: $932

Litecoin

Litecoin moved in a much more narrow range than Bitcoin and Ethereum. Its price slowly moved towards the upside (with one hiccup that brought its price from $163 to $155) and reached as high as $165. However, this move didn’t create new highs or approach the recent ones either.

At the moment, Litecoin looks like a cryptocurrency that mirrors Bitcoin’s moves, but with less volatility. While this brings a bit of perceived safety, the truth is that the profit potential is also greatly diminished.

LTC/USD 1-hour Chart

Litecoin’s technicals on the 4-hour and monthly time-frame are completely bullish, while its daily and weekly overviews show some oscillators having bearish values.

LTC/USD 1-day Technicals

Technical factors (4-hour Chart):

  • Its price is currently above both its 50-period EMA and its 21-period EMA
  • Price between its middle and top Bollinger band
  • RSI is nearing the overbought area (65.96)
  • Volume is above-average but descending

Key levels to the upside          Key levels to the downside

1: $163.7                                      1: $155.25

2: $174.5                                      2: $149.3

3: $195.5                                   3: $143.5

Categories
Forex Market Analysis

Daily F.X. Analysis, January 06 – Top Trade Setups In Forex – ADP Non-Farm Employment Change Ahead! 

On the news front, eyes will remain on the Services PMI figures from the Eurozone, U.K., and the United States. Almost all economic figures are expected to perform better than previous months, perhaps due to a lockdown lift. Price action will depend upon any surprise changes in the PMI figures. Later today, the U.S. ADP figures will also drive some volatility in the market.

Economic Events to Watch Today  


EUR/USD – Daily Analysis

The EUR/USD pair was closed at 1.22984 after placing a high of 1.23055 and a low of 1.22419. The renewed U.S. dollar weakness and the prospects for a Democratic majority in the Senate after the runoff election in Georgia boosted the market sentiment that supported the upward trend in EUR/USD pair on Tuesday.

The U.S. Dollar Index that gauges the greenback’s value against the basket of six major currencies fell by almost 0.38% on Tuesday to an 89.53 level that ultimately added gains in EUR/USD pair. The U.S. Dollar was also under stress on Tuesday amid the US Georgia runoff elections that would decide the future of the U.S. Senate. The outcome will be crucial for incoming president Joe Biden as the Senate majority helps pass the law and confirm the cabinet appointments. The result is expected on Wednesday. It has made investors cautious about placing any strong bids in favor of the U.S. dollar, resulting in the upward momentum of EUR/USD.

On the data front, at 12:00 GMT, the German Retail Sales for November raised to 1.9% against the expected -2.0% and supported the single currency Euro and added further gains in EUR/USD pair. At 13:00 GMT, the Spanish Unemployment Change in December raised to 36.8K against the expected 30.5K and weighed on the single currency Euro that capped further EUR/USD pair gains. At 13:55 GMT, the German Unemployment Change for December declined to-37K against the expected 10K and supported the single currency Euro that added further EUR/USD pair gains. At 14:00 GMT, the M3 Money Supply for the year from Eurozone raised to 11.0% against the forecasted 10.6% and supported the single currency Euro that added additional EUR/USD pair gains. The Private Loans for the year from Eurozone dropped to 3.1% from the expected 3.3% and weighed on Euro that further capped gains in EUR/USD pair.

From the U.S. side, at 20:00 GMT, the ISM Manufacturing PMI from December rose to 60.7 against the estimated 56.6 and supported the U.S. dollar, and capped further gains in EUR/USD pair. The ISM Manufacturing Prices also raised to 77.6 against the anticipated 66.0 and supported the U.S. dollar. The Wards Total Vehicle Sales raised to 16.3M against the estimated 15.8M and supported the U.S. dollar, ultimately limiting further gains in EUR/USD pair.

On Wednesday, the HIS Markit will release the Services PMI data for Germany and the Euro area. From the U.S., the ADP Employment Change will also be featured in the economic docket that will impact EUR/USD prices. Furthermore, the investors will keep a close eye on the Georgia election results.

Daily Technical Levels

Support   Resistance

1.2257      1.2318

1.2220      1.2344

1.2195      1.2380

Pivot point: 1.2282

EUR/USD– Trading Tip

The EUR/USD is trading with a mixed bias at the 1.2272 level, having violated the upward trendline at the 1.2252 level. At the moment, the pair is likely to face resistance at the 1.2307 level along with a support area of 1.2245 and 1.2215. Bullish bias seems dominant today, so a bullish breakout of 1.2307 can extend buying until the next resistance level of 1.2345.


GBP/USD – Daily Analysis

The GBP/USD pair was closed at 1.36278 after a high of 1.36420 and a low of 1.35540. Despite the third nationwide lockdown in the U.K., the GBP/USD pair raised on Tuesday amid the broad-based U.S. dollar weakness. The U.S. Dollar Index that measures the value of the U.S. dollar against the basket of six major currencies fell by 0.38% towards the two years, the lowest level of 89.53, and weighed on the greenback that ultimately supported the gains in GBP/USD pair.

The U.S. dollar was weak across the board despite the safe-haven appeal in the market mainly because of the Georgia runoff elections in the U.S. The runoff will decide the future of the U.S. Senate. It will be essential for Joe Biden, the upcoming Democratic president of the U.S., as it holds major importance in the U.S. Congress being its upper chamber. Senate holding party could easily approve its bills, which is the main attractiveness for getting majority votes in the Georgia runoff elections. Since 2014, the Senate has been controlled by the Republican Party, and if Democrats win on Wednesday, the extra two seats will give them effective control.

On the other hand, the British Pound was under pressure on Tuesday as the number of new daily confirmed cases of coronavirus in the U.K. has topped 60,000 for the first time since the pandemic started.

According to the government figures on Tuesday, the number of people who tested positive was 60,916. It came in as England and Scotland announced new strict lockdowns with people told to stay at home. The country is entering another nationwide lockdown to control coronavirus’s new variant affected the local currency and GBP/USD pair. However, investors did not give much attention to it and continued moving with the weakness of the U.S. dollar that ultimately pushed the GBP/USD pair higher.

There was no macroeconomic data on the data front to be released from the U.K. From the U.S. side, at 20:00 GMT, the ISM Manufacturing PMI from December surged to 60.7 against the anticipated 56.6 and supported the U.S. dollar and capped further gains in GBP/USD pair. The ISM Manufacturing Prices also rose to 77.6 against the projected 66.0 and supported the U.S. dollar. The Wards Total Vehicle Sales surged to 16.3M against the expected 15.8M and supported the U.S. dollar that ultimately limited further GBP/USD pair gains.

Daily Technical Levels

Support   Resistance

1.3572      1.3660

1.3518      1.3696

1.3483      1.3749

Pivot point: 1.3607

GBP/USD– Trading Tip

The Cable’s technical side also remains mostly unchanged as the GBP/USD pair consolidates between 1.3632 – 1.3556 after violating the support level of 1.3609 level. On the higher side, the Sterling may find resistance at 1.3632 and 1.3697 level while support at 1.3550 and 1.3473 level. Choppy trading expected. 


USD/JPY – Daily Analysis

The USD/JPY pair was closed at 102.716 after placing a high of 103.189 and a low of 102.603. On Tuesday, the currency pair USD/JPY came under resumed bearish pressure through the American trading hours and reached its lowest level in nearly ten months at 102.60. The intensified selling pressure surrounding the U.S. dollar in the second half of the day forced the USD/JPY pair on the lower side. The U.S. Dollar Index that measures the value of the greenback against the basket of six major currencies fell to its multi-year lowest level at 89.44 by 0.47% on Tuesday and weighed heavily on the USD/JPY pair.

The U.S. Dollar was also weak across the board ahead of the results of the Georgia runoff elections. The state of Georgia held runoff elections for its two Senate seats. The results will determine who gets to control the U.S. Senate for the next two years and will consequently have a profound impact on the course of U.S. fiscal policy. The U.S. Republican Party has been controlling the U.S. Senate since 2014, and markets are betting that the Republicans will still win at least one of the seats and cement its hold on the upper chamber of the U.S. Congress.

On the data front, at 04:50 GMT, the Monetary Base for the year from Japan raised to 18.3% against the forecasted 18.0% and supported the Japanese Yen that ultimately weighed on the USD/JPY pair. From the U.S. side, at 20:00 GMT, the ISM Manufacturing PMI from December rose to 60.7 against the forecasted 56.6 and supported the U.S. dollar, and capped further losses in the USD/JPY pair. The ISM Manufacturing Prices also raised to 77.6 against the projected 66.0 and supported the U.S. dollar that limited further losses in the USD/JPY pair. The Wards Total Vehicle Sales raised to 16.3M against the estimated 15.8M and supported the U.S. dollar that ultimately limited further losses in the USD/JPY pair.

Meanwhile, the rising demand for safe-haven appeal in the market also supported the safe-haven Japanese Yen that ultimately weighed on the USD/JPY pair. The U.K. entered into a third nationwide lockdown on Monday as the daily count of new coronavirus cases surpassed 60,000 figure for the first time since the pandemic started. The PM Boris Johnson said that it was crucial to control the spread of a new variant of coronavirus that was more contagious.

Meanwhile, Germany also stretched its nationwide lockdown until the end of the month and announced tougher new restrictions to curb rising cases of coronavirus infections. New York on Monday reported its first case of a new variant of the coronavirus that has been reported in more than 30 countries so far. In the past four days, the U.S. has added about 1 million new coronavirus cases that have pushed the total number of cases beyond 21 million. This rising number of cases across the globe added fears for the recovery of the global economy and increased the appeal for safe-haven that ultimately supported the safe-haven Japanese Yen and added weight on the USD/JPY pair on Tuesday.

Daily Technical Levels

Support   Resistance

102.49      103.08

102.24      103.44

101.89      103.68

Pivot point: 102.84

USD/JPY – Trading Tips

The technical side of the USD/JPY also remains mostly unchanged as the USD/JPY is trading sharply bearish at 102.74. On the downside, the USD/JPY pair may find support at the 102.595 level along with resistance at 102.930. The USD/JPY pair has formed a downward channel on the two-hourly timeframes, which is likely to keep the pair bearish. The MACD and 50 EMA is suggesting selling bias in the USD/JPY. Let’s consider taking sell trades below the 102.850 level today. Good luck!

Categories
Crypto Videos

Miners Can’t Produce Enough BTC – The Reason BTC is Skyrocketing!


Miners Can’t Produce Enough BTC – The Reason BTC is Skyrocketing

Institutional crypto investment company Grayscale now has $20 billion under its control as its consistent Bitcoin buys heavily outstrip production. The ratio of Grayscale Bitcoin buys to BTC production is has now increased to almost three to one.


As noted by data analytics firm Coin98, Grayscale bought close to three times more Bitcoin than the amount miners added to the market in December 2020.

Miners can’t produce enough Bitcoin

In Dec, Grayscale added a total of 72,950 BTC to its assets under management (AUM). Over the same period, miners generated just 28,112 BTC, being only 38.5% of Grayscale’s buy-in.

These figures underscore what many currently describe as an ongoing liquidity squeeze in Bitcoin, where large, mostly institutional buyers, suck up any available supply and completely remove it from circulation, sending it to cold storage for long-term holding. This then creates a lack of supply while the retail demand remains constant of increases, causing the price of Bitcoin to rise exponentially, just like it did on Jan 3, where Bitcoin’s price skyrocketed and reached past $33,000.

The phenomenon of institutional investors sweeping the available supply was already visible in Nov 2020, but Dec 2020 saw a clear increase in demand from both Grayscale and other institutional entities.

Grayscale controls over $20 billion in crypto

Grayscale CEO Barry Silbert celebrated the end of 2020 by bringing the company’s total assets under management across its various crypto funds to over $20 billion. Looking back just one year ago, the figure stood at, compared to now, a mere $2 billion.


The company remains the single largest institutional player on the Bitcoin scene, far outstripping any other market participant. Its BTC holdings were coming out to $17.475 billion on the first day of 2021, with this number growing to an even higher dollar value as Bitcoin pumped to over $34,000. Newcomer MicroStrategy, while not an investment-focused company, now controls 70,470 BTC.

Going forward, analysts predict that the increasing demand for the fixed supply of newly mined Bitcoin will only create a bidding war and push the price further up. 


Categories
Crypto Daily Topic Cryptocurrencies

Bye Bye Libra, Hello Diem!

If you think Bitcoin had a controversial entry into the cryptocurrency scene, think Libra. Diem, previously Libra, hasn’t even entered the market, and it is already getting unpopular nicknames like Global coin and Facebook Coin. 

Names stick, and Diem is already in a sticky mess. This permission-based blockchain deservedly suffers an identity crisis because it packages centralized financial services as decentralized exchanges.

Initially, Libra was a blockchain-based payment system conceptualized for anonymity and decentralization. However, lawmakers in various developed nations like the UK, France, and the United States spoke against it. Some did so immediately after Facebook unveiled the Libra whitepaper.

Libra’s release was meant for 2020, but an aggressive push back from regulators in 2019 obscured the plans. Different entities fielded varying concerns addressing the Libra whitepaper, and the pressure pushed Facebook and its partners into drastic actions. Some partners left, leaving Libra with a looming identity crisis.

In this article, we discuss the rise and fall of the Libra Association. We are also looking into what Diem has to offer and how it’s evolved since conception. Stick around to learn the original Libra concept and why it rebranded to Diem to reduce Facebook stigma.

The Original Libra Concept

Facebook initiated and championed the formation of the Libra Association, and it always had a crypto tech in the works. The plan was to launch a stablecoin, which would be backed by a basket of national fiat currencies and securities.

The Libra stablecoin was designed to be more stable than any national currency, and Facebook would integrate it within its extensive social media coverage. Therefore, the cryptocurrency would be stabler than Bitcoin and enjoy undisputed, global utility. However, the grand scheme fell under siege the same day it was unveiled.

The Libra Association was to create new currency units on demand and retire units redeemed for fiat currency. It was also planning to reserve transactional data on the ledger for Libra Association members only.

Therefore, the blockchain technology wouldn’t be pure but a hybrid, centralized blockchain. The Libra Association reserved the distributed ledger’s reconciliation only to its service partners to prevent random data analysts from scrutinizing transactions.

Basically, Libra proposed a system where traditional blockchain transparency was obscured and reserved for its partners only. The pretext for shrouding the transparency was protecting customers’ privacy, but Mark Zuckerberg unsuccessfully tried convincing the Senate that Libra would honor users’ privacy.

Libra Couldn’t Address Trust and Privacy Issues

The Libra Association failed because of trying to appease both legislators and crypto purists. Revolutionary bitcoin users prefer permissionless cryptocurrencies, which transfer value in a decentralized fashion. Decentralized currencies can bypass regulatory enforcement.

Since Libra was not decentralized, it was to rely on trust, qualifying it as a ‘de facto central bank.’ The Libra Association and its network would be run by powerful corporations working in collaboration, and sovereign governments were concerned the Libra currency would cause widespread economic instability.  

Unlike Libra, Bitcoin is apolitical, and it doesn’t need the backing of fiat currency. Bitcoin is designed to withstand the regulatory scrutiny that seems to be putting down Libra, and the pure blockchain network is trusted worldwide for its anonymity.

Remember, nobody really knows who created Bitcoin.

Libra is not censorship-resistant, and Facebook is infamous for infringing on users’ privacy. This social media platform was subject to Senate and Judiciary inquiries, and it was scandalized for abusing the privacy rights of billions of users.

International Regulatory Resistance: Why Are Governments Fighting Libra?

The French Finance Minister was the first to raise concerns over Libra, just minutes after the whitepaper became public. France strongly opposed Libra becoming a sovereign currency, and the ministry cited privacy issues and consumer protectionism.

The English central Bank was a bit more accommodating, but it called for regulation of the proposed permission-based cryptocurrency. German lawmakers took a more cautious approach, distrusting the motives of the currency.

The European Union didn’t want Libra outcompeting European currencies, mainly because Facebook has a firm marketing grip globally.

American politicians were also quick to thwart efforts of rolling out the proposed Libra Network. The United States House Committee on Financial Services directed Facebook and its partners to stop developing Libra.

The Federal Reserve, the President, Congress, and the Senate had severe concerns regarding money laundering, economic stability, national security, and privacy & consumer protection. 

In response to the sharp criticisms and widespread distrust, Facebook promised to halt Libra until regulators felt comfortable. C.E.O Zuckerberg also promised Libra wouldn’t bypass US regulators by launching in other nations.

Facebook’s lousy rapport with regulators over privacy and consumer protection took a toll on Libra. US regulators petitioned Libra partners to explain how the currency would safeguard national security, and the following partners consequently abandoned Libra:

  • PayPal
  • Visa
  • MasterCard
  • Mercado Pago
  • Booking Holdings
  • eBay
  • Stripe

Libra received overwhelming lousy press, and it acquired negative connotations such as:

  • Facebook coin: Libra partners were afraid they’d be considered complacent in privacy violations.
  • Global coin: Governments were afraid Libra would overtake national currencies with FB’s robust marketing capacity, undermining national security.

Libra Rebranding to Diem: the Fundamental Changes

Facebook had to address structural and branding issues with Libra. The designers of this digital currency made critical changes to attract regulatory approval. The most fundamental of all changes was liberating the cryptocurrency from Facebook.

Facebook and the Libra Association announced Libra would rebrand to Diem, and the currency would not compete with fiat currencies. Instead, Diem would only complement the dollar, and it would also abandon the strategy of stabilizing behind a basket of various national currencies.

Facebook first renamed its blockchain subsidiary to Novi from Calibra. Novi is Greek for ‘new way.’

Diem was also meant to give this digital currency the connotation of transparency. Diem is Greek for the word ‘day,’ and the network promises the transparency of daylight. If only it can earn the trust of governments and safeguard the privacy of users.

Apart from repairing brand image, the Libra Association had to rebrand because of trademark disputes with other international firms. Finco sued the Libra Association in a New York court for using its registered logo trademark, and the company claimed monetary damages from the Libra Association.

Four European companies also petitioned against the Libra trademark, arguing Libra was a current form of their verbal brands.

Parting Shot

This hybrid cryptocurrency is controversial because of its hybrid nature, but mainly due to Facebook’s robust marketing reach. Diem will likely revolutionize crypto assets significantly because of its permission-based blockchain. That’s why you should understand this proposed fintech.

Diem will only be backed by the dollar. It will offer widespread adoption of cryptocurrencies. This currency will combine the transparency and security of blockchains, and users can make secure global transactions.

This proposed digital has significant potential, and you should share your thoughts in the comments section. Do you have any concerns that the Diem Association needs to address? Let’s discuss.

Categories
Forex Market Analysis

Daily F.X. Analysis, January 05 – Top Trade Setups In Forex – ISM Manufacturing PMI In Focus!


On the news side, eyes will remain on European Unemployment Change and the ISM Manufacturing PMI manufacturing data from the U.S., Both of the figures, are expected to drive moves in Euro and dollar today.

Economic Events to Watch Today  


EUR/USD – Daily Analysis

Today in the early European trading session, the EUR/USD currency pair successfully extended its previous session winning streak and remained well bid around above the 1.2250 level as the U.S. dollar remains on the bearish track despite coronavirus concerns and weak China data. However, the losses in the U.S. dollar were triggered after the U.S. Food and Drug Administration said that 2-different mRNA vaccines now show the extraordinary result of about 95% in preventing Covid-19 infection in adults. 

Apart from this, the Federal Reserve’s expectations would keep rates low for a prolonged period also weighs on the greenback and contributes to the currency pair gains. Meanwhile, the probability of an additional U.S. financial aid package also played its major role in undermining the U.S. dollar. In that way, the U.S. dollar weakness was seen as one of the key factors that benefitted the EUR/USD currency pair.

 In contrast to this, the latest B117 strain of COVID-19 lead to the fresh lockdown restrictions on economic activity in Europe and the U.K., which keep raising doubts over the economic recovery and turned out to be one of the key factors that kept the lid on any additional gains in the currency pair. As of writing, the EUR/USD currency pair is currently trading at 1.2262 and consolidating in the range between 1.2246 – 1.2278.

The sentiment around the global equity market has been flashing red since the day started amid worries about the continuous surge in new COVID-19 cases. Also fueling the risk-off mood was the cautious sentiment ahead of the Georgia election and the Sino-American tussle. As per the latest report, Japan saw a record number of COVID-19 cases in recent days, which in turn, Prime Minister Yoshihide Suga said that he would consider declaring a fresh state of emergency in the Tokyo area. 

Across the ocean, the U.K. Prime Minister Boris Johnson also gave warnings over the possibility of tougher lockdown restrictions in the U.K., which instantly overshadowed the optimism over vaccines’ rollout for the highly contagious disease and contributed to the equity market losses. However, the intensifying concerns about rising COVID-19 cases and the intensifying lockdowns could cap further gains in the currency pair.

Daily Technical Levels

Support   Resistance

1.2179     1.2279

1.2144     1.2344

1.2078     1.2379

Pivot Point: 1.2244

EUR/USD– Trading Tip

The EUR/USD is trading with a mixed bias at the 1.2272 level, having violated the upward trendline at the 1.2252 level. At the moment, the pair is likely to face resistance at the 1.2307 level along with a support area of 1.2245 and 1.2215. Bullish bias seems dominant today as the 50 periods EMA supports the pair at 1.2245 level. However, the MACD stays in a sell mode, as histograms are being formed below 0, supporting selling bias. 


GBP/USD – Daily Analysis

During Tuesday’s European trading hours, the GBP/USD currency pair failed to extend its previous session winning streak and took some offer well below the 1.360 level mainly due to the continuous surge in new COVID-19 cases in the U.K., which raised doubts over the U.K. economic recovery and turned out to be one of the key factors that kept the currency pair down. On the contrary, the broad-based U.S. dollar weakness, triggered by multiple factors, failed to support the GBP/USD pair or ease the bearish pressure. At this particular time, the GBP/USD currency pair is currently trading at 1.3556 and consolidating in the range between 1.3556 – 1.3612.

Despite the risk-off market sentiment, the broad-based U.S. dollar failed to gain any positive traction and dropped near multi-year lows amid the probability of an additional U.S. financial aid package and speculations Fed will keep interest rates lower for a longer period. Apart from this, the optimism over a possible coronavirus vaccine pushes investors towards riskier currencies and higher-yielding assets rather than the safe-haven asset, which eventually leads to further losses in the safe-haven U.S. dollar. 

However, the U.S. dollar losses were seen as one of the key factors that benefitted the EUR/USD currency pair. As of now, the U.S. Dollar Index that tracks the greenback against a bucket of other currencies dropped by 0.04% to 89.812 by 8:49 PM ET (1:49 AM GMT).

Apart from Brexit and U.S. headlines, the currency pair came under pressure as the market’s risk sentiment was affected by the increase in the number of coronavirus cases worldwide. 

The rising number of infections from COVID-19 raised fears that countries might extend the restrictions that would have a negative impact on global economic recovery. These fears kept the risk perceived GBP/USD pair under pressure and kept its gains limited during the Asian session on Monday.

Daily Technical Levels

Support   Resistance

1.3623      1.3705

1.3573      1.3737

1.3540      1.3788

Pivot Point: 1.3655

GBP/USD– Trading Tip

The GBP/USD pair has also violated the support level of 1.3609 level extended by an upward channel, which has now been violated. On the higher side, the Sterling may find resistance at 1.3609 and 1.3698 level while support at 1.3533 level today. The Cable is crossing below 50 periods EMA, and the MACD is also forming histograms below 0, suggesting strong selling bias. We should consider taking a selling trade the Cable below 1.3607 level today. 


USD/JPY – Daily Analysis

The USD/JPY continues trading with a bearish bias at the 102.930 level, as it looks clear direction while taking rounds to 103.10/15 through the opening hour of Asian trading sessions. The yen pair descended to the new low in 10 months the prior day before closing with the Doji candlestick’s near opening levels on the daily chart. The risk-aversion stream, supported by concerns of the coronavirus (COVID-19) tension and the unadventurous spirits ahead of the Georgian elections, battles the greenback recovery and holds the USD/JPY in a compact range off-late.

The U.S. Dollar Index that includes the worth of the greenback against the basket of six major currencies was dropping by 0.25% to 89.67 on the day to insignificantly beneath the level it closed 2020 at 89.766. The U.S. dollar instability appended to the downward momentum of the USD/JPY pair. The Federal Reserve is scheduled to publish the minutes from its December conference on Wednesday. Investors will be watching for more detail on the talks about securing their forward policy guidance more specific and the chance of additional development in asset buying in 2021. 

The USD/JPY pair was also down in initial trading hours on Monday as the rising number of coronavirus cases throughout the world raised the safe-haven appeal in the market. Prime Minister Boris Johnson urged that strict lockdown stipulations would be placed in England to fight against the new variant of coronavirus that has pushed the infection rates to their highest record levels. School unions have raised called for the closure of all schools for a couple of weeks as the virus was spreading faster, but Johnson said to parents that they should send children to school as the threats to young kids from the deadly virus were very small.

 From the U.S. side, at 19:45 GMT, the Final Manufacturing PMI from the U.S. for December is projected to come as 56.3 against the previous 56.5 and weigh on the U.S. dollar add in the losses of USD/JPY pair. At 20:00 GMT, the Construction Spending for November is estimated to decrease to 1.1% against the previous 1.3% that could weigh on the U.S. dollar and USD/JPY pair as well.

Daily Technical Levels

Support Resistance

103.02     103.34

102.85     103.49

102.70     103.66

Pivot Point: 103.17

USD/JPY – Trading Tips

The USD/JPY is trading sharply bearish at 102.940, gaining support at the 102.940 level. The USD/JPY pair has formed a downward channel on the two-hourly timeframes, which may extend resistance at 103.300 as at the same level 50 periods EMA is also extending resistance. Today, we need to keep an eye on the 102.940 mark as a violation of this may offer us a sell trade until the 102.598 level. The MACD and RSI are suggesting selling bias in USD/JPY today. Good luck!

Categories
Crypto Market Analysis

Daily Crypto Review, Jan 5 – Ethereum Outpaces the Market; Most Cryptos in the Red

Daily Crypto Review, Jan 5 – Ethereum Outpaces the Market; Most Cryptos in the Red

The cryptocurrency sector experienced volatility amongst cryptos as Bitcoin continues its retracement and Ethereum outpaces the market. Bitcoin is currently trading for $31,479, representing a decrease of 4.15% compared to yesterday’s value. Meanwhile, Ethereum’s price has increased by a whopping 11.70% on the day, while XRP gained 1.27% of its value.

Daily Crypto Sector Heat Map

Birdchain gained 1498.92% in the past 24 hours, making it the most prominent daily crypto gainer by far. It is followed by Folgory Coin’s 837.8% and Rewardiqa’s 720.43% gain. On the other hand, Basiscoin Share lost 98.58%, making it the most prominent daily loser. It is followed by Basiscoin Cash’s loss of 90.24% and Mith Cash’s loss of 78.91%.

Top 10 24-hour Performers (Click to enlarge)

Bottom 10 24-hour Performers (Click to enlarge)

Bitcoin’s market dominance has moved down slightly since our last report, with its value currently being 68.2%. This value represents a 0.5% difference to the downside than the value it had when we last reported.

Daily Crypto Market Cap Chart

The cryptocurrency sector capitalization has decreased since we last reported, with its current value being $845.71 billion. This represents a $14.82 billion decrease when compared to our previous report.

_______________________________________________________________________

What happened in the past 24 hours?

_______________________________________________________________________

_______________________________________________________________________

Technical analysis

_______________________________________________________________________

Bitcoin

Bitcoin has possibly ended its retracement and entered sideways trading as its price created a double bottom at the $30,000 mark. However, there was one point where the largest cryptocurrency by market cap dropped as much as 20% and broke $28,000 to the downside, but recovered almost instantly.

BTC is currently right above the $30,807 Fib retracement level and is fighting to stay above it. If it posts a candle that shows it consolidated above this level, we could see another push towards the upside. However, if it breaks the Fib retracement, we could see BTC looking for support at the $30,000 or $29,300 levels.

BTC/USD 4-hour chart

Bitcoin’s technicals are showing a strong tilt towards the buy-side, with only the 4-hour time-frame showing bearish oscillator values.

BTC/USD 1-day Technicals

Technical factors (4-hour Chart):

  • Price is slightly above its 50-period EMA and at its 21-period EMA
  • Price is near its middle Bollinger band
  • RSI is neutral (48.20)
  • Volume is slightly above average

Key levels to the upside          Key levels to the downside

1: $34,800                                 1: $30,807

2: $35,000                                 2: $28,337

3: $36,000                                 3: $26,340

Ethereum

Ethereum is certainly one of the most interesting cryptocurrencies in the last couple of days, with its price going from stagnation to skyrocket mode in a matter of hours. While many thought that the initial push above $1,000 is over and that ETH is destined to retrace below it, the second-largest cryptocurrency by market cap managed to do it again – just one day later.

The cryptocurrency managed to bounce off of one of its numerous support levels and propel its price back above $1,000.

Ethereum is now fighting for the $1,000 level, with its price barely staying above it.

ETH/USD 1-hour Chart

Ethereum’s technicals on all time-frames show an overall bullish tilt with hints of neutrality coming from oscillators.

ETH/USD 1-day Technicals

Technical Factors (4-hour Chart):

  • Price is above both its 50-period and its 21-period EMA
  • Price is near its top Bollinger band
  • RSI has left the overbought area (68.56)
  • Volume is significantly above-average

Key levels to the upside          Key levels to the downside

1: $1,047                                     1: $1,009

2: $1,080                                     2: $960

3: $1,169                                      3: $932

Litecoin

Litecoin ended its 2-day bull run after reaching bull exhaustion at the $174.5 mark, after which it started to consolidate. However, the consolidation phase looks like less of a consolidation phase and more like a fight for the $152 Fib retracement level.

Litecoin is currently losing the battle for $152 –  but even in the case of bears pushing it to the downside, its price has many support anchor points, most notably the zone between $135 and $142.

LTC/USD 1-hour Chart

Litecoin’s technicals on the 4-hour and monthly time-frame are completely bullish, while its daily and weekly overviews show some oscillators having bearish values.

LTC/USD 1-day Technicals

Technical factors (4-hour Chart):

  • Its price is currently above both its 50-period EMA and its 21-period EMA
  • Price is at its middle Bollinger band
  • RSI is neutral (58.54)
  • Volume is above-average

Key levels to the upside          Key levels to the downside

1: $163.7                                      1: $155.25

2: $174.5                                      2: $149.3

3: $195.5                                   3: $143.5


Categories
Forex Signals

Gold Breakout Ascending Triangle Pattern – Bullish Bias Dominates! 

During Monday’s Asian trading session, the precious metal managed to extend its early-day positive performance and remained bullish around above the $1,920 level as the sharp rise in global COVID-19 cases and the possibility of more countries imposing tighter restrictions tend to underpin the safe-haven yellow metal. Meanwhile, the broad-based U.S. dollar weakness, triggered by the market upbeat mood, also played its key role in underpinning the gold prices as the price of gold is inversely related to the price of the U.S. dollar. However, the market trading sentiment was being supported by the optimism surrounding the coronavirus (COVID-19) vaccine, Brexit headlines, and the U.S. covid aid package. 

In that way, the upbeat market sentiment was seen as one of the key factors that kept the lid on any additional gold gains. Furthermore, the upticks in the gold prices could also be attributed to the escalating US-China tussles, which eventually lend some support to the safe-haven yellow metal. As of writing, the yellow metal prices are currently trading at 1,923.70 and consolidating in the range between 1,893.81 – 1,925.35.

The market trading sentiment managed to extend its last week’s positive performance and stay positive on the day as the U.S. stocks futures’ bullish appearance tends to highlight the risk-on sentiment. Behind this positive performance was the optimism surrounding the coronavirus (COVID-19) vaccine, Brexit headlines, and the U.S. covid aid package. Across the ocean, the latest upbeat prints of Asian activity numbers from Japan, South Korea, Indonesia, and Taiwan for December also played its major role in underpinning the market trading sentiment. However, the positive tone around the market sentiment favors the gold buyers via U.S. dollar weakness.

As a result of the risk-on mood, the broad-based U.S. dollar failed to gain any positive traction and remained bearish on the day. Meanwhile, the losses in the U.S. dollar were further bolstered by the easy money policy of the U.S. Federal Reserve and central bankers elsewhere. It is worth mentioning that the U.S. Federal Reserve is set to release the minutes from its December meeting on Wednesday. In that way, the market players will be looking for more detail on making their forward policy guidance more explicit and the chance of a further increase in asset buying in 2021. Hence, the losses in the U.S. dollar becomes the key factor that helps the gold to stay bid as the price of gold is inversely related to the price of the U.S. dollar. 

Elsewhere, the upticks in the gold prices could also be attributed to the concerns over the coronavirus (COVID-19) and tussles between the U.S. and China. The coronavirus (COVID-19) cases continue to rise, with above 85 million COVID-19 cases as of Jan. 4, with over 20.6 million cases of them in the U.S. Apart from the U.S., Japan is also gaining attention amid the recent surge in the cases and the death toll. As per the latest report, Japan recorded more than 3,100 new cases overnight. While Tokyo reported 816 new infections, bringing the cumulative total to 62,590, the largest among the country’s 47 prefectures so far. This, in turn, the government of Japan is seeking expert advice on whether to declare a state of emergency in Tokyo and neighboring prefectures. 

Looking forward, the market traders will keep their eyes on Caixin Manufacturing PMI for December, which is expected to reprint 54.9. Meanwhile, the second readings of monthly PMIs from Europe, the U.K., and the U.S. can decorate the calendar ahead. In addition to this, the updates about the U.S. stimulus package will be key to watch. In the meantime, the risk catalyst like geopolitics and the virus woes, not to forget the Brexit, will not lose their importance. 


Daily Support and Resistance

S1 1863.1

S2 1879.13

S3 1888.81

Pivot Point 1895.17

R1 1904.84

R2 1911.2

R3 1927.24

On Monday, the gold is trading sharply bullish at the 1,925 level. Gold has disrupted the ascending triangle pattern at the 1,898 mark on the daily chart, and now gold is likely to encounter resistance at 1,933 and 1,965 marks. The buying trend can be seen in gold, but unfortunately, our trades are closed at stop loss. I will be looking to take another buying trade once gold retraces back to 1,913 level. Good luck! 

Categories
Crypto Market Analysis

Daily Crypto Review, Jan 4 – Bitcoin Retraces Below $32k, Ether Breaks $1k!

The cryptocurrency sector is trying to find an equilibrium but was mostly volatile in recent days, with BTC retracing slightly and Ethereum skyrocketing towards its all-time highs. Bitcoin is currently trading for $31,796, representing a decrease of 8.08% compared to yesterday’s value. Meanwhile, Ethereum’s price has increased by a whopping 24.61% on the day, while XRP gained 7.37% of its value.

Daily Crypto Sector Heat Map

Scanetchain gained 446.19% in the past 24 hours, making it the most prominent daily crypto gainer by far. It is followed by Amun Ether 3x Daily Long’s 246.1% and Education Ecosystem’s 195.84% gain. On the other hand, Basiscoin Cash lost 96.51%, making it the most prominent daily loser. It is followed by Wownero’s loss of 91.09% and Bridge Finance’s loss of 90.45%.

Top 10 24-hour Performers (Click to enlarge)


Bottom 10 24-hour Performers (Click to enlarge)

Bitcoin’s market dominance has moved down almost two percent since our last report, with its value currently being 68.7%. This value represents a 1.9% difference to the downside than the value it had when we last reported.


Daily Crypto Market Cap Chart

The cryptocurrency sector capitalization has increased greatly since we last reported, with its current value being $860.45 billion. This represents a $97.68 billion increase when compared to our previous report.

_______________________________________________________________________

What happened in the past 24 hours?

_______________________________________________________________________

_______________________________________________________________________


Technical analysis

_______________________________________________________________________

Bitcoin

Bitcoin had continued its move up slowly until Jan 2, when its price skyrocketed and reached as high as $34,800. With this being set as the new all-time high, BTC started retracing and consolidating within a wide range, bound by the all-time high to the upside and $30,807 to the downside.

Any strong pushes were easily foreseen by the gradual increase in volume, which is what traders should pay attention to when trading the largest cryptocurrency by market cap.

BTC/USD 4-hour chart

Bitcoin’s technicals are showing a strong tilt towards the buy-side. However, some of its time-frames show slight neutrality alongside the overall bullishness.

BTC/USD 1-day Technicals

Technical factors (4-hour Chart):

  • Price is slightly above its 50-period EMA and above its 21-period EMA
  • Price is near its middle Bollinger band
  • RSI is neutral (55.04)
  • Volume is slightly above average

Key levels to the upside          Key levels to the downside

1: $34,800                                 1: $30,807

2: $35,000                                 2: $28,337

3: $36,000                                 3: $26,340

Ethereum

Ethereum’s spike could be considered a late response to Bitcoin’s spike, as its price followed in direction but not percentage-wise when BTC pushed towards $35k. However, the second-largest cryptocurrency by market cap skyrocketed in the past hours, reaching as high as $1,169.

This push towards the $1k mark is historic, as the only real upside is the all-time high of $1,420 from Jan 2, 2020.

Ethereum is currently fighting to stay above the $1,000 mark, and its short-term future will be determined by it managing to stay above or retracing below this level.

 ETH/USD 1-hour Chart

Ethereum’s technicals look very much like Bitcoin’s, with the overall tilt being towards the buy-side, with oscillators tilting towards bearishness.

ETH/USD 1-day Technicals

Technical Factors (4-hour Chart):

  • Price is above its 50-period and at its 21-period EMA
  • Price is near its middle Bollinger band
  • RSI is neutral (60.37)
  • Volume is descending from above-average levels

Key levels to the upside          Key levels to the downside

1: $1,047                                     1: $1,009

2: $1,080                                     2: $960

3: $1,169                                      3: $932

Litecoin

Litecoin had an amazing 2-day run as its price increased from $124 all the way up to $175. However, the $175 mark stopped the bulls from reaching any higher, and Litecoin started retracing. The retracement also came as a response to BTC’s retracement, as the two cryptocurrencies are highly correlated.

Litecoin is now struggling to stay above the $155.25 level. However, its short-term price direction will most likely be decided by Bitcoin’s movements, rather than staying above or below any support/resistance levels.

 LTC/USD 1-hour Chart

Litecoin’s technicals on all time-frames are tilted towards the buy-side and show almost no bearish or neutral signs.

LTC/USD 1-day Technicals

Technical factors (4-hour Chart):

  • Its price is currently above its 50-period EMA and at its 21-period EMA
  • Price is at its middle Bollinger band
  • RSI is in the oversold territory (50.57)
  • Volume is currently on below-average levels

Key levels to the upside          Key levels to the downside

1: $163.7                                      1: $155.25

2: $174.5                                      2: $149.3

3: $195.5                                   3: $143.5


Categories
Forex Fundamental Analysis

EUR/JPY Global Macro Analysis – Part 3

EUR/JPY Exogenous Analysis

  • The EU and Japan Current Account to GDP differential

The current accounts have three basic components: net exports, the difference in incomes that countries pay each other, and transfer payments that countries make to each other. A country that has a surplus in international trade has a higher current account to GDP ratio. Since its domestic currency is in higher demand, it tends to appreciate. Conversely, a country with current account deficits will need to buy more foreign currencies to finance its imports – which weakens the domestic currency in the forex market.

In 2020, the Japanese currency account to GDP ratio was expected to drop to 3.5% while that of the EU 3.4%. This means that the 2020 current account to GDP differential between the EU and Japan is -0.1%. In this case, we expect a bullish JPY; hence, we assign a score of -2.

The interest rate differential between the EUR/JPY pair is used to determine whether traders are bullish or bearish. If the interest rate differential is positive, it means that traders can receive higher returns by selling the JPY and buying the EUR since the EUR offers higher returns. Thus, they are bullish on the pair. Conversely, if the interest rate differential is negative, it means that traders can receive higher returns by selling the EUR and buying the JPY, which means they will be bearish on the EUR/JPY pair.

In 2020, the Bank of Japan maintained the interest rates at -0.1% while the ECB maintained at 0%. Therefore, the interest rate differential for the EUR/JPY pair is 0.1%. We assign a score of 2.

  • The EU and Japan GDP Growth Rate differential

The rate at which an economy is growing impacts the strength of the domestic currency in the forex market. Since it is impractical to compare countries’ economic performance using absolute GDP numbers, we will use their growth rate. In this case, if the GDP growth rate differential is positive, it means that the EU economy has been growing at a faster pace than that of Japan hence a bullish outlook for the EUR/JPY pair. Conversely, when negative, it implies a bearish outlook for the pair.

The Japanese economy contracted by 3.5% in the first three quarters of 2020, while the EU economy contracted by 2.9. Thus, the GDP growth rate differential is 0.6%. Thus, we assign a score of 2.

Conclusion

The exogenous factors have a cumulative score of 2. That means we can expect a short-lived bullish trend for the EUR/JPY pair. The weekly EUR/JPY chart shows that the pair has crossed the 200-period MA for the first time since August and attempting a breach of the upper Bollinger band.

We hope you find this article informative. In case of any questions, please let us know in the comments below. Cheers.

Categories
Forex Fundamental Analysis

EUR/JPY Global Macro Analysis – Part 1 & 2

Introduction

The global macro analysis of the EUR/JPY forex pair will involve the analysis of endogenous and exogenous economic factors. The endogenous analysis will cover indicators that drive economic growth in the EU and Japan. Exogenous factors will cover the analysis of factors that impact the exchange rate between the Euro and the Japanese Yen.

Ranking Scale

We will use a scale of -10 to +10 to rank the impact of these factors. When the endogenous factors are negative, it implies that they resulted in the depreciation of the local currency. a positive ranking implies that they led to an increase in the value of the domestic currency. The ranking of the endogenous factors is determined by their correlation with the domestic GDP growth.

When the exogenous factors get a negative score, it means they have a bearish impact on the EUR/JPY pair. A positive score implies they’ve had a bullish impact. The ranking of the exogenous factors is determined by their correlation to the exchange rate of the EUR/JPY pair.

EUR Endogenous Analysis – Summary

The endogenous analysis of the EUR has an overall score of -3. Based on the factors we have analyzed, we can expect that the Euro had marginally depreciated in 2020.

JPY Endogenous Analysis – Summary 

A score of -12 implies a strong deflationary effect on the JPY currency pair, and we can conclude that this currency has depreciated this year.

  • Japan Employed Persons

This indicator measures the changes in the number of workers over a particular period. It only tracks the section of the labor force that has attained the minimum working age. Changes in the labor market are seen as leading indicators of economic development.

In October 2020, the number of employed persons in Japan increased to 66.58 million from 66.55 million in September. The number of employed persons in Japan is still lower than the 67.4 million recorded in January. We assign a score of -5.

  • Japan GDP Deflator

The GDP deflator is used to measure the comprehensive changes in the overall inflation of the Japanese economy. Since it measures the price changes of the entire economic output, it is used as a key predictor of future monetary and fiscal policies. An increase in GDP deflator means that the economy is expanding, which may lead to the appreciation of the JPY.

In Q3 of 2020, the Japan GDP deflator dropped to 100.4 from 103.5 in Q2. Up to Q3, the Japan GDP deflator has marginally increased by 0.2 points. We assign a score of 1.

  • Japan Industrial Production

This indicator covers the changes in the output value of mining, manufacturing, and utility sectors. The Japanese economy is highly industrialized. The industrial sector contributes approximately 33% of the GDP. That means the GDP growth rate in Japan is sensitive to the changes in industrial production.

The MoM industrial production in Japan increased by 3.8% in October 2020 while the YoY dropped by 3.2% – the slowest since February 2020. On average, the MoM industrial production in Japan is -0.15%. We assign a score of -5.

  • Japan Manufacturing PMI

About 400 large manufacturers are surveyed monthly by The Jibun Bank. These manufacturers are classified according to the sector of operations, their workforce size, and contribution to GDP. The overall manufacturing PMI is an aggregate of employment, new orders, inventory, output, and suppliers’ deliveries. The Japanese manufacturing sector is seen to be expanding when the PMI is above 50 and contracting when below 50.

In November 2020, the Japan Manufacturing PMI was 49 compared to 48.7 in October. The November reading is almost at par with the January levels. We assign a score of 1.

  • Japan Retail Sales

The retail sales measure the change in the monthly purchase of goods and services by Japanese households. Since it is a leading indicator of consumer demand and expenditure, it is best suited to gauge possible economic contractions and expansions.

In October 2020, Japan retail sales rose by 0.4% from 0.1% recorded in September. YoY retail sales increased by 6.4%, which marks the first month of increase since February 2020. The growth of retail sales is mainly attributed to an increase in motor vehicle sales, machinery and equipment, and medicine & toiletry. On average, the first ten months of 2020 have had a 0.4% increase in MoM retail sales. Thus, we assign a score of 2.

  • Japan Consumer Confidence

This is a monthly survey of about 4700 Japanese households with more than two people. The survey covers the households’ opinion on the overall economic growth, personal income, employment, and purchase of durable goods. An index of above 50 shows that the households are optimistic, while below 50 shows that they are pessimistic.

In November 2020, Japan’s consumer confidence was 33.7 – the highest recorded since March. It is, however, still lower than the pre-pandemic levels of 39.1. We assign a score of -3.

  • Japan General Government Gross Debt to GDP

Prospective domestic and international lenders use the government debt to GDP ratio to determine the ability of an economy to sustain more debt. Among the developed nations, Japan has the highest government debt to GDP ratio. However, it has minimal risk of default since most of the debt is domestic and denominated in Japanese Yen, which poses a low risk of inflating the domestic currency in the international market.

In 2019, the general government gross debt to GDP in Japan was 238%, up from 236.6% in 2018. In 2020, it was projected to hit a maximum of 250%. We assign a score of -3.

In our upcoming article, we have performed an Exogenous analysis of the EUR/JPY Forex pair and gave our optimal forecast. Make sure to check that out. Cheers.

Categories
Forex Course

203. Bond Spreads Between Two Economies and Their Exchange Rate

Introduction

Bond spreads play a vital role in the movement of currencies. The difference between the bond yield of two countries is called interest rate differential. It is more impactful on the currency direction as opposed to the actual bond spreads. The difference between the interest rate between the bond yield of two countries typically moves together with the corresponding currency pair.

Understanding The Impact

The prices of different currencies can influence the monetary policy decision by the central banks across the globe. However, monetary policy decisions, as well as interest rates, can also contribute to the price movement of the currencies. For example, a stronger currency will help control the inflation rate, whereas the weaker currency will contribute to inflation.

Additionally, the central banks harness this relationship as a means to manage the monetary policies in the respective countries. By comprehending as well as assessing these relationships and the patterns, people get a window into the currency market, thereby getting a means to forecast and capitalize on the currency movements.

An Example of This Relationship

In 2000, post the tech bubble burst, traders who were earlier looking for the highest returns shifted their focus on capital preservation. However, the U.S. was provided with below 2% interest rate, a lot of hedge funds, and those who had access to the international market moved abroad looking for higher yields.

Moreover, Australia has similar risk factors as the U.S. extended interest rate of 5%. Consequentially, this attracted a lot of investment money within the country, creating asset domination. This significant difference in interest rate resulted in the growth of the carry trade. In this, the investors bought currency from low yielding countries and invested in high yielding countries, and benefited from the difference in the interest rate.

Bond Spreads and Movement Of Currency

Bong spreads differential typically move together with currency pairs. This notion emerges as the capital flows move towards high yielding currencies. When there is an increase in one currency rate with respect to another currency, the investors move towards the higher-yielding currency.

Furthermore, the cost of acquiring lower-yielding currencies rises as the bond spread differential moves in favor of selling currency.

[wp_quiz id=”97499″]
Categories
Forex Market Analysis

Daily F.X. Analysis, January 04 – Top Trade Setups In Forex – Manufacturing PMI In Focus! 

On the news front, eyes will remain on the Manufacturing PMI and Services PMI figures from the Eurozone, U.K., and the United States. Almost all economic figures are expected to perform better than previous months, perhaps due to a lift of lockdown. Price action will depend upon any surprise changes in the PMI figures.

Economic Events to Watch Today  


EUR/USD – Daily Analysis

The EUR/USD pair was opened at 1.22387, and it has placed a high of 1.22584 and a low of 1.22276 so far. The currency pair is currently moving at 1.25514 and has shown a consolidative move since the start of the day.

The U.S. dollar was weak across the board on Monday and the starting day of the week and pushed the currency pair EUR/USD higher on board. However, the EUR/USD pair’s gains remained consolidative ahead of the release of macroeconomic data from the European side.

At 13:15 GMT, the Spanish Manufacturing PMI for December is forecasted to come in as 52.6 compared to November’s 49.8, which, if met, will be supportive to the single currency Euro and will probably add gains in EUR/USD pair. At 13:45 GMT, the Italian manufacturing PMI for December is also expected to surpass the previous 51.5 and come in as 53.5 and support the single currency Euro to add further gains in EUR/USD pair. At 13:50 GMT, the French Final Manufacturing PMI is projected to remain flat at 51.1 for December. At 13:55 GMT, The German Final Manufacturing PMI for December is also projected to remain the same as November’s 58.6. At 14:00 GMT, the Final manufacturing PMI for December from the whole Eurozone is also expected to remain flat at 55.5.

From the U.S. side, at 19:45 GMT, the Final Manufacturing PMI from the U.S. for December is anticipated to release as 56.3 against the previous 56.5 and weigh on the U.S. dollar be beneficial for EUR/USD pair. At 20:00 GMT, the Construction Spending for November is estimated to decline to 1.1% compared to the previous 1.3%, and if the actual meet the expectations, then EUR/USD will gain more as the U.S. dollar will become weak.

Apart from macroeconomic data, the gains in EUR/USD pair were very limited at the start of the trading session as the rise in coronavirus cases in Europe urged the countries to get ready to extend lockdowns to control the spread of the virus. Not in Europe, but all countries across the world, including UK, Canada, India, the USA, Japan, and Mexico also have seen a rise in the number of infection cases that has prompted the need for safe-haven and resulted in the consolidative movement of EUR/USD pair on Monday.

The risk perceived EUR/USD pair faced pressure while moving upward as the risk sentiment in the market deteriorated after the rising number of coronavirus cases throughout the globe. However, the currency pair EUR/USD remained on the plus side as the European countries have started immunizing people against coronavirus in earnest, but huge discrepancies in vaccination pace exist.

Meanwhile, the U.S. dollar was also weak ahead of Tuesday’s Georgia runoff elections that will decide the control of the U.S. Senate and also the fate of President-elect Joe Biden’s legislative agenda. Whereas, Senate ended the demand for an increase in direct payments from $600 to $2000 by Donald Trump and supported by Democrats as Republicans did not approve it and weighed on the U.S. dollar that ultimately kept the EUR/USD pair higher.

Daily Technical Levels

Support   Resistance

1.2179      1.2279

1.2144      1.2344

1.2078      1.2379

Pivot Point: 1.2244

EUR/USD– Trading Tip

The EUR/USD is trading with a bearish bias today at the 1.2248 level, having violated the upward trendline at the 1.2252 level. Closing of candles below this trendline confirms a breakout, and there’s a strong odd of selling trend’s continuation until 1.2203. The next support may be found around the 1.2175 level below this, along with resistance at 1.2258 and 1.2313. The 50 periods EMA is likely to extend resistance at the 1.2262 level, and supporting selling trend in the EUR/USD today! 


GBP/USD – Daily Analysis

On January 04, the currency pair was opened at 1.36471, and it has placed a high of 1.36982 and a low of 1.36436 so far. The pair is currently moving at 136884 and is rising to place gains for the 4th consecutive session on Monday. The U.K. was enjoying its first trading session as an independent nation on Monday as the transition period for Brexit ended on Thursday when the United Kingdom finally ended its ties with the European Union, almost a year after its formal departure from the 27-nation bloc.

After four and a half years, when the majority in the U.K. voted to leave the European Union, the end of the transition period was a significant moment in the history of the U.K. Great Britain will now forge a separate path after almost five decades as part of the bloc. 

According to PM Boris Johnson, Britain will be an open, generous, outward-looking, internationalist, and free-trading country free to do things differently and, if necessary better than the E.U. On Sunday, the PM Boris Johnson said that he intended to carry on as a prime minister after Brexit.

Although the British Pound will see a selling pressure given the impact of Brexit sooner or later, the investors were favoring the currency in the beginning hours of the trading session ahead of the macroeconomic data or any major news as after a long fight between the E.U. & U.K.; the country has departure from the E.U. with a deal beneficial for both sides successfully.

At 14:30 GMT, the Final Manufacturing PMI for December is expected to remain flat at 57.3. The Mortgage Approvals from Britain in November are expected to decline to 82K from October’s 98K and weigh on British Pound that could drag the pair GBP/USD lower. The Net Lending to Individuals for November is also expected to decline to 3.0B from October’s 3.7B and weigh on British Pound and limit the GBP/USD pair’s upward trend. Furthermore, the pair was also supported in the Asian session due to the weakness of the U.S. dollar on Monday. The U.S. dollar was weak due to the broad market optimism and rallying equities. Some news from the U.S. Congress unveiled that Nancy Pelosi was re-elected as the U.S. House Speaker, which indicated an easy way for further stimulus. 

Meanwhile, Georgia’s electoral runoff will also decide the Senate majority’s fate and will be crucial to watch on Tuesday. All these developments kept the greenback under pressure and supported GBP/USD’s rising prices on Monday during the early session.

Apart from Brexit and U.S. headlines, the currency pair came under pressure as the market’s risk sentiment was affected by the increase in the number of coronavirus cases throughout the globe. 

The rising number of infections from COVID-19 raised fears that countries might extend the restrictions that would have a negative impact on global economic recovery. These fears kept the risk perceived GBP/USD pair under pressure and kept its gains limited during the Asian session on Monday.

Daily Technical Levels

Support   Resistance

1.3623      1.3705

1.3573      1.3737

1.3540      1.3788

Pivot Point: 1.3655

GBP/USD– Trading Tip

The GBP/USD pair has also violated the resistance level of 1.3617 level, and on the higher side, the next target remains at the 1.3698 level. On the lower side, the GBP/USD pair may find support at the 1.3617 level for now. We can expect a continuation of an upward trend in the Sterling today. The 50 periods EMA is supporting bullish bias at the 1.3600 level, and at the same time, the upward channel is also likely to keep Sterling bullish on Monday. Let’s consider taking buying trades over 1.3609 and selling below the 1.3698 level today. 


USD/JPY – Daily Analysis

On January 04, the USD/JPY opened at 103.096, and it has placed a high of 103.314 and a low of 102.932 since then. The pair USD/JPY was currently moving at 103.023 and was placing losses for the day.

In the Asian trading session, the U.S. dollar was down on Monday, with investors continuing to put pressure on the safe-haven assets on the first trading day of 2021. The rising expectations that the U.S. interest rates will remain low and hopes for an eventual global economic recovery from coronavirus will likely continue to slow the dollar down against other major currencies.

The U.S. Dollar Index that measures the value of the U.S. dollar against the basket of six major currencies was down by 0.25% to 89.67 on the day to slightly below the level it ended 2020 at 89.766. The U.S. dollar weakness added to the downward momentum of the USD/JPY pair on Monday.

The Federal Reserve is due to release the minutes from its December meeting on Wednesday. Investors will be looking for more detail on the discussions about making their forward policy guidance more explicit and the chance of a further increase in asset buying in 2021. Meanwhile, the USD/JPY pair was also down in early trading hours on Monday as the rising number of coronavirus cases throughout the world raised the safe-haven appeal in the market. 

On Sunday, Prime Minister Boris Johnson warned that severe lockdown restrictions would be installed in England to fight against the new variant of coronavirus that has pushed the infection rates to their highest record levels. Whereas, School unions have raised called for the closure of all schools for a couple of weeks as the virus was spreading faster, but Johnson said to parents that they should send children to school as the threats to young kids from the deadly virus were very small.

Meanwhile, on Saturday, Canada reported an estimated 4800 more cases of the deadly coronavirus that added to the country’s total caseload and made it 586,425. Canada said that the rise in the number of coronaviruses was seen after the holiday season. In India, 16,660 fresh cases were reported in a single day that sent the total number of infections to 10,341,291. 

Americans have been reported to flee to Mexico to avoid the lockdown restrictions back at home. According to Times, about half a million Americans traveled to Mexico in November, whereas Mexico has reported an increase in the number of coronavirus cases in November and December.

The global sum of coronavirus cases reached 85,489,058, out of which 60,443,211 have recovered, and 1,850,202 have died so far. The U.S. cases reached a total of 21,110,917 number and remained the worst-hit county by the world’s coronavirus. Despite the vaccine rollout, the rising number of coronavirus cases throughout the globe added to the fears that countries will enter new lockdown restrictions and affect global economic recovery. These fears raised the market’s safe-haven appeal and supported the safe-haven Japanese Yen that ultimately weighed on the USD/JPY pair. 

On the data front, at 05:30 GMT, the Final Manufacturing PMI in December came in as 50.0 against the expected 49.7 and supported the Japanese Yen that added in the losses of the USD/JPY pair on Monday. From the U.S. side, at 19:45 GMT, the Final Manufacturing PMI from the U.S. for December is projected to come as 56.3 against the previous 56.5 and weigh on the U.S. dollar add in the losses of USD/JPY pair. At 20:00 GMT, the Construction Spending for November is estimated to decrease to 1.1% against the previous 1.3% that could weigh on the U.S. dollar and USD/JPY pair as well.

Daily Technical Levels

Support   Resistance

103.02      103.34

102.85      103.49

102.70      103.66

Pivot Point: 103.17

USD/JPY – Trading Tips

The USD/JPY is trading sharply bearish at 102.940, gaining support at the 102.940 level. The USD/JPY pair has formed a downward channel on the two-hourly timeframes, which may extend resistance at 103.300 as at the same level 50 periods EMA is also extending resistance. Today, we need to keep an eye on the 102.940 mark as a violation of this may offer us a sell trade until the 102.598 level. The MACD and RSI are suggesting selling bias in USD/JPY today. Good luck!

Categories
Forex Signals

USD/CAD Supported Over Triple Bottom – Brace for a Trade Here! 

The USD/CAD pair was opened at 1.27142, and it has placed a high of 1.27358 and a low of 1.26950 since then. The pair was currently moving at 1.27035 and was posting losses on Monday for the 5th consecutive session. The losses in the USD/CAD pair during the Asian session on Monday could be attributed to the US dollar’s weakness along with the rising crude oil prices on the day. The deteriorated risk-sentiment could also be a factor behind the USD/CAD pair’s declining prices on Monday. 

The US Dollar was weak across the board on Monday as the US saw a massive increase in the number of coronavirus cases as the total count of infection cases reached 21,110,917 in the country and made it the worst-hit country by the COVID-19. The US Dollar Index was also down on Monday by 0.25% at the 89.67 level.

The US dollar weakness could also be attributed to the latest rejection of an increase in direct payments by the US Senate. Lately, the US President called to increase the direct payments to Americans to $2000 from $600 that was also supported by Democrats; however, these efforts have come to an end after Republicans refused to increase them. Furthermore, the US billions were also hesitant to place strong moves in the market ahead of Tuesday’s Georgia’s electoral runoff and Wednesday’s December meeting minutes release from FOMC.

On the other hand, the West Texas Intermediate (WTI) Crude Oil prices on Monday have reached $49.27 per barrel so far and were moving upward continuously. The crude oil has posted gains for four consecutive sessions, and the outlook remained positive, which means it could increase further. The rising crude oil prices added support to the commodity-linked currency Loonie that ultimately added more pressure on the USD/CAD pair’s prices on Monday.

On the data front, Manufacturing PMI from Canada is expected to release at 19:30 GMT, November’s PMI was 55.8, and anything above it in December could be beneficial for the Canadian dollar, and anything less than it could be against the local currency. From the US side, at 19:45 GMT, the Final Manufacturing PMI from the US for December is predicted to come as 56.3 against the previous 56.5 that could hurt the US dollar and add further losses in the USD/CAD pair. At 20:00 GMT, the Construction Spending for November is forecasted to drop to 1.1% against the previous 1.3% that could also add more losses in the USD/CAD pair.


Daily Technical Levels

Support Resistance

1.2704 1.2762

1.2679 1.2795

1.2647 1.2820

Pivot point: 1.2737

The USD/CAD is trading at 1.2684, and violation of this level can extend the selling trend until the 1.2637 level. On the 2 hour timeframe, the USD/CAD is supported due to the triple bottom, but the RSI and MACD are suggesting a selling trend in USD/CAD. However, we can’t take a sell trade unless the 1.2685 level is violated. Let’s wait for a breakout elsewhere; we can take a buy trade over 1.2685 tp target 1.2760. Good luck!

Categories
Forex Course

202. The Effects Of Bond Yields On The Forex Asset Classes

Introduction

Bonds are referred to as loans provided to big organizations, including national governments, corporations, and cities. Each bond includes a substantial amount of loan. This is because the massive operational scale of the units requires them to take money from multiple sources. Bonds are a form of fixed-income investments.

Bond Yields

Bond yield is defined as the measure of profit that you will make by investing in a bog. The less you pay for the particular bond, the more will be your profit, and the higher your yield will be. Similarly, the more money you invest in a bond, the lesser will be the profit, and subsequently, the lower will be your yield.

Bonds are traded within the foreign exchange market known as the currency pairs. It is defined as the relative rate between the currency of one country and the currency of another one. When a currency pair is traded, the traders are also acquiring one currency and selling the other.

A majority of the currency exchange transacted in the spot market. In this currency market, each participant is required to deliver their respective currency within two business days. Moreover, currency trade that involves the delivery of a currency over two days is executed on the forward market.

This market includes the costs of owning a currency relative to owing the other. And the costs are displayed in the forward’s points that are added or subtracted to the spot rate in order to produce the forward rate. Furthermore, the forward points are measured by subtracting one bond yield from the other.

How Bond Yield Impacts The Currency Movement?

Experienced foreign exchange traders will be able to identify the relationship between the value of the currency, stock prices, and bond yield. The movement in the currency value reflects the actions of foreign investors between stocks and bonds.

Additionally, the relationship between bond yields makes government bond yield serve as a valuable indicator for assessing the opinion on the effectiveness of the U.S. Federal Reserve in inflation control.

Considering that inflation is an imperative aspect that determines currency values, the data extended by the treasury is very important. Granted, the bond yield centres on inflation, as it is associated with growth.

[wp_quiz id=”97495″]
Categories
Forex Course

201. The Relationship Between The US Dollar & Crude Oil

Introduction

There is a strong and rather undiscovered string that brings together currencies and crude oil. Price actions in one area, it forces opposing or sympathetic reactions in the other. Such a correlation persists for different reasons that include the balance of trade, resource distribution, market psychology, etc.

Additionally, crude oil makes a considerable contribution to deflationary and inflationary pressures that reinforces the inter-relationships amidst the trending periods, to downside and upside.

The Relationship Between The U.S. Dollar and Oil

Oil is quoted in U.S. dollars; therefore, each downtick, as well as an uptick in the currency or in the communities price, create a direct realignment between the numerous forex crosses and greenbacks. Such movements are not that correlated in countries without major crude oil reserve.

The Changing Scenario Of Oil Correlations

Many countries harnessed the crude oil reserved amidst the historical rise of the energy market between the 1990s and 2000s. Borrowings were made excessively to develop infrastructure, execute social programs, and expand military operations.

Post the economic collapse of 2008; the bills came to sue wherein some nations delivered whereas the others decided to double down by borrowing more against the reserved in order to rebuild the trust among their impacted economies.

The substantial burden of debt assisted in keeping high growth rates until the price of the global crude oil collapses in the year 2014. This also threw commodity-sensitive countries in a recession zone. Brazil, Canada, Russian, etc. experienced a struggling period for a couple of years while they adjusted to the plummeting values of their currencies. However, they did make a comeback between 2016 and 2017.

The pressure to sell more has spread across different groups of commodities, increasing concerns related to global deflation. Subsequently, it strengthened the correlation between commodities that were affected that include economic centres without major commodity reserves and crude oil.

Moreover, currencies in countries that have major mining reserves but inadequate energy reserves witness reduced currency value in comparison to oil-rich countries.

The U.S dollar has benefited from the decline of crude oil because the U.S economic growth is for some odd reasons compared to the trading partners, maintaining the right balance.

[wp_quiz id=”97491″]
Categories
Forex Fundamental Analysis

EUR/CAD Global Macro Analysis Part 3

EUR/CAD Exogenous Analysis

  • The EU and Canada Current Account to GDP differential

When a country has a high current account to GDP ratio, it means that it is running a current account surplus. That implies that the country is highly competitive in international trade as the value of its exports is higher than its imports. Conversely, a country with a low or negative current account to GDP ratio, is running a current account deficit. It means that the value of its imports is higher than exports.

In 2020, Canada’s current account to GDP is expected to hit -2.7% while that of the EU 3.4%. Thus, the current account to GDP differential between the EU and Canada is  6.1%. This means that the EUR is in higher demand in the international market than the CAD. We assign a score of 5.

In the forex market, interest rate differential helps to show investors and traders which currency will earn them higher returns. In a carry trade, forex traders tend to be bullish on the currency that offers a higher interest rate differential. This means that the currency with the higher interest rate will have a higher demand than the lower interest rate.

The European Central Bank has maintained interest rates at 0% throughout 2020, while in Canada, interest rates were cut from 1.75% to 0.25%. Thus, the interest rate differential for the EUR/CAD pair is -0.25%. We assign a score of -2.

  • The EU and Canada GDP Growth Rate differential

Since countries vary in the economy’s size, it makes it hard to compare them based on absolute GDP. However, the GDP growth rate helps filter out the effects of the economy size and instead compares countries based on their growth.

From January to September 2020, the Canadian economy has contracted by 4.3% while the EU economy has contracted by 2.9%. That means that the GDP growth rate differential between the EU and Canada is 1.4%. i.e., the Canadian economy has contracted more than the EU economy. We assign a score of 4.

Conclusion

The exogenous analysis of the EUR/CAD pair has a score of 8, which means we can expect a bullish trend for the pair in the short-term. This is supported by our technical analysis, which shows the weekly chart bouncing off the lower Bollinger band, implying that an uptrend is looming.

We hope you find this article informative. In case of any queries, please let us know in the comments below. All the best.

Categories
Forex Fundamental Analysis

EUR/CAD Global Macro Analysis Part 1 & 2

Introduction

The global macro analysis of the EUR/CAD pair will analyze endogenous factors that drive the domestic GDP in the EU and Canada. We’ll also analyze exogenous factors that affect the dynamics of the EU and Canada economies, hence affecting the EUR/CAD exchange rate.

Ranking Scale

We’ll rank both endogenous and exogenous factors on a sliding scale from -10 to +10. When the endogenous factors are negative, it means they caused the domestic currency to depreciate. A positive ranking means they resulted in an appreciation of the currency during the period under review. The endogenous scores are based on correlation with the domestic GDP growth.

Similarly, when the exogenous factors get a negative score, they resulted in a drop in the exchange rate. A positive exogenous score means it increased the exchange rate of the EUR/CAD pair. The exogenous scores are based on a correlation with the price of the EUR/CAD pair.

EUR Endogenous Analysis – Summary

The endogenous analysis of the EUR has presented a score of -3. Based on the indicators that we have analyzed, we can conclude that the Euro has depreciated marginally this year.

CAD Endogenous Analysis – Summary

This economic indicator shows the monthly change in the number of Canadians who are employed. It covers both full-time and part-time employment. Normally, employment changes correspond to an increased business activity, which corresponds to changes in the GDP.

In November 2020, employment in Canada increased by 62,000, down from the 83,600 increase registered in October. The November employment change was the lowest since May 2020, when economic recovery from the effects of the coronavirus began. Up to November 2020, the Canadian economy has shed about half a million jobs. We assign a score of -6.

  • Canada GDP Deflator

The GDP inflator is a comprehensive measure of the change in the inflation rate in Canada. It is comprehensive since it reflects the changes in the prices of all goods and services produced within the economy. This contrasts with other measures of inflation like the CPI, which only measures changes in the price of a select basket of goods and services.

In Q3 of 2020, the GD deflator in Canada rose to 111.6 from 108.8 in Q2. Q3 reading is the highest ever in the history of Canada. This shows that the Canadian economy is bouncing back from the economic downturn brought about by the pandemic. We assign a score of 2.

  • Canada Industrial Production

This indicator measures the total output from businesses operating in the industrial sector. Canadian industrial production comprises mining, manufacturing, and utilities. It is the backbone of the Canadian economy, with crude oil production alone accounting for almost 10% of the GDP.

In September 2020, the YoY Canadian industrial production dropped by 7.9%, while the MoM increased by 1.41%, up from the 0.13% drop in August. Up to September, the overall industrial production is down 5.54%. We assign a score of -5.

  • Canada Manufacturing PMI

This indicator measures the Canadian manufacturing sector’s performance from the perspective of firms’ purchasing managers in the sector. The PMI aggregates the following indexes; inventories, employment, new orders, output, and suppliers’ deliveries. The sector is expanding if the index is above 50, while a reading below 50 shows contraction.

In November 2020, the Canada Manufacturing PMI rose to 55.8 from 55.5 in October. This marked the fifth consecutive expansion in the manufacturing sector from July 2020. Thus, we assign a score of 4.

  • Canada Retail Sales

The Canada retail sales data measures the changes in the value of final goods and services purchased by households over a particular period. It is a critical leading indicator of the overall economic growth since households’ consumption is considered the primary driver of GDP growth.

In September 2020, the MoM retail sales in Canada increased by 1.1%  compared to a 0.5% increase in August. YoY retail sales rose by 4.6% compared to 3.7% in August 2020. Up to September 2020, the retail sales figure has risen by an average of 1.38%. We assign a score of 3.

  • Canada Consumer Confidence

Canada consumer confidence is calculated from an aggregate of 11 questions from the survey of households. This survey estimated the current situation to that expected by households in about six months. The questions touch on the areas of the economy, personal finances, job security, household purchases, and savings vs. expenditure goals. Their confidence is measured on a scale from 0 to 100.

In November 2020, consumer confidence in Canada rose to 44.5 from 42.08 in October. It is, however, still lower than during the pre-pandemic period. We assign a score of -5.

  • Canada Government Gross Debt to GDP

In 2019, Canada had a government debt to GDP ratio of 88.6%, down from 89.7% in 2018. The 2019 ratio was the fourth consecutive year since 2016, when the government debt to GDP ratio dropped.

In 2020, it is projected that the Canadian government debt to GDP ratio will increase to 97%. This increase is due to the increased expenditure to alleviate the economy during the coronavirus pandemic. Over the long term, Canada’s government debt to GDP ratio is expected to stabilize around 90%. We assign a score of -2.

In the next article, you can find the exogenous analysis of the EUR/CAD forex pair where we have qualitatively forecasted the future price movement of this pair. Cheers.

Categories
Forex Course

200. The Correlation Between USD/CAD Pair & Crude Oil

Introduction

Crude oil, also known as black gold, is the major energy source that runs the economy. Canada is among the top oil producers in the world. It is one of the major oil exporters to the USA. Canada exports more than 3 million barrels of petroleum and oil products, a figure that is sufficient to impact USD/CAD’s movement.

USD/CAD and Crude Oil – The Correlation

The volume of crude oil that Canada exports to the US generate massive demand for the CAD. Moreover, Canada’s economy depends a lot on its exports, and approximately 85% of the country’s exports go to the US.

Therefore, the value of USD/CAD is significantly impacted by how the consumers in the United States reach oil prices. If the US’s demand increases, manufacturers have to order more oil to cater to the rising demand. This can result in rising oil prices, thereby resulting in reducing the value of USD/CAD.

Conversely, if the US’s demand falls, the manufacturer will not need to order in more oil to make goods. Subsequently, the oil prices might fall, which would be bad from the CAD value. So essentially, USD/CAD has a negative correlation.

It’s all about Supply and Demand

Supply and demand are the prominent influencers of the correlation between USD/CAD and crude oil, impacting the demand and supply of US dollars and Canadian dollars.

Export of cruise oil covers a significant percentage of the US currency acquired by Canada. This means that a shift in the price and volume of crude oil will have a considerable impact on the flow of the Greenback into the Canadian dollar.

Furthermore, high crude oil prices also imply a higher flow of USD into Canada due to its exports. This implies that there will be a strong supply of the USD into the Canadian dollar, thereby increasing the value of the Canadian dollar.

Similarly, when the crude price falls, the US dollar supply will be lowered as opposed to the Canadian dollar, leading to a decreasing value of the Canadian dollar.

[wp_quiz id=”97486″]
Categories
Crypto Market Analysis

Daily Crypto Review, Dec 31 – Bitcoin Hits a New All-Time High as it Pushes Past $29K

The cryptocurrency sector is stabilizing vastly in the green as Bitcoin pushed above $29,000, creating a new all-time high. Bitcoin is currently trading for $29,001, representing an increase of 4.40% compared to yesterday’s value. Meanwhile, Ethereum’s price has increased by 2.40% on the day, while XRP gained 6.74% of its value.

Daily Crypto Sector Heat Map

Yearn Finance Passive Income gained 759.27% in the past 24 hours, making it the most prominent daily crypto gainer by far. It is followed by DragonVein’s 268.8% and Gala’s 146.76% gain. On the other hand, BitBall lost 63.32%, making it the most prominent daily loser. It is followed by MITH Cash’s loss of 63.25% and Blue Whale Exchange’s loss of 53.96%.

Top 10 24-hour Performers (Click to enlarge)

Bottom 10 24-hour Performers (Click to enlarge)

Bitcoin’s market dominance has moved up half a percent since our last report, with its value currently being 70.6%. This value represents a 0.5% difference to the upside than the value it had when we last reported.

Daily Crypto Market Cap Chart

The cryptocurrency sector capitalization has increased since we last reported, with its current value being $762.78 billion. This represents a $25.47 billion increase when compared to our previous report.

_______________________________________________________________________

What happened in the past 24 hours?

_______________________________________________________________________

_______________________________________________________________________

Technical analysis

_______________________________________________________________________

Bitcoin

Bitcoin has continued its move up on slightly higher volume, breaking its $28,600 resistance level and entering unexplored territory. The push ended with bull exhaustion at the $29,300 mark, creating a new all-time high.

Bitcoin’s price has hit this level twice in a short span of time, creating a double top and propelling BTC slightly backward. Its price is currently trading below $29,000, in a range bound by $28,600 to the downside and $29,300 to the upside.

Even though a move towards $30,000 is quite possible, many analysts have pointed to enormous sell walls at and around this level, making it extremely hard to breakthrough.

 BTC/USD 1-hour chart

Bitcoin’s technicals are showing a strong tilt towards the buy-side. However, its oscillators are tilting towards bearishness due to the overextended move to the upside.

BTC/USD 1-day Technicals

Technical factors (4-hour Chart):

  • Price is above its 50-period EMA and at its 21-period EMA
  • Price is near its middle Bollinger band
  • RSI is neutral (56.57)
  • Volume is slightly above average

Key levels to the upside          Key levels to the downside

1: $28,600                                 1: $28,391

2: $29,000                                 2: $25,512

3: $30,000                                 3: $24,696

Ethereum

Ethereum has sparked by Bitcoin’s push up, tried to break its most immediate resistance level of $747. While the second-largest cryptocurrency by market cap did manage to push through and reach $759 at one point, the bulls were not able to hold this level, which triggered a pullback below $747.

Ethereum is currently trading right below $747, with the 50-hour and 21-period 4-hour moving averages providing it support.

Ethereum is most likely in for a short-term correction as its volume is descending quickly after a failed attempt to tackle the upside.

 ETH/USD 1-hour Chart

Ethereum’s technicals look very much like Bitcoin’s, with the overall tilt being towards the buy-side, with oscillators tilting towards bearishness.

ETH/USD 1-day Technicals

Technical Factors (4-hour Chart):

  • Price is above its 50-period and at its 21-period EMA
  • Price is near its middle Bollinger band
  • RSI is neutral (50.10)
  • Volume is descending from above-average levels

Key levels to the upside          Key levels to the downside

1: $747                                     1: $675

2: $800                                     2: $653

3: $900                                      3: $632

Ripple

XRP gained over 5% on the day due to Bitcoin’s upwards-facing move pulling the market as a whole up. When looking at it from a technical standpoint, XRP managed to win the fight for $0.214, which is certainly a positive thing.

However, more bad news came out to the public, with even more exchanges suspending trading for XRP. Even though many analysts say that XRP is not a security, the sheer pressure that the SEC lawsuit exerts on the project caused almost every exchange and fund to distance themselves from Ripple and XRP, causing its price to crash.

 XRP/USD 1-hour Chart

XRP’s technicals on all time-frames are tilted towards the sell-side, with only the daily overview being completely bearish.

XRP/USD 1-day Technicals

Technical factors (4-hour Chart):

  • Its price is currently at its 50-period EMA and below its 21-period EMA
  • Price is at its middle Bollinger band
  • RSI is in the oversold territory (50.22)
  • Volume is currently on below-average levels

Key levels to the upside          Key levels to the downside

1: $0.25                                    1: $0.214

2: $0.30                                     2: $0.14

3: $0.358


Categories
Forex Market Analysis

Daily F.X. Analysis, December 31 – Top Trade Setups In Forex – U.S. Jobless Claims Ahead

On Thursday, the German banks will be closed in observance of New Year’s Eve since banks aid most foreign exchange volume. When they are closed, the market is less liquid, and speculators become a more dominant market influence. This can lead to both abnormally weak and abnormally huge volatility. Later throughout the U.S. session, the U.S. unemployment claims will remain in highlights.

Economic Events to Watch Today  


EUR/USD – Daily Analysis

The EUR/USD pair was closed at 1.22998 after placing a high of 1.23099 and a low of 1.22454. EUR/USD pair rose for the 5th consecutive day on Wednesday and reached above 1.23000 level, its highest since April 2018 amid the broad-based U.S. dollar weakness. The reports that the U.S. Senate has delayed a decision on increasing the coronavirus relief checks added pressure on the U.S. dollar. The Republican Senator Mitch McConnell blocked a move by colleague Bernie Sanders to allow a vote on increasing stimulus checks from $600 to $2000. However, Treasury Secretary Steve Mnuchin announced that direct payments of $600 would be out as soon as this week.

Despite a delay in the vote on the increase in the stimulus checks, the greenback dropped as investors were hopeful that the Senate would approve the rise in stimulus checks. The declining U.S. dollar added strength to the rising EUR/USD pair. On the data front, at 13:00 GMT, Spanish Flash CPI for the year dropped to -0.5% against the expected -0.6% and supported Euro that added additional gains in EUR/USD pair. From the U.S. side, at 18:30 GMT, the Goods Trade Balance from November fell to -84.8B against the projected -81.5B and weighed on the U.S. dollar that added further gains in EUR/USD pair. The Prelim Wholesale Inventories from November also fell to -0.1% against the projected 0.7% and supported the U.S. dollar. At 19:45 GMT, Chicago PMI in December surged to 59.5 against the projected 56.6 and supported the U.S. dollar. At 20:00 GMT, the Pending Home Sales from November fell to -2.6% against the projected 0.1% and weighed on the U.S. dollar that ultimately added gains in EUR/USD pair.

Furthermore, the risk-sensitive EUR/USD pair was also supported by the rising risk sentiment in the market after Britain approved another vaccine made by AstraZeneca and Oxford University. On Wednesday, Britain became the first country to approve the emergency use authorization of a vaccine developed by AstraZeneca and the University of Oxford that offers a 90% efficacy rate with the second vaccine shot.

The news about another vaccine available for use to control the coronavirus’s spread and in cheap amounts gave hopes that the global economic recovery process will speed up. These hopes raised the risk sentiment in the market and supported the currency pair EUR/USD on Wednesday.

Meanwhile, the optimism surrounding the Brexit deal also kept the EUR/USD pair on the upside on Wednesday. However, the EUR/USD pair’s gains remain limited throughout the day as the new variant of coronavirus that was originally discovered in the U.K. reached almost eight European Union nations. This urged E.U. nations to start mass vaccination to control the spread of the virus whereas, Spain was set to register people who refuse to be vaccinated against coronavirus and share it with European Union nations.

Daily Technical Levels

Support Resistance

1.2210    1.2279

1.2175    1.2311

1.2142    1.2347

Pivot point: 1.2243

EUR/USD– Trading Tip

The EURUSD continues to trade with a bullish bias after violating the ascending triangle pattern, extending resistance at the 1.2265 level. Above this, the odds of bullish trend continuation remains pretty solid. On the higher side, the pair may find resistance at 1.2308, and a bullish breakout of 1.2308 can lead its price towards the 1.2340 level. Bullish bias dominates today.

GBP/USD – Daily Analysis

The GBP/USD pair was closed at 1.36245 after a high of 1.36255 and a low of 1.34888. The British Pound to U.S. Dollar exchange rate climbed to weekly highs as the U.K. Parliament voted for the Brexit trade deal. Barely 24 hours before the U.K.’s final split from the European Union, Prime Minister Boris Johnson’s post-Brexit trade deal won approval from the U.K. Parliament. The agreement earlier crossed the House of Commons with 521 votes in favor of 73 opposing it. The Scottish National Party (SNP) was against the bills while stating that it will harm Scotland’s fishing industry and told PM Johnson that it would bolster the case for independence.

The Sterling got support from the Brexit deal’s approval in the U.K. Parliament and supported the GBP/USD currency pair on Wednesday. At the same time, the U.K. has ordered 100 million doses of the new vaccine that will be enough to vaccinate most of the population. On Wednesday, the U.K. regulatory approved the emergency use authorization to the vaccine of AstraZeneca and Oxford University that is said to offer 90% efficacy against coronavirus with the second vaccine shot. 

On Tuesday, the U.K. reported a record increase in new infections of over 50,000, the largest daily increase since the pandemic began. THE British Prime Minister Boris Johnson has approved placing more parts of the country into tier-4 restrictions as the country was fighting against the new variant of coronavirus, which scientists have warned that could spread more rapidly.

In parts of Southwest England and Cumbria, the ministers were considering imposing the toughest measures to control the spread of a new variant of coronavirus. Johnson announced that a further 20 million people in England will join the toughest tier of coronavirus restrictions from Thursday. These negative developments could not reverse the GBP/USD pair’s movement on Wednesday, and the pair continued increasing for the second consecutive day.

On the data front, at 11:57 GMT, the Nationwide HPI in December came in as 0.8% against the expected 0.4% and supported British Pound, and pushed the pair GBP/USD higher. From the U.S. side, at 18:30 GMT, the Goods Trade Balance from November decreased to -84.8B against the anticipated -81.5B and weighed on the U.S. dollar that added gains in GBP/USD pair. The Prelim Wholesale Inventories from November also decreased to -0.1% against the anticipated 0.7% and supported the U.S. dollar. At 19:45 GMT, Chicago PMI in December surged to 59.5 against the anticipated 56.6 and supported the U.S. dollar. At 20:00 GMT, the Pending Home Sales from November decreased to -2.6% against the anticipated0.1% and weighed on the U.S. dollar that ultimately added further gains in GBP/USD pair.

The U.S. dollar weakness was driven by the hopes that the increase in stimulus checks will be passed in the Senate even though they have delayed the decision. This weakness of the U.S. dollar kept the GBP/USD pair higher on board on Wednesday.

Daily Technical Levels

Support Resistance

1.3456    1.3533

1.3413    1.3567

1.3379    1.3611

Pivot Point: 1.3490

GBP/USD– Trading Tip

The GBP/USD pair has also violated the resistance level of 1.3617 level, and on the higher side, the next target remains at the 1.3698 level. On the lower side, the GBP/USD pair may find support at the 1.3617 level for now. We can expect a continuation of an upward trend in the Sterling today.

USD/JPY – Daily Analysis

The USD/JPY pair was closed at 103.207 after placing a high of 103.591 and a low of 102.959. USD/JPY pair extended its losses on Wednesday amid the declining U.S. dollar despite the market’s rising risk sentiment. The USD/JPY pair fell to its fresh weekly lowest level below 103.00 level on Wednesday as the greenback was very weak across the board against its rival currencies. The U.S. Dollar Index that measures the value of the U.S. dollar against the basket of six major currencies fell to its lowest level for almost three years below 89.52 on Wednesday.

The U.S. Senate delayed its decision on increasing the number of stimulus checks from$600 to $2000 as the Republican Senator Mitch McConnell blocked a move by colleague Bernie Sanders to allow a vote on increasing stimulus checks. Treasury Secretary Steve Mnuchin has announced that direct payments of $600 would be out as soon as this week. Investors were hopeful that the rise in stimulus checks will be accepted by Senate and continued selling the U.S. dollar on Wednesday that ultimately weighed on the currency pair USD/JPY and dragged the pair towards fresh weekly lowest level.

On the data front, at 18:30 GMT, the Goods Trade Balance from November declined to -84.8B against the estimated-81.5B and weighed on the U.S. dollar that dragged the currency pair USD/JPY on the downside. The Prelim Wholesale Inventories from November also dropped to -0.1% against the estimated 0.7% and supported the U.S. dollar. At 19:45 GMT, Chicago PMI in December raised to 59.5 against the estimated 56.6 and supported the U.S. dollar. At 20:00 GMT, the Pending Home Sales from November dropped to -2.6% against the estimated 0.1% and weighed on the U.S. dollar, increasing the USD/JPY pair’s losses.

Furthermore, the market’s risk sentiment was also improved after Great Britain became the first country to approve the vaccine by AstraZeneca and the University of Oxford for emergency use. This vaccine is said to provide 625 efficacy against coronavirus in the first shot that could be increased to 90% in the second shot. After this news, the hopes for economic recovery took their pace as a cheaper vaccine will be wildly available and help control the loss caused by the coronavirus pandemic. This news raised the market’s risk sentiment and added weight on the safe-haven Japanese Yen that ultimately capped further losses in the USD/JPY pair on Wednesday.

The main driver of the currency pair USD/JPY remained the sell-off in the U.S. dollar amid the rising hopes for an increase in stimulus checks the amount, and it will remain at the mercy of the U.S. dollar for a while as there will be no macroeconomic release from Japanese side until next week.

Daily Technical Levels

Support Resistance

103.39    103.78

103.23    104.01

103.01    104.17

Pivot point: 103.62

USD/JPY – Trading Tips

The USD/JPY violates the sideways range at the 103.500 level. It was a support level extended by an ascending triangle pattern that has already been violated. On the 2 hour timeframe, the USD/JPY pair is gaining support at 103.003 and 102.750 levels along with a resistance level of 103.575, which is extended by a triangle pattern that got violated. The pair is now closing a doji candle over 103.260 support level that suggests odds of bullish correction. On the higher side, the pair can lead towards the 103.575 level and then offer us a sell trade. Let’s brace for it. Good luck!

Categories
Forex Market Analysis

Daily F.X. Analysis, December 30 – Top Trade Setups In Forex – U.S. Trade Balance Ahead! 

The eyes will remain on the Spanish Flash CPI y/y, the U.S. Chicago PMI, and Pending Home Sales m/m figures on the news side. However, these are low impact events and may not drive sharp moves in the market.

Economic Events to Watch Today  

EUR/USD – Daily Analysis

The EUR/USD pair was closed at 1.22489 after placing a high of 1.22748 and a low of 1.22066. EUR/USD currency pair raised on Tuesday for the 4th consecutive day as the U.S. dollar was weak across the board and risk sentiment was high. The European stocks closed higher on Tuesday following a rally on Wall Street in the previous session. The pan-European Stoxx600 indexes ended up 0.76%, with most sectors in the positive territory. The rally has improved the European sentiment in U.S. stocks on Monday that came in after President Donald Trump signed a $900 billion coronavirus relief package into law; the measure will include direct payment to most Americans by $600.

Previously, Trump has demanded a $2000 direct payment days before the signing. On Monday, the House of Representatives voted to increase the second round of direct federal payments to $2000 and left it up to the GOP-controlled Senate. After this, the U.S. stocks rallied and continued rising till Tuesday morning. This pressured on the U.S. dollar ultimately added in the EUR/USD pair’s upward direction on Tuesday.

However, the positive sentiment in Europe came after the Brexit trade deal was secured between the E.U. and U.K. on Christmas Eve. Following this, London’s FTSE100 index rose by 2% on Tuesday. On Monday, the 27 ambassadors from the European Union member nations formally accepted the deal implemented on January 1. This news also supported the upward momentum in the currency pair EUR/USD pair on Tuesday.

Meanwhile, on Tuesday, the European Commission President Ursula von der Leyen said that the European Union would buy an extra 100 million doses of Pfizer and BioNTech’s coronavirus vaccine to bring the total from the two firms to 300 million doses.

She tweeted that they had decided to take an additional 100 million doses of the Pfizer/BionTech vaccine that has already being used to vaccinate people across the E.U. After some of the vaccine contestants organized by the E.U, this plan came in after some of the vaccine candidates faced unexpected delays in clinical trials that forced the bloc and other wealthy nations to rely on shots from fewer manufacturers than initially planned.

The E.U. officials said that the two firms have committed to rapidly deliver 200 million doses after regulatory approval for 15.5 euros per piece. The extra 100 million will be delivered at the same price, but the timetable will be negotiated as they will be delivered in 2021. The E.U.’s goal to roll out vaccine at the mass level also supported the local currency Euro and supported the upward momentum in EUR/USD pair.

The risk sentiment in the market driven by the vaccine rollout, U.S. stimulus, and the Brexit optimism also kept pushing the pair EUR.USD even higher on the board on Tuesday. Moreover, on the data front, at 19:00 GMT, the S&P/CS Composite -20 HPI for the year from the U.S. rose to 7.9% in October from the expected 7.0% and supported the U.S. dollar that capped further upside in the EUR/USD prices.

Daily Technical Levels

Support   Resistance

1.2210     1.2279

1.2175     1.2311

1.2142     1.2347

Pivot point: 1.2243

EUR/USD– Trading Tip

The EURUSD has violated the ascending triangle pattern, which was extending resistance at 1.2265 level, and above this, the odds of bullish trend continuation remain pretty stable. On the lower side, the support stays at the 1.2266 level, and the continuation of an upward trend can lead the pair towards the next resistance level of 1.2317. A slight downward retracement can be expected before a further upward trend.


GBP/USD – Daily Analysis

The GBP/USD pair was closed at 1.35009 after placing a high of 1.35225 and a low of 1.34405. The GBP/USD pair raised on Tuesday despite the rising number of coronavirus cases in the U.K. amid the Brexit development and improved risk sentiment.

The GBP/USD pair was supported on Tuesday from the rising risk sentiment in the market due to more optimistic news from the vaccine front. The U.K. has covered the way for widespread vaccinations with a homegrown shot that will be less expensive and easier to transport and store than other vaccines. For this purpose, the vaccines developed by the University of Oxford and AstraZeneca were set to get approval from the U.K. for emergency use authorization.

The U.K. drug regulator, the Medicines and Health products Regulatory Agency, will imminently authorize the AstraZeneca and Oxford University vaccine for emergency use within days to control the spread of coronavirus in the country. The vaccine’s efficacy rate is 90% after taking two doses, as one dose will provide only 62% efficacy against the coronavirus. Approving another vaccine will help the U.K. government battle against the coronavirus pandemic and lift the severe social distancing restrictions put in place before Christmas.

The new coronavirus cases in the U.K. on Tuesday were recorded as 53,135, and a health regulator of the country has said that the rise in coronavirus cases in the U.K. was of extreme concern. The Health Secretary has announced that the NHS was facing unprecedented pressures as hospitals in England and Wales were treating more coronavirus patients than at the peak of the first wave in April.

On the Brexit front, four days after sealing a free trade agreement with the European Union, the British government warned businesses to get ready for disruptions and bumpy moments when the new rules affect Thursday night. On Monday, the Businesses were scrambling to digest the details and implications of the 1240 page deal sealed between the U.K. and the E.U. on Christmas Eve. Meanwhile, E.U. ambassadors gave their unanimous approval on Monday to the Brexit trade deal with the U.K. However, the deal still needs approval from the E.U. legislature that is expected to come in February. At the same time, the U.K.’s House of Commons is expected to approve it on Wednesday.

After its approval by 27 E.U. ambassadors, the Brexit trade deal’s optimism gave support to British Pound that ultimately pushed the currency pair GBP/USD higher on the board despite the rising number of coronavirus cases in the country. Furthermore, the U.S. dollar was also weak across the board, which also helped the GBP/USD pair keep posting gains on Tuesday. Trump signed the second stimulus bill on Sunday that weighed heavily on local currency. Whereas, on the data front, at 19:00 GMT, the S&P/CS Composite -20 HPI for the year from the U.S. surged to 7.9% in October from the predicted 7.0% and supported the U.S. dollar that capped further gains in the GBP/USD prices on Tuesday.

Daily Technical Levels

Support   Resistance

1.3456     1.3533

1.3413     1.3567

1.3379     1.3611

Pivot point: 1.3490

GBP/USD– Trading Tip

The GBP/USD pair has also violated the resistance level of 1.3520 level, and on the higher side, the next target remains at the 1.3580 level. On the lower side, the GBP/USD pair may find support at the 1.3520 level now. We can expect a continuation of an upward trend in the Sterling today as the MACD and RSI suggest a bullish trend. Alongside, the GBP/USD pair may soar until the 1.3620 level today as the 50 EMA also extending bullish bias for the Cable.


USD/JPY – Daily Analysis

The USD/JPY pair was closed at 103.530 after placing a high of 103.824 and a low of 103.461. After posting gains for two consecutive days, USD/JPY dropped and posted losses on Tuesday amid the broad-based U.S. dollar weakness despite the risk sentiment. The U.S. Dollar was weak on Tuesday as investors were hopeful that Senate would pass the additional $1400 in stimulus paychecks. The greenback that measures the value of the U.S. dollar against the basket of six currencies was down by 0.24% on Tuesday and weighed on the USD/JPY pair.

The House of Representatives approved the rise in the amount of the stimulus checks from $600 to $2000 earlier in the week. Now the eyes have turned to Senate, where the Majority Leader Mitch McConnell moved to block the rise in the amount on Tuesday. Whereas, U.S. President Donald Trump has urged him to approve the increase in the number of stimulus paychecks.

The greenback has seen steady losses since U.S. President Donald Trump has signed the $2.3 trillion coronaviruses and spending bill on Sunday. Investors shifted from the U.S. dollar immediately after as more stimulus prospects reduced the demand for safe-haven assets. The country’s economic recovery was under threat as the U.S. continuously saw a large number of coronavirus cases, and it has increased the hopes for more fiscal stimulus measures from Congress. Hence, investors kept selling the U.S. dollar in hopes that the Senate could pass the increase in the number of stimulus checks at the last minute.

Furthermore, another reason behind the weakness of the U.S. dollar was that some investors warned that the dollar would fall further in 2021 as President-elect Joe Biden will roll out further stimulus measures. Biden and his administration will come into power on January 20. Despite the weakness of the U.S. dollar, the USD/JPY pair was also falling on the back of increasing figures of coronavirus cases in the U.S. There were also reports suggesting that the new variant of coronavirus first discovered in the U.K. has reached the U.S. The health officials in Colorado confirmed that the infected individual was held in isolation in Elbert Country and that the person was in his 20s and had no travel history.

This also raised the fears for global economic recovery and raised the safe-haven appeal that ultimately supported the safe-haven Japanese yen, and added the USD/JPY pair’s downward momentum on Tuesday.

Meanwhile, on the data front, at 19:00 GMT, the S&P/CS Composite -20 HPI for the year from the U.S. advanced to 7.9% in October from the anticipated 7.0% and supported the U.S. dollar that capped further losses in the USD/JPY prices on Tuesday.

On the other hand, the losses in USD/JPY pair were also capped by the reports that AstraZeneca and University of Oxford’s vaccine were set to receive approval from the U.K.’s regulatory for emergency use authorization. This resulted in improved risk sentiment and weighed on the Japanese Yen due to its safe-haven status and capped further losses in the USD/JPY pair on Tuesday.

Daily Technical Levels

Support   Resistance

103.39     103.78

103.23     104.01

103.01     104.17

Pivot point: 103.62

USD/JPY – Trading Tips

The USD/JPY violates the sideways range at the 103.500 level. It was a support level extended by an ascending triangle pattern that has already been violated. On the 2 hour timeframe, the USD/JPY pair is gaining support at 103.250 and 102.980 levels along with a resistance level of 103.575, which is extended by a triangle pattern that got violated. The pair is now closing a doji candle over 103.260 support level that suggests odds of bullish correction. On the higher side, the pair can lead towards the 103.575 level and then offer us a sell trade. Let’s brace for it. Good luck!

Categories
Forex Course

199. Effects Of Gold On AUD/USD & USD/CHF Currency Pairs

Introduction

Gold is among the most traded commodities globally due to the good intrinsic value of this asset. Considering that Gold is less impacted by uncertain conditions, its prices rise when other economies perform badly and fall when there is an economic boom.

Gold impacts AUD/USD and USD/CHF in opposite manners. Price fluctuations in Gold primarily impact three major currencies that include AUD, USD, and CHF. Let’s discuss how Gold affects AUD/USD and USD/CHF.

The Effect of Gold in AUD/USD

When the price of gold rises, the AUD/USD will move upwards. These two aspects share a positive correlation; most of the time, they move together. An increase in the U.S. dollar generally contributes to the gold prices to fall and vice versa. The price of Gold perfectly depicts the economic health of the country.

During an economic crisis in the country, investors purchase Gold as protection from inflation or an economic crisis. But the inner value of the Gold does not change whether or not there is a crisis. Furthermore, gold value is displayed in the dollar, meaning every gold transaction, you spend/receive a dollar.

Australia’s Economy and its Impact on Gold Prices

AUD and Gold share a positive relationship and are inversely related to the USD. If the gold price rises, the Australian exports will increase, resulting in the expansion of the economy and foreign investment. When the gold price increases, the AUD/USD will move upwards because of the increasing demand for the AUD.

Impact on the USD/CHF

The Switzerland currency holds a positive correlation with Gold. This is because 25% of CHF is supported by the gold reserves. The refineries in Switzerland also process 70% unrefined gold every year. Additionally, Gold and CHF are inflation hedging during uncertain times.

Therefore, when the price of gold increases, the CHF value also appreciates or increases, vice-versa. Gold has a positive relationship with CHF and an inverse relationship with USD/CHF. When the price of gold rises, the value of USD/CHF falls down and vice-versa.

[wp_quiz id=”97481″]
Categories
Crypto Market Analysis

Daily Crypto Review, Dec 29 – XRP Trading Suspended by Coinbase and OKEx, Causing a 22% Price Dip

The cryptocurrency sector had is currently in a consolidation phase as Bitcoin fell below $27,000. Bitcoin is currently trading for $26,624, representing a decrease of 1.13% compared to yesterday’s value. Meanwhile, Ethereum’s price has decreased by 2.56% on the day, while XRP had another major dip, losing 19.42% of its value.

 Daily Crypto Sector Heat Map

Ethereum Lightning gained 1097.36% in the past 24 hours, making it the most prominent daily crypto gainer by far. It is followed by N3RD Finance’s 94.18% and Matrix AI Network’s 86.08% gain. On the other hand, COVER Protocol lost 97.97%, making it the most prominent daily loser. It is followed by Encryptgen’s loss of 91.18% and Mining Core Coin’s loss of 69.41%.

Top 10 24-hour Performers (Click to enlarge)

Bottom 10 24-hour Performers (Click to enlarge)

Bitcoin’s market dominance has moved up slightly since our last report, with its value currently being 69.2%. This value represents a 0.1% difference to the upside than the value it had when we last reported.

Daily Crypto Market Cap Chart

The cryptocurrency sector capitalization has decreased slightly since we last reported, with its current value being $712.73 billion. This represents an $8.45 billion decrease when compared to our previous report.

_______________________________________________________________________

What happened in the past 24 hours?

_______________________________________________________________________

_______________________________________________________________________

Technical analysis

_______________________________________________________________________

Bitcoin

Ever since it hit the $28,391 all-time high, Bitcoin has been trading in a sideways manner. Its price is currently within a large channel, bound by $25,512 to the downside and the aforementioned all-time high to the upside.

The descending volume alongside sideways trading was never a long-term occurrence with Bitcoin, but rather good indicators of a new explosive move ahead.

Bitcoin traders should be mindful of any volume spikes when trading, and should look for smaller time-frame Fib retracements if they want to be more precise with setting their support and resistance levels.

BTC/USD 1-hour chart

Bitcoin’s technicals on both short-term and long-term time-frames are completely bullish and show close to no signs of neutrality or bearishness.

BTC/USD 1-day Technicals

Technical factors (4-hour Chart):
  • Price is above its 50-period EMA and at its 21-period EMA
  • Price is at its middle Bollinger band
  • RSI is neutral (55.72)
  • Volume is slightly above average, but descending
Key levels to the upside          Key levels to the downside

1: $28,391                                 1: $25,512

2: $29,000                                 2: $24,696

3: $30,000                                  3: $24,315

Ethereum

Ethereum’s move towards the upside ended at $747, prompting a pullback. However, while many analysts believed that Ether would not keep its price above $700, that’s exactly what happened.

Ethereum’s signature trading move has occurred once again, with that move being: pushing up, then pulling back, and breaking the 21-hour moving average to the downside, only to find support at the 50-hour moving average and push back up. Knowing how Ethereum moves alongside watching Bitcoin’s moves is one of the safest ways to trade cryptocurrencies at the moment, as the moves have pre-determined stop-losses and targets.


ETH/USD 1-hour Chart

Ethereum’s shorter time-frames are completely bullish and show no signs of neutrality or bearishness, while its longer-time frames have some neutrality present alongside the overall bullishness.

ETH/USD 1-day Technicals

Technical Factors (4-hour Chart):
  • Price is above both its 50-period and its 21-period EMA
  • Price is above its middle Bollinger band
  • RSI is neutral (59.39)
  • Volume is trading on above-average levels
Key levels to the upside          Key levels to the downside

1: $747                                     1: $675

2: $800                                     2: $653 

3: $900                                      3: $632

Ripple

XRP has experienced another extremely bad day, as its price dropped more than 22% on the day. The move came as a result of two major exchanges, OKEx and Coinbase, dropping support for XRP due to the pending lawsuit against its company, Ripple, as well as Ripple’s executives.

Trading XRP is extremely risky at the moment due to price fluctuations that are a result of news rather than technical formations.

XRP/USD 1-hour Chart

XRP’s technicals on all time-frames are tilted towards the sell-side, with all of them showing slight signs of neutrality.

XRP/USD 1-day Technicals

Technical factors (4-hour Chart):
  • Its price is currently far below both its 50-period EMA and its 21-period EMA
  • Price is at its bottom Bollinger band
  • RSI is in the oversold territory (28.88)
  • Volume has spiked to above-average levels
Key levels to the upside          Key levels to the downside

1: $0.25                                    1: $0.214

2: $0.30                                     2: $0.14

3: $0.358 

Categories
Forex Fundamental Analysis

EUR/AUD Global Macro Analysis – Part 3

EUR/AUD Exogenous Analysis

  • The EU and Australia Current Account to GDP differential

The current account to GDP shows the percentage of a country’s international trade that makes up the GDP. Countries with higher current account surplus have a higher current account to GDP ratio while those running deficits have a negative current account to GDP ratio.

In this case, if the GDP differential is positive, it means that the exchange rate for the EUR/AUD pair will increase. But if the differential is negative, then the exchange rate for the pair will drop.

In 2020, the current account to GDP ratio in the EU is expected to hit 3.4% and -1.5% in Australia. Thus, the current account to GDP differential is 4.9%. We assign a score of 3.

Typically, investors put their money into financial instruments that offer higher interest rates. Therefore, the country with a higher interest rate should be expected to have more inflow of funds than that with a lower interest rate. Note that when foreign investors invest in the local economy, they have to convert their money into the domestic currency. This conversion increases the demand for the domestic currency in the forex market hence increasing its value.

In forex trading, if the EUR/AUD pair has a positive interest rate differential, it means that the exchange rate of the pair will increase. Conversely, a negative interest rate differential implies that the pair has a bearish outlook.

In 2020, the Reserve Bank of Australia cut the cash rate from 0.75% to 0.1%, while the ECB has maintained interest rates at 0%. Therefore, the interest rate differential for the EUR/AUD pair is -0.1%. We assign a score of -3.

  • The EU and Australia Growth Rate differential

In any economy, the value of the domestic currency is mostly determined by the growth of the local economy. Therefore, a country whose economy is growing faster will see its domestic currency appreciate faster.

If the growth rate differential is negative for the EUR/AUD pair, we can expect a bearish outlook. If it is positive, it implies that the exchange rate for the pair will rise.

For the first three quarters of 2020, the Australian economy contracted by 4% and the EU economy by 2.9%. The GDP growth differential is 1.1%. We assign a score of 2.

Conclusion

The EUR/AUD exogenous factors have a score of 2. If the conditions observed in the exogenous factors persist, we can expect that the pair will adopt a bullish trend in the short-term.

The technical analysis of the EUR/AUD shows the weekly price chart bouncing off the oversold region of the lower Bollinger bands. More so, the pair is still trading above the 200-period MA. All the best.

Categories
Forex Fundamental Analysis

EUR/AUD Global Macro Analysis – Part 1 & 2

Introduction

Global macro analysis of the EUR/AUD pair will focus on the endogenous analysis of fundamental factors driving economic growth in the EU and Australia. It will also involve exogenous analysis that will focus on factors that influence the EUR/AUD pair’s exchange rate.

Ranking Scale

This analysis will assign a score between -10 and +10, depending on the endogenous and exogenous factors’ impact.

A negative score for the endogenous factors means that the local currency shed some value. When positive, it means that the domestic currency has appreciated. The endogenous score is determined through correlation analysis between the endogenous factors and the GDP growth rate.

On the other hand, when the exogenous factors have a negative score, it means that the exchange rate between the EUR and the AUD will drop. A positive score means that the exchange rate will rise. The exogenous score is determined via a correlation analysis between the exogenous factors and the EUR/AUD pair’s exchange rate.

EUR Endogenous Analysis – Summary

The endogenous analysis of the EUR has an overall score of -3. Based on the factors we have analyzed, we can expect that the Euro has marginally depreciated in 2020.

AUD Endogenous Analysis – Summary

As you can see in the below image, according to the Endogenous Indicators of AUD, we can conclude that this currency has depreciated as well in 2020.

The employment change in Australia tracks the monthly number of people who are gainfully employed or engaged in unpaid work. The fluctuation in the number of those employed on a full-time or parttime basis helps to show economic growth.

Between September and October 2020, the number of those employed in Australia increased by 178,800. This shows that the economy is recovering and adding more jobs to the labor market. However, from January to October, the Australian labor market has lost about 190,100 jobs. Hence, we assign a score of -6.

  • Australia GDP Deflator

The GDP deflator measures the overall inflation for the economy. It is a comprehensive measure of inflation rate compared to other measures since it accounts for the changes in the prices of all goods and services produced within Australia. Changes in the prices often correspond to changes in economic growth.

In the third quarter of 2020, the Australia GDP deflator rose to 102.03 points from 101.64 in Q2. Up to Q3, the GDP deflator in Australia has dropped by 0.07 points. We assign a score of -2.

  • Australia Industrial Production

Industrial production measures the quarterly changes in output from the manufacturing sector, utilities, and mining. Note that the Australian economy is heavily dependent on commodity exports, which means that industrial production changes significantly impact economic growth.

In Q2, the industrial production in Australia dropped by 3.3%, while the YoY Q3 industrial production dropped by 2.02%. The drop in Q2 is the largest quarterly drop in over 25 years. We assign a score of -6.

  • Australia Manufacturing PMI

This PMI is from a survey of companies operating in the industrial sector. The index shows whether the manufacturing sector in Australia is expanding or contracting. In Australia, the Ai Group surveys the changes in new orders, employment, inventory, output prices, and production levels. When the index is above 50, it means that the manufacturing sector is expanding and contracting when it’s below 50.

In November 2020, the AIG Australian manufacturing PMI dropped to 52.1 from 56.3 in October. Despite the drop, the Australian manufacturing PMI points to growth in the industrial sector. Hence, we assign a score of 6.

  • Australia Retail Sales

The retail sales data in Australia tracks the monthly change of the consumer expenditure on goods and services. Consumer goods include items of clothing and footwear, food, and household items. Purchases made in restaurants, departmental stores, and hotel services and deliveries are also included as retail sales.

In October 2020, the MoM retail sales increased by 1.4% from a 1.1% drop in September. In 2020, the average MoM retail sales have grown by 0.97%. We assign a score of 2.

  • Australia Consumer Confidence

The Melbourne Institute and Westpac Bank survey about 1200 households in Australia and constructs the consumer confidence index. The index is based on households’ evaluation of their financial condition for the preceding year and in the next 12 months. It also includes their economic expectations in the next one and five years. When the index is above 100, it shows that households are optimistic and pessimistic if the index is below 100. Note that consumer confidence about their finances and the economy determines their level of expenditure; hence, it drives the rate of GDP growth.

In December 2020, consumer confidence in Australia rose to 112 from 107.7 in November, which is the highest in over ten years. We assign a score of 5.

  • Australia Government Debt to GDP

The government debt to GDP determines the ability of the economy to service its debts. It also impacts the ability of the government to take on more debt to advance an economic agenda. A debt level of below 60% of the GDP is preferable since it ensures that the government can take on more debt without over-leveraging the economy.

In 2019, the Australian government debt to GDP rose to 45.1% from 41.5% in 2018. In 2020, it is expected to reach 50% on account of increased government expenditure during the coronavirus pandemic. We assign a score of -3.

Please check our following article where we discuss the Exogenous analysis of the EUR/AUD Forex pair. Cheers.

Categories
Forex Course

198. The ‘Dollar Smile Theory’

Introduction

The U.S. Dollar Smile Theory is a popular notion that illustrates that the U.S. Dollar stays positive in good as well as bad market conditions. This theory was created by a former economist and strategist Morgan Stanley, and it became popular in 2007.

This was the time when the U.S. dollar witnessed a significant boost amidst the global recession. Many times, looking at the market conditions, people would think the U.S. dollar would fall, but surprisingly it continues to grow.


Source: here.

Why does that happen?

The Dollar Smile Theory answers this question.

Following are the three scenarios that Morgan Stanley put forward to explain the positive growth of the U.S. Dollar.

  • The Strength Due To Risk Aversion

The first reason that the U.S. dollar rise is due to risk aversion. This is a situation where investors rely more on safe-haven currencies such as the dollar, yen, etc. During this period, investors consider the global economy in an unstable position. Hence, they are less likely to invest in the risky asset; instead, they put their cash on U.S. dollars.

  • The Dollar Weakens to New Low – Economic Recession and Slowdown

Under this scenario, the US dollar falls to a new low. The bottom of the smile indicates the dull performance of the currency as the economy struggles with weak fundamentals. Additionally, the possibility of falling interest rates also impacts the position of the U.S. Dollar. This results in the market participants steering clear from the dollar.

Subsequently, the primary motto of the U.S. Dollar becomes to Sell. Investors move from buying the currency to selling it and moving towards currencies that are providing higher yields.

  • The Strength Of The U.S. Economy Helps

The U.S. dollar continues to grow because of the strong economy of the country. After the low, a new smile emerges as the economy sees its light at the end of the tunnel. With the signs of the recovery of the economy, a sense of optimism spreads through the market.

This increases the sentiments towards the dollar again. With the US economy enjoying higher GDP growth, the greenback continues to appreciate. This increases the interest rate in the international market.

Though the theory is quite relevant and backed by some logic, the economy is extremely volatile. So only time will tell how definite the Dollar Smile theory is in the future.

[wp_quiz id=”97467″]
Categories
Forex Market Analysis

Daily F.X. Analysis, December 29 – Top Trade Setups In Forex – Technical Levels in Play! 

On Tuesday, the market’s fundamental side is mostly muted as we don’t have any significant economic data scheduled from any economy. The S&P/CS Composite-20 HPI y/y will be released during the U.S. session; however, it’s low-impact and may not drive any major movement in the market today.

Economic Events to Watch Today  


EUR/USD – Daily Analysis

The EUR/USD pair was closed at 1.22142 after placing a high of 1.22501 and a low of 1.21809. EUR/USD pair posted gains on Monday; however, some of the gains were lost in the late trading session. On the first day of the new trading week, the EUR/USD pair moved on the upside on the back of a weak U.S. dollar and the rising risk sentiment in the market. The global risk sentiment remained well supported by the latest optimism over a last0-minute Brexit deal and got an additional boost after the U.S. President Donald Trump finally signed the $2.3 trillion pandemic aid and spending package.

On Sunday, U.S. President Donald Trump signed the bipartisan bill of $2.3 trillion packages, including $900 billion for stimulus checks and $1.4 trillion for government funding. Trump, who first called this bill a disgrace, signed the bill and made it legislation as the government was near to shut down. However, he urged the U.S. Congress to increase the stimulus check amount to $2000 from $600. Given his calls, the House of Representatives led by Democratic leaders approved the CASH Act on Monday. The Act was designed to support Trump’s decision to increase the stimulus checks. The House voted 275-134 on Monday to increase the proposed $600 payments to more than triple $2000 and send it to Senate.

All these developments in the U.S. stimulus measure raised the market’s risk sentiment that ultimately added strength in the risk perceived EUR/USD pair. Meanwhile, another reason behind the EUR/USD pair’s upward momentum was the sharp rise in European markets on Monday. At the start of the last trading week of 2020, the Brexit developments and the U.S. stimulus measure raised the risk sentiment that supported the European stocks to move higher levels added in the EUR/USD pair. France’s CAC40 rose by 1.3%, the Swiss SMI surged by 1.8%, and Germany’s DAX index finished up by 1.5% on Monday.

However, some of the EUR/USD pair gains in the late trading session on Monday were lost after the news of a new variant of coronavirus reaching eight European countries emerged. The more contagious variant of coronavirus identified in the U.K. has been confirmed to be reported in Spain, Switzerland, Sweden, and France. This spread of a new variant of coronavirus affected EUR/USD’s upward momentum by weighing on the local currency Euro, as fears for economic slowdown emerged again in the European countries.

Daily Technical Levels

Support   Resistance

1.2179     1.2249

1.2144     1.2286

1.2108     1.2320

Pivot Point: 1.2215

EUR/USD– Trading Tip

On Tuesday, the EUR/USD consolidating in a narrow trading range of 1.2259 – 1.2205. On the 2 hour timeframe, the EUR/USD has formed an ascending triangle pattern supporting the pair around 1.2204 and a resistance at 1.2259. The MACD and RSI have now shifted to the bullish zone, supporting a bullish trend in the EUR/USD pair. Additionally, the 50 periods EMA supports the pair at 1.2204, and it’s also expending bullish sentiment for the EUR/USD pair today. 


GBP/USD – Daily Analysis

The GBP/USD pair was closed at 1.34574 after a high of 1.35760 and a low of 1.34289. On Monday, the currency pair GBP/USD fell sharply as market participants showed concerns that the post-Brexit trade agreement will slow the trade after the crucial services sector was largely excluded from the deal. The mayor of French fishing port has warned that Thursday’s historic Brexit trade deal between the U.K. and E.U. still left the fishing sector with many key questions unanswered. The mayor of Boulogne-sur-Mer, Frederic Cuvillier, said that the agreement left French fishermen wondering how it will impact them once the festive season was over. 

The long-awaited agreement between the two parties was resolved after granting a five-year transition period over fisheries, after which E.U. fish captures ought to be reduced by 25%. The concession was given from the U.K., who has initially demanded 60% at the start of the negotiations. Furthermore, on financial services, the Brexit deal is said to go in favor of the E.U. According to Boris Johnson, the agreement on financial services has fallen short of U.K. hopes. He said that perhaps the financial sector did not go as far as the U.K. would like. After these comments, Rishi Sunak offered financial services firms the prospect of closer access to E.U. markets than outlined in the Brexit trade deal.

Sunak said that he hoped that a planned memorandum of understanding on this issue between the U.K. and E.U. would smooth over many obstacles in the next few months. However, all these tensions weighed on the local currency British Pound and dragged the GBP/USD pair to the downside.

Meanwhile, the U.K. reported its highest day of new coronavirus infections on Monday with 41,385 new COVID-19 cases. The surge was driven by the new variant of the virus that is more transmissible and has forced the hospitals to cancel non-urgent procedures and scramble to find the space. Even though the new variant does not appear to make people sicker, it is believed to be up to 70% more contagious, resulting in an increased number of coronavirus infections in the U.K.

The rising number of coronavirus in the country and its faster rate affected the local currency, as hopes for an economic recovery dampened and weighed on the GBP/USD pair. It was another reason behind the downward momentum of the GBP/USD pair on Monday. However, the pair’s losses were limited on Monday due to the weakness of the U.S. dollar. The greenback was weak across the board as the U.S. President Donald Trump has signed the new coronavirus relief bill, turning it into law on Sunday. 

Whereas, the House of Representatives, which is led by Democrats, held a vote on the CASH Act on Monday, approved the Act, and passed it to the Senate. According to CASH Act, the number of stimulus checks in the bipartisan bill of $600 will be increased to $2000 as demanded by U.S. President Donald Trump and supported by the House of Democrats.

All the U.S. stimulus relief bill developments weighed on the U.S. dollar and capped further losses in the GBP/USD pair on Monday in the absence of any macroeconomic data release.

Daily Technical Levels

Support   Resistance

1.3393     1.3541

1.3337     1.3633

1.3245     1.3689

Pivot point: 1.3485

GBP/USD– Trading Tip

The GBP/USD is trading at 1.3485, having supported over 1.3443 level. The support level is extended by an upward trendline on the two-hourly timeframes. The GBP/USD pair is likely to face resistance at the 1.3525 level, and a bullish crossover of 1.3525 level can drive Sterling’s price towards 1.3620. The bullish trendline is likely to support the pair today at the 1.3443 level, and violation of this can extend the selling trend until the 1.3343 level.     


USD/JPY – Daily Analysis

The USD/JPY pair closed at 103.778 after placing a high of 103.896 and a low of 103.402. The currency pair USD/JPY extended its gains on Monday and raised for the second consecutive day as the market’s risk sentiment increased. The risk-on market sentiment was driven by the latest decision of Donald Trump to sign the bipartisan stimulus bill of $2.3 trillion that he had initially refused to pass. 

The U.S. President Donald Trump turned the bill of $2.3 trillion, including $900 billion for pandemic aid and $1.4 trillion for spending package on Sunday as the government was near to shut down in less than 30 days. However, despite signing the bill, Donald Trump continued urging Congress to increase the number of stimulus checks from $600 per person to $2000. Followed by his calls, the House of Representatives with a Democratic majority approved the CASH Act on Monday to allow the rise in payment of stimulus checks demanded by Donald Trump. The CASH Act was approved by Democrats and sent to Senate for further proceedings.

This added in to the risk sentiment as it raised hopes for economic recovery in a depressing environment and weighed on the safe-haven Japanese Yen that ultimately added in the USD/JPY pair’s upward momentum on Monday. Furthermore, the Bank of Japan released the summary of opinions at the December rate review that showed that the B.O. policymakers were divided on how far to go in changing its stimulus program, with some calling for an overhaul of its strategy achieving 2% inflation. 

The Governor of the Bank of Japan, Haruhiko Kuroda, said that the policy review would not lead to big changes to yield curve control (YCC) instead of focusing on fine-tuning the framework to make it more sustainable. However, some BOJ board members called for a more ambitious review as the hit to grow from coronavirus stokes fears of a return to deflation. 

On the data front, at 04:50 GMT, the Prelim Industrial Production reduced to 0.0% against the forecasted 1.4% and weighed on the Japanese Yen that added gains in the USD/JPY pair. Meanwhile, the USD/JPY pair’s gains were limited on Monday as the U.S. dollar was weak across the board due to the second round of stimulus relief package issuance. The bill will restore unemployment benefits to millions of Americans and averted a partial federal government shutdown that would have begun on Thursday. It raised the risk sentiment and weighed on the U.S. dollar that ultimately capped further upside in the USD/JPY pair on Monday.

Daily Technical Levels

Support   Resistance

103.47     104.02

103.25     104.37

102.91     104.58

Pivot point: 103.81

USD/JPY – Trading Tips

The USD/JPY is trading sideways at the 103.700 level, supported by an ascending triangle pattern. On the 2 hour timeframe, the USD/JPY pair is gaining support at 103.600 and 103.400 levels along with a resistance level of 103.860, which is extended by a triple top pattern. The pair is now closing a series of doji and spinning top candles, suggesting neutral bias among investors. It’s common during such a timeframe of December as most of the traders are on holiday. Let’s consider taking a buy trade over 103.860 level and selling below the same as this level is of major importance today. Good luck! 

Categories
Forex Market Analysis

Daily F.X. Analysis, December 28 – Top Trade Setups In Forex – Boxing Day Holiday! 

Welcome back to a fresh week after a long weekend. I hope you had a fantastic Christmas. The global banks will be closed in observance of Boxing Day today; therefore, we may have thin volatility and trading volume today in the market. Let’s check out the technical side of the market. 


Economic Events to Watch Today  


EUR/USD – Daily Analysis

The EUR/USD succeeded in maintaining its overnight bullish bias and remained well bid around above the 1.2200 level. However, the currency pair’s sentiment was being supported by the latest progress over the massive U.S. government spending bill and COVID-19 relief measures, which undermined the safe-haven U.S. dollar and contributed to the currency pair gains. 

Moreover, the S&P 500 Futures sentiment was further bolstered by the recent passage of the Brexit deal and upbeat comments from the covid vaccine producers, which in turn, added further weakness to the greenback and contributed to the currency pair gains. In contrast to this, the intensifying concerns about increasing COVID-19 deaths and the possibility of economically-painful hard lockdowns keep questioning the pair’s upside momentum. As of writing, the EUR/USD currency pair is currently trading at 1.2226 and consolidating in the range between 1.2181 – 1.2227.

The S&P 500 Futures enter the 3,700 marks and refreshed intraday high near 3,710 during early Monday. The market trading sentiment recently gained bids after U.S. President Donald Trump signed the much-awaited coronavirus (COVID-19) aid package, which instantly boosted the investor’s confidence. As per the New York Post, President Trump has signed a $2.3 trillion COVID-19 relief and government funding bill that includes $600 stimulus checks for most Americans. The funding bill authorizes direct checks of $600 for people earning up to $75,000 per year. In addition to this, the bill creates a new $300 weekly unemployment supplement and replenishes a forgivable loan program for small businesses, while there’s an additional $600 per child stimulus payment. This latest optimism put a bid under risk assets and weighed over the safe-haven U.S. dollar. 

Elsewhere, the gains in the currency pair were further bolstered after the passage of the Brexit deal and upbeat remarks from the covid vaccine makers. As per the latest report, the U.K.’s Foreign Secretary Dominic Raab said that the United Kingdom is now seeking trade deals with Australia, the United States, and countries in the Indo-Pacific region.” Across the pond, the AstraZeneca CEO Pascal Soriot said that their covid vaccine is effective against the new strain, which in turn exerted an additional positive impact on the market trading sentiment and contributed to the currency pair gains.

Looking ahead, the market traders will keep their eyes only on updates surrounding the virus, vaccine, and the U.S. stimulus package. However, the global markets may witness a dull trading session amid the year-end celebration mood and off at major bourses. 

Daily Technical Levels

Support Resistance

1.2143 1.2231

1.2090 1.2266

1.2055 1.2320

Pivot point: 1.2178

EUR/USD– Trading Tip

The EUR/USD is trading with a bullish bias at the 1.2224 area, having crossed over the triple top resistance level of 1.2200, now working as a support for the EUR/USD. Continuation of an upward trend can extend the buying trend until the 1.2250 level. The EUR/USD pair violates the symmetric triangle pattern, which is likely to drive further upward movement in the market. Bullish bias seems dominant today.

GBP/USD – Daily Analysis

The GBP/USD currency pair managed to maintain its bullish bias through the first half of the Asian session and remained bullish around above the mid-1.3500 level due to the prevalent risk-on market sentiment, which tends to undermine the safe-haven U.S. dollar and contributes to the currency pair gains. Hence the market trading sentiment was supported by the hopes of coronavirus vaccine and progress toward a massive U.S. government spending bill and COVID-19 relief measures. 

On the contrary, the currency pair trimmed some of its sharp gains during Monday’s European session as the renewed uncertainties over the future of the recently signed Brexit deal tend to undermine the British Pound even as markets are off in the U.K. Furthermore, the currency pair’s gains were also capped by the growing market concerns about the continuous rise in new coronavirus cases and the enforcement of fresh restrictions in the U.K. As of writing, the GBP/USD currency pair is currently trading at 1.3561 and consolidating in the range between 1.3530 – 1.3576.

Despite the recent passage of the Brexit deal, the doubts over the key issues like the level Playing Field, Finance, and Gibraltar remain on the cards as the U.K. Prime Minister Boris Johnson has admitted it is an agreement which does not have as much as he would have liked about the financial services sector and regulatory equivalence. He further added that this agreement would give the people hope that we will remain in close dialogue with our European partners regarding things like equivalence decisions. In that way, the uncertainties over the recently signed Brexit deal’s future exerted downside pressure on the GBP/USD currency pair.

Despite this, the S&P 500 Futures managed to extend its previous session’s positive performance and refreshed intraday high near 3,710 during the early European session on the day. The market trading sentiment recently gained bids after U.S. President Donald Trump signed the much-awaited coronavirus (COVID-19) aid package, which instantly boosted the investor’s confidence. As per the New York Post, President Trump has signed a $2.3 trillion COVID-19 relief and government funding bill that includes $600 stimulus checks for most Americans. The funding bill authorizes direct reviews of $600 for people earning up to $75,000 per year. 

In addition to this, the bill creates a new $300 weekly unemployment supplement and replenishes a forgivable loan program for small businesses, while there’s an additional $600 per child stimulus payment. This latest optimism put a bid under risk assets and weighed over the safe-haven U.S. dollar. 

Looking ahead, the market traders will keep their eyes only on updates surrounding the virus, vaccine, and the U.S. stimulus package as the global markets witnessing a dull trading session amid the year-end celebration mood and off at significant bourses. 

Daily Technical Levels

Support Resistance

1.3442 1.3562

1.3378 1.3618 

1.3322 1.3683

Pivot point: 1.3498

GBP/USD– Trading Tip

The Sterling is trading with a bullish bias at 1.376 level, heading further higher towards the next resistance level of 1.3650 level. Support stays at 1.3495 level today. This support level is extended by an upward trendline, which can be seen in the 4-hour timeframe. On the higher side, the GBP/USD pair can prolong the buying trend unto the 1.3622 level, and the bullish trend continuation can lead the GBP/USD pair towards the 1.3706 mark. 

USD/JPY – Daily Analysis

The USD/JPY failed to stop its previous-session bearish bias and remained depressed around below the 103.50 level, mainly due to the broad-based U.S. dollar weakness. The fresh optimism was pressuring the U.S. dollar that the U.S. President Donald Trump signed a $2.3 trillion COVID-19 relief and government funding bill, urging investors to retreat from the safe-haven investment riskier assets. Apart from this, the losses in the U.S. dollar could also be attributed to the lingering doubts over the U.S. economic recovery from COVID-1, which adds further burden around the U.S. dollar and contributes to the currency pair losses. 

The upbeat market sentiment, backed by the hopes of coronavirus vaccine and the U.S. covid stimulus, boosted investors’ confidence and undermined the safe-haven Japanese yen, which, in turn, was seen as one of the leading factors that helped the USD/JPY currency pair to limit its deeper losses.

Despite the worries over the coronavirus pandemic’s resurgence, the optimism over a possible vaccine for the highly infectious coronavirus disease has remained supportive of the market risk tone. Also favoring the optimism could be the recent comments from the covid vaccine producers. As per the keywords, AstraZeneca CEO Pascal Soriot said that their covid vaccine is effective against the new strain. Thus, the risk-on market mood tends to undermine the safe-haven Japanese yen, which becomes the key factor that lends some support to the currency pair to ease the intraday bearish pressure surrounding the USD/JPY currency pair.

In addition to this, the sentiment around the equity market was improved further after U.S. President Donald Trump signed a $2.3 trillion COVID-19 relief and government funding bill. It is worth noted that U.S. President Trump had signed a $2.3 trillion COVID-19 relief and government funding bill that includes $600 stimulus checks for most Americans. The funding bill authorizes direct reviews of $600 for people earning up to $75,000 per year. Furthermore, the bill creates a new $300 weekly unemployment supplement and provides a forgivable loan program for small businesses. Besides this, there’s an additional $600 per child stimulus payment. 

This, in turn, the broad-based U.S. dollar failed to stop its bearish trend and remained depressed on the day. Apart from this, doubts over the U.S. economic recovery remains on the cards amid rising COVID-19 deaths, which adds further burden around the greenback. However, the losses in the U.S. dollar becomes the key factor that kept the currency pair lower. Meanwhile, the U.S. dollar index, which measures the greenback against a bucket of currencies, dropped by 0.15% to 90.112 by 12:09 AM ET (5:09 AM GMT).

In contrast to this, the optimism around the equity market was slightly unaffected by the intensifying market worries regarding the continuous rise in new coronavirus cases in the U.S. and Europe, which keep sparking the worries over the global economic recovery through imposing new lockdown restrictions on economic and social activity. Furthermore, the equity market gains were also capped by the renewed uncertainty over the Brexit deal and intensified China-US tussles.

There isn’t any major market-moving economic data due for release on the day, which in turn, the market traders will keep their eyes only on updates surrounding the virus, vaccine, and the U.S. stimulus package as the global markets seeing a dull trading session amid the year-end celebration mood and off at major bourses.

Daily Technical Levels

Support Resistance

103.47 104.02

103.25 104.37

102.91 104.58

Pivot point: 103.81

USD/JPY – Trading Tips

The USD/JPY trades choppy in between a narrow trading range of 103.750 – 103.360 level. The safe-haven USD/JPY pair faces immediate support of 103.360, and the formation of candles above this level can drive the buying trend until 103.746. Whereas, bullish trend continuation can extend further buying trend until 104.090 level. The MACD and RSI are suggesting selling bias as it’s forming histograms below 0 level. While the 50 EMA also supports the selling trend. Let’s consider taking a selling trade until the 102.990 level today. Good luck!

Categories
Forex Fundamental Analysis

EUR/NZD Global Macro Analysis – Part 3

EUR/NZD Exogenous Analysis

  • The EU and New Zealand Current Account to GDP differential

An economy’s current account comprises the balance of trade, net transfer payments, and net factor income. In international trade, a country with a higher current account surplus experiences higher demand for its domestic currency. That means the value of its currency will be higher. Typically, a higher current account to GDP means that the country has more current account surplus.

For the EUR/NZD pair, if the differential of the current account to GDP is negative, it means that the pair’s exchange rate will fall. If it’s positive, we can expect the pair’s exchange rate to increase.

In 2020, New Zealand’s current account to GDP is forecasted to reach -0.8% while that of the EU 3.4%. Thus, the current account to GDP differential between the EU and New Zealand is 4.2%. We assign a score of 4.

The prevailing interest rate in a country determines the flow of capital from foreign investors. Naturally, the country that offers a higher interest rate will attract more foreign investors who seek higher returns. Similarly, a country with lower interest rates will experience an outflow of capital by foreign investors. In the forex market, a currency pair with a positive interest rate differential tends to be bullish since traders are buying the base currency – which offers a higher interest rate and sell the quote currency – which has a lower interest rate. Conversely, a currency pair is expected to be bearish if the interest rate differential is negative since investors will sell the base currency and buy the quote currency.

In 2020, the Reserve Bank of New Zealand cut the official cash rate to 0.25%, while the ECB maintained the interest rate at 0%. Hence, the interest rate differential for the EUR/NZD pair is -0.25%. We assign a score of -3.

  • The EU and New Zealand GDP Growth Rate differential

The value of a country’s domestic currency is impacted by the growth rate of the local economy. Thus, comparing the growth rate between countries’ GDP growth rates helps determine which currency appreciated or depreciated more than the other.

The New Zealand economy contracted by 3.2% in the first three quarters of 2020 and that of the EU by 2.9%. The GDP growth rate differential is 0.3%. We assign a score of 2.

Conclusion

The EUR/NZD exogenous analysis has a cumulative rank of 3. This means that the pair is expected to trade in a bullish trend in the short-term.

The bullish trend can also be observed from the technical analysis of the weekly price charts. The pair is trading above the 200-period MA and the weekly price rebounding from the lower Bollinger Band.

We hope you found this analysis informative. If you have any questions, please let us know in the comments below. Cheers!

Categories
Forex Fundamental Analysis

EUR/NZD Global Macro Analysis – Part 1 & 2

Introduction

In conducting the global macro analysis for the EUR/NZD pair, we will analyze the endogenous factors that impact the EU and New Zealand economic growth. We’ll also analyze exogenous economic factors that affect the EUR/NZD pair’s exchange rate in the forex market.

Ranking Scale

We will rank the effects of the endogenous and exogenous factors on a sliding scale of -10 to +10. The endogenous factors will be ranked based on correlation analysis with the GDP growth rate. When the endogenous ranking is negative, it means that the domestic currency will depreciate and appreciate when positive.

Similarly, the exogenous factors are scored based on correlation analysis with the EUR/NZD pair’s exchange rate. A positive score means that the EUR/NZD pair’s price will rise and drop if the score is negative.

Summary – EUR Endogenous Analysis

Based on the factors we have analyzed, we have got a score of -3, and we can expect the Euro to be marginally depreciating in 2020.

Summary – NZD Endogenous Analysis

A score of -4 on NZD Endogenous Analysis implies that in 2020, the NZD has depreciated as well.

Employment change measures the quarterly change in the number of people who are gainfully employed. It can be used as a comprehensive measure of the labor market changes, which corresponds to economic growth.

In Q3 of 2020, Employment in New Zealand dropped by 0.8%, from a 0.3% drop in Q2 to 2.709 million. The Q3 reading is the largest drop in QoQ employment since Q1 of 2009. We assign a score of  -6.

  • New Zealand GDP Deflator

This indicator measures the quarterly changes in the price of all economic output in New Zealand. It is regarded as the most specific inflation measure since it covers price changes for every good and service produced.

In Q2 of 2020, the New Zealand GDP deflator dropped to 1238 points from 1242 in Q1. This shows that the economy contracted in Q2. Hence, we assign a score of -3.

  • New Zealand Manufacturing Sales

New Zealand manufacturing sales track the change in the volume of total sales made in the manufacturing sector. The indicator tracks the sales in 13 industries, which comprehensively represents New Zealand’s economy. The changes in the volume of sales are directly correlated to the growth of the economy.

In Q3 of 2020, the YoY manufacturing sales in New Zealand increased by 3.1% after dropping by 12.1% in Q2 and 1.9% in Q1. The increase in Q3 is the largest recorded since January 2017. However, since the overall industrial production is still at multi-year lows, we assign a score of -6.

  • New Zealand Manufacturing PMI

This index is aggregated from a survey of purchasing managers in the manufacturing sector. It is a composite of scores regarding output in the sector, prices, expected output, employment, new orders, and inventory. When the PMI is above 50, it means that the manufacturing sector is expanding. A PMI score below 50 shows that the sector is contracting. Naturally, these periods of expansions and contractions are leading indicators of changes in the GDP growth rate.

In November 2020, the New Zealand manufacturing PMI rose to 55.3 from 51.7 in October. The rise was due to increased new orders, inventory, production, and deliveries, as uncertainties surrounding COVID-19 decreased. We assign a score of 4.

  • New Zealand Retail Sales

The retail sales track the changes in the quarterly purchase of final goods and services by households in New Zealand. Although retail sales are often affected by seasonality and tend to be highly volatile, it is a significant measure of the overall economic growth since consumer expenditure is one of the primary drivers of GDP growth.

In Q3 of 2020, New Zealand retail sales increased by 28% from 14.8% recorded in Q2. Historically, the Q3 retail sales increase is the largest rise recorded in New Zealand since 1995. The increase was driven by increased expenditure on groceries, vehicles, and household goods. On average, the QoQ New Zealand retail sales figure has grown by 4.1%. We assign a score of 4.

  • New Zealand Consumer Confidence

The New Zealand consumer confidence is also called the Westpac McDermott Miller Consumer Confidence Index. The index measures the quarterly change in consumers’ pessimism or optimism about the performance of the economy. When the index is above 100, it shows increased optimism by households, and that below 100 shows pessimism.

In the fourth quarter of 2020, New Zealand consumer confidence rose to 106 from 95.1 in Q3. The increased optimism was driven by higher readings in both the current and expected financial situation. We assign a score of 2.

  • New Zealand Government Net Debt to GDP

Investors use this ratio to determine if the economy is capable of servicing its debt obligations. Consequently, the government’s net debt to GDP affects the government securities yield and determines a country’s borrowing costs. Typically, levels below 60% are deemed favorable.

In 2019, the New Zealand Government Net Debt to GDP dropped to 19% from 19.6% in 2018. In 2020, it is projected to range between 27% to 32%, which would be the highest since 1998. We assign a score of 1.

In the next article, we have done the exogenous analysis of both EUR and NZD pairs to accurately forecast this currency pair’s future trend. Please check that out. Cheers.

Categories
Forex Trading Guides

Guide To 160+ Forex Fundamental Indicators

As we all know, there are three primary techniques to trade the Forex market. They are Technical Analysis, Fundamental Analysis, and Sentimental Analysis. Technical Analysis is one of the most prominent ways of trading the market, which involves using Technical Indicators, Price Action Techniques, etc. However, Fundamental analysis is one of the most underrated techniques to gauge the currency price movement.

Therefore, at Forex Academy, we have put forward a series of Fundamental Indicators that we believe strongly impact the Forex price charts. We have clearly explained the importance of each of these indicators and pictographically showed the relative impact of the indicator’s news release on the Forex currency pairs.

This guide will help you navigate through these indicators in the easiest way possible. The order of these indicators implies their relative importance. As the list goes down, the importance of the indicators deteriorates.

Interest Rate

Inflation Rate

Government Debt to GDP Ratio

Current Account to GDP Ratio

Balance Of Trade

Unemployment Rate

Labor Force Participation Rate

Core Inflation

Cash Reserve Ratio

Productivity

Foreign Exchange Reserves

Non-Farm Payroll

Consumer Price Index

Producer Price Index

Corporate Tax

Building Permits

Income Tax

Consumer Confidence

Capital Flows

Crude Oil Production

Consumer Credit

Gold Reserves

Consumer Spending

Tourism Revenues

Personal Spending

Personal Saving

Initial Jobless Claims

Terrorism Index

Gasoline Prices

Government Debt

Credit Rating’

Core Consumer Price

New Orders

Mining Production

Car Registrations

Manufacturing Production

Manufacturing PMI

Leading Economic Index

Households Debt to GDP

Imports

Housing Index

Housing Starts

Government Budget

Disposable Personal Income

Cement Production

Car Production

Capacity Utilization

Bank Lending Rate

Home Ownership Rate

Government Spending

Foreign Direct Investment

Fiscal Expenditure

Government Revenue

Exports

Employed Persons

Construction Output

Wage Growth

Private Sector Credit

Steel Production

Services PMI

Terms Of Trade

Ease of Doing Business

Corruption Index

Electricity Production

Composite PMI

Industrial Production Index

Factory Orders

Corporate Profits

Internet Speed

ZEW Economic Sentiment Index

Changes in Inventories

GDP Constant Prices

Retail Sales MoM

Gross National Product

GDP From Agriculture

Gross Fixed Capital Formation

GDP From Manufacturing

GDP From Public Administration

GDP Per Capita PPP

GDP Per Capita

GDP Growth Rate

Long Term Unemployment Rate

Labour Costs

Full-Time Employment

Minimum Wages

Employment Change

Central Bank Balance Sheet

Youth Unemployment Rate

Harmonized Consumer Prices

Export Prices

Imports by Category

Import Prices

Imports by Country

Exports by Category

GDP From Utilities

GDP From Transport

GDP from Services

GDP from Mining

GDP from Construction

Business Confidence

Sales Tax Rate

Social Security Rate

Job Vacancies

Corruption Rank

Interbank Rate

Small Business Sentiment

Bankruptcies’

Deposit Interest Rate

Employment Rate

Food Inflation

Households Debt to Income

Lending Rate

Industrial Production MoM

Inflation Rate MoM

Producer Prices Change

GDP Annual Growth Rate 

Loan Growth

Loans to Private Sector

Retail Sales YoY

Wages

GDP Deflator

Total Vehicle Sales

IP Addresses

Asylum Applications

Government Budget Value

Social Security Rate For Employees

Social Security Rate For Companies

Employment Trends Index

Commitments of Traders

Reserve Assets

Money Supply

New Home Sales

Public Sector Net Borrowing

Cryptocurrency Negotiation

Existing-Home Sales

Durable Goods Orders

Pending Home Sales

Job Cuts

Home Loans

Sentix Investor Confidence

Gross Domestic Product Estimate

Foreign Securities Purchases

Mortgage Market Index

US Crude Oil Inventories

Personal Consumption Expenditures Price Index

Machinery Orders

Long Government Bond Auction 

US Redbook

German Ifo Business Climate Index

US 10-Year TIPS Auction

US Baker Hughes Oil Rig Count

Jobs to Applications Ratio

Commodity Prices

Business Investment

Wholesale Trade Sales

Retail Sales Monitor

Economy Watchers Current Index

US TIC Net Long-Term Transactions

This list is all you need, to master the fundamental indicators and how they affect the Forex price movements. If you have any questions, please let us know in the comments below. Cheers!

Categories
Crypto Market Analysis

Daily Crypto Review, Dec 28 – Ethereum Breaks $700; Bitcoin at $30k?

The cryptocurrency sector had an incredible weekend as Bitcoin skyrocketed towards $28,000. Bitcoin is currently trading for $27,031, representing a decrease of 2.91% compared to yesterday’s value, but a massive increase compared to its value on Friday. Meanwhile, Ethereum’s price has increased by 12.79% on the day, while XRP managed to lose 4.05%.

 Daily Crypto Sector Heat Map

EncrypGen gained 2787.56% in the past 24 hours, making it the most prominent daily crypto gainer by far. It is followed by Bankacoin’s 212.44% and Trabzonspor Fan Token’s 178.8% gain. On the other hand, CEZO lost 89.89%, making it the most prominent daily loser. It is followed by JD Coin’s loss of 64.79% and Triumph X’s loss of 57.74%.

Top 10 24-hour Performers (Click to enlarge)

Bottom 10 24-hour Performers (Click to enlarge)

Bitcoin’s market dominance has moved down slightly since our last report, with its value currently being 69.1%. This value represents a 0.25% difference to the downside than the value it had when we last reported.

Daily Crypto Market Cap Chart

The cryptocurrency sector capitalization has increased over $100 billion since we last reported, with its current value being $721.10 billion. This represents a $101.89 billion increase when compared to our previous report.

_______________________________________________________________________

What happened in the past 24 hours?

_______________________________________________________________________

_______________________________________________________________________

Technical analysis

_______________________________________________________________________

Bitcoin

Bitcoin did not sleep this weekend as it took its time to push towards new all-time highs. The best-known cryptocurrency pushed towards the upside, reaching as high as $28,391 at one point. It is now consolidating around the $27,000 level and preparing for the next move.

Our Fib extensions drawn on Friday worked exactly as expected, with Bitcoin respecting every single one of them. With all of them still being a valid choice, traders should either look for a bounce off the immediate support levels or increased volume followed by a sharp increase in price. Trading Bitcoin’s pullbacks is not exactly the best option at the moment.

BTC/USD 4-hour chart

While Bitcoin’s 4-hour and weekly technicals show a full tilt towards the buy-side, its daily and monthly technicals show some neutrality signs.

BTC/USD 1-day Technicals

Technical factors (4-hour Chart):
  • Price is above its 50-period EMA and slightly above its 21-period EMA
  • Price is slightly above its middle Bollinger band
  • RSI is neutral (62.10)
  • Volume is slightly above average
Key levels to the upside          Key levels to the downside

1: $28,391                                 1: $25,512

2: $29,000                                 2: $24,696

3: $30,000                                  3: $24,315

Ethereum

While Ethereum did manage to score some gains over the weekend, its upside got overshadowed by Bitcoin’s growth. However, the second-largest cryptocurrency by market cap has decided to make that up by suddenly pushing from $624 all the way up to $738. While the move seemingly ended here, it is not yet certain whether the price will break the level or go even higher, or start its consolidation at slightly lower levels.

Traders should utilize the volume indicator, order books, and well-established support/resistance levels to its fullest to catch these explosive trades while remaining safe.

ETH/USD 4-hour Chart

Ethereum’s shorter time-frames are completely bullish, while its longer-time frames show slight neutrality signs.

ETH/USD 1-day Technicals

Technical Factors (4-hour Chart):
  • Price is far above both its 50-period and its 21-period EMA
  • Price is at its top Bollinger band
  • RSI has stepped into the overbought territory (71.68)
  • Volume is trading on above-average levels
Key levels to the upside          Key levels to the downside

1: $738                                     1: $675

2: $800                                     2: $632 

3: $900                                      3: $600

Ripple

XRP has been trading on low volume and slowly descending after a brief rally to $0.385. The fourth-largest cryptocurrency keeps getting crushed by various companies dropping support or liquidating their XRP positions after Ripple and its executives got sued by the SEC.

XRP traders should (more than anything) pay attention to the news. However, there are many other cryptocurrencies with much safer and potentially more profitable trading setups at the moment.

XRP/USD 4-hour Chart

XRP’s technicals on all time-frames slightly tilted towards the sell-side, but they all show some signs of uncertainty.

XRP/USD 1-day Technicals

Technical factors (4-hour Chart):
  • Its price is currently far below its 50-period EMA and slightly below its 21-period EMA
  • Price slightly below its middle Bollinger band
  • RSI has left the oversold territory (37.46)
  • Volume is returning to average levels
Key levels to the upside          Key levels to the downside

1: $0.30                                    1: $0.25

2: $0.358                                   2: $0.214

3: $0.475 

Categories
Forex Course

197. Using The USDX Numbers To Trade The Forex Market

Introduction

The U.S. Dollar Index is one of the most reckoned currency indexes and trades on exchanges with the DXY ticker or the USDX ticker. This index has been around in the market since 1973, when the base value was kept at 100,000.00, which is now 100.00.

It is a very prominent factor that facilitates Greenback. And the basket used to measure the U.S. dollar index value has only been changed once post-Euro replaced many other European currencies in 1999.

Formula To Calculate USDX

USDX = 50.14348112 * the EUR/USD exchange rate ^ (-0.576) * the USD/JPY exchange rate ^ (0.136) * the GBP/USD exchange rate ^ (-0.119) X the USD/CAD exchange rate ^ (0.091) × the USD/SEK exchange rate ^ (0.042) * the USD/CHF exchange rate ^ (0.036).

Implementing The US Dollar Index to Trade Forex

The movement determined in the U.S. currency index, such as the USDX, offers traders a sense of how the currency is experiencing a change in its value against other currencies in the index. For instance, if there is a rise in the USDX level, this indicates the rise in the U.S. dollar. Similarly, when the level of USDX is falling, so is the dollar in the foreign exchange market.

Many financial reporters leverage the changes witnessed in the U.S. Dollar Index’s value to offer their viewers and audiences an idea of how the U.S. dollar performed in the foreign exchange market. This works as an alternative to analyzing how each currency increased or decreased against the dollar.

Moreover, the USDX can also act as an inverse indicator that reflects the strength of the consolidated Euro currency of the European Union, considering that the weight of Euro (57.6%) is the most in the index.

Another prominent aspect that the forex trader should consider is how the movements of the USDX is associated with the other currencies that are put against the U.S. Dollar.

For instance, when the currency pair is measured as USD/JPY, it is likely to be positively correlated, and both the currencies should rise and fall at the same time.

Contrarily, when the currency pair is measured like EUR/USD, then the currency pair and USDX are inversely correlated. This implies that they are likely to move in the opposite direction, where one will fall when the other rises.

[wp_quiz id=”97457″]