Categories
Forex Course

11. The Different Order Types In The Forex Market

Introduction

In the world of trading, the order types are identical, irrespective of the market you’re trading. The type of the ‘Order’ refers to how you wish to enter or exit a trade. If you’re new to the world of trading, you might only know two order types – Buy and Sell. But there are other order types that serve different purposes, and improve the way you trade. In this lesson, we will be discussing some of the most used orders in the forex market.

Types of Orders

There are about four order types widely used by traders. These are

  • Market Order
  • Limit Entry Order (Buy Limit, Sell Limit)
  • Stop Entry Order (Buy Stop, Sell Stop)
  • Stop Loss Order

Apart from the above, there are other orders that are exclusively offered by specific brokers like ‘Trailing Stop-Loss’ and ‘Profit Booking Order’ but in this article, we shall confine only to these four types.

Understanding the Bid and Ask prices

Let us first discuss these two terms as they form the base for understanding the order types.

Bid price

The bid price is the price at which the broker is willing to buy the currency pair from you. So, when you short sell a currency pair, you will be executed at the bid price.

Ask price

Ask price is the price at which the broker is willing to sell the currency pair to you. So, if you go long (buy) on a currency pair, you will be filled at the ask price.

With this under consideration, let us continue our discussion on different order types.

Market Order

This is the most basic form of order. In a market order, you get filled at the current market price. It is basically the best price available in the market to buy/sell a currency pair.

For example, let’s say the bid price of EURUSD is 1.2150, and the ask price is 1.2152. Now, if you execute a market buy order on this one, you will get filled at the ask price, i.e., at 1.2152. Similarly, if you go short on this pair, you will get filed at 1.2150.

Market orders are fast. A trader uses that order to enter a marker no matter what. That speed and fill guarantee comes at the cost of the slippage is the market has moved from the instant the trader pulls the trigger to when the order is filled.
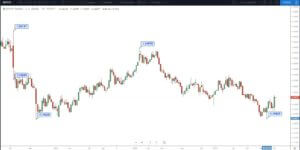
Limit Entry Order

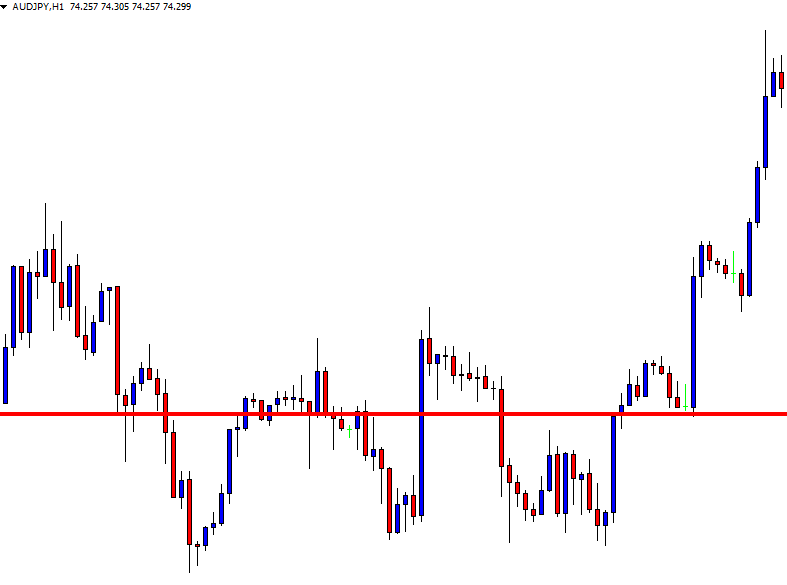
Limit entry order is an order where a buy order is placed less than the current market price, and a sell order is placed above the current market price.

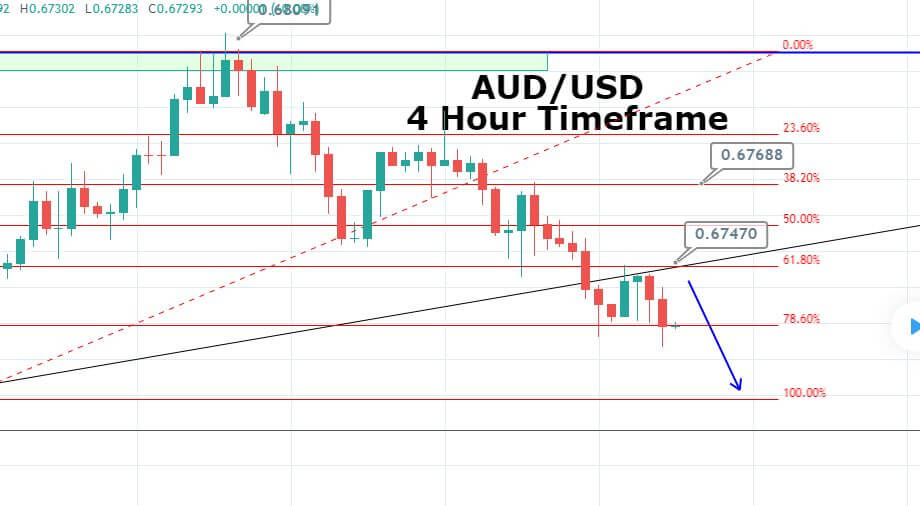
For example, let’s say the current market price of AUDUSD is 0.6750. Now, if you want to buy it at 0.6725, you will have to place a Buy Limit order at this price. And if you want to short it at 0.6790, you will need to place a Sell Limit order at this price.

Limit orders can be used as entry or as exit orders.

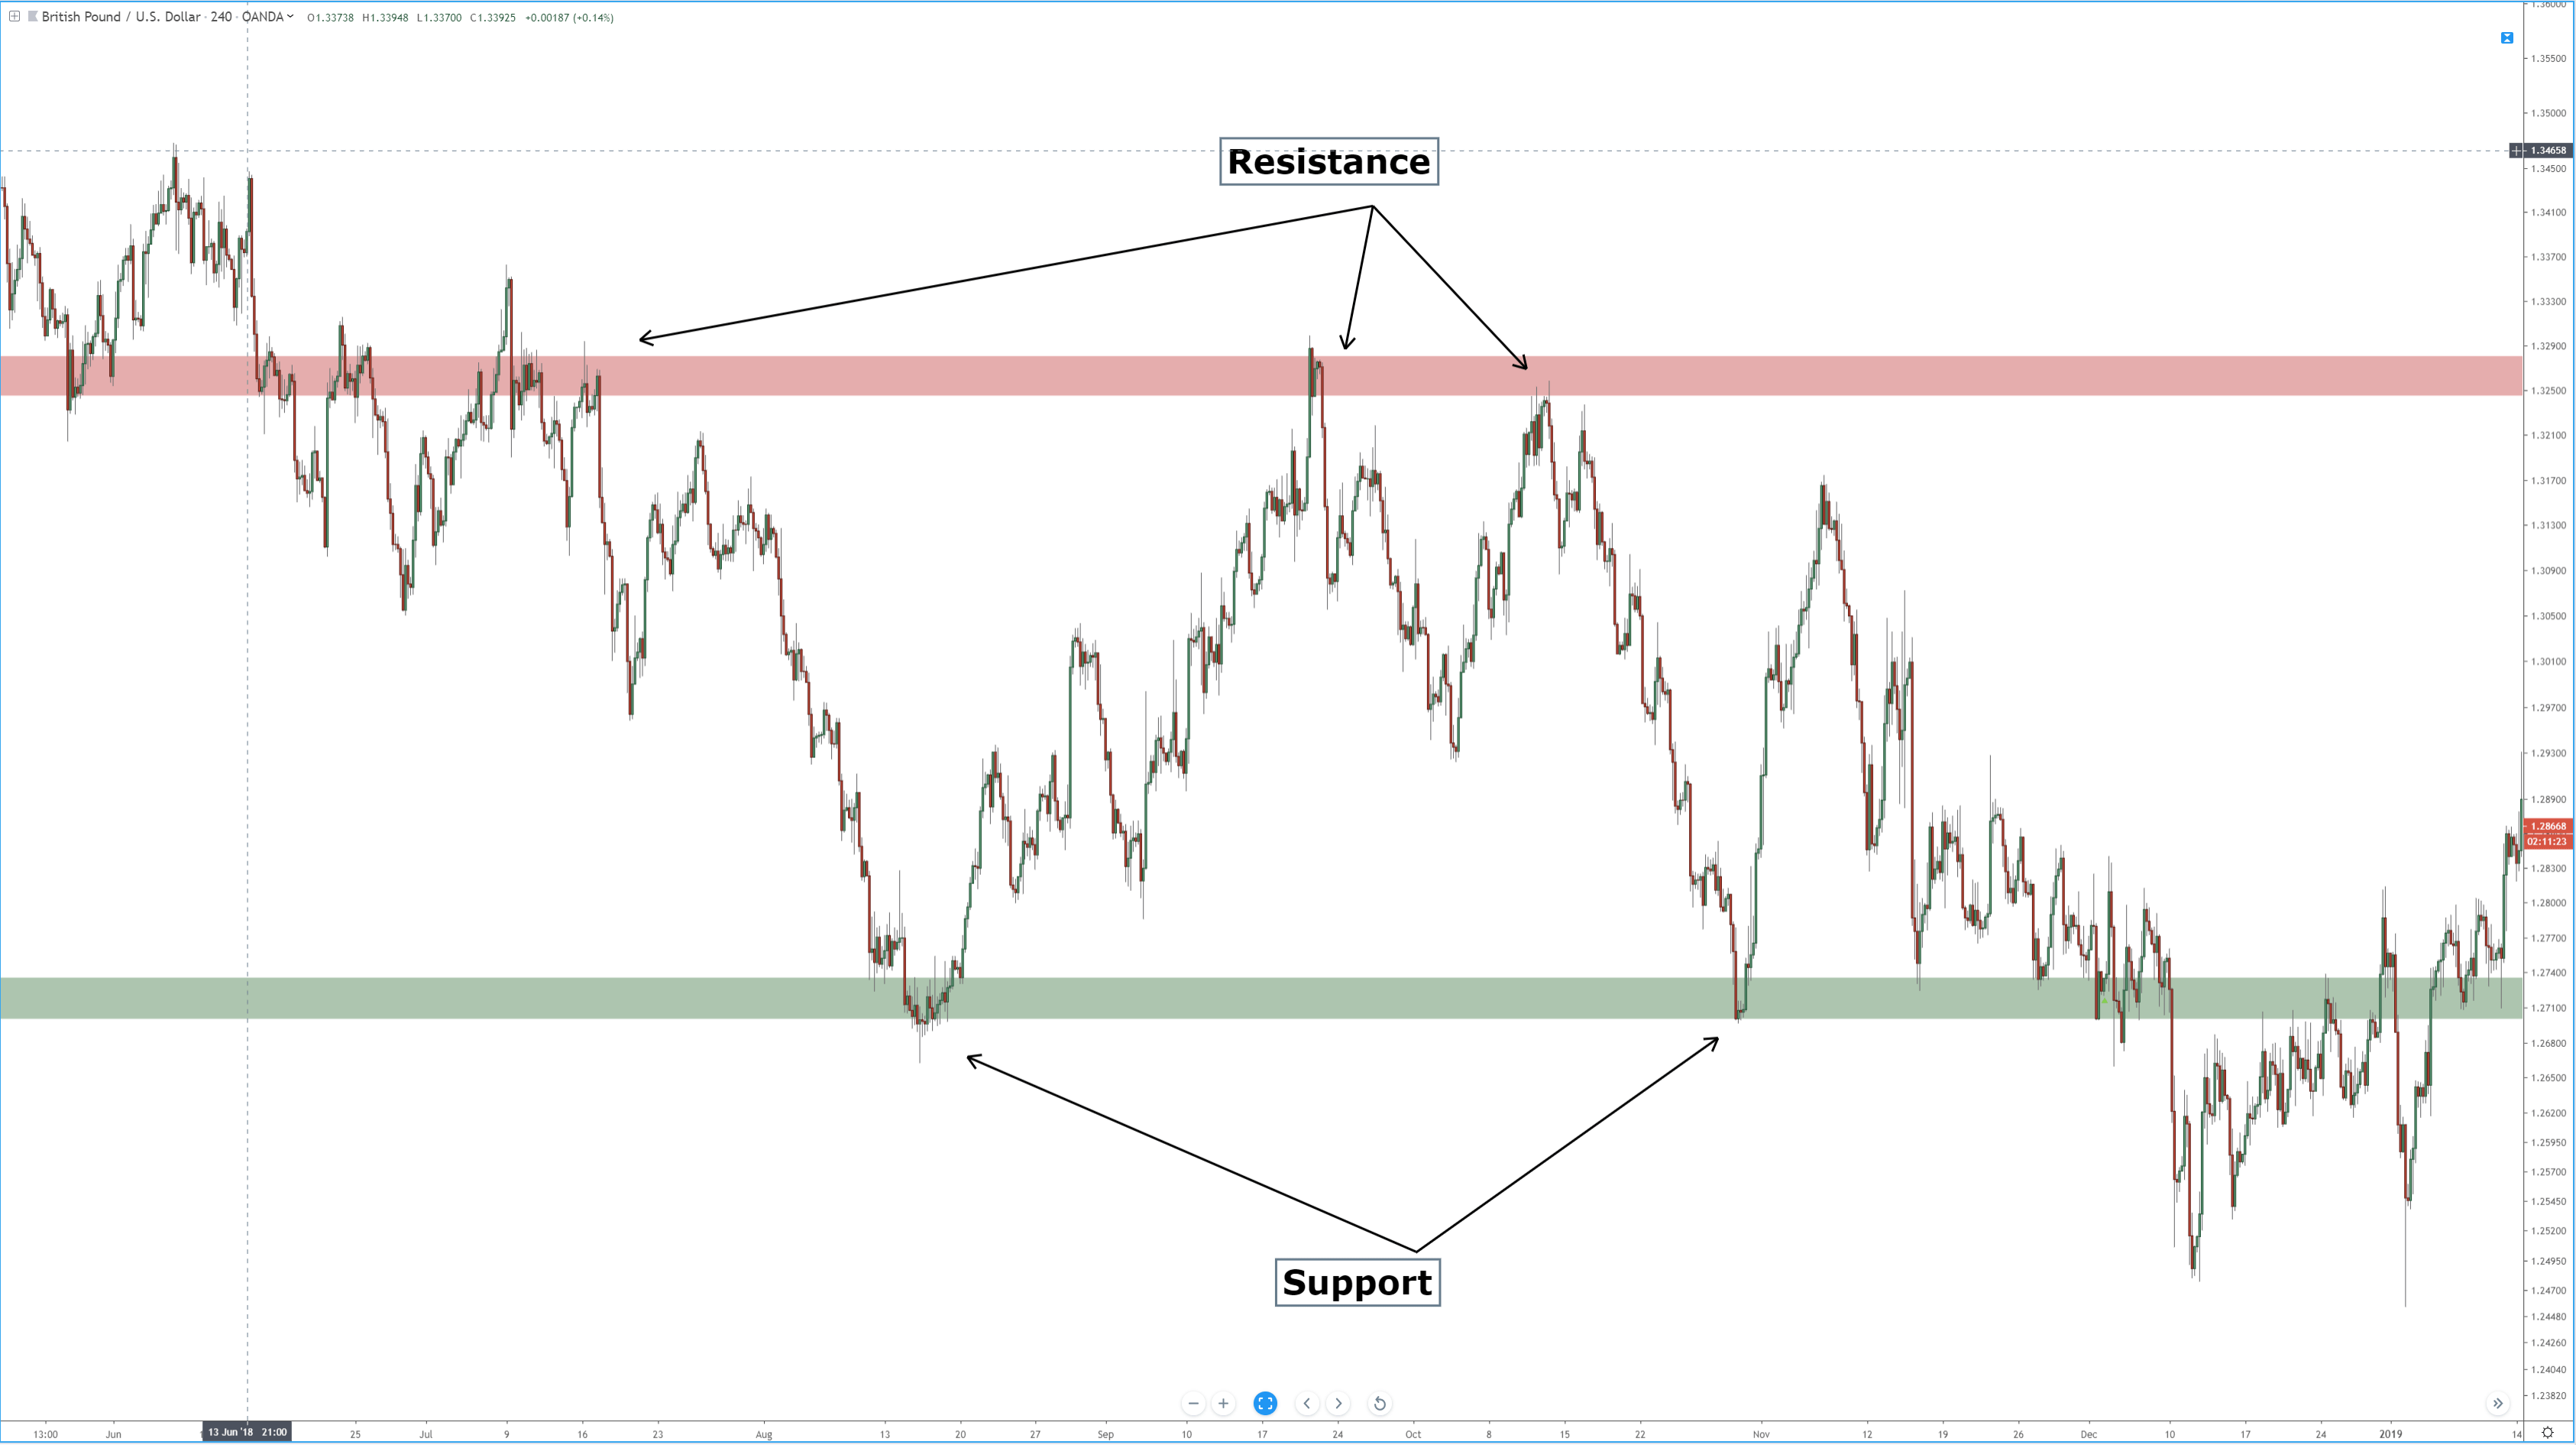
As entry orders, you are applying the logic of buy low and sell high (on short-sell limit orders). A limit order is handy to spot a support area while the price moves back and get filled as the price approaches support.

As exit orders, they are handy to take profits. You place a limit to sell at your profit-taking level on long trades and you place a buy limit order at your profit target level on short trades.
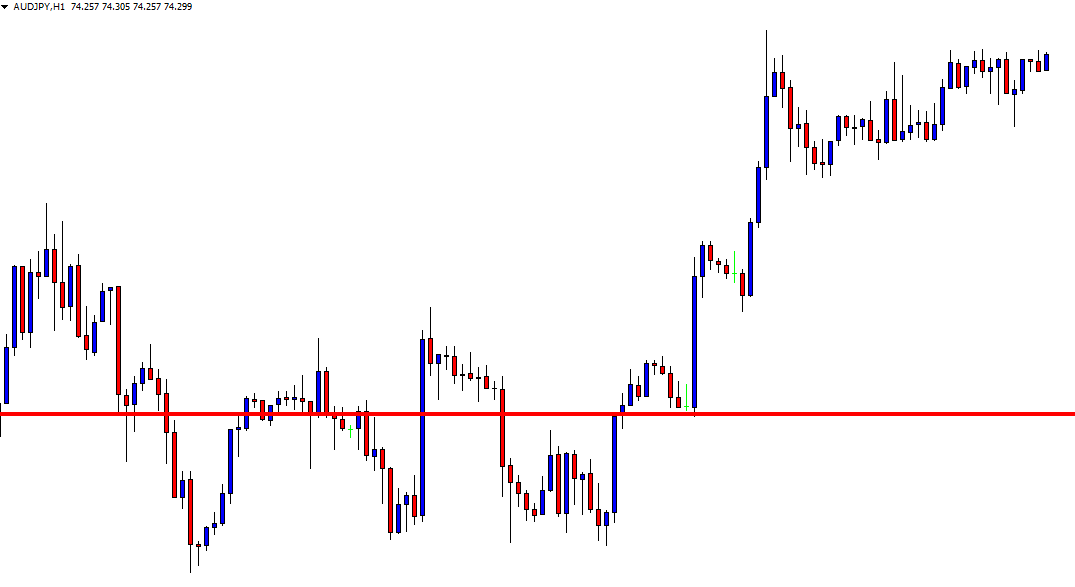
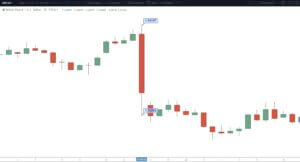
Stop Entry Order

A stop entry order is the reverse of a limit entry order. Here, you can place a buy order above the current market price and a short sell order below the current market price.

For example, let’s say the current market price of GBPJPY 1.6570. Now, if you think the market will head up only if the price breaks above 1.6590, you must place a Buy Stop at the price you wish to buy. So, when the price goes up to 1.6590, your buy order will be executed.
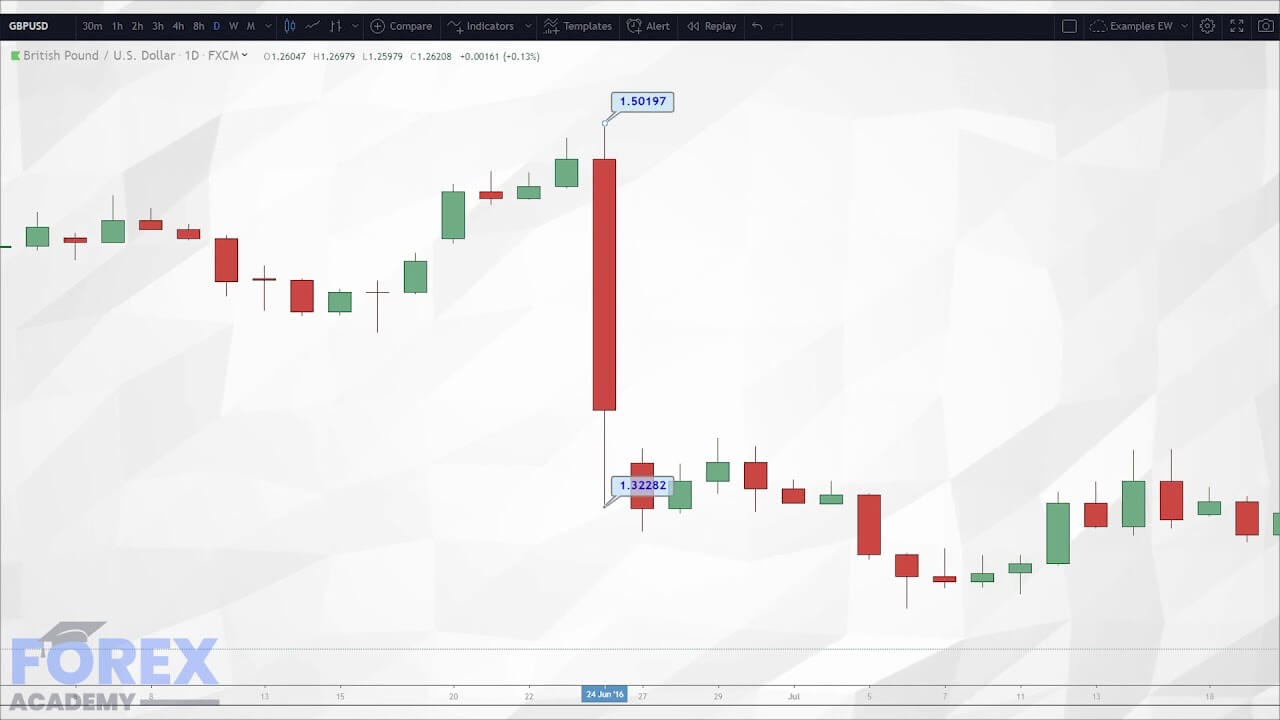
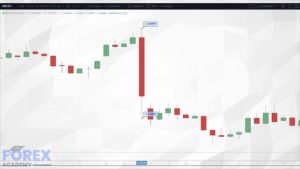
Stop-Loss Order

A stop-loss order is special order for closing a trade. This order is placed against the price at which you bought/sold the currency pair. This is done to avoid further losses from trade. Since this order ‘stops’ the losses, it is called a ‘stop-loss’ order.

For example, let’s say you bought a currency pair at 1.1320. Now, for this trade, if you place a stop-loss at 1.1250, the positions will be closed when the market touches this price, hence, protecting you from further losses.

This completes the lesson on basic order types in the forex market. We will discuss the more premium broker specific orders in our future lessons. For now, take the below quiz and check what you have learned the concepts right.

[wp_quiz id=”45527″]
Categories
Forex Videos

Mastering Price Action – The Forex Traders Bible

Mastering Price Action

Price action is a discipline of identifying price action trends (up and down movement) reversals, support, and resistance via technical analysis on a trading chart during a specified period of time. Price action analysis is used in conjunction with global news events and economic data releases, which act together in order to influence exchange rates.

Most technical traders profit by devising a strategy which actually combines both price action, fundamental analysis, and their overall understanding of technical analysis. All these factors work hand-in-hand with each other.
Different tools can be applied to a chart to make trends in price action more obvious for traders. And where technical analysis formations and chart patterns are derived solely from price action.

Example ‘A’

Example ‘A’ is a 2-hour line graph of the British pound against the American dollar, also known as Cable. Let’s disregard the comments on the graph and simply focus on the actual line graph itself, which denotes the up and down movements – or price action – of the exchange rate of this currency pair. If we only used this line graph to trade this particular pair, we would find it extremely difficult to know when to open a trade in any particular direction. It simply looks chaotic and random!
However, looking a little more closely we can see a peak on the left hand side of the chart which occurs at the 1.2567 exchange rate level, before price action descends to the 1.22 level, which is a key level, and where we might expect to find some potential support, (a floor in this example) and where indeed the price flattens out here and which marks the end of trend ‘A’.
Price then moves higher throughout trend B and where we see a couple of spikes, some pullbacks, and then a continuation to the peak of 1.2850; another key level (in this case, a potential ceiling).

Example B


In example B, we have changed the line graph to Japanese candlesticks, a style of technical analysis which is more widely used in the trading community and which is much easier to read in terms of potential fading of price action and therefore possible opportunities to enter the market more easily.
Here we can see for example that our initial peak on the left-hand side of the screen showed a high, as denoted by the green (bullish) candlesticks, which was replaced by a red (bearish) candlestick – which was larger than the preceding two candlesticks – and was a warning to traders of a potential pullback, or a reversal of price action.

Indeed price begins to fall before almost returning to trendline ‘A’ and then continues the momentum to the downside. Eventually, the price action returns to our trend line before continuing the move lower by way of a series of falls and pullbacks and where trendline ‘A’ has become a simple moving average.
After the price action flattens out at the 1.22 level, we are able to identify a move higher and where the larger candlesticks (a sign of a strong trend) move above the trend line or simple moving average, and this starts a price action reversal. When price crosses the extended trend line ‘A,’ this becomes a signal of a new trend, and indeed trendline ‘B’ becomes a simple moving average to the peak of 1.2850.

Example C

Now let’s look at candlesticks a little more closely. In example ‘C’ we have magnified a section of price action in order that we can analyze the candlesticks in more detail. Note that price action, as denoted by the green candlesticks, is in an upward trend. The last green candlestick in this sequence is called an upside-down hammer. This has a smaller ‘wick’ at the bottom, a small ‘body,’ and then a longer wick at the top: Hence the term upside down hammer. At its height, the price has moved to the highest point and then pulled back before the next candlestick opens. The subsequent candlestick is a descending candlestick with a long body, and one small wick at the top, and where the candlestick is longer than the preceding two bull candlesticks. This type of Candlestick is an engulfing candlestick (it engulfs the previous ones), and often sets the precedent for any subsequent move; in this case lower.

Example D

In example ‘D’ we can see that the bulls have been in control of the price action and moved the exchange rate up to trendline ‘A.’ However the subsequence candlestick is a bearish candlestick, which engulfs the body of the previous candlestick, and where price action begins to trend lower. In the middle of the sequence, we see another hammer shape candlestick, but this time it has a longer wick at the bottom, and traders have taken advantage of this and move the price higher. Many of the candlesticks in the remainder of this sequence are very small, and this usually denotes that there is a lack of volume at the present moment in time.

Example E

Now we turn our attention to example ‘E,’ where we have magnified the price action around the key 1.22 area. Many of the candlesticks we see have small bodies, and where some of the candlesticks have small wicks; these types of candlesticks are called ‘spinning tops’ and usually denote a lack of direction and a lack of volume in the market. Towards the end of this sequence, we can see that the last two bullish green candlesticks open above the preceding ones, and both of these have long bodies with small wicks, which ingulf the previous candlesticks from the beginning of the move in this highlighted sequence. They form our new bullish move, which we have called trend ‘B.’

Therefore, the candlesticks become a much better tool to read price action. Suddenly the chaos and randomness ebb away! Remember, the larger the candlestick, the stronger the trend. Candlesticks are the best available tool for mastering price action. They are a leading indicator, and when combined with other technical analysis tools will help you get an edge in your trading! We will identify more Japanese candlesticks later in our course.

Categories
Forex Market Analysis

Safe-haven Gold Trades Higher – Brexit Uncertainty Dominates!

The safe-haven metal prices fond on the bullish track due to fresh Brexit headlines. Prime Minister Boris Johnsons Brexit bill gained the parliamentary support, but the government timeline of just three-days discussion on the bill was rejected.

The Chances of Britain departing the European Union before the deadline date of 31 October has dropped sharply, mainly due to parliamentary failure.

On the other hand, the headline came from the Prime Minster Boris Johnson office said that if the European Union agree to a delay until January, then the only way to shift from Britain’s Brexit crisis is a new election.


At the US-China trade front, Chinse Vice Foreign Minister Le Yucheng said during this week that the China and United States reached on some developments in trade talks, as well as he said that as long as both nations respected between ourselves, all problems can resolve.

Trouble in Hong Kong also gained some attention, after the financial Times reported overnight that China is considering replacing Hong Kong’s chief executive, Carrie Lam, by March.


Daily Support and Resistance


S3 1474.16

S2 1480.41

S1 1484.27

Pivot Point 1486.66

R1 1490.52

R2 1492.91

R3 1499.16

Consider trading bearish below 1,497 area with a stop loss above the 1,500 level. Conversely, selling trades can be taken below 1,496 to target 1,486. All the best! 

Categories
Forex Price-Action Strategies

Breakout by a Single Candle Generate More Impetus

Breakout is one of the most important factors in trading. Attributes of a breakout give clues with what traders can manage their opened position to make more profit. Price action traders, in particular, love to compute the attributes of a breakout to determine their take profit level.

In this section, we are going to demonstrate an example of a single candle breakout and its impact afterwards. Have a look at the chart below.

The price finds support at the red market level and heads towards the North. The price action suggests that the buyers are going to control the pair. A downward correction/consolidation followed by a bullish reversal candle at a value zone is what they need to wait for. Let us find out what happens next.

The price seems to have started having a pullback. The first corrective candle comes out as an Inside Bar, which is a good sign for the buyers. The buyers wait for the price to come back at a level of support with a reasonable distance from the resistance. Let us see how far it comes up to.

The price has crossed a good distance from resistance. The buyers are to wait for a bullish reversal candle. Ideally, a bullish engulfing candle is the first choice for the buyers. Other candles such as Inside bar, Spinning Top do the job as well, but an engulfing candle’s signal attracts more traders, and it brings more liquidity. Let us see what happens next.

Price action traders dream of such a reversal candle. This is not only a bullish engulfing candle but also an engulfing candle, which breaches the highest high of the last wave. Let us draw the consolidation zone on the chart.

The reversal candle makes the breakout with good momentum. A trader shall trigger a buy entry shall right after the candle closes. When a reversal candle itself makes a breakout, it makes the fore coming move go towards the trend’s direction with good momentum. Look at the chart below.

Look at the pace of the bullish move after the breakout. Here is another very important factor that traders must remember. A single candle breakout usually offers a 1:2 risk-reward ratio. This means traders shall add some extra pips with their profit target when they get such price action. The drama remains. Have a look at the chart below.

The price makes a correction and seems to have found support again. It suggests that the buyers are still in control. Smart buyers take their Partial profit and let the rest of the trade run to earn more pips.

As mentioned, breakout attributes give clues about the trend’s strength. Eventually, this helps traders manage their trade nicely and make more money out of trading.

Categories
Forex Elliott Wave

Elliott Wave Principle – Advanced Concepts – Part 1

Intermarket Analysis studies the correlation or relationship between different markets or assets. In this educational article, we will review how to apply the correlation analysis within the Elliott Wave Principle.

The basics

In financial markets, we use the correlation to measure the relationship between two or more assets. These assets can be from the same or different markets.

For example, we can analyze the relationship between a commodity and a currency pair. In the first figure, we observe the relationship between Crude Oil (NYMEX:CL) and the FX pair US Dollar – Canadian Dollar (USDCAD).

From the figure, we observe that Crude Oil holds an inverse relationship with USDCAD. It means that, if CL soars, the USDCAD should decrease, and vice-versa. This type of correlation is known as negative or inverse correlation.

In the contrarian case, when an asset moves in the same direction that the second one is known as positive or direct correlation.

The second key concept in the Intermarket analysis is convergence and divergence. In the same way that we use and identify divergences, or deviations, on technical indicators, we use it with correlations. Divergences allow us to foresee the exhaustion of a sequence.

From the figure one, we identified the divergence with the red arrow. In the example, we observe at the end of a wave, when Crude Oil soars, the Loonie decreases. In general, we find divergences when the fifth wave is in progress.

Putting all together

The next chart corresponds to the NASDAQ Biotechnology ETF (IBB) and the stock price chart of MERCK & Co. (MRK), in the weekly timeframe and log scale.

In this case, both assets belong to the same sector. Thus, we expect a positive correlation with each other. From the chart, we observe that IBB and MRK started a rally in the third quarter of 2009.

MRK looks like it’s near to end the bull trend; however, IBB unveils an incomplete bullish five-waves sequence.

Finally, please, note how the divergence appears at the end of the third wave on IBB, while MRK started the wave four.

Categories
Forex Market Analysis

Daily FX Brief, October 23 – Major Trade Setups – Stronger Dollar Plays

On Wednesday, the dollar rose versus its peer currencies as a risk spread ahead of the British parliament’s vote on the Withdrawal Agreement Bill, which will reflect light on when and how Britain will exit the Eurozone.

The British Pound currency was found on the selling track, although Prime Minister Boris Johnsons Brexit bill gained the parliamentary support, the government timeline of just three-days discussion on the bill was rejected.

The European Union Consumer Confidence is scheduled to release at 14:00 GMT. Hence, the European Central Bank, Andrea Enria, is expected to deliver the speech at an event in Madrid at 08:45GMT.

Economic Events to Watch Today

Let’s took at these fundamentals.


GBP/USD– Daily Analysis

The GBP/USD currency pair came under pressure, and the pair is currently trading below the 1.2850. As well as, the pair failed to hit the critical support range on Tuesday, mainly due to Brexit uncertainty and delay. The 50-hour and 100-hour Moving Averages are found at 1.2940 and 1.2905, respectively.

The British Pound currency was found on the selling track, although Prime Minister Boris Johnsons Brexit bill gained the parliamentary support, the government timeline of just three-days discussion on the bill was rejected.

The chances of Britain departing the European Union before the deadline date of October 31 has dropped sharply, mainly due to parliamentary failure.

On the other hand, the headline came from the Prime Minster Boris Johnson office said that if the European Union agree to a delay until January, then the only way to shift from Britain’s Brexit crisis is a new election.

Forecast view, the ongoing uncertainty regarding Brexit could continue to push the GBP lower. Moreover, the pair is trading well below the 100-hour Moving Average for the 1st time since October 11.

It should be noted that the greenback may gain some haven buying due to the risk-off sentiment in the equity markets and trade uncertainty.


Daily Support and Resistance

S3 1.264

S2 1.278

S1 1.2839

Pivot Point 1.292

R1 1.2979

R2 1.306

R3 1.32

GBP/USD– Trading Tips

The GBP/USD has violated the bullish channel, which was supporting the pair around 1.2945. The formation fo a bearish engulfing candle is suggesting chances of a bearish reversal in the GBP/USD pair. 

On the lower side, the Sterling may find support at 1.2785 level, which also marks a double bottom on the 4-hour chart. Besides, the resistance stays at 1.2945 level. Consider staying bearish below 1.2920 today. 


EUR/USD – Daily Analysis

During the early Asian session, the EUR/USD currency pair hit the bearish track, having gained acceptance below the 100-day M.A. yesterday. The EUR currency came under selling pressure, mainly due to the decline in the GBP currency as the Brexit obstacle.

If talking about the past movement of EUR, Brexit certainty has sent the shared currency above the 100-day Moving Average on October 18. 

On the technical side, the EUR/USD currency pair found on the inverted hammer on Monday and ended well below the inverted hammers low of 1.1139 on Tuesday.

So, the EUR currency could drop further, notably if the German ten-year bond yields extend Tuesdays 4-basis-points decline to -0.38%. 

Moreover, the greenback may gain some haven buying, adding to the bearish pressures near the EUR/USD currency due to the risk-off sentiment in the equity markets.

On the other hand, the European Union Consumer Confidence is scheduled to release at 14:00 GMT. Hence, the European Central Bank, Andrea Enria, is expected to deliver the speech at an event in Madrid at 08:45GMT.


Daily Support and Resistance


S3 1.1056

S2 1.1096

S1 1.1113

Pivot Point 1.1135

R1 1.1153

R2 1.1175

R3 1.1214

EUR/USD – Trading Tips

The EUR/USD currency was trading 1.1116 and 1.1157 yesterday, hit the lowest range. As for today, the EUR will likely to continue consolidating in the narrow range of 1.1110 – 1.1150.

The EUR/USD is also facing double bottom support at 1.1110 area, and above this, we can expect to buy a trend in the EUR/USD until 1.1150 and 1.1180. On the other hand, selling can be expected below 1.1110 until the 1.1065 area. 

USD/JPY – Daily Analysis

The USD/JPY currency pair is flashing red and representing 0.16% declines on the day. As of writing, the USD/JPY currency pair currently trading at 108.30, as the time of writing, the pair traveled from a high range of 108.51 to a low range of 108.25.

The USD/JPY currency pair may end with a much higher daily loss, as the four-hour chart is showing a head-and-shoulders breakdown. 

Such as Prime Minister Boris Johnsons Brexit bill gained the parliamentary support, but the government timeline of just three-days discussion on the bill was rejected.

Notably, Prime Minister Boris Johnson made a plan to meet with European Union leaders once again to discuss the timeline, and the chances of an early election are increasingly, but Brexit delayed beyond the elections. 

At the data front, the Oct Richmond Fed manufacturing survey rose firmly to +8 (est. -7, prior -9). Increases were comprehensive, with noted raises in employment and new orders with expectations edging higher in addition to stronger current conditions. United Step Sep existing home sales slid -2.2%m/m (est. -0.7%m/m). However, at 5.38mn (est. 5.45mn), the annualized level continues close to post record highs, and NAR’s chief economist continues to cite a shortage of stock and supply.

The United States’ two-year Treasury yields were moving between 1.59% and 1.63, whereas the ten-year yield traveled between 1.76% and 1.80%. Markets are expecting 22-basis points of a rate cut at the October 30 meeting and a terminal rate of 1.24% against % currently.


Daily Support and Resistance

S3 108.09

S2 108.31

S1 108.41

Pivot Point 108.53

R1 108.63

R2 108.75

R3 108.97

USD/JPY – Trading Tips

Recalling our previous update, the USD/JPY was trading in the bullish channel, which was extending support at 108.350. This bullish channel is now violated. As anticipated, the violation of 108.350 is extending bearish rally until the 108 level. 

The MACD and Stochastics are consistently pointing into the selling zone, signaling odds of a bearish bias.

The USD/JPY may attain a critical resistance at 108.57, along with support at 108.300. Today, the violation fo 108.270 can help us capture a quick sell position until 107.950. 

All the best!  


Categories
Forex Harmonic

The Alternate Bat Pattern

Harmonic Pattern Example: Alternate Bat Bullish

The Alternate Bat Pattern

The Alternate Bat Pattern is another pattern by Scott M. Carney. This pattern comes from his second Volume Two in his Harmonic Trading series of books. He discovered this pattern roughly two years after (2003) his discovery of the Bat Pattern (2001). Carney wrote that ‘the origin of the alternate Bat pattern resulted from many frustrated and failed trades of the standard framework. The standard Bat pattern is defined by the B point that is less than a 0.618 retracement of the XA Leg.’ Essentially, with the Alternate Bat Pattern we observe an extension beyond the 88.6% level at D, where D moves slightly below X (in a bullish Bat) or above X (in a bearish Bat). I view Alternate Bats as classic and powerful bear traps and bull traps. And they are just plain nasty if you find yourself thinking that a new low means further downside movement and a continuation lower – but instead to you get whipsawed by a massive reversal.


Alternate Bat Elements

  • Whereas the 88.6% retracement is nearly singular to the Bat Pattern, the Alternate Bat Pattern utilizes the 113% retracement of XA to determine the endpoint.
  • B must be a 38.2% or less retracement of XA.
  • Minimum projection of 200%
  • The AB=CD pattern must be an extended AB=CD and often is a 161.8% level.
  • The pattern is potent when using a form of divergence detection, such as the Composite Index, to confirm the pattern.


Sources: Carney, S. M. (2010). Harmonic trading. Upper Saddle River, NJ: Financial Times/Prentice Hall.  Gilmore, B. T. (2000). Geometry of markets. Greenville, SC: Traders Press.  Pesavento, L., & Jouflas, L. (2008). Trade what you see: how to profit from pattern recognition. Hoboken: Wiley.

Categories
Forex Videos

The Biggest Fundamental Events Analysis & Case Study A

In a previous presentation, we explained about the three styles of trading Forex: fundamental and technical analysis and trading with market sentiment. In this presentation, we are going to look at the significance of fundamental analysis in more depth.

Fundamental analysis is the way that traders try to analyse the economic, social, and political events in a country, in order to ascertain it’s exchange rate with another country’s currency. Therefore traders will be interested in the gross domestic product GDP and growth potential of a country, along with other factors such as its unemployment rate, debt, inflation, and monetary policy. In the case of the US dollar and the Euro, in particular, traders will also be trying to gauge the supply and demand of these currencies.
Of course, in the real world, all of these factors are extremely fluid and change constantly, and therefore, traders are continually battling to determine the value of one currency against another; in other words, the currency exchange rates.

Therefore when a country releases economic data, especially interest rate changes, GDP announcements, and in the case of the United States, unemployment changes in the form of Non-Farm Payrolls – which are normally released on the first Friday of each month – these data releases will be greatly anticipated and can dramatically change the value in a country’s currency and thus related exchange rates. Thus we often find dramatic Forex market moves caused by the increased volatility surrounding such events.

Case study 1: –
On the 23rd of June 2016, the British people voted in a referendum to leave the European Union: Brexit. This sent shock-waves through the financial markets and resulted in the British Pound plummeting in value against its peers.
In the example ‘A,’ we can see a huge, red, bearish Japanese candlestick descending from a high of over 1.50 to a low of 1.32 against the US dollar, during overnight trading, post the referendum result. The subsequent uncertainty regarding this decision caused the Pound against the US dollar – also known as Cable – to fall to a low of 1.19. Indeed we are still seeing extreme volatility due to the fact that, some three years later, this matter has not yet been
concluded.

While many traders correctly predicted that the British public would indeed vote to leave the European Union and shorted Cable, and made a hefty profit as the Pound sank, traders who were ‘long’ of the pair faced huge losses and where Stop Loss orders would have faced immense slippage due to the extremeness of the fall.
In Example B, we can see some of the extreme moves in Cable from a high of 1.50 before the Brexit referendum to lows of 1.19 and swing highs to 1.43 post the referendum.
Obviously, fundamental events like these don’t happen often. However, let’s look at another fundamental event which caused huge market volatility.

Case study 2: –
The country of Switzerland lies in the heart of the Euro area and does a great deal of international business with Euroland. The Swiss National Bank SNB is responsible for monetary policy for Switzerland but declined to join the European Union, preferring to remain an independent trading nation and retain its own currency: the Swiss Franc CHF.
Because of Switzerland’s geographically closeness to Europe and the significance of trade

reliance, on the 6th September 2011 – due to extreme volatility in the financial markets – the SNB announced it wanted to depreciate the EUR:CHF currency (or to cap it at) exchange rate of EUR:CHF 1.20, so as to remain competitive with regard to trading with the Euro area.
However, on the 15th January 2015, the Chairman of the Board of the SNP, Thomas Jordan unexpectedly announced it was removing the cap. The result in the effective 1.20 peg being removed, without market notice, caused chaos in the Forex market.

In example C, we can see a huge fall in the value of the Euro to the Swiss Franc from 1.2 to 0.96 on our chart, while some brokers were seeing falls to as low as 0.85. Many hedge funds made huge losses, and individual traders were made bankrupt along with the broker Alpari Trading, who could not cover losses it sustained in the devaluation crisis. Remember, this event was a bolt out of the blue, with many commentators accusing the SNB or gross
negligence.

The upshot is that trading on fundamental news releases can present some fantastic trading opportunities. However, novice traders are strongly advised to stay on the sidelines during these events for the following reasons; 1) Increased possibility of huge fluctuations in exchange rates, 2) price action acting in contradiction to technical analysis. 3) price already factored into fundamental news releases, resulting in little price action movement. 4) market disappointment, resulting in unexpected swings in price action, 5) a lag In price action while markets assimilate data, and where this can often cause price spikes and reversals.
Therefore, unless a trader is highly skilled with regarding to trading on fundamentals only, our advice would be to take note off data releases and then wait until such time as the markets have returned to the normal ebb and flow, and then continue with trading via technical analysis!

Categories
Forex Videos

Introduction To Fibonacci – The Forex Formula

Leonardo Bonacci, AKA Fibonacci, was a mathematician, born around 1170, and became known for developing the Fibonacci sequence: where each number is the sum of the two preceding ones, starting from 0 and 1. Such as; 0, 1, 1, 2, 3, 5, 8, 13, 21, 34, 55, 89,144, and on to infinity.

From this theory, the ancient Greeks founded the Golden Ratio, AKA Golden Section, Golden Mean, and Divine Proportion (proportions) where many things in the universe and in nature can be measured by such Golden Ratios.
In Forex, the most commonly used Fibonacci ratios are: 38.2%, 50%, 61.8% and sometimes 23.6% and 76.4%. These ratios are better known as retracement levels and are used in technical analysis to help traders establish support and resistance levels and areas where a trade might turn in direction.

Traders simply place their Fibonacci retracement tool onto their chart and set position ‘1’; the lowest point in a move and then drag the tool to position ‘2’, the highest point of a move. The tool will automatically open retracement levels on the chart showing dividing lines with individual ratios of 23.6%, 38.2%, 50%, 61.8%, and 100%. The idea is that the swing high on the trader’s chart will be followed by a pullback or retracement, and then the trader must decide at which level, if any, the price action will stall and then continue its upward move. For example, if the pullback falls to the 23.6% and then continues higher (above our initial high point), this would be considered a strong bullish move. A slightly weaker bullish move would be indicated by a pullback to the 38.2% retracement line. Therefore, the shorter the pullback, the more likelihood of a stronger push higher and continuation of the trend. See our article, Introduction To Elliot Wave Theory – Accurately Predicting Forex trends.
This above set-up is used for a bullish move on a Forex pair. If the trader wishes to look at a bearish move, he/she simply places position one at the highest point in a move and drags position 2 to the lowest, in which case the opposite applies to the original set up.

Let’s look at example A: –

This is a 5-minute chart of the EUR:USD pair. We have brought our Fibonacci tool on to the screen at the lowest point of the move (1.0990) as denoted by the X and then dragged it to the highest point of the move (1.1044), as denoted by the second X. The tool has opened six vertical levels on the screen: 0, 23.6, 38.2, 50, 61.8, and 100. These show, in percentage terms, the level of pull back from the lowest point to the highest point. What is evident by the green candlesticks is that there was a strong push high early in the move and then price action entered a ‘sideways’ move before pulling back to the 23.6% line, and then after a move higher, price action pulled back to the 23.6% line and then moved lower, stopping briefly at the 38.2% level before finding support at the 50% retracement level (1.1018) before moving higher. Had a trader bought the pair at the 50% retracement, where price action clearly stalled, they would have seen an 18 pip move to the upside. If this was to be used on every trade and consistently yielded the same results a couple of times a day, it would prove to be an immensely powerful trading tool.
However, we strongly advise not to solely trade with a Fibonacci tool for the following reasons. That initial spike higher in the EUR:USD pair in example A, from 1.0990 to 1.1044, was the result of an unexpected news flash release where the European leaders had agreed on an initial draft acceptance verbiage relating to a breakthrough in the Brexit negotiations, and a possible way forward. These types of news releases are inclined to be put down to rumor and conjecture and can often cause spikes and rapid reversals in price action.

Therefore, while Fibonacci is a very useful way of reading and predicting moves, we will always advocate that they are used in tandem with other tools, such as up to the minute news releases

information (being informed), Stochastics (overbought and oversold) indicators, Bollinger bands and focus on key exchange rate levels, especially round numbers. Also, always be mindful of economic new release schedules, which can also adversely affect price action.

Categories
Forex Market Analysis

Daily FX Brief, October 22 – Major Trade Setups – Brexit Parliamentary Votes Ahead! 

The Canadian dollar continued to trade bullish around three-month high on Tuesday as the market seems to celebrate the re-election of the Liberal government, 

“You did it, my friends. Congratulations,” Trudeau told supporters in Montreal early on Tuesday.

Despite this win, few of the traders are worried that the Liberals need to depend upon an opposition party to govern the government. 

Economic Events to Watch Today

Let’s took at these fundamentals.


XAU/USD– Daily Analysis

On Tuesday, the yellow metal gold is trading mostly muted, pressed down by floating Asian shares that helped growth in trade discussions between the United States and China, but gained relief from a lack of certainty in the trade talk details.

The lack of clarity over Brexit has kept the gold prices inside a rang for almost two weeks. But on Saturday, some of the uncertainty cleared up from the market after the vote of U.K. parliament against PM Johnson’s Brexit Deal. Gold prices reacted to that news on Monday and showed a slight Bearish trend at the starting day of the week.

The precious metal gold continues to maintain a sideways range of $1,500 to $1,480. At the moment, the gold prices are taking a bullish turn as sellers seem to make profit-taking ahead of the Brexit Parliament vote today. 

Besides, the Peoples Bank of China (PBOC) reduced the mortgage rate from 4.25% to 4.20%. The LPR is estimated based on the range over the medium-term Loan Facility each month. 

Gold may face a bearish trend if the yield drops alliance with a bullish breakout over 1.80%. Nevertheless, the yellow metal is displaying flexibility by neglecting losses. The gold mostly falls due to the Central Bank’s hawkish policy.


Daily Support and Resistance   

S3 1472.23

S2 1480.87

S1 1485.48

Pivot Point 1489.51

R1 1494.12

R2 1498.15

R3 1506.79

XAU/USD– Trading Tips

Gold prices drifted lower on Monday and but the Tuesday sessions are bringing bulls. Gold is poised to test resistance around 1,491, which is extended by the bullish trendline resistance. 

Gold may find support bear near the triple bottom support level of 1,480. The MACD histogram is marking in the red with a smooth trajectory that leads to consolidation. Today, consider staying bearish below 1,492 and bullish above 1,480. 


EUR/USD – Daily Analysis

The Euro was little changed at $1.1152, while USD/JPY gained 0.2% to 108.61. The Euro traded mostly unchanged during the day on Monday, as traders didn’ find any reason to determine it’s direction. The market is presently a bit overstretched, so I would not be amazed at all to detect a bit of a pullback occurring.

The Euro has been comparatively low throughout the day on Monday, as we proceed to see much choppiness at the peak of a significant move. 

Studying the 4-hour chart, the 200-day EMA is also rising beyond the 61.8% Fibonacci retracement mark, a range that should bring much attention as well. With that being said, I am not a tremendous fan of attempting to jump in and begin selling instantly. We need to wait for a few checks; especially, the Brexit Parliament Vote is something than can trigger sharp volatility in the market. 


Daily Support and Resistance

R3: 1.1238

R2: 1.1197

R1: 1.1174

Pivot Point 1.1156

S1: 1.1133

S2: 1.1116

S3: 1.1075

EUR/USD – Trading Tips

The bullish engulfing candle over 1.1100 level pushes the currency pair towards the 1.116 level. The RSI and MACD are yet dispensing a buying bais, though the EUR/USD pair may exhibit retracement till 1.1130 ere dispensing a new bullish trend. 

Consider staying bearish below 1.1156 level today to target 1.1135 on the lower side.


USD/JPY – Daily Analysis

The USD/JPY was closed at 108.598 after placing a high of 108.662 and a low of 108.290. The overall trend remained Bullish that day.

At 4:50 GMT, the Trade Balance for September from Japan showed a figure of -0.10T against the expectations of -0.17T and supported the Japanese Yen. The All industrial activities of Japan for September came in as 0.0% against the expectations of 0.1% at 9:30 GMT.

USD/JPY showed an upward trend in the beginning day of the week, the hopes that U.K. Parliament would approve the re-voting for the Brexit deal caused high-risk factors in the market, and traders started buying USD/JPY under that influence. But when the U.K. parliament denied taking another vote on the same issue, the pair’s upward trend suffered.

Additionally, on Monday, the 10-year U.S. Treasury Bond Yield showed a growth of more than 1.5% and added in the upward trend of USD/JPY.

Furthermore, the White House economic advisor on Monday stated that US-China talks were going very well. If the written agreement would get signed in November, then the December tariff hikes could be avoided. This caused an increased demand for U.S. dollars in the market, and hence, USD/JPY surged.


Daily Support and Resistance

R3: 108.99

R2: 108.78

R1: 108.68

Pivot Point 108.57

S1: 108.47

S2: 108.36

S3: 108.15

USD/JPY – Trading Tips

The USD/JPY continues to trade a bullish channel, which is extending support at 108.350. On the lower side, the violation of 108.350 can extend bearish rally until the 108 level. Overall, the MACD and Stochastics are holding in the selling zone, signaling chances of a bearish bias.

The USD/JPY may find an immediate resistance at 108.57, and that’s I think is a perfect level to open sell positions. On the upper side, violation of 108.57 can extend buying until 108.950

All the best!  


Categories
Forex Market Analysis

USD/JPY Currency Pair Unchanged – Eyes on Brexit Uncertainty!

The USD/JPY currency pair consolidating between the narrow range of 108.29 and 108.48; by the way, the pair hit the high of108.48 so far. The pair dropped from 108.70 to 108.40 on Friday, 

Financial market’s eyes were on the Brexit ending moments, while the Chinese Gross Domestic produce disappointing figures was also a weigh on risk appetite. As well as the stocks were underperforming into the close with the S&P 500 off by 0.4%, although the DAX was down 0.2%, and the FTSE 100 was down 0.4%.

At the Brexit front, the Chinas economy increased at the target rate by 6% in the 3rd-quarter, which boosted the safe-haven demand, whereas the Brexit uncertainty is currently doing the same work.

United Kingdom Parliament voted 322 to 306 in support of Lewtin Amendment to delay Prime Minister Johnson Brexit’s deal with European Union, but the U.K parliament declared an act withholding support until full legislation is passed. So, Prime Minister Boris Johnson requested the European Union for a 3-months delay, but he didn’t sign the letter yet and stating that his plan was still to get approval for the departure deal and leave European Union by 31 October. Notably, the European Union twenty-seven leaders are remained to respond.

On the other hand, the United States’ two-year treasury yields dropped from 1.59% to 1.57%, whereas the ten-year return consolidated sideways between 1.73% and 1.77%. Markets are anticipating 22 basis points of rate cut the 31 October meeting and a terminal rate of 1.21% against 1.88% currently.

Daily Support and Resistance

S3 107.8

S2 108.15

S1 108.28

Pivot Point 108.5

R1 108.63

R2 108.85

R3 109.2

Consider staying bullish above 108.450 to target 108.600 and 108.750 today. On the lower side, 108.200 and 108 are likely to be potential targets. All the best! 

Categories
Forex Videos

Introduction To Elliot Wave Theory – Master The Markets

Introduction To Elliot Wave Theory

The Wave theory was discovered by Ralph Nelson Elliott during the 1930s, where he discovered that stock market movements could often be predicted by a series of trends movements and reversals. Elliott Wave theory is, therefore, a methodology which technical traders use to identify trade entry and exits.

These movements consist of impulsive waves, followed by corrective waves. An impulsive wave is usually composed of five sub-waves (1–2–3–4–5) that moves in the same direction as the trend. A corrective wave is composed of three sub-waves (A-B-C) that moves against the trend.
Let’s turn to example A:

In this example, we can see an Elliot Wave formation. We can see that price action moves from position 0 to position 1 (an impulse wave), with I pull back from position 1 to position 2 (a corrective wave) and where this move is less than 100% of the previous upward move. We subsequently see another impulse wave higher from position 2 to position 3, with I corrective wave, or pull back, from position 3 to position 4 and where this pullback was less than 100% of the move higher from position 2 to position 3. And where this process is continued from positions 4, 5. However, from position 5 we see our pull-back to position 6, but when the subsequent impulse wave higher fails to carry on the momentum above position 5 and fades at position A. We now have scope for an A, B, C corrective move lower.

Now let’s look at example B:

In this chart example of a 4 hour moving time frame of the EUR:USD pair, we can see that on the left-hand side of the charts – where I have denoted an X – price action seems to have bottomed out and then makes a move to the upside, as denoted by the candlesticks. We then see sidewards moving price action until the market reaches point 0. We then have a move up towards the top of the previous price action period in question before moving higher again and peaking at position 1, or the beginning of our impulse move. This had previously been a period of consolidation and where traders will have been waiting to enter trades on a possible breakout from this range, either upwards or downwards.

From position 1 price pulls back, or moves lower (a corrective wave), to position 2 and then moves higher to position 3, while breaking the ceiling above position 1, which was the end of the consolidation period. This shows momentum building to the upside and a possible bull trend forming. From here, we see a further corrective wave lower to 4, followed by a continuation higher to position 5 and where this price action has formed the basis of a classic Elliot Wave movement. This bull trend will be further confirmed if price action moves higher than where it is currently situated to reach position 7 ( the continuation of a Bull trend). However, if the price action stalls, traders may see a trend reversal forming and that would be a confirmation that the wave formation is dominating this move and where price action might move from its current position on the chart at A to a fall to position B, C and lower; a corrective wave.
Traders also read these moves as being sequences of highs and lows, such as a higher highs as shown by position 3 being a higher high than position 1, and where position 5 is a higher high than position 3. They also look for higher lows, such as position 2 being a higher low than position 0. The reverse terminology is used for downward trends.
It is also important to consider that these moves are all forms of stepping stones and can be seen by other technical charts as the result of being overbought or oversold or having reached significant areas, such as key round numbers that traders typically like to trade to and from.
Always remember that technical analysis is simply that: analysis! Technical traders mostly use indicators that form after price action movements have happened, and therefore, these indicators

typically lag behind the market. And while they can be very reliable in terms of establishing trends/patterns, they can never be 100% reliable due to the myriad of permutations going on in the Forex market at any particular given time. The absolute best indicator will always be the current exchange rate, AKA, as price action.

Categories
Forex Market Analysis

Daily FX Brief, October 21 – Major Trade Setups – Brexit Deal Fails to Pass Parliament Vote! 

The U.S. Dollar Index slid 0.3% on the day to 97.28 on Friday. For the first time since December 2018, the index has been down for a third straight week.

The British pound rose 0.6% to $1.2973, posting a four-day rally. On Saturday, the British members of parliament voted to withhold approval of the Brexit deal. It is reported that the U.K. government has asked the European Union for a three-month delay to the Brexit deadline. This morning, the British pound retreated to $1.2919.

Economic Events to Watch Today

Let’s took at these fundamentals.


XAU/USD– Daily Analysis

The safe-haven metal prices consolidating in the narrow range of $1,500 to $1,480 since last Monday, as of now the prices slightly dropped due to traders expected more transparency in the Brexit progress.

At the Brexit front, the United Kingdom Prime Minister Boris Johnson attempted to have a meaningful vote on his Brexit deal on Saturday. Still, the U.K parliament declared an act withholding support until full legislation is passed. Therefore, Prime Minister Boris Johnson requested the European Union for a 3-months delay.

On the other hand, the Peoples Bank of China (PBOC changed the loan rate from 4.25% to 4.20%. The LPR is set based on the range above the medium-term Loan Facility rate every month. 

Gold may come under pressure if the yield ends consolidation with a bullish breakout above 1.80%. However, the yellow metal is showing resilience by ignoring losses. The gold mostly drops due to the Central Bank hawkish decisions.

The United States’ ten-year Treasury is currently unchanged around 1.75%. Interestingly, the benchmark yield is also lacking a clear directional bias since October 15. 

At the US-China trade war front, China’s Vice Premier Liu He stated that the China and United States are on the development track and that they completed the phase one agreement. 


Daily Support and Resistance


S3 1472.23

S2 1480.87

S1 1485.48

Pivot Point 1489.51

R1 1494.12

R2 1498.15

R3 1506.79

XAU/USD– Trading Tips

The precious metal gold prices remain to trade in the old range of 1,496 – 1,488. On the 4 hour chart, gold has formed an ascending triangle, which is extending substantial resistance at 1,495. Therefore, consider lingering bearish below 1,492 level to target 1,488 and 1,482. 


EUR/USD – Daily Analysis

The EUR/USD currency pair hit the longest weekly rally since July 2018; the pair surged 1.22% last week. Having recovered by 0.54% and 0.33% in the previous two weeks. It should be noted that the reason behind last week’s bullish trends could be Brexit optimism headline and the resulting rally in the GBP.

At the Brexit front, the United Kingdom Prime Minister Boris Johnson attempted to have a meaningful vote on his Brexit deal on Saturday. Still, the U.K parliament declared an act withholding support until full legislation is passed. So, Prime Minister Boris Johnson requested the European Union for a 3-months delay.

It should also be noted that the German Producer Price Index is scheduled to release at 06:00 GMT, and the Bundesbank’s monthly report is scheduled to release at 10:00 GMT. The EUR currency could face bearish pressure if the September PPI figures well below the forecast of -0.1% month-on-month, supporting slowdown fears. 

The shared currency may hit the bearish track if the European Union takes revenge in the return of the United States’ decision to impose tariffs on $7.5 billion worth of European imports.


Daily Support and Resistance


S3 1.1035

S2 1.1094

S1 1.1133

Pivot Point 1.1153

R1 1.1192

R2 1.1212

R3 1.1271

EUR/USD – Trading Tips

The bullish engulfing candle above 1.1100 level leads the EUR/USD pair towards the 1.116 level. The RSI and MACD are still showing a buying trend, but the pair may dispense some retracement until 1.1140 before showing a further bullish trend. 

Consider staying bullish over 1.1153 level today to target 1.1160 on the higher side.


GBP/USD – Daily Analysis

The GBP/USD currency pair flashing red and representing 0.46% losses on the day, by the way, the GBP/USD currency pair currently trading at 1.2914. Additionally, the GBP currency could come under pressure further according to the forecasted by the options markets.

The GBP/USD currency pair options market is down on GBP currency since April. Moreover, the investors are adding bets for a decline in the Pound currency due to fading Brexit optimism.

One-month risk reversal (GBP1MRR), a gauge of calls to puts on the GBP fell by -1.70 on Friday, but it is currently found at -1.65. Friday’s figures were the weakest level in 6-months. On the positive note, the gauge had surged to a 21-month top of 0.125 on October 11.

The decline from October 11 high of 0.125 to October 17 low of -1.70 hints the investors were anticipating the United Kingdom parliament to put obstacles on Prime Minister Boris Johnson Brexit’s agreement.

As we know, the Super Saturday burned all the expectations due to the U.K parliament declared an act withholding support until full legislation is passed. Meanwhile, Prime Minister Boris Johnson requested the European Union for a 3-months delay.


Daily Support and Resistance

S3 1.2635

S2 1.2784

S1 1.2876

Pivot Point 1.2932

R1 1.3025

R2 1.3081

R3 1.3229

GBP/USD – Trading Tips

The GBP/USD is trading sharply bullish above but within a bullish channel. The bullish channel is giving support around 1.2900 level. The GBP/USD has formed a test bar pattern on the 4-hour chart, which is suggesting a bullish trend in the Cable.

The next support stays at 1.2900, and resistance is likely to remain at 1.3050 today. Consider staying bullish above 1.2932 today. 

All the best!  


Categories
Forex Market Analysis Forex Signals

USD/JPY Testing Lower Edge of Bullish Channel – Can We Expect Buying?

The USD/JPY currency pair traded bullish to hit the three-months high at 108.94 before declining to 108.40. As of writing, the USD/JPY currency pair is trading near the 108.40s and touches away from the 200-day Moving Average.

Brexit developments left a positive sentiment on the market, and the investors got encouragement from the progress between Turkey and Syria wherein the ceasefire was formed by the United States announced by the VP Pence in a press conference during the United States session.

However, third-quarter earnings statements were the main focus that raised the benchmarks, and subsequently, the Dow Jones Industrial Average, DJIA, ended with an increase of approximately 26 points, or 0.1%, near 27,028. Consequently, the safe-haven currency Japanese lost its haven appeal despite US September industrial production came worse than expected. The figure fell by -0.4%m/m against estimates of -0.2% while August was revised to +0.8%m/m from +0.6%m/m.

As for yields, the United States 2-year treasury yields increased from 1.58% to 1.64% due to the Brexit headlines then fell back to 1.60%. Markets are still expecting 20-basis-points of a rate cut at the 31 October meeting and a terminal rate of 1.24% against1.88% currently.

Japanese inflation data for September reported with the headline Consumer Price index in at 0.2% Year over Year (YoY) vs. the expected 0.2% & prior 0.3%.

  • Japan CPI (YoY) sep: 0.2% (est 0.2%, prev 0.3%).
  • Ex fresh food (YoY): 0.3% (est 0.3%, prev 0.5%).
  • Ex fresh food, energy (YoY): 0.5% (est 0.5%, prev 0.6%).

USD/JPY – Technical Analysis 

On the 4 hour chart, the USDJPY is trading bullish above 108.400, and above this, we can expect the USD/JPY to go after 108.900. It’s the bullish channel, which is keeping the safe-haven pair supported.

Daily Support and Resistance
S3 107.69
S2 108.18
S1 108.4
Pivot Point 108.67
R1 108.89
R2 109.16
R3 109.65

In the case of a bearish breakout, the USD/JPY pair can drop towards 108.000 level. Therefore, the traders may consider staying bullish over 108.400 and bearish below the same to capture quick 30/50 pips on either side.
All the best!

Categories
Forex Market

Trading Energy Commodities – Crude Oil, Coal & Natural Gas

Introduction

Energy belongs to that category of commodities, which has the most significant impact on our daily lives. Energy prices affect the cost of almost everything that we consume on a daily basis, including the clothes we wear, the fuel we put in our cars, and the electronic gadgets. They, in turn, determine the increase or decrease in the prices of homes, hospitals, schools, etc. We cannot imagine ourselves in a world without energy.

The unit that is used to define the quantities of energy is the British thermal unit (Btu), which measures the heat content of fuels. According to the Energy Information Agency (EIA), every year, worldwide energy consumption exceeds 575 quadrillions Btu and is expected to reach 736 quadrillions by 2040.

Major energy commodities

Highly traded energy commodities are from non-renewable energy sources, except for ethanol and electricity generation. These commodities are very liquid when it comes to trading. Traders can also invest in these commodities through ETFs and CFDs.

Crude oil

Crude oil is one of the most actively traded commodities in the world. The price of crude oil affects many other commodities, including natural gas and gasoline. Crude oil comes in different grades. Light Crude oil is traded on the New York Mercantile Exchange (NYMEX). This type of crude oil is popular because it is the easiest to distill into other products. The next grade of oil is Brent Crude oil, which is primarily traded in London and is seeing the increasing interest. The last grade of oil is the West Texas Intermediate (WTI) oil from U.S. wells. The product is light and sweet and is ideal for making gasoline. The reports for crude oil are found in the U.S. Energy Information Administration (EIA) reports. This report is released every Wednesday around 10:30 PM ET. Traders take investment decisions based on the data of this report.

Coal

Coal is a fossil fuel that is formed from dead plant matter trapped between rock deposits. Coal is used as an energy source for hundreds of years. This mineral generates 41% of the global supply of electricity and plays a crucial role in other industries. The top 5 coal-producing countries are China, the USA, India, Australia, and New Zealand.

Natural gas

Natural gas is formed either by methane-releasing microorganisms in swamps or by pressurizing organic material deep underground. Three major reserves for natural gas are Canada, USA, and Russia. This commodity has many applications, from electricity generation to fertilizers. Natural gas futures and ETFs are available for traders and investors. The price of natural gas depends on the demand and supply of the commodity itself.

Energy commodities can also be traded through Forex Brokers these days. Many of the credible and regulated and unregulated Foreign exchange brokers allow their customers to trade all the major energy commodities like Crude Oil, Coal, and Natural Gas.

Factors affecting the prices of energy commodities

  • Market growth
  • Energy efficiency
  • Population growth
  • Electricity penetration
  • Industrialization in developing economies

Conclusion

Investors who want to invest in the energy sector should track the indices of that sector. These indices measure the production and sale of energy. One can also monitor the performance of energy company shares prices. Energy company’s revenue depends on the price of the commodity they are selling. Other factors include production costs, competition, and interest rates. That’s about Energy commodity. Cheers!

Categories
Forex Market Analysis

Daily FX Brief, October 18 – Major Trade Setups – Risk Appetite Rises Amid Brexit Deal! 

On Friday, the U.S. dollar trades bearish after the U.S. dollar slid to a nearly eight-week low in the prior session, keeping gold prices underpinned. 

European Union leaders collectively supported a new Brexit agreement with Britain on Thursday. The British Prime Minister Boris Johnson is facing a battle to ensure the U.K. parliament’s support for the deal if he is to get Britain outside of Europe on October 31.

The risk sentiment improved yesterday due to the announcement of the United Kingdom and the European Union that they looked the Brexit deal. Still, the Brexit deal concerns continued to increase because the markets are worrying about the United Kingdom Prime Minister Boris Johnson’s probabilities of getting the approval for the Brexit deal by the U.K. parliament.

Economic Events to Watch Today

Let’s took at these fundamentals.


XAU/USD– Daily Analysis

The safe-haven-metal prices dropped despite the weak China GDP data, and the drop came at the prices due to the markets were digesting headlines regarding Brexit and the US-China trade war.

U.S. Gold Futures for December delivery dropped 0.2% to $1,494.95 per ounce by 1:05 AM ET (05:05 GMT).

The risk sentiment improved yesterday due to the announcement of the United Kingdom and the European Union that they looked the Brexit deal. Still, the Brexit deal concerns continued to increase because the markets are worrying about the United Kingdom Prime Minister Boris Johnson’s probabilities of getting the approval for the Brexit deal by the U.K. parliament.

Moreover, China’s 3rd-quarter GDP rose slower than expected. Chinese stocks dropped after the release of the data, but the safe-haven gold didn’t get any benefit from this.

Continuing trade tussle with the U.S. will keep under the eyes. Therefore, China said on Thursday that it believed to be in the last phase of the trade agreement with the United States. At the same time, China gave a warning that the United States has to cancel new tariffs for a full trade deal.

China’s Ministry of Commerce spokesman Gao Feng also said that we expect that both nations can continue to work together to more progress in discussions. As soon as possible, we will reach on a phased deal as well and make new progress with the help of canceling tariffs.


Daily Support and Resistance

S3 1462.89

S2 1476.9

S1 1484.38

Pivot Point 1490.91

R1 1498.39

R2 1504.92

R3 1518.93

XAU/USD– Trading Tips

Gold prices continue to trade in the same range of 1,496 – 1,488 as investors focus mostly stay on the Brexit deal and Sterling pairs. Technically, the precious metal gold has formed an ascending triangle on the 4-hour timeframe, which is extending substantial resistance at 1,495. Thus, consider staying bearish below 1,496 level to target 1,488 and 1,484. 


EUR/USD – Daily Analysis

The EUR/USD currency pair found below the 100-day Moving Average of 1.1137, and the pair hit the high of 1.1140 on Thursday due to the headline that the United Kingdom and European Union officials teams (E.U.) have reached a Brexit departure deal.

The upward rally suddenly stopped near the 100-day Moving Average in the overnight session, possibly due to the concerns that the United Kingdom Parliament may reject the deal.

Looking forward, Prime Minister Boris Johnson will face a strongly divided parliament on Saturday, because all the opposition will try to delay the agreement in parliament and another election. Moreover, Boris Johnson Brexit deal already rejected once by the Northern Irish ally, the Democratic Unioost Party.

According to the entire situation, we can say that the chances of the United Kingdom parliament approving the Brexit deal by Boris Johnson are too low. The E.U. currency may remain below the 100-day Moving Average due to uncertainty surrounding the Brexit deal.

On the other hand, the equities could remain under pressure in the wake of sluggish China data; as of data, the final data released in the Asin session which was showed Chinas economy improved 6.0% from a year ago in the 3rd quarter, the weakest data sine 27.5 years.

The E.U. and Pound, both of the currencies, will take a buying trend if the Domcarative Unionist Party gives a softening statement about the Brexit deal on Saturday. In such a case, the EUR/USD currency pair could close above the 100-day Moving Average for the 1st time since July 18.


Daily Support and Resistance  

S3 1.0961

S2 1.1036

S1 1.1082

Pivot Point 1.1111

R1 1.1157

R2 1.1186

R3 1.1261

EUR/USD – Trading Tips

The EUR/USD has come out of the sideways range of 1.1020 – 1.1070. The pair is now holding above 1.1070 level, which is currently working as a support.

The bullish engulfing candle above 1.1100 level is suggesting the chances of further buying in the major currency pair. The RSI and MACD are indicating a buying trend, but the pair may show some correction until 1100 before showing a further bullish trend.

Consider staying bullish above 1.1100 level today to target 1.1160 on the upper side.


GBP/USD – Daily Analysis

The GBP/USD currency pair hit the bearish track, representing a 0.30% declines on the day, mainly due to the fears that Prime Minister Boris Johnson could fail to approve the new Brexit deal in the United Kingdom parliament on coming Saturday.

As of writing, the GBP/USD currency pair currently trading around the 1.2850, having hit a high of 1.2990 on Thursday. By the way, it was the highest level since May 13.

Moreover, the GBP currency took a strong buying trend during the European trading hours due to the report that the United Kingdom and the European Union have reached a Brexit departure deal.

The GBP/USD rose to 5-months highs, but it was short-timed because the optimism decreased on the realization that the United Kingdom parliament could deny the deal.

In an amazing Saturday meeting, the first since 1982, the parliament will vote on approving the new Brexit deal.

Looking forward, Prime Minister Boris Johnson will face a strongly divided parliament on Saturday, because all the opposition will try to delay the agreement in parliament and another election. Moreover, Boris Johnson Brexit deal already rejected once by the Northern Irish ally, the Democratic Unioost Party.


Daily Support and Resistance


S3 1.2396

S2 1.2636

S1 1.2764

Pivot Point 1.2877

R1 1.3004

R2 1.3117

R3 1.3357

GBP/USD – Trading Tips

The GBP/USD is trading within a bullish channel, which is extending support around 1.2850 level. The GBP/USD has from inside up bar pattern on the 4-hour chart, which is suggesting a bullish trend in the Cable.

The immediate support prevails at 1.2800, and resistance is likely to stay at 1.2900 today. Consider staying bullish above 1.2800, where the violation of 1.2870 can also lead the GBP/USD towards 1.2910. 

All the best!  


Categories
Forex Basic Strategies

Trade Breakouts Like A Pro With This ‘Breakout Trading Strategy’

Introduction

In previous strategies article, we have discussed the ‘Turtle Soup Strategy by fading the Donchian channel.’ We hope you tried that strategy. In today’s article, let us discuss how to trade breakouts. We will also cover some of the best strategies used by professional traders to trade breakouts. Aggressive traders prefer trading this Breakout strategy compared to the conservative ones.

What is breakout trading?

To understand breakout trading, it is necessary to know the two important types of breakouts.

Defining a breakout

Breakout trading is an effort to enter the market when price moves outside a defined price range. The price range could be between support and resistance or between swing high and swing low. It is good if the breakout is accompanied by high volume.

Breakout of support and resistance

This type of breakout is quite simple and straight forward. The breakout of support and resistance should ideally happen with a big and bold candle. Because that shows the genuineness of the breakout. In the below chart, the candle closes well above the support and resistance level. In the below figure, it can be noticed instantly. A rule of thumb is that the bigger the breakout candle, the better it is.

Breakout of swing high and swing low

Very similar to the support and resistance breakout, this type of breakout has an additional filter. The filter is nothing but to trade the setups that offer the best outcome. In a swing high and swing low breakout, we enter the market after the price crosses a long-time high (1hr or 4hr high). That high should be followed by a strong sell-off. Conversely, the same is true for a swing low.  A trader must backtest their strategy before applying them to the live markets.

Best Breakout Strategy

To increase the accuracy of the signals generated by this strategy, we use an indicator known as Volume Weighted Moving Average (VWMA). It is a very simple technical indicator that is used for volume analysis. It resembles a moving average but is based on volume. It gives extra information than just the price of an asset. This indicator can be found on most of the trading platforms by default, and when plotted, it looks something like this.

Step 1: Identify the swing highs from where the market sold off very strongly and traveled a fair amount of distance. Mark that price on the chart.

The first step of a breakout strategy is to identify those levels and mark them as breakout trading levels. This step is important because we should pay attention to only significant and clear levels.

The resistance level we have identified in the above figure is a significant level. If you look closely, you will see rejection off the resistance level took the price down three times. Whenever there was a rally, the swing high stopped the price.

Step 2: Wait for a break and close above the resistance level

Once we have identified the swing highs, it’s just a game of patience and waiting. Next, we need a breakout candle to close above our resistance level. This is a sign that bulls are in full power.

It is not the end yet. We need confirmation from the VWMA indicator. This will give us the green signal to enter the trade in this breakout.

Step 3: Buy when the price closes above the VWMA

The final step of the breakout strategy is confirmation from the VWMA indicator. You should buy only if the VWMA is stretching above the close of the breakout candle. Visually, the VWMA should look stretched up. It is better if the moving average inclination is towards the upside.

Let’s understand this more clearly with the help of a chart.

In the above chart, prior to the breakout, the VWMA moved gradually higher, and after the breakout happened, the VWMA moved aggressively higher. This shows a strong presence of volume behind the breakout.

We haven’t still talked about placing our stop loss, which is crucial to reduce your losses in a trade. We also need to know where to book profits. This brings us to the final step of the strategy.

Step 4: Put stop loss below the breakout candle and take profit when you see a break below the VWMA

It is obvious to place the protective stop loss below the breakout candle. Because, if the price breaks below the candle that initiated the breakout, it will quickly tell that it was a false breakout.

Our take profit technique is automatic because a break below the VWMA suggests no more buyers are willing to participate in the current rally. We want to book profit at the early sign of market rollover.

We have taken the example of a buy trade. The same rules apply for a sell trade but in reverse. The best breakout strategy can be used in all market trends, whether up or down.

Bottom line

One of the advantages of our breakout trading strategy is that you’re trading with the momentum of the price. A final tip for all the traders while using this strategy is that, if the breakout happens after a big news event, then it is likely that big institution money is behind this breakout. When both fundamentals and technicals are working for you, the probability of success increases. We hope you find this strategy useful. If you have any questions, please let us know in the comments below. Cheers!

Categories
Forex Videos

Leverage & Margin – Why You Keep Blowing Your Account


Leverage & Margin – Key Principles Of Forex

There are two main ways that retail Forex traders are able to have enough financial capacity to access the Spot (instantly executed trades opened on the spot) retail Forex markets in the United Kingdom: one is to spread bet, which is classed as gambling and where you bet on a currency pair going up or down and where you pay no income tax on your winnings. The other way is to trade Contracts for Difference (CFD), and where your winnings are subject to capital gains tax and any losses can be offset against taxable income.

Retail Forex traders who trade via CFDs are able to gain market access due to a system of leverage (AKA margin ratio). Therefore, a trader with a fairly modest trade account of £1000 pounds is able to effectively borrow/control up to 30,000 units (AKA volume) of the base currency, or £30,000 pounds in order to trade the Pound against the US Dollar. This also depends on the pair’s exchange rate (GBP:USD where the Pound is the base currency. A base currency has more value than the counter currency on a unit by unit basis).

In this example, this would equate to approximately £3 per pip movement while trading in GBP:USD should the trader decide to take on the maximum allowed leverage ratio of 1:30 while utilising 3 mini lots per trade (100,000 units is equal to one standard lot, 10,000 is one mini lot and 1,000 is one micro lot).

But it wasn’t always like this: due to the the high number of novice retail traders (70% official statistics) losing all their deposited funds after just six months of trading, leveraged CFDs were restricted in 2018 by the European Securities Markets Authority (ESMA), in order to protect retail CFD Forex traders. ESMA imposed limits on regulated brokers who provide retail CFD Forex trading of 30:1 for major FX pairs and 20:1 for non-major pairs. Before this brokers were able to offer leverage of up to 1:500.
Therefore, leverage provides traders with the ability to trade large amounts of currencies for very little outlay. However, leverage is a double edged sword; because, by its nature it can greatly help to amplify winnings, but, it also increases the risk of substantial losses! One of the biggest reasons why retail traders losie their money is due to a lack of understanding and the misuse of leverage.

Margin

A Margin requirement is the amount of capital in an account that will be set aside in the form of a deposit, by the broker, in exchange for leverage, each time a trade is opened. Margin is calculated by the trader’s level of leverage and is effected by floating profit and loss and can therefore fluctuate up and down. Also, the more open trades the more margin will be set aside by the broker. Should traders open too many trades, or their account start to incur losses, they are more likely to receive a margin call from their broker as they approach their margin limit (a request to put more funds into their account to bring the margin into line) which would only happen in the event that the overall account position was running at a loss, assuming there were more than one trade open. If traders ignore margin calls they run the risk of their trades being closed out by the broker.

Margin call example

A trader wishes to buy EUR:USD with an account size of €1000 and buys 1 mini lot of 10,000 units with a leverage of 1:30, his/her margin is calculated as 10,000 divided by 30 = 333.
Therefore, the traders margin for that trade would be €333.00. If the trader loses money on the trade and comes close to the required margin of €333.00 in their account they would face a margin call / request to add further funds into the account. If the trader refused or neglected to do so, the broker would close the trade on their behalf.

Typically a traders platform will show a running profit and loss in the form of; account balance and fluctuating equity (this will differ if trades are open), the margin being taken up by open positions, free or available margin, and margin level shown as a percentage.
Leverage and margin requirement differ from one asset class to another. But, consistency and careful risk management is essential while considering how to factor these into your trading.

Categories
Forex Course

8. Which Is The Right Currency Pair To Buy & Sell?

Introduction

By now, we know that trading Forex market involves trading of currencies pairs rather than just a single currency. The working mechanism of this is quite different from that of the stock market. In the previous lessons, we learned how the buying and selling of a  currency pair work. However, this is still insufficient to take a trade on these currencies. Though you have the knowledge of which pair is strong or weak, choosing the right currency pair plays a vital role. There are times where you make a loss even if your analysis of the currency was correct. In this lesson, we shall try keeping you away from incurring these events.

Strength of the currency pairs

As discussed in the previous lessons, in a currency pair, we have something called as a base currency and a quote currency. To brush things up, the left currency on currency pair is called the base currency, and the one on the right is called the quote/counter currency. To trade the forex market successfully, one must do their analysis on both the currencies of the currency pair. For example, if you wish to trade the EURUSD currency pair, having knowledge in either EUR or USD is insufficient. Instead, you must have insights on both the currencies. This will not only prove the rightness of your analysis but will also reduce your risk considerably. Now, let us understand this in detail.

The answer to ‘why’ you must consider both currencies in a currency pair in your analysis rather than just one currency lies in the previous lessons. Well, when you go long/short on a currency pair, you are actually buying one currency and simultaneously selling the other one. So, if you analyze only one currency, you will be blindly be hitting a buy or sell on the other currency. Hence, it becomes equally important to consider the other currency in your analysis as well. For example, if you buy AUD/USD thinking that AUD is strong, there is no certainty that the prices of this pair will rise, as USD has its role to play as well.

Choosing the apt pair to trade

The answer to choosing the right currency pair is self-explanatory. It is always recommended to choose a currency pair where one of them is strong, and the other is equally weak. For example, let’s say in the USD/CHF pair, USD is strong, and CHF is weak. Ideally, one would buy a currency that is strong and would sell a currency pair that is weak. Coming to the case of USD/CHF, if you buy this currency pair, you are buying the USD and even selling CHF at the same time. Hence, you are basically doubling your success probability or halving your failure probability. If we were to visualize this currency pair, the USD would be shooting to the north while the CHF would be dropping towards the south. And in the form of a currency pair (where the base currency is taken into consideration), the chart would visually look in one direction, which is upward.

Apart from strong vs. weak pairs, you can even trade strong/weak vs. neutral pairs as well. But, note that it is highly risky to trade a strong vs. strong or weak vs. weak as the overall direction of the market becomes hard to predict. We hope you understood this concept. Now, let’s take a quick quiz.

[wp_quiz id=”44815″]
Categories
Forex Market

What Should You Know About Trading Metals?

Introduction

We have discussed metal commodities briefly in the previous article. In this article, let’s understand trading metals in detail. Trading precious metals were only possible by wealthy investors in earlier days. But now, every retail forex trader gets to trade these metals with the advent of CFD trading. Hence, a lot of investors hold metals in their portfolios by investing a significant chunk of their money in metals. Metals create a balanced portfolio as they are considered a hedge against inflation. Metals such as gold and silver can be treated as safe-haven bets since their scarcity provides support to their value.

Gold – The highly traded metal

Among all the metals, Gold is the most actively traded metal. This metal possesses intrinsic properties such as durability, malleability, and conductivity. These properties offered by gold account for its superiority. They also find their primary use in jewelry making. As with other commodities, forces of demand and supply determine prices of gold. The gold market is also influenced by risk parameters, market sentiment, and inflation trends. Investors turn to gold and invest heavily when there are signs of a global economic slowdown. The slowdown could be due to reasons like recession, political crisis, or government debt.

Because of these reasons, Gold is mostly traded by long term investors. They only look for signs of gold entering a bull or bear market. The trend can be determined with the help of equity indices. A strengthening economy means weaker demand for gold.

Silver

Silver is seen as the best metal trading option right after gold. It has its own merits. This metal is used in various industries, making it more sensitive to business conditions and trading activities. Hence, the prices of silver are more volatile than that of gold. So we can say that silver is ideal for short term traders.

Platinum

Platinum is also seen to gain value during times of economic and financial crisis. However, because of scarcity in the availability of platinum, the price is much higher compared to gold. Therefore it is less frequently traded. It still is a robust and safe-haven alternative, especially when the Gold is overbought in the market. The industrial use of Platinum is kind of similar to that of silver, making it price-sensitive to business conditions. In recent times, the demand for platinum in industrial usage is reduced by the increased use of catalytic converters.

You can trade metals with Forex brokers too

One of the important advantages of trading metals is that they give protection against inflation, which is not offered by any other financial instrument. Taking this into consideration, a lot of Forex brokers offer above mentioned precious metal trading against major currencies such as the US dollar, Japanese yen, Euro, Australian dollar, Canadian dollar, and British pound. You will also find metals such as Copper and Palladium on their platform. Some of the metal currency pairs include XAU/USD (Gold), XAG/USD (Silver) and XPT/USD (Platinum).

Conclusion

Even if it obvious, we must tell you that buying and selling precious metals do not mean the actual delivery of these commodities. We trade these metals over the counter (OTC). In this type of trading, there is high risk involved. So make sure you have a risk management plan in place, else there is a possibility of you losing all the money you have in your trading account. Some vital risk management tools include stop-loss and order cancellation. They will always protect the balance of your account.

Categories
Forex Videos

Market Analysis Part 1 – Mastering The Forex Market

Market Analysis – Know Your Market!

The Forex market dances to the beat of its own drum! Unlike investing in the stock market, where stock prices tend to go up and down depending on the performance of an individual company, the movement of currencies in the Forex market is wholly more complicated:
For example, all currencies are traded in pairs, such as the British Pound against the US Dollar, or the Euro against the Pound, etc. Therefore, not only do you have to be fully aware of the fundamental economics of one country’s currency, but you also have to be aware of the fundamental economics of the counter country’s currency of the pair you are trading. The two styles of investment are like chalk and cheese!
When it comes to knowing the Forex market, there are three major factors to consider when trading: Fundamental analysis, Technical analysis, and Market sentiment. Let’s look at these three in more detail: –

Fundamental analysis is the way of studying a particular country’s currency by analysing economic, social, and political forces in order to gauge the current and future outlook of that country’s economy and, therefore, the current and future strength of its currency.

Technical analysis is the study of price movements of a particular currency via the analysis of charts and where certain technical tools are used in order to study historical price action in order to predict future price movements.

Market sentiment Is the overall feeling that traders have regarding a particular currency and where that sentiment might be in contradiction to technical and fundamental analysis of a currency and may therefore cause a trader to abstain from a trade (or to trade counter to his/her indicators) even though the technical and fundamental indicators are telling him/her to pull the trigger.

A good example of market sentiment would be that at the time of writing the British pound is currently being bought against most of the other major currencies, including the US Dollar, the Euro and the Japanese Yen, even though the fundamental indications are that Britain’s economy is slowing and could be exiting the European Union at the end of this month (31st October 2019) without a deal (withdrawal agreement), which could be catastrophic for the British economy. Technical indicators also show that the Pound could move further to the downside, especially against the US Dollar. However, the current market sentiment Is that Britain may find a last-minute deal in order to exit the European Union with an agreement in place, and this would be very good for the British economy in theory, and therefore, the Pound.
And so if the above three components are the major drivers of the Forex market, we should be good to go, yes? Unfortunately not, if only it was that easy! Unfortunately, market sentiment also changes from region to region. For example, the Asian region may have a different market sentiment/outlook from the European or American regions, depending on those markets’ industrial and commercial sectors and their economic activities, including the buying and selling of commodities and goods and services.
Also, the Forex markets operate 24/5, from Sunday night to Friday night (GMT), and market volume and volatility varies from region to region and the different time zones. And as a note of caution, a trader opening a trade at 9 PM (GMT) based on his/her technical analysis, just as the American session is fading, and before the Asian session opens, runs the risk that market sentiment in the Asian area might be contradictory to the US region and therefore adversely affect the outcome of their trade.
Here is an example of how to have a better understanding of trading activity and currency volumes and volatility in the various time zones. Traders are fairly predictable creatures, and most traders work for banks or large financial institutions. These guys and girls are able to independently

move the market with their trade size, which is much much greater than that of retail traders. A retail trader might typically trade a few Pounds/US Dollars or Euros per pip, whereas an institutional trader will be in the hundreds of thousands, if not millions per pip. They are usually paid large salaries and are all under pressure to make money for their firms. Therefore, what we usually see is greater volatility in the Forex markets when they arrive at their desks and especially at the beginning of a new session in a particular region because the traders are fresh, eager, and take advantage of the regional time cross over.
Another time of increased volatility and currency volume in the market Is during periods of economic data releases in the various countries. Price action during these times can be extremely volatile, and the reaction of the market can often fly the face of market sentiment, technical and fundamental analysis, as traders try to decipher economic data release information and how it might impact on a currency’s exchange rate.

Categories
Forex Market Analysis

AUD/USD Flashing Red As US-China Tensions Dominates! 


The AUD/USD currency pair flashing red and representing losses for the 3rd consecutive day. It’s mainly due to the United States and China’s political tensions and weaker daily Chinese Yaun fix by the Peoples Bank of China.

As of writing, the AUD/USD currency pair is trading at 0.6734, representing 0.20% losses on the day. The pair AUD/USD is flirting with the lower edge of the bear flag on the daily chart.

The United States House of officials approved a bill regarding human rights in Hong Kong on Tuesday, moving the Hong Kong Human Rights and Democracy Act of 2019 a step closer to becoming law.

China warned the United States due to interfering in its internal matters and also gave a warning against the United States policy.

Therefore, the risk assets have come under pressure, and the safe havens like the Japanese Yen and gold were found on the bullish track.

AUD/USD Technical Side

On the technical side, the close above below the 0.6737 will confirm a breakdown and create room for a decline to levels below 0.6520. On the way lower, the pair may find support at 0.6671 (Oct. 2 low).


The pair is trading bearish, and it’s very likely to continue its bearish momentum until 0.6700. The MACD and Stochastics are holding in the bearish zone, suggesting odds of further selling in the Aussie.

Daily Support and Resistance

S3 0.6712

S2 0.6752

S1 0.6773

Pivot Point 0.6792

R1 0.6812

R2 0.6831

R3 0.6871

Consider staying bearish below 0.6745 to target 0.6720 today. All the best! 

Categories
Forex Harmonic

The Gartley Pattern

Harmonic Pattern: Bearish Gartley

The Gartley is probably the most well-known pattern in Gartley Harmonics. Gartley himself said that this pattern represents one of the best trading opportunities. Its profitability remains exceptionally resilient. This is especially true when we consider how old the pattern is and how it has remained profitable in these contemporary trading environments. Pesavento reported (at least I think he was the one who wrote this statistic) that it is profitable seven out of ten times and has remained that way for over 80 years. It is important to remember that all harmonic patterns have stringent ruleset. There is no room for interpretation in the construction of any pattern, and the Gartley pattern is no different.

Rules

  1. D cannot exceed X.
  2. C cannot exceed A.
  3. B cannot exceed X.

Characteristics

  1. X is the high or low of a swing.
  2. It is impossible to project or determine A.
  3. Main Fibonacci levels are 38.2%, 50%, 61.8% and 78.6%.
  4. Precise 61.7% retracement XA for B.
  5. BC projections have two specific Fibs: 127% or 161.8%.
  6. The BC projection must not exceed 161.8%.
  7. Symmetrical AB=CD patterns are frequent.
  8. C retracement has a wide range between 38.2% and 88.6%.
  9. An exact D retracement is 78.6% of the XA move.

Sources: Carney, S. M. (2010). Harmonic trading. Upper Saddle River, NJ: Financial Times/Prentice Hall Gartley, H. M. (2008). Profits in the stock market. Pomeroy, WA: Lambert-Gann Pesavento, L., & Jouflas, L. (2008). Trade what you see: how to profit from pattern recognition. Hoboken: Wiley

Categories
Forex Market

Contract For Difference (CFDs) Explained!

What is CFD?

A contract for difference (CFD) is a form of derivative trading. CFD allows a trader to speculate on prices of global financial markets such as shares, indices, commodities, and of course, currencies. While trading CFDs, a trader gets to bet on both upside and downside movements of the market. The profit and loss for CFD are calculated by taking the difference between the entry and exit prices and multiplying it by the number of units. CFDs always comes with an expiration date, before which you need to close your position. Trading these CFDs may appear sophisticated and complex in the beginning, but once you start trading them, it becomes easy to handle.

Leverage trading CFDs

CFDs are a leveraged product, which means a trader needs to maintain an optimum level of capital in their trading account to execute a trade. As it is leverage/margin trading, this capital can only be a small percentage of the full position’s value. While margin trading allows a trader to magnify their returns, losses will also be more as a trader will lose leverage times the capital he is betting on. Hence it is always recommended to go for less leverage. If you are a novice trader, we suggest you not to go beyond 2X leverage. And obviously, the gains and losses will be based on the value of a CFD contract.

Costs involved while trading CFDs

There are three types of costs a trader may incur while trading CFDs. Each of them is explained below.

Holding cost – At the end of each trading day (mostly at 5 PM New York time), if the positions are open in your account, it will be subject to a charge called ‘holding cost.’ Holding costs will depend on the CFD, direction of the position, and the holding rate.

Spread – CFDs always come with a spread, which is the difference between the buy and sell price. This price is decided by the broker, and it varies from broker to broker. A trader will have to enter a buy trade at the buy price quoted by the broker, and exit using the broker quoted sell price. The narrower the spread, the less the price needs to move in trader’s favor for their profits to start. These spreads are extremely competitive across all the brokers.

Market data charges – For getting live market feed and accurate prices, a trader must pay the relevant market data subscription fees. However, this fee is mostly applicable to stock CDFs and varies from broker to broker.

Things to remember

Like any other market, there are high risks involved in trading CFDs as well. CFDs are complex in nature (at least for novice traders), they carry a high risk, so it is important to do your research before you start trading. Also, since CFDs are leveraged products, losses can easily exceed your total investment. In volatile markets, your account balance can drop down to zero or even to a negative balance in no time. Following best trading practices like proper applying risk management to your trades will increase the chances of profiting.

We hope you find this article informative. Let us know if you have any questions in the comments below. Cheers!

Categories
Forex Course

6. Different Ways Of Trading The Forex Market

Introduction

Forex is a market to trade foreign currencies. It is traded 24 hours electronically over-the-counter, meaning the transactions are performed over the networks around the world. One way to trade the forex market is for one party to buy a currency, and the other to sell it. This method is referred to as spot forex trading. Apart from this, there are other ways to trade the Forex market. And in this lesson, we shall discuss these different ways.

Forex market and its types

If we were to consider the primary forex market asset types, we could find four. They are:

Spot Forex Market

Currency Futures

Currency Options

Currency Exchange-traded funds

Now, let us explain the working of each one of them in detail.

Spot Forex Market

As discussed, in the spot forex market, currencies are bought and sold for a short period of time, based on the current market price (CMP). The prices in this market are settled in cash, on the spot, bases on CMP. Hence, the spot market is also called a ‘cash market’ and ‘physical market.’ The settlement of orders in the spot market takes two days, while in the futures market, it takes much longer.

Spot trading is the most popular form of trading where the majority of the retail traders trade on. There is great liquidity in this market, and brokers even offer tight spreads on them. Apart from retail traders, other participants in this market include commercial banks, central banks, arbitrageurs, and speculators.

Currency futures market

In the currency futures market, the buyer buys a contract of one currency by paying another currency. While the seller of the contract holds the opposite obligation. And this obligation is due on the expiration date of the future. The ratio of the currencies is settled in advance between both the parties (the time when the contract is made). The parties make a profit or a loss depending on the difference between the real effective price on the date of expiry and the settled price.

Currency Options

A currency option is a type of options contract that gives the buyer the right, but not the obligation, to buy or sell a currency pair at a given price before a set time of expiry. To get this right, the holder of the option pays a premium to the seller who is known as an option seller.

There are two types of currency options, ‘Call option’ and ‘Put option.’ A call option gives the buyer the right to buy a currency pair at the strike price before the expiry date. A put option gives a buyer the right to sell a currency pair at the strike price before the expiry date. Currency options are a popular way of protecting against loss.

Since the options are a bit complex, let’s understand them with an example. If you believe that the price of the Euro will rise against the US dollar, you can buy a currency call with a strike price of 1.31000 and expiry at the end of the month. If the price of EUR/USD is below 1.31000 on the expiration day, the option expires worthless, and you would lose the premium paid. On the other hand, if EUR/USD increases to 1.50000, you can exercise the option and buy the currency for 1.31000 (At strike price). By doing this, you have generated high returns on your investment by using options.

Currency exchange-traded funds

Back then, Exchange-traded funds (ETFs) were only available for the stock market. But in the present, ETFs have expanded to the Forex market as well.

A currency ETF is a fund that clubs a single or typically a bunch of currency pairs. These funds are managed by financial institutions and are offered to the public for purchase on an exchange board. Hence, one can trade ETFs just like any share on the stock market.

These are the four primary ways of trading the Forex market. Now take the quick quiz below to know if you have understood the above concepts.

[wp_quiz id=”42577″]
Categories
Forex Harmonic

AB=CD Pattern

AB=CD Pattern

Bearish AB=CD Harmonic Pattern
Bullish AB=CD Harmonic Pattern

The AB=CD Harmonic Pattern is the most basic and common pattern in harmonic geometry. It is the building block of all other patterns. It is the ‘bread and butter’ pattern. Pesavento and Carney recommended that this pattern should be learned first – and reading this article does not qualify for having learned this pattern. Like any form of analysis, you will need to regularly and consistently train your brain and eyes to find this pattern. You won’t be able to get very far in the study of harmonic patterns until you can see this pattern just by glancing at a chart.

Rules

  1. BC cannot exceed AB.
  2. D must exceed B to form a completed AB=CD pattern.

Characteristics

  1. CD is an extension of AB, generally from the Fibonacci ratio of 1.27% to 2.00%.
  2. CD’s slope is steep or longer/wider than AB.
  3. BC often corrects to the Fibonacci ratios of 38.2%, 50%, 61.8%, or 78.6%.


AB=CD Pattern Reciprocal Ratios

Point C Retracement BC Projection
38.2% 24% or 261.8%
50% 200%
61.8% 161.8%
70.7% 141%
78.6% 127%
88.6% 113%


Sources: Carney, S. M. (2010). Harmonic trading. Upper Saddle River, NJ: Financial Times/Prentice Hall Gartley, H. M. (2008). Profits in the stock market. Pomeroy, WA: Lambert-Gann Pesavento, L., & Jouflas, L. (2008). Trade what you see: how to profit from pattern recognition. Hoboken: Wiley

Categories
Forex Market Analysis Forex Signals

Gold Steady Below 50 EMA – Brace for a Breakout! 

Gold prices trade sideways in a narrow trading range of 1,495 – 1,490 as expectations of improvement in U.S-China trade discussions were moderated and ahead of a summit that will decide how Britain departs the European Union.

Technically, the precious metal gold is facing stiff resistance at 1,495. The 50 periods EMA and double top pattern are keeping the XAU/USD bearish below this level.


The formation of a series of Doji and Spinning Top candles is suggesting a weaker number of bulls in the market. Typically such pattern drives the bearish trends in the market.

The MACD and Stochastics are tossing in red and green territory, suggesting neutral bias among traders. Continuation of a bearish trend can trigger sell-off until 1,485.

Trade Setup 

Entry – Sell below 1,495

Take Profit – 1,484

Stop Loss – 1,498

All the best!

Categories
Forex Harmonic

Harmonic Geometry

Gartley Harmonic Pattern Example: Cipher Pattern

Harmonics – Gartley Geometry

Out of the myriad of different approaches and methods of Technical Analysis, there seems to be one particular method that draws new traders to it more than Gartley Harmonics. People see these wonky triangles on a chart and automatically assume that because it looks so complicated and esoteric, they should probably learn these patterns right away. If that sounds like yourself, stop reading the remainder of this article and come back once you have learned the fundamentals of technical analysis. And certainly, don’t implement a new and complicated form of technical analysis like that harmonic geometry you’re your trading until you can look at a chart and tell what patterns exist just by glancing at it. Folks – I need to repeat this: Harmonic Geometry takes time to learn – this isn’t like learning about support and resistance. It’s not a topic that you can read about, understand, grasp, and learn in one weekend and then implement into your trading. The best way I could explain the time it takes to learn Carney’s harmonic structures is comparing it to the time it takes for a person to be able to look at a chart using the Ichimoku Kinko Hyo system and know, just by looking, if a trade can be taken and what the market is doing. That’s the best comparison I can find. Until you can look at a chart and within 10-20 seconds identify an important harmonic pattern on that chart – without having to draw it – then you should not use this in your trading. You need to become an expert in the analysis part before you start to trade with it.

I believe we should be calling these patterns Carney Harmonics or Gilmore Harmonics because Gartley never gave a name any designs – the genius work Bryce Gilmore and Scott Carney did that in his various Harmonic Trader series books. Scott Carney is the man who discovered and named a great many patterns and shapes that we see today. And Carney’s work is some of the most developed and contemporary work of Gann’s and Gartley’s that exists today. But the understanding and application of Carney’s and Gilmore’s patterns have been woefully implemented by many in the trading community. Any of you reading this section or who were drawn to it because of the words ‘harmonic’ or ‘Gartley’ must do two things before you would ever implement this advanced analysis into any trading plan:

  1. Read Profits in the Stock Market by H.M. Gartley – this is the foundation of learning and identifying harmonic ratios.
  2. Read Scott Carney’s Harmonic Trader series: Harmonic Trading: Volume 1, Harmonic Trading: Volume 2, and Harmonic Trading: Volume 3.

There are a series of other works by expert analysts and traders that address Gartley’s work and are worth reading, such as Pesavento, Bayer, Brown, Garrett, and Bulkowski. Do not consider their work merely supplementary – I find their work necessary to fully grasp the rabbit hole you are attempting to go down. Harmonic Patterns are an extremely in-depth form of analysis that encompasses multiple esoteric and contemporary areas of technical analysis. If you think finding the patterns and being able to draw them is sufficient to make a trading plan, you will lose a lot of money. Additionally, some words of wisdom from the great Larry Pesavento: An understanding of harmonics requires an in-depth knowledge of Fibonacci.

Harmonic Geometry, in a nutshell

In a nutshell, Harmonic Geometry is a study and analysis of how markets move and flow as a measure of proportion from prior price levels. These proportional levels are measured using Fibonacci retracements and extensions. When these patterns (triangles) complete, they create powerful reversal opportunities. Carney calls the end of these patterns PRZs – Potential Reversal Zones. The significant error that many new traders and analysts make when they find a complete pattern is the same problem many new traders make with any new tool, strategy, or method: they don’t confirm. Make no mistake: Harmonic Patterns are powerful. But like any analysis or tool, it is not sufficient to take a trade. Harmonic Pattern analysis is just one tool in your trading toolbox. And like any toolbox, you need multiple tools to tackle the various projects and goals you want to achieve.

Harmonic Trading Ratios

Contrary to popular belief, Gartley did not utilize Fibonacci levels or ratios in his work. Nonetheless, harmonic ratios are based on three classifications of harmonic ratios: Primary Ratios, Primary Derived Ratios and, Complementary Derived Ratios. As you develop a further understanding of the various patterns and their ratios, you will come to appreciate the very defined structure of this type of technical analysis.

Primary Ratios

  • 61.8% = Primary Ratio
  • 161.8% = Primary Projection Ratios

Primary Derived Ratios

  • 78.6% = Square root of 0.618
  • 88.6% = Fourth root of 0.618 or Square root of 0.786
  • 113% = Fourth root of 1.618 or Square root of 1.27
  • 127% = Square root of 1.618

Complementary Derived Ratios

  • 38.2% = (1-0.618) or 0.618 squared
  • 50% = 0.707 squared
  • 70.7% = Square root of 0.50
  • 141% = Square root of 2.0
  • 200% = 1 + 1
  • 224% = Square root of 5
  • 261.8% = 1.618 squared
  • 314% = Pi
  • 361.8% = 1 + 2.618

Elliot Wave and Harmonic Geometry

Ellioticians are very aware of the strong connectedness that Gartley’s and Carney’s work has within Elliot Wave Theory. There are significant elements between the two types of technical analyses that create a mutual symbiosis. However, while they are very similar, it is crucial to understand that there are some significant differences between the two.

Elliot Gartley
Dynamic, Flexible. Static, Definite.
Wave counts are more fluidly labeled. Each move is labeled either XA, AB, BC, or CD.
Many variations and intepretations No variation permitted.
Wave alignment varied and malleable. Each price point alignment must be exact.

The combination of Elliot and Gartley is powerful, and Gartley Harmonics can help confirm Elliot Waves. The following articles will describe, in further detail, specific Harmonic Patterns.

Sources: Carney, S. M. (2010). Harmonic trading. Upper Saddle River, NJ: Financial Times/Prentice Hall Gartley, H. M. (2008). Profits in the stock market. Pomeroy, WA: Lambert-Gann Pesavento, L., & Jouflas, L. (2008). Trade what you see: how to profit from pattern recognition. Hoboken: Wiley

Categories
Forex Market Analysis

Daily FX Brief, October 15 – Major Trade Setups – Investors Back from Holiday! 

The U.S. dollar stabilized on Monday, with the ICE Dollar Index edging up 0.1% on the day to 98.46.

The euro slipped 0.1% to $1.1027, halting a three-day rally. Official data showed that the eurozone industrial production grew 0.4% on month in August (+0.3% expected). Later today, the ZEW German Current Situation Index for October will be reported (-23.6 expected, -19.9 in September).

The British Pound retreated 0.3% to $1.2609, following a surge of more than 3.0% in the prior two sessions. Finnish Prime Minister Antti Rinne told reporters that he does not think it would be possible for the European Union and the U.K. to agree on the terms of a Brexit deal in time for the summit of leaders starting Thursday. Meanwhile, U.K.’s jobless rate for the three-month to August will be released later today (steady at 3.8% expected).

Economic Events to Watch Today

Let’s took at these fundamentals.


XAU/USD– Daily Analysis

The safe-haven metal prices rose but still below the key level of $1500 due to fresh uncertainty between the United States and China trade talks. The U.S. gold futures for December delivery inched up 0.2% to $1,499.02 during the Asian session before taking a bearish turn ahead of the European session.

The gold prices recovered as China now wants to do more trade discussions before signing the critical phase one trade deal. The Chinese attitude appeared to contradict the U.S. President’s contention on Friday that both nations were very close to making a deal.

Besides, China wants Trump to finish the scheduled tariff hike in December. Treasury Secretary Steven Mnuchin announced CNBC in an interview that he anticipates that both nations couldn’t reach on the deal due to the December hike.


Daily Support and Resistance

S3 1430.45

S2 1459.63

S1 1474.37

Pivot Point 1488.82

R1 1503.56

R2 1518

R3 1547.19

XAU/USD– Trading Tips

Gold has also exhibited choppy trading in a narrow range of 1,497 – 1,489. A bullish breakout of 1,496 can extend buying until 1,502 level whereas, the bearish breakout of 1,489 level is likely to continue selling until 1,481 level and 1,474. Today 1,494 is a crucial level to focus, as gold can stay bearish below this and bullish above this level.


EUR/USD – Daily Analysis

The EUR/USD currency pair found on the Doji candlestick pattern which indicates traders’ indecision. The EUR/USD currency pair hit a high and low of 1.1043 and 1.1013, and the trading area remained the same as it was on Friday. The EUR/USD continues to maintain a sideways range of 1.1063 and 1.1001. 

At the German Zew Survey front, Economic Sentiment (Oct), which is scheduled to release at 09:00 GMT, is anticipated to print at -27.3 against-22.5 in September. Whereas, the current is expected to come in at -26, marking a deterioration from September’s -19.9 reading. 

Upbeat expectations may get a strong buying trend in the shared currency. However, a bullish daily close could remain elusive If the markets turn risk-averse due to the negative China producer price index data, which was released in the Asian trading hours.


Daily Support and Resistance


S3 1.091

S2 1.0972

S1 1.1005

Pivot Point 1.1034

R1 1.1067

R2 1.1096

R3 1.1158

EUR/USD – Trading Tips

The EUR/USD currency pair trading sideways in tight trading limits of 1.1043 and 1.1001. A close above 1.1043 would suggest a resumption of the rally from fresh lows around 1.0879. Conversely, a close below Monday’s low of 1.1043 would mean an end of the recovery rally.

An upward channel of the EUR/USD is still intact, and the major currency pair continues to trade within this range of 1.1043 and 1.1001. Consider taking buying positions over 1.100 level to target 1.1050 and 1.1070. On the flip side, bearish bias can be seen under 1.1000 until 1.0976 and 1.0856. 


GBP/USD – Daily Analysis

The GBP/USD currency pair got to the highest level since January 2018. The investors are expecting Brexit breakthrough and continuing bets to position for a rally in Pound.

As of writing, the GBP/USD currency pair is currently trading at 1.2618, found on the highest track on the day. 

One-month risk reversals (GBP1MRR), a gauge of calls to puts on the GBP, increased above zero on Friday and currently stands at 0.25, the highest level in 21 months.

The possibilities of Britain securing an orderly departure from the Europan Union have lost during this week due to the comments by the Finlands Prime Minister that time has finished.

However, the GBP currency could continue its bullish momentum as there are some renewed sentiments regarding anther Brexit summit, most probably at the end of this month.

Additionally, the British Pound may get buyings if the United Average Earnings (Aug) releases against past expectations. The data is scheduled to release at 08:30 GMT.

On the negative note, if the data release against the expectation and if any negative news comes concerning Brexit, then the GBP/USD currency pair could hit the bearish track sharply. 


Daily Support and Resistance


S3 1.199

S2 1.2289

S1 1.2469

Pivot Point 1.2588

R1 1.2768

R2 1.2887

R3 1.3185

GBP/USD – Trading Tips

Technically, the GBP/USD continues to trade bullish in the wake of a stronger Sterling. The pair has completed 38.2% Fibonacci level at 1.2592 and now holding above this level, looking for a solid fundamental reason to determine the next movement.  

On the upper side, the GBP/USD is likely to face strong double top resistance around 1.2700. Breakout 1.2700 can trigger further buying until 1.12759. Let’s keep an eye on 1.2588 now to take quick trade opportunities.

All the best!  

Categories
Forex Market

Everything You Need To Know About The Forex Currency Pairs

In the previous articles, we have discussed the overview of the Forex industry as a whole. In this article, let us understand in detail about the currency pairs which Forex is fundamentally about.

How does it work? 

A currency pair is a code representing the interaction of two different currencies. In that pair, the first currency is known as the Base currency, and the second one is called the Quote currency. When you are buying a currency pair, you are essentially buying the base currency and selling the quote currency. It is vice-versa for selling.

When you see a currency quoted as 1.32., it means you can exchange 1 unit of base currency for 1.32 units of the quote/counter currency. When the value of currency changes, it is always relative to another currency. If the value of GBP/USD changes from 1.26345 to 1.26460 the next day, it means that the Pound has appreciated relative to U.S. dollar or U.S. dollar has depreciated relative to Pound as it will cost more USD to purchase 1 Pound.

What are the major currency pairs?

The most liquid currency pairs are known as major currency pairs. These are the pairs where USD is involved either as a quote currency or base currency. Some of the most popular currency pairs include EUR/USD, USD/JPY, GBP/USD, USD/CHF, and USD/CAD. They represent some of the largest economies of the world and are traded in high volumes. These currencies also have low spreads, which is good for traders.

Minor or cross-currency pairs

Cross-currency pairs are nothing but the crosses of major currencies. They do not include the USD in them. Some of the popular cross-currency pairs include EUR/GBP, EUR/JPY, and EUR/CHF. Even though the trading volume of these pairs is significantly low compared to the major currency pairs, they do contribute with a large amount of volume to the Forex market. Let’s understand more about the volatilities and preferences of these minor currencies.

  • Predicting the EUR/GBP currency pair is most difficult compared to other currencies.
  • Traders prefer trading EUR/JPY as they believe it is easier to forecast, thus making it a popular cross-currency pair.
  • EUR/CHF is also popular because of the fact that the Franc is a safe-haven currency. It is traded during times of high volatility.

Here we have only discussed the EUR crosses. We recommend you to explore more cross-currency pairs and understand each of their volatilities. There is another type of currency pair known as Exotics. In this type of currency pairs, one currency is Major while the other an upcoming currency. Examples – USD/TRY & USD/MXN.

Commodity currencies

Australian dollar and New Zealand dollar are the currencies that are greatly influenced by commodity prices. The Australian dollar is greatly affected by mining commodities, beef, wool, and wheat. Aussie (AUD) is strongly influenced by China as these two countries are huge trading partners. USD/CAD is also one currency that is affected by commodities like oil, timber, and natural gas. The Canadian dollar price movement is strongly related to the U.S. economy. New Zealand, however, is heavily influenced by news release of agriculture and tourism. Along with commodities, the effect of central banks and reserve banks shouldn’t be underestimated. Changes in monetary policy from either of the country’s banks will lead to huge volatility.

The point we are trying to make here is that each of the currency pair’s price movements is influenced by some of the other external factors. As you start your journey in trading Forex markets, you will understand these influencing factors in detail.

What moves these currency pairs?

As discussed above, there a lot of independent factors that move the price of these currencies. But the fundamental factors are interest rates, economic data, and politics. Let’s understand these in detail.

Interest rates – Central banks raise or reduce interest rates to maintain financial stability. This increases demand for currencies whose interest rates are high, as investors get a higher yield on their investments.

Economic data – Economic releases are reports that give a glimpse of the nation’s economy. Relevant economic data include CPI, Non-farm payroll, GDP, Retail sales, and PMI. This data will have a positive or negative effect on that country’s currency.

Politics – Trade wars, elections, and changes in the ruling government introduce instability, which reflects in the Forex market. The decision the government’s take can boost or depreciate the economy.

Which currency pair should you trade? 

If you are new to forex, choose the currency pair which has the most liquidity. Always start with Major pairs before exploring the others. Analyze the fundamentals of a currency. If you know technical analysis, you can combine it with technical indicators to know and understand when to trade. Do not use leverage; even if you do, use appropriately so that you don’t wipe out your account. To learn more about Forex trading from the very basics, you can sign-up for our free Forex course here. Cheers!

Categories
Forex Videos

Mastering Chart Patterns Part 1 – Forex Academy

There are two important ways that people trade the currency markets: The first system is by way of fundamental analysis, such as trading based on macroeconomics, including interest and exchange rates and national productivity. The second method is by way of technical analysis. In this section, we will be looking at technical analysis. Traders look at charts with different time frames to show them a picture of how a particular financial asset is moving/trading over a particular time frame (up or down, or sideways). They will then use this information to decide the direction of their trade.

So let’s start with diagram A. In this chart, we can see the daily price action (movement) of the Euro Dollar against the US dollar (EUR:USD) pair and where the current exchange rate is quoted at 1.09837. This particular chart is the most basic with just a simple line graph which starts on the left hand side of the chart and where you can see that the line graph is going up and down in a random-looking fashion, while capturing the exchange rate on the chart on an hour-by-hour basis, and where the pair ends up to the right of the diagram, which shows the current exchange rate.

In the diagram we can see some peaks and troughs, and we can see some sideways moving price action, however, if you were expected to use this information only, to place a trade, you would find it very difficult indeed to gauge when to get into the trade and went to get out.
One of the most common features that traders like to use in technical analysis is Japanese candlesticks.

Here in diagram B, we have exchanged the line graph in diagram A for the candlesticks. For each daily time frame, a candlestick will open and close. In this example, the green candlesticks denote a movement to the upside during a one 24 hour period, and the red candlesticks show movement to the downside for a 24 hour period. The different types and shapes of the candlesticks are used to determine when a particular currency pair may be stalling in either direction. We will look at the shapes of candlesticks and how traders use them to interpret movement in more detail later on in this course.

In diagram C, we can see another tool that traders like to use in technical analysis to define direction of price action is the use of bar charts. Each bar consists of 3 lines, two small horizontal lines, one to the left and one to the right of the vertical. At the beginning of each time frame the exchange rate will open with the small horizontal line on the left-hand side of the vertical line and then price action will move upwards, or downwards (or it may not move at all along the vertical line at all) and then at the end of the time frame we can see the horizontal line on the right-hand side denoting where price action finished at the end of the period.

In diagram D, we have reverted back to the candlestick chart. However, now we have added tools which are widely regarded as the most commonly used in technical analysis. First of those tools is an orange line which goes through the candlesticks from left to right. This is a moving average. In this case, the line calculates the top and bottom of the previous nine candlesticks and denotes it as a continuous line on the chart. Traders can easily change the parameters of the moving average depending on their style of trading. However, the basic principle is that if price action is moving upwards above the moving average, it may continue to do so, and if price action comes below the moving average, it may show that a trend is developing to the downside.
At the bottom of the chart, we can see an independently placed tool on the chart, which is called the MACD (moving average convergence and divergence). This consists of 2 features: the first is a histogram which moves upwards and downwards around a zero axis, and it also has two moving averages, which also alternate above the zero-axis and which crossover each other.

If we now turn to diagram E, we have drawn in two vertical blue lines. The first blue line on the 1st of July shows a large red descending candlestick, which takes out the previous six days move and falls underneath the nine-period moving average.

If we now follow the blue line down to the MACD, we can see that the moving averages have crossed over and are moving in a downward direction, and the histogram is also moving in a downward direction towards the zero-axis. Technical traders will see this as an opportunity to go short or sell this particular pair, and in the subsequent candlesticks, we can indeed see that the price action moves in a downward direction. Conversely, on the 5th of August, where we have drawn the blue line, the opposite happens, and price begins to move in an upward direction.

There are many many technical tools to use in your trading. But I’m sure you will agree that the original line graph, while looking chaotic, can be exchanged for tools such as candlesticks, moving averages and the MACD, to more clearly define the direction of a particular currency pair and give you the edge in your trading.

Categories
Forex Market Analysis

Daily FX Brief, October 14 – Major Trade Setups – U.S. China Partial Trade Settlement Plays! 

On Monday, the market sentiment remains risk-on as traders weight the U.S. – China partial trade settlement. Traders, the exports of China to the United States declined 10.7% in terms of the greenback. While the U.S. imports fell to 26.4% through that era, a Chinese customs spokesperson announced on Monday.

Trade disputes with the United States have begun to influence Chinese trade, although the latest Sino-U.S. trade discussions have produced positive outcomes in some fields. 

The recent development surrounding the trade deal between the United States and China indicate a hard way ahead for the United States and China trade officials as any actual agreement didn’t sign yet that could finish the trade war. However, the market is likely to trade risk-on sentiment to price in positive developments. 

Economic Events to Watch Today

Let’s took at these fundamentals.


EUR/USD – Daily Analysis

The EUR/USD currency pair is still trading below the fifty-day moving average and having faced rejection at the critical level of 1.1060, even after the positive news came regarding Sino-US trade truce.

The United States President Donald Trump announced a partial trade deal; due to this, the greenback currency slipped lower, and the risky assets gained bullish momentum.

Meantime, the United States decided to delay taxes increases on $250 billion in Chinese goods. In contrast, the dragon nation is ready to buy $40 to $50 billion in United States agriculture products.

Moreover, Goldman Sachs announced there is a 60% possibility that the 15% tariffs will impose, but not sooner, probably in early 2020.

According to forecast, the EUR/USD currency pair could hit again to 50-day Moving Average if the Eurozone Industrial Production for August, which is scheduled to release at 09:00 GMT, beats estimates figures by a big range. The markets may get hints from the speech by the Europan Central Banks, which is scheduled to deliver at 07:15 GMT.


Daily Support and Resistance

S3 1.091

S2 1.0972

S1 1.1005

Pivot Point 1.1034

R1 1.1067

R2 1.1096

R3 1.1158

EUR/USD – Trading Tips

The EUR/USD currency pair consolidating in the narrow range of 1.1030 and below the 50-day Moving Average at 1.1044, because prominent investment banks reported concerns regarding the reliability of the new trade deal.

The EUR/USD is trading in a bullish channel, which can be seen on the 4-hour chart above. The bullish channel is keeping the EUR/USD supported above 1.1000 level with resistance at 1.1050. Consider staying bullish above 1.100 level to target 1.1050 and 1.1070. Selling can be seen below 1.1000 until 1.0976 and 1.0856. 


AUD/USD– Daily Analysis

AUD/USD currency pair consolidates in the narrow range around 0.6780, mainly due to China’s mixed trade data. China’s trade figures in the Chinese Yuan (CNY) terms represented that Trade Surplus expanded to CNY 280 billion during September from 239.6 billion flashed in August. Additional details on the same format mention Exports declining -0.7% against +2.6% previous, whereas Imports are falling -6.2% against -2.6% earlier.

On the U.S. Dollar (USD) front, the headline Trade Balance figures increased by $39.65 billion against $33.30 billion estimates whereas Imports and Exports follow the suit of CNY figures. Imports plummet 8.5% YoY against -5.2% expected while Exports lag behind -3.0% market consensus to -3.2% on the year-on-year basis.

Therefore, the Australian dollar traders didn’t get a clear picture of the Chinese trade situation, whereas the overall sentiment remains bullish due to the United States and China trade truce.

The recent development surrounding the trade deal between the United States and China indicate a hard way ahead for the United States and China trade officials as any actual agreement didn’t sign yet that could finish the trade war. However, the market is likely to trade risk-on sentiment to price in positive developments. 

China recently rejected the U.S. ambassador visa, which could hyper the Trump administration toward China during the 2nd phase of talks. Eventually, all investors will keep their eyes on the fresh clue from the trade deal between the United States and China as the first phase is cleared.


Daily Support and Resistance

S3 0.6712

S2 0.6752

S1 0.6773

Pivot Point 0.6792

R1 0.6812

R2 0.6831

R3 0.6871

AUD/USD– Trading Tips

The AUDUSD is trading bearish after testing the double top level of 06800. Below this level, the AUDUSD has formed a tweezers top pattern, which suggests bearish bias among traders. This could trigger a bearish trend in the AUD/USD below 0.6800 level. 

On the lower side, the AUD/USD may gain support at 0.6700, the 38.2% Fibo level, and 50% retracement at 0.6750. Let’s look for selling traders until these levels are met today. 


GBP/USD – Daily Analysis

GBP/USD currency pair hit the bearish track and representing 0.37% losses on the day, mainly due to declining certainty for the Brexit deal. By the way, the pair is presently trading around 1.26, having hit a high of 1.2645 in Asian trading hours.

The GBP currency still on the selling track, due to the comment by Britain and the European Union on Sunday that much work will be required to secure a deal on Britain’s departure from the bloc.

Therefore, the risks of the GBP selling sentiment in the Europan session is high. However, if the news flow will turn positive, then the contrary view in the Sterling could be reversed. Kathy Lien from B.K. Asset Management observes that the Pound is rising to levels above 1.28 ahead of the Brexit deadline of October 31.

On the other hand, the eyes remain on the trade talks between the U.S. and China. Such as both sides completed the one stage of the bigger trade deal on Friday. However, Chinese media told that China would not be more confident about future negotiations.


Daily Support and Resistance

S3 1.199

S2 1.2289

S1 1.2469

Pivot Point 1.2588

R1 1.2768

R2 1.2887

R3 1.3185

GBP/USD – Trading Tips

Technically, the GBP/USD has disrupted the double top resistance mark of 1.2536, and this point can keep the Cable bullish over this point until 1.2760. 

At the moment, the GBP/USD is trading above 38.2% Fibonacci level at 1.2592. Breakout of this market can trigger further retracement until 1.2525. Let’s keep an eye on 1.2585 today to capture quick trader opportunities.

All the best! 


Categories
Forex Course

5. How Large & Liquid Is The Forex Market?

When compared to other markets like the stock and commodity market, the foreign exchange market is the largest in the world in terms of size and liquidity. In this lesson, we shall go over some insights on the size and liquidity of the forex market.

Where is the Forex market headquartered?

The stock markets across the world have different central exchanges where all the transactions are processed. But, in the case of the forex market, there is no central exchange (physical counter) where the transactions can be processed. In fact, this market runs electronically, connected by a network of banks. This, in short, is called an interbank market or an over-the-counter (OTC) market. Hence, this enables traders to trade in the forex market from anywhere in the world. Also, this is one of the reasons for its high volume of trading.

Forex market’s volume

The amount of money traded in the forex market is humongous. Being the most traded market, the value of it reaches up to $3 trillion. The number is made up of all the types of transactions performed in the market. The amount of different transactions is listed as follows:

$1,005 billion comes from spot transactions

$1,714 billion is added from forex swaps

$362 billion accounts for outright forwards

$129 billion for estimated gaps

Currency distribution in the Forex market

There are about seven currencies on which most transactions take place. Out of these currencies, the US Dollar dominates with around 85% of all the operations in the forex market. Next up in the line stands EUR, which is then followed by JPY and GBP. A graphical representation for the same is given below.

Here, the sum of all the variables totals to 200%, as currencies are traded in pairs.

What are the Foreign Exchange Reserves?

They are the assets that comprise banknotes, bonds, deposits, etc. The central bank of a country holds these with two primary purposes. One to maintain the balance payments of a country and the second is to control the confidence in financial markets. These reserves can be held in more than one currency.

According to the International Monetary Fund (IMF), 64% of the world’s forex reserves are made up of the US Dollar. And after USD comes GBP, JPY, and EUR comprising of 4%, 4%, and 2% of the world’s FX reserves, respectively.

Liquidity of the Forex market

Liquidity is simply the possibility to square off a position smooth and quick without causing the market to make a drastic move. In simple terms, liquidity is the level of supply and demand in the market. So, when there are large numbers of buyers and sellers in the market, we can call this market to be highly liquid.

With respect to the Forex market, it is the most liquid market in the world. This implies that the forex market constitutes a large number of participants (buyers and sellers). With high liquidity, one can liquidate their positions much faster and at their quoted price. Moreover, high liquidity causes the prices to move smoothly, gradually, and in small steps. Hence, this even leads to more consistency in the quoting of prices.

Below is the chart of EUR/USD on the 5-minute timeframe. We can see that the prices move smoothly in spite of being in a small timeframe.

Below is the chart of a small-cap stock in the US. Here, we can see that the prices are not moving in a flow, and there are gaps between the prices. And this is solely due to the lack of liquidity in the market.

That’s about the liquidity of the Forex market. We hope you had a good read. Check your learnings by answering the below quiz.

[wp_quiz id=”42489″]
Categories
Forex Market

What Should You Know About Forex Brokers?

Introduction

In the previous article, we have discussed an overview of the financial industry. Now we know that the entire Forex market is about buying and selling of currencies. The majority of these foreign exchange transactions are done by major financial institutions and global organizations. But where do the retail traders like you and I undertake Forex trading? We do it through independent companies called brokers. In this article, let’s understand what a Forex broker is and the different types of Forex brokers existing in the market.

What is a Forex broker?

In the Forex market, buyers and sellers can be thousands of miles apart. So there needs to be a mechanism that matches their interest. This is where a Forex broker comes into the picture. A Forex broker is a platform where the buyers and sellers get to buy and sell currencies. It acts as a middleman between a trader and the market. In simple words, to find a buyer or seller for a particular currency, the broker matches your order with the respective buyer or seller. These brokers are also known as ‘liquidity providers.’

Types of Forex brokers

Even though all brokers in the Forex industry provide the same basic service, there is a difference in their functionality and mechanism. The first thing to look for with every Forex broker is whether they have a ‘dealing desk’ or not. In brokerage firms, the dealing desk refers to a team of traders who manage the broker’s inventory and hedging operations. Nowadays, most of the dealing desks consist of hundreds of traders and analysts.

Brokers that work on dealing desk operate in a closed environment wherein they set their own price rates. They fill their client orders by matching the buy and sell orders of their clients. When a broker uses a dealing desk, they are called as Market Makers.

Brokers that don’t use a dealing desk get rates from the interbank market and process their client orders by linking them directly to institutions, hedge funds, mutual funds, and other brokers. When a broker does not use a dealing desk, they are either known as ECN (Electronic Communication broker) or an STP (Straight Through Processing) broker.

Market Makers

Market Makers (MM) are called ‘dealers’ in the interbank market. They charge a variable spread instead of commission, which is why most of the time, they are accused of manipulating the spread and prices of the currency pairs. Theoretically, the spread should widen or narrow during high liquidity conditions, but MM brokers offer a fixed spread and compete based on the spread.

Electronic Communications Network (ECN) Broker

ECN brokers make their profits from spreads they charge on buy and sell rates or from fixed trade commission. The transactions here are mostly interbank. Because the spreads in the interbank markets are dynamic, ECN brokers prefer charging commissions rather than fixed spreads. This is one of the easiest ways to trade, but this requires a much higher investment capital as clients in the interbank markets only trade large lots. Therefore, trading with ECN brokers requires a minimum account balance of $1000. In addition, there is no guarantee that you will find a buyer or seller in the interbank market at your quoted price. ECN brokers sometimes won’t be able to execute orders at that price, so they issue a re-quote or simply reject the order. These are some of the limitations of ECN brokers.

Straight Through Processing (STP) brokers

Like ECN brokers, STP brokers, too, don’t have a dealing desk. But they use some of the practices of Market Maker brokers to provide flexibility to their clients. They display rates similar to the interbank market rates, and their first priority is to process trades directly in the interbank market, like an ECN broker. If the counterparty is not found, they start acting like a Market maker and match the order with their own client. The initial capital required to trade with this type of broker is relatively lesser compared to ECN brokers.

These are the different types of brokers in the market. So when you are choosing a broker, make sure to select the one that suits your trading style and capital available to trade.

Trading Platforms 

The ‘Market Makers’ provide trading platforms like Act Trader and MetaTrader since their orders are executed at the dealing desk. However, non-dealing desk type of brokers uses direct access trading platforms. They display prices directly from different liquidity providers. The platforms which are best suited for this requirement include Currenex Viking software and Level II software. The trading platform should be chosen in such a way that it suits your trading objectives. We hope this article helped you in deciding that. Let us know if you have any questions in the comments below. Cheers!

Categories
Forex Market Analysis

Gold Slips to 61.8% Retracement – Safe Have Demand Fades! 

On Friday, gold prices reversed from a one-week high after a rumor hinted that China needs to reach an agreement with the U.S. to avoid further acceleration of an open-ended trade. The safe-haven-metal prices slipped due to positive headlines cames regarding the US-China trade war and Brexit.

The stock market traded bullish due to the positive trade news that the United States and China could reach on the positive outcome this week. As a result, the safe-haven gold prices came under pressure. The United States and China may announce a limited trade agreement during this week, avoiding a new increase in trade tension.

The White House stated that the trade talks going unexpectedly well. However, the future positive headlines regarding trade increased the chances of a currency deal this week.

The market is now trading with Risk-off sentiment, shifting all the investment from gold to stock market. Technically, the precious metal gold has dropped from 1499 area to 1479 points amid faded safely have demand.

Earlier gold faced triple top resistance at 1,513 area, which pushed gold prices lower towards 1,479 that marks 61.8% Fibonacci retracement level.

Daily Support and Resistance

S3 1459.04

S2 1480.2

S1 1492.88

Pivot Point 1501.36

R1 1514.04

R2 1522.52

R3 1543.68

What’s Next?

Gold prices can stay bullish above 1,479 area, and closing of 4-hour candles bove this level could drive buying in gold. 

The RSI and MACD have already entered the oversold zone, suggesting bulls are looming around the corner. 

Gold may find an immediate resistance at 1,487, along with support around 1,479. Violation of 1,479 can lead to gold prices to 1,470 later in the U.S. session. 

All the best! 

Categories
Forex Course

4 – Understanding The Mechanism In Buying And Selling Of Currency Pairs

Introduction

The mechanism of the forex market is quite different when compared with other markets like stocks and commodities. In the stock market, we essentially consider a company’s stock to trade. But in the foreign exchange market, we cannot trade a single currency. Instead, we must trade them in pairs.

In the previous lessons, we understood the meaning of base and quote currencies and also the right way to read the symbols. In this lesson, let’s explain how exactly this buying and selling happens in the Forex market.

The working principle

Before getting into the topic, let us understand a few common terms to grip the concept much better.

Long – It is a basic term in trading, which refers to the ‘buying of security.

Short Selling – This term refers to the ‘borrowing’ of security from the broker and selling it at the current market price. You can assume this to be the right opposite of long. Note that Shorting security and selling security are two different terms.

For example, let’s say you went long on a security, and now you wish to close it. To close it, you will have to ‘sell’ it. Here, you are ‘selling’ and not ‘shorting’ the security.

Now, with this on our back, let us get into the working of buying and selling currency pairs.

Going Long on a Currency Pair

When you go long on a currency pair, you actually buy the base currency, and short sell the quote currency. For example, if you go long 100,000 units on EUR/USD, you are buying 100,000 Euros and short selling 100,000 US Dollars.

Short Selling a Currency Pair

Short selling in the forex market is quite different from that of the stock market. In the forex market, when you short sell a currency pair, you will be selling the base currency and buying the quote currency. Hence, shorting in forex is the same as placing a regular sell order.

However, the main motive remains that the prices must decline from the point you executed the short position to generate a profit. For example, if you short 10,000 units of USD/CAD, you are actually selling 10,000 US Dollars and buying the same number of Canadian Dollars. Hence, here, you’re not borrowing a certain amount of currency to go short.

What next?

With the concept of the long and short sell, let us understand how to make a profit from it.

To profit from a long trade, you need the currency pair prices to increase.

To profit from a short trade, you need the currency pair prices to decline.

This also implies that, in a long trade, an increase in the base currency prices will put you in profit, and in a short trade, a decrease in the base currency prices will give you profits.

Example

Consider the current market price of USD/CHF to be 0.9850. Let’s say you went long on this currency pair. The buy/sell mechanism here is simple – you bought the USD (the base currency) and simultaneously short sold the CHF (the quote currency). Hence, to make a profit from this, you need currency pair prices to increase, which in turn means that you need the value of the base currency (USD) to increase or the value of the CHF to decrease because you’ve bought the USD.

This is how the buying and selling of currency pairs work internally. However, since all of this is managed by the broker, all you need to know is if the prices should rise or fall according to the position you took.

In the next article, we will be discussing the sheer size and liquidity of the Forex market along with the perks involved. For now, check if you can get the below questions right.

[wp_quiz id=”42315″]
Categories
Forex Market Analysis

Gold’s Ascending Triangle Set to Break Lower – Eyes On 1,492!

 On Thursday, the precious metal gold prices climbed one-week highs, staying mostly over above $1,500 during the European session. But the scenario seems to change now as the U.S. investors seem to do profit takings in the overbought gold. 

The market sentiment is being driven by two things lately: 

There’s a potential rate cut in the next policy decision by the Federal Reserve. 

The United States and China trade war is damaging the United States economy as well.

The Federal Reserve has already delivered two rates back to back rate cuts so far this year, in the wake of protecting the United States economy record decade-long growth.

Following an FOMC meeting minutes and the Fed Chair speech, the market is focusing on the Jerome Powell announcement that the market participants are possibly expecting another rate cut, and this may not be on the cards this year. So basically, it’s a hawkish statement that drives the bearish trend in the gold prices. 

On the other hand, the traders want more transparency and certainty in the matter of the United States and China trade war. The market is still careful due to conflicting hints from both sides, as trades discussions continued this week.

Gold – Technical Outlook

Recalling our earlier update on gold, the XAU/USD had formed an ascending triangle pattern, which was keeping gold steady below 1,512 resistance level, and it was also extending support at 1,500 level.


Just an hour ago, the XAU/USD violated the ascending triangle pattern on the lower side. Gold may drop further towards a 38.2% Fibonacci retracement level of 1,492. Whereas the violation of 1,492 could lead to gold prices deeper towards 1,485. 

Daily Support and Resistance

S3 1480.69

S2 1493.37

S1 1499.52

Pivot Point 1506.06

R1 1512.2

R2 1518.74

R3 1531.43

Consider taking a sell position below the 1,500 level to target 1,494 and 1,486.

All the best!

Categories
Forex Market Analysis

Daily FX Brief, October 10 – Major Trade Setups – Turkey Triggers Safe Haven Demand!

Earlier today, the financial markets experience extreme volatility after Turkey attacked Syrian rebels. The Syrian Democratic Forces (SDF), which is lead by Kurds, said that civilian areas were targeted by Turkish warplanes and caused a massive panic in the region.

Turkish President Recep Tayyip Erdogan said that the operation named “Peace Spring” has launched with the collaboration of the Syrian National Army against the Kurdish Workers’ Party (PKK) & Daesh Terrorists. He added that the operation was launched to create a “safe zone” to house Syrian refugees after clearing the area from Kurdish militias.


Overall, the focus stays on the GDP and CPI figures from the United Kingdom and the United States.  

Economic Events to Watch Today

Let’s took at these fundamentals.


EUR/USD – Daily Analysis

The EUR/USD currency pair hit the bullish track and struggling to catch break above the crucial level of around 1.1000 due to trade optimism. Moreover, the EUR/USD currency pair could extend its gains if the European Central Bank meeting declares the statement unexpectedly less dovish. 

As of writing, the EUR/USD currency pair took 0.16% gains in the Asian hours as traders sold greenback on trade optimism and announce that the United States is planning to start the currency deal with China. On the other hand, the report came that President Donald Trump may issue a license that will permit a few companies of the United States to supply products to Chinas Huawei.

The pair is currently trading at 1.0987, 21-day moving average. The technical line has been closing bullish move since October 3, and this level is considered as a support for the buyers. A close above the key Moving Average would open the doors for a stronger corrective bullish move, possibly to 1.1110 (September 13 high).

At the ECB front, as we know, the European Central Bank meeting regarding monetary policy is scheduled to happen at 11:30 GMT.

The Central Bank reduced its deposit rate by the 10-basis-points to -0.50% during September and also announced a fresh bond-buying plan that is scheduled to start from November.

Distinctly, the EUR currency may take a buying trend if the ECB meeting underscores the growing dissent within the Governing Council. Moreover, the EUR may come under pressure and hit the bearish bias if the meeting reports increased odds for more rate cut.

The Federal Reserve September meeting released on Wednesday and showed the rising attention between policymakers that markets continue to expecting more rate cuts than the U.S. Central Bank will deliver this year.

Daily Support and Resistance

S3 1.0904

S2 1.0938

S1 1.0956

Pivot Point 1.0973

R1 1.099

R2 1.1008

R3 1.1042

EUR/USD – Trading Tips

The single currency Euro is taking a sharp bullish turn in the wake of a weaker dollar. The pair is facing support at 1.0975, along with resistance at 1.1025. The MACD and Stochastics are also supporting the bullish bias, especially after the EUR/USD has a bullish crossover of the 50-period EMA today. The bullish breakout of 1.1025 can extend buying until 1.1075 today.


USD/JPY – Daily Analysis

During the early Asian session, the USD/JPY currency pair hit the high level following a drop to the 107.00 level. Later, the USD/JPY prices recovered to the 1-weeks high in the last hour.

The USD/JPY currency pair is found on a weekly bullish track after placing a low of 106.560 during the last week. Most of the buying came on sentiments that China is still ready to make a deal with the United States despite the recent development.

The USD/JPY currency pair was marked on the bearish level earlier this Thursday in the nervousness due to the high-level United States and China trade negotiations. The sharp uptick in the pair came as the United States is planning to enter into a currency deal with China as a part of the partial trade deal, although the depressed greenback prices action kept a lid on any strong follow-through.

Despite the positive trade news and the less dovish Federal Reserve meeting minutes, the U.S. Dollar struggled to increase any traction and still on the sideways due to the weaker tone surrounding the United States Treasury bond yields.

Daily Support and Resistance

S3 106.36

S2 106.88

S1 107.17

Pivot Point 107.4

R1 107.69

R2 107.92

R3 108.44

USD/JPY – Trading Tips

Consider the safe-haven appeal triggered by Turkish news, the USD/JPY is holding below the healthy resistance level of 107.700. There has been a sideways movement in the market, as traders are confused about whether to buy JPY on safe-haven or to sell it on U.S. – China trade deal sentiments. 

The USD/JPY may notice a critical resistance at 107.7500, which is extended by the 61.8% Fibonacci retracement levels. On the lower side, the USD/JPY may find support at 106.920. The bullish violation of 107.750 can drive USD/JPY towards 108.04 and 108.50. 


GBP/USD – Daily Analysis

The GBP/USD currency pair found on the recovery track after the bearish session, the pair currently fluctuating between the 1.2225 and 1.2230 area. Cable recovered to the 1.2300 in the wake of a report that the Europan Union is ready to allow a time-limit on the Irish backstop. 

Moreover, the Northen Irish Democratic Unionist party refused the European Union concession on Brexit, and the Europan Union official denied the report and in the consequences, sent the cable pair into the negative area.

On the other hand, the buyers still showing some resilience below the 1.2200 round-figure marks, and some repeated greenback weakness supported limit any further declines. Besides this, the Wednesday FOMC meeting doing little to depress the hopes for yet additional interest rate cut during October. The continued decline in the U.S. Treasury bond yields weakened demand for the U.S. Dollar and turned out to be one of the key factors giving insignificant support to the major.

Moreover, the United Kingdom economic docket could further influence the more extensive market sentiment surrounding the GBP and give some brief trading impetus

Daily Support and Resistance

S3 1.2046

S2 1.2139

S1 1.2175

Pivot Point 1.2233

R1 1.2269

R2 1.2327

R3 1.2421

GBP/USD – Trading Tips

On Thursday, the GBP/USD trade at 1.2233 right above the strong double bottom support level of 1.2220. The overall trend appears sideways as the GBP/USD can proceed to trade within 1.2280 – 1.2108 area. Nevertheless, the bearish breach may prolong the GBP/USD selling until 1.2170 following slight retracements.

All the best! 


Categories
Forex Course

3 – Reading & Understanding The Currency Pairs

Introduction 

From the previous lesson, we know that global currencies are traded in the Forex market. These currencies are exchanged in pairs. We also understood what Major, Minor, and Exotic pairs are. In this lesson, let’s discuss more characteristics of these currency pairs.

Out of the three types of currency pairs, the most traded type are Majors. These major pairs contribute more than 85% of the total Forex trading volume. Prices in these pairs move in tighter spreads, but they are a bit volatile during market opening hours. Major pairs are those who have USD in them. Some of the major pairs are EUR/USD, USD/JPY, GBP/USD, and USD/CHF. The other vital pairings which do not include the US dollar are known as ‘cross currencies.’ Some of these are GBP/EUR, EUR/CHF, EUR/JPY, etc.

Reading a Currency Pair

Since we are talking about currency pairs and the Forex market, it is essential to learn how to read them. Every currency has a three-letter symbol defined by the International Organization for Standardization(ISO), which is straight forward. Below is the terminology for some of the major currencies.

  • British Pound for GBP
  • US dollar for USD
  • Japanese Yen for JPY
  • Swiss Franc for CHF
  • Euro for EUR

To understand the reading of a currency pair, you need to know the meaning of base and quote currencies. The first currency in a Forex pair is called base currency, and the second one is called quote currency. As we know, trading the Forex market involves selling one currency to buy the other. For instance, we sell the base currency to buy the quote currency. Let’s say you are trading USD/CAD. USD is your base currency, and CAD is your quote currency. Here, when we are executing a sell trade on this pair, we are primarily selling USD to buy CAD. And vice-versa if you are placing a buy trade.

How much one unit of the base currency is worth against the quote currency defines the price of a pair. In the above example, if USD/CAD is trading at 1.32267, that means one US dollar is worth 1.32267 Canadian dollars.

Liquidity of Major Pairs

Liquidity in these pairs is the highest when compared to other pairs. The larger the import/export value between two nations, the more liquid the currency pair of these countries will become. EUR/USD is the most liquid pair in the world. Major currency pairs should not be confused as the best currency pairs to trade. Trading a particular currency pair depends more on strategy and market sessions. When we say ‘major,’ we mean the most actively-traded Forex pair. The six most actively-traded Forex pairs are:

  • EUR/USD
  • USD/JPY
  • GBP/USD
  • USD/CAD
  • USD/CHF
  • AUD/USD

One of the reasons behind these currencies being traded so extensively is the political and economic stability associated with these currencies. Big investors feel it is safe to park their money in such economies.

What Should You Trade?

If a currency pair has high liquidity, the volatility of that pair decreases. Currency pairs that are linked with the market openings should be our first choice. For example, it is recommended to trade the US dollar during New York open or trading the Australian dollar during Asia opening, as there will be good volatility during this time. Also, consider economic news releases, technical chart analysis, and other events while choosing the currency pair to trade. For people who have just begun their Forex trading journey, it is recommended to start trading major currency pairs before experimenting with minors and exotics. Now try answering the below questions.

[wp_quiz id=”41992″]
Categories
Forex Market

An Overview Of The Forex Trading Industry

Introduction

Some of the most relevant markets include the Stock market, Futures market, Options market, and Foreign Exchange market. All these markets provide vast trading opportunities, and out of these, Foreign Exchange AKA FOREX is one of the most popular ones. Forex is nothing but the exchange and trade of different country’s currencies. The first Forex trading market was established in Amsterdam nearly five centuries ago, and this explains the rich history of this market.

The Forex market is the largest yet most accessible market in the world. Largest because the daily trading volume of the Forex market is above $5 trillion. To put that in perspective, the average daily trading volume of the NYSE (largest stock market in the world) is just above $20 billion. By this, we can understand the enormous size of this market. Out of this $5 trillion, retail trader transactions contribute 5% to 6%, i.e., about $400 billion. The rest of the transaction volume is from large institutions and businesses.

We also mentioned accessibility because traders have thousands of retail brokers around the globe to choose from. They can start trading currencies in this market with investments starting from just $100. Forex trading is open 24 hours a day and five days a week. It doesn’t operate on weekends. On weekdays, the market doesn’t get closed at the end of each business day, like how the stock market does. Rather the trading shifts from one financial center to others. Some of the major financial centers include London, Sydney, New York, and Tokyo.

What affects the Forex market?

One of the critical factors that most of the experienced traders pay attention to is the macro-economic trend. The forex market reacts to macroeconomic data more than the stock or commodity market. In a stock market, we have companies that are affected by micro-dynamics, which are specific to that company. But that’s not the case in the Forex market. This market is affected and moderated by GDP, unemployment rates, and inflation. The currency could react positively or negatively depending on the data, but after reacting, the trend will be maintained for a long time. The significant pairs to watch during such news releases are EUR/USD, USD/JPY, GBP/USD, and USD/CHF. The rate hikes from the U.S. Federal Reserve is also closely watched by traders around the world.

The rise of algorithmic trading

Banks and financial institutions are adopting algorithmic trading systems powered by technological advancement. Technology is changing traders’ approach towards the market. There is a boom in engineered computer programs that offer new ways of creating orders with faster trade execution. The automated systems have improved speed and precision. This technology is expected to eliminate trading bias and human errors that increase the risk in a trade. Algorithmic trading improves trend analysis that greatly helps beginners in reducing losses. Due to this, traders are getting more time to analyze markets and trends.

Future of Forex market

The Forex is continuously growing. Trading currencies is still not a mainstream profession in many of the third world countries. There are still many people who aren’t aware of the fantastic opportunities this industry has to offer. One of the important goals of the brokerage firms is to get more and more people involved in pursuing trading as a serious profession.

  • Market volatility will rise as newer strategies are being released and used by traders.
  • Strict regulation in the forex market will also attract conservative traders. However, some traders search for unregulated brokers since they provide inexpensive trading services.
  • Paid systems and strategies will continue to grow among wealthy investors.
  • Trading Forex is getting easier and extremely accessible with the advent of smartphone trading applications.

Bottom line

The Forex industry has changed significantly over the years. Many efforts are being made to create a legitimate trading environment as the industry has become more dynamic and ever-changing. Major European regulators are taking serious steps to tighten control of the Forex market. Besides, they are also introducing new rules to forbid high leverage trading to protect investor’s funds.

A known fact about Forex trading is that most traders fail. It is estimated that 96% of the people end up losing. To be in the succeeding 4%, one should have a disciplined approach to the way they trade. Some of the practices include starting with low capital, managing risk, controlling emotions, and accepting failures. If you follow these rules, you are on track to becoming a successful trader.

Also, education plays an essential role for someone to succeed in their Forex trading journey. We at Forex Academy designed a course just for our readers. By taking up this free course, one can learn everything about Forex trading even if they have zero experience. You can find all of our course articles here.

Got any questions? Let us know in the comments below.

Categories
Forex Indicators

Let’s Trade Divergences!

Trading with Divergences

Almost all forms of technical analysis involve the use of lagging indicators – or lagging analysis. There are very few indicators that use any type of leading analysis. That is because we don’t know what will happen. All we can do is interpret what kind of future behavior may occur based on past events – this is the basis of all psychology and significant portions of medicine: we can only predict future behavior by analyzing past behavior. Now, just because most of the tools and theories used in technical analysis are lagging in nature – it doesn’t mean that there is no method of leading analysis.

Divergences are one method of turning lagging analysis into leading analysis – it’s not 100% accurate, but divergences can detect anomalies and differences in normal price behavior. Divergences are useful in identifying when a significant trend may be ending or when a pullback may continue in the prior trend direction. Let’s review some of those now.

Divergences are easily one of the most complex components to learn in technical analysis. First, they are challenging to identify when you are starting. Second, it can be confusing trying to remember which divergence is which and if you compare highs or lows. It is essential to know those divergences themselves are not sufficient to decide whether or not to take a trade – they help confirm trades.

When we look for divergences, we are looking for discrepancies between the directions of highs and lows in price against another indicator/oscillator. The RSI is the oscillator used for this lesson. We are going to review the four main types of divergences:

  1. Bullish Divergence
  2. Bearish Divergence
  3. Hidden Bullish Divergence
  4. Hidden Bearish Divergence

Bullish divergence

Bullish Divergence

A bullish divergence occurs, generally, at the end of a downtrend. In all forms of bullish divergences, we compare swing lows in price and the oscillator. For a bullish divergence to happen, we should observe price making new lower lows and the oscillator making new higher lows. When bullish divergence occurs, prices will usually rally or consolidate.

Bearish divergence

Bearish Divergence

A bearish divergence is the inverse of a bullish divergence. A bearish divergence occurs near the end of an uptrend and gives a warning that the trend may change. In all forms of bearish divergence, we compare swing highs in price and the oscillator. For a bearish divergence to happen, we should observe price making new higher highs and the oscillator making new lower highs.

Hidden divergences

The last two divergences are known as hidden divergences. Hidden does not mean that it is difficult to see or hard to find – rather, it shows where a short term change in direction is actually a continuation move. Think of it as a pullback or a throwback in a larger uptrend or downtrend. Hidden divergences tell you of a probable continuation of a trend, not a broad trend change. If you combine these with common pullback and throwback patterns such as flags and pennants, then the identification and strength of a hidden divergence can yield extremely positive results.

Hidden Bullish Divergence

Hidden Bullish Divergence

A hidden bullish divergence can appear in uptrends and downtrends but is only valid if there is an existing uptrend. It’s easier to think of hidden bullish divergences as pullbacks or continuation patterns. For hidden bullish divergences, we should observe price making new higher lows and the oscillator making new lower lows. The expected price behavior is a continuation of higher prices.

Hidden Bearish Divergence

Hidden Bearish Divergence

Our final divergence is hidden bearish divergence. Just like hidden bullish divergence, hidden bearish divergence can appear in both uptrends and downtrends but is only valid in an existing downtrend. Hidden bearish divergence is identified when price makes lower highs, and the oscillator makes new higher highs. We should observe a resumption in the prior downtrend when hidden bearish divergence is identified.

Key Points

Regular Bullish Divergence
  • End of a downtrend.
  • Often the second swing low.
  • Price makes new Lower Lows, but the oscillator makes Higher Lows.
  • Trend changes to the upside.
Regular Bearish Divergence
  • End of an uptrend.
  • Often the second swing high.
  • Price makes Higher Highs, but the oscillator makes Lower Highs.
  • Trend changes to the downside.
Hidden Bullish Divergence
  • Valid only during an uptrend.
  • Price makes Higher Lows, but the oscillator makes a Lower Low.
  • The trend should continue to the upside.
Hidden Bearish Divergence
  • Valid only during a downtrend.
  • Price makes Lower Highs, but the oscillator makes Higher Highs.
  • The trend should continue to the downside.

Final words

It may be confusing trying to remember which divergence is which and you’ll find yourself asking questions such as, “do I use highs on this divergence or lows?” It’s easier to think about measuring divergences like this:

All Bullish divergences are going to compare lows to lows – lows in price and lows in an oscillator.

All Bearish divergences are going to compare highs to highs – highs in price and highs in an oscillator.

Categories
Forex Basic Strategies Forex Swing Trading

How To Trade The Infamous Turtle Soup Strategy?

In this article, we shall be covering the Turtle soup strategy by fading the Donchian channel, and Connor’s RSI strategy.

What is the Donchian Channel indicator?

The Donchian channel is an indicator that considers the high and low for N number of periods. For this particular Turtle Soup strategy, we will be setting the value of N=20, which accounts for the most recent 20 days.

This indicator works based on the highs and lows made by the market. The channel makes a stair-stepping pattern for every high or low made in a period of 20 days.

Below is a chart that shows the Donchian indicator applied to it.

From the above chart, we can clearly see that the top and bottom lines (blue lines) are moving in the form of a stair-stepping pattern representing the highs and lows over the past 20 days. Precisely, the black arrows represent the highs and lows in a look back of 20 days.

Trading the Turtle Soup Strategy

The Turtle Soup is a strategy developed by a trader and author Linda Bradford-Raschke. She published this strategy in one of her books named “Street Smarts: High Probability Short-Term Trading Strategies.” Talking about history, this strategy was taught to a set of novice traders (called the Turtles) by Richard Dennis and William Eckhardt in the 1980s. Also, this strategy is in reference to a well-known strategy called ‘Turtle Trading.’ Over the years, Linda Bradford-Raschke inverted the logic and reasoning behind this strategy and came up with a short-term trading method using this strategy.

Strategy 1: Adding confirmation to Donchian Channel breakout

This is the typical Turtle strategy.

The Turtle strategy using the Donchian channel is simple. When the market breaks above the resistance line, we can prepare to go long. Similarly, when the market goes below the support line, we can go short.

Here are some of the tips and tricks for using this indicator.

  • When the market breaks above/below the lines, make sure that the price is holding above/below it.
  • The candle that breaks the line must be quite strong.

Trading Example

Consider the below figure. Reading from the left, we can see that the market was holding at the upper line of the channel. Later, a huge green candle broke above the channel. Many would hit a buy at this moment, but we wait for a confirmation. When another candle shows a bullish sentiment as well, we can hit the buy at the point shown on the chart.

According to the original Turtle trading strategy, a stop loss of ‘two volatile units is kept,’ which is equal to n-period ATR x 2.

However, to keep it simple, you can keep the stop loss a few pips below the candle, which broke the channel.

Let’s do the converse

In the above example, we saw the typical way of trading the Turtle strategy. In this set of examples, we shall reverse the logic. That is, we will look to go long when the price breaks below the channel and short when the price breaks above the channel. Let’s consider a few examples for the same.

Buy strategy

Let’s say the market makes a 20 day low and is visible on the Donchian channel. Later, the price comes down to that low and even tries to break below it. Once the price shoots right back up to the line, we anticipate on the buy.

Rules:

  • The new 20 day low must be at least four days apart from the previous 20 day low. So, you cannot compare the low of yesterday and the low of today as the difference is just one day apart.
  • Entry must be 5-10 pips above the previous 20 day low.
  • Stop loss must be placed 1-2 pips below the low of today.
  • Aim for a take profit of 1R.

Sell strategy

The sell strategy is just the opposite of the strategy discussed for a buy. When a 20 day high is challenged for the second time having a gap of at least four days from the previous low, we can look to go short.

Rules:

  • The 20 day high must be at least four days in the past.
  • Entry must be placed 5-10 pips below the 20 day low.
  • Stop loss must be placed 1-2 pip of today’s low.
  • Aim for a take profit of 1R.

Trading examples

Buy example

Below is the chart of the EUR/USD on the Daily timeframe. Starting from the left, we can see that the market came down and made a 20 day low (indicated by the black dotted line). Now that we have the first low, we wait for the price to down to that low in more than four candles (days). And when the price spikes below the prior low and comes back up, we can hit the buy at the encircled region.

As far as the stop loss and take profit is concerned, we can keep a stop loss 2-4 pips below the low of the present candle and aim for a good 1:1 RR on this trade.

Sell example

In the below chart, the market made a 20 day high up to the black dotted line. Later, the price goes above the previous 20 days high yet again. Here, the price holds above the line and then drops below the next candle. So, once it’s below by 5-10 pips from the previous 20 days high, we can go short. And the stop loss and take profit are self-explanatory.

Conclusion

With no disrespect to the turtle trading strategy, we can conclude that this strategy can be used in both ways. This strategy is backtested and proven by a number of experienced traders. Try this strategy in your trading activities and let us know if you have any questions in the comments below. Happy Trading!

Categories
Forex Price Action

Support and Resistance

Support and Resistance

One of the fundamentals of Technical Analysis is the theory and methodology of support and resistance. In a odd turn of events, some of the most advanced methods of identifying support and resistance are not only relatively unknown, but they are some of the original Technical Analysis theories. Some of those methods include identifying support and resistance according to naturally squared numbers, numbers related to an angular nature in Gann’s tools, harmonic ratios, pivots, Fibonacci levels, and other more esoteric methods. For this article, though, the focus is on identifying support and resistance based on prior traded price levels and ranges**.


What are Support and Resistance?

When you hear the word’s support and resistance, the definitions of those words may be the first thing that comes to your mind. Support indicates that something will assist or strengthen while resistance indicates rejection. In Technical Analysis, support means a level that is below the price, and resistance is above price.

The image above shows resistance as a red band and support as a green band. It’s important to understand that support and resistance on a candlestick chart should never be viewed as a static and exact price level. With a chart style that has such dynamic time and price levels, like Japanese candlesticks, support and resistance are an area or range of value. Determining the support and resistance levels requires a ‘zoomed’ out view of the chart. When you get a broader view of the past price action, you can see price levels where price has moved lower and then reversed higher (support) as well as price levels where price move higher and then reversed lower (resistance). The most important levels are those that show past resistance becoming support and vice-a-versa.

Prior Support turned into Future Resistance


Use another chart style to find support and resistance

Renko Chart

While it may seem simple to find support and resistance on a candlestick chart, there are some alternatives. The length of the wicks and body of candlesticks can vary and can add to the confusion. Using a Renko (above) chart simplifies the process of finding support and resistance by reducing the noise on the chart and providing less ambiguity when looking for highs and lows. Take note of how these resistance and support levels are drawn on a price-action-only chart. With a price action only chart, I don’t draw a value area like I would on a candlestick chart. But if you are not comfortable using a price-action-only chart and want to stick to a candlestick chart, then another trick that might help is to remove the wicks from the candlesticks. Look at the side by side comparison below.

Wicks VS No Wicks

Both charts display a weekly chart of the CADCHF pair. On the left, we have a regular candlestick chart with wicks – wicks that are all over the place. The chart on the right is the same as on the left, but with no wicks displayed. You can see how much more clear the tops and bottoms are on the right. This can make it a little easier to spot support and resistance levels.


** It is the view of this author that past support and resistance levels are inefficient for today’s markets. However, the method discussed in this article is part of a foundation of learning that can be applied to future price level analysis.

Categories
Forex Signals

Gold Surge Amid Boosted Haven Appeal – Trade War In Focus!

 Today in the early European session, the safe-haven metal prices slipped due to less expectation of the rate cut by the Federal Reserve. Earlier today, the U.S. Gold was down by 0.6% at $1,495.85 as Fed Rate Monitor Tool showed a high chance for a quarter-point rate cut when the Federal Reserve meets Oct. 28-29 at 69.5 percent, versus 72.7 percent on Monday and 78 percent on Friday. The lowered chances of easing by the Federal Reserve continued to hurt gold in post-settlement trade, sending it under the critical $1500 level.

As of writing this, the precious metal gold prices are surging in the wake of boosted safe-haven appeal amid the uncertainty. China-U.S. trade talks are expected to affect gold’s movement late this week when high-level negotiations between the two sides resume this Thursday.

Trade discussions are expected to manage the gold prices movement during this week when both high-level officials will do talks between the two sides’ resumes on Thursday.

At the Hong Kong front, the government of Hong Kong invoked a colonial-era emergency law to stop protesters wearing face masks. Due to this decision, further made the worst environment, which damage China’s banking facilities and retail outlets in the entire city.

Gold – Technical Analysis 

On the technical front, gold has for Doji pattern at 1,497 area, which has to extend support to gold since the morning while the RSI and MACD are shifting in the buy zone.  


Daily Support and Resistance

S3 1456.57

S2 1476.39

S1 1484.55

Pivot Point 1496.21

R1 1504.37

R2 1516.03

R3 1535.85

Three bullish candles on the 4-hour chart are signaling chances of a further bullish trend. Today, gold may find an immediate resistance level at 1,513 and support at 1,487 level. Consider staying bearish below the triple top level of 1,513 zones. 

All the best

Categories
Forex Market Analysis

Daily FX Brief, October 08 – Major Trade Setups – U.S. China Trade Talks In Focus! 

On Tuesday, the U.S. dollar trades to trade choppy to slightly bullish on the back of no significant economic figures. The range of light United States numbers during the past week increased uncertainties on the assumption that the United States economy will be further elastic as compared to the other economies and pushed investors to start pricing in another rate cut by the Federal Reserve.

Powell Stressed that an Independent Central Bank could make decisions in the long-term best interests of the economy without regard to the political pressure. He also quoted that “the management of Central Bank must be free from the dangers of control by politics and by private interests, singly or combined.”

In previous days, President Trump has criticized the Federal Reserve for not Lowering its Interest Rates enough. In reply to that criticism, Jerome Powell’s statement about central bank independency has raised the possibility that the Fed might not cut its rate further in the next policy meeting.

Economic Events to Watch Today

Let’s took at these fundamentals.


EUR/USD – Daily Analysis

The EUR/USD currency pair consolidating in a narrow range near 1.0975, as we know, the pair were representing 0.06% losses on Monday. It should be noted that the EUR/USD currency pair hit the rejection at the 21-day moving average for the 3rd straight day yesterday. Therefore the figures are presently found at 1.0992. 

On the economic data front, all eyes stay on the German industrial production data, which is scheduled to release at 06:00 GMT, and expectations are high that the German Industrial Production data dropped 0.3% month on month during August, having fallen 0.6% in the previous month. The final number is anticipated to release at -2.7% versus -4.2% in July.

German Factory Orders declined by 0.6% month-on-month in August – the 2nd-straight monthly decline, due to weaker demand from domestic consumers, the official data showed on Monday. 

Additionally, the headline IHS Markit and BME Germany Manufacturing PMI for February, a single-figure picture of the performance of the manufacturing economy, had marked well below 50, indicating contraction.

The statement came that the German recession is generally accepted at this time and price. Therefore, the EUR/USD currency pair will likely remain resilient if the Geman Industrial Production fell according to expectations. The pair may take hints from the United States Producer Price index and comments by the Feral Reserves President Powell.

Daily Support and Resistance

S3 1.0901

S2 1.0939

S1 1.0956

Pivot Point 1.0978

R1 1.0994

R2 1.1017

R3 1.1056


EUR/USD – Trading Tips

On the technical aspect, the EUR/USD may gain support at the critical trading point of 1.0960 level. The MACD and RSI are staying in the bullish territory, implying probabilities of a bullish reversal

A bearish breach of the 1.0967 level can spread selling until 1.0885. While buying can be seen above 1.0960 till 1.1035 levels. 

USD/JPY – Daily Analysis

The USD/JPY currency pair found on the recovery track and traded well in the striking distance of the overnight swing high.

After a bearish break opening at the begin of a new trading week, the USD/JPY currency pair has managed to recover positive traction and returned near 80-pips from an intraday low level of 106.65. Positive figures in the United States treasury bond yields propped the greenback demand and turned out to be one of the critical factors that started the initial support of the uptick.

The momentum gained another boost from some positive comments by the White House economic adviser Larry Kudlow, who said that the U.S. was available for China plans and proposals, but the Chinese companies were not there. Meanwhile, Kudlow noted further that the United States trade officials could make progress between the Sino-US trade war.

The USD/JPY currency pair is trading steady ahead of Fed Chair Speech and PPI figures today as investors seem hesitant to enter the market ahead of the news release. Besides, the highly-expected United States and China trade negotiations in Washington are also keeping the USD/JPY in check ahead of Top-level negotiations scheduled on Thursday.

Meanwhile, Tuesday’s U.S. economic docket, highlighting the release of Producer Price Index (PPI), is under focus, and all eyes will keep on it for fresh impetus. Moreover, the market risk-sentiment and the greenback prices progress could further produce some meaningful trading opportunities together.

Daily Support and Resistance    

S3 105.78

S2 106.47

S1 106.85

Pivot Point 107.16

R1 107.54

R2 107.85

R3 108.54

USD/JPY – Trading Tips

On Monday, the USD/JPY opened with a bearish gap, which is already covered by the end of the day. The USD/JPY pair soared to complete a 50% Fibonacci retracement level at 107.450.  

The USD/JPY is now trading above 50 periods EMA, which is placing a bullish pressure on the USD/JPY at 106.900. The MACD is looming in the buying zone. However, the live histogram is smaller than the previous one, which shows the odds of a bearish reversal. Consider trading bearish below 107.450 to target 106.900. 


GBP/USD – Daily Analysis

The GBP/USD currency pair flashing red and still consolidating in the narrow range just below the 1,2300 handles due to renewed Brexit pessimism. 

The cable found exhibited some intraday bounce during the start of a week. In contrast, a shortage of any substantial progress leads the pair to quickly hit the fresh low level near the 1.2335 level, which is also marked as an important level by 200-period EMA on the 4-hourly chart. 

Considering that the bloc’s leaders observe the United Kingdom Prime Minister Boris Johosn’s new Brexit plan is not enough, uncertainties related to Briaitan exits from the Europan Union, leaving some pressure on the GBP.

The modest pickup in the greenback demand, benefited by the positive rebound in the United States Treasury bond yields and positive trade-related headlines, further helped to the pairs downtick. While, the White House economic adviser Larry Kudlow, who said that the U.S. was available for China plans and proposals, but the Chinese companies were not there, drove some haven appeal in the market.


Daily Support and Resistance    

S3 1.2205

S2 1.2253

S1 1.2271

Pivot Point 1.2302

R1 1.2319

R2 1.2351

R3 1.24

GBP/USD – Trading Tips

On Tuesday, the trading in GBP/USD has changed much as the cable continues to trade bearish. On the upper side, 1.2340 level is extending it a substantial resistance now. The 50 EMA is expected to maintain support at 1.2275, but the new bearish movement in the GBP/USD is likely to challenge the support zone. Consider opening a sell position only below 1.2275 level today. 

All the best! 


Categories
Forex Indicators

MACD – Moving Average Convergence Divergence

The MACD

Fig 1- Chart with MACD. Click on it to enlarge

The Moving Average Convergence Divergence (MACD) is probably one of the most popular and well-known oscillator indicators in any market. It is one of our ‘modern’ indicators; created by Gerald Appel in the late 70s. It is essentially a two-part tool that traders can utilize.

  1. Provides a quick look to see the direction and trend of your market using two lines/moving averages: the MACD line and a signal line.
  2. It provides a divergence detection tool using a zero line and histogram.

The MACD line and the Signal Line

The first of these parts of the MACD is probably the one used most often, the MACD line and the signal line. General strategies related to the MACD is that you should consider taking a buy when the MACD line crosses above the signal line and sell when the MACD crosses below the signal line. Additionally, some strategies suggest more conservative entries based on when the MACD crosses the middle line (0-line).

The Histogram

The second part of the MACD, and perhaps the one that confuses many new traders, is the histogram with the 0-line. The histogram shows the difference between the MACD line and the signal line, basically, is showing the ‘gap’ between the two lines, as they grow and diverge away from one another, the histogram expands. However, the real strength of this is the ability to see divergences.

Pros and Cons

The downsides to the MACD indicator is that it is very notorious for causing whipsaws in traders. Whipsaws can be avoided by not using the MACD as your sole indicator of trade signals. The MACD is an excellent tool to help confirm your trades in a trending market, but it is not suitable for a ranging market. If you are a new trader, the MACD is a fantastic tool to help you train and learn about how indicators work. Spend some time watching markets live on smaller time frames and look at how the MACD works and moves with that market. You will notice things you like (i.e., identifying the trend and strength of that trend) and the things you don’t like (i.e., too many signals/crosses on short time frames).

A word of caution

I would caution against using the MACD in your trading. The MACD is an old indicator, and it is most useful as a tool for analysis on daily timeframes or weekly time frames. Because it is so well known and used so much by new traders, it is used against new traders. It is one of those indicators use to entice new traders into using – like bait. Just like moving averages, the MACD has several strategies that involve a crossover. A crossover strategy is simple to understand and easy to learn the strategy and so many new traders try to use this as one of their first strategies – but it doesn’t work. It may seem like it works, but it doesn’t. Again, the MACD is an indicator that is entirely lagging in nature. It is showing what has already happened, not what will happen. It’s most effective use will be a tool for detecting divergences – but even then, there are better indicators and oscillators out there for detecting divergences.

Categories
Forex Course

2 – Preface To The Forex Market

Introduction

Forex AKA Foreign exchange is the largest market in the world where all the global currencies are traded. It can also be considered as a place where individuals, companies, and banks convert one currency into another. The entire Forex market is decentralized and is maintained by the banks across the globe. On average, the daily trading volume of the whole Forex market is more than $5 trillion. This explains the sheer size and liquidity of this market. Forex market is an essential part of the global economy and is active 24/5 (From Monday to Friday)

The Purpose

Typically, the exchange of goods and services happens for money, and this money is nothing but currency. The respective country’s governments determine the value of that currency. Hence the value of one country’s currency is never equal to that of another. This is the reason why we need foreign exchange to exchange one country’s currency to others. Forex market is essential for any of the global imports/exports to happen, for any employer who needs to pay salaries to their overseas employees, for a tourist who is traveling abroad, etc.

Forex trading

It refers to the buying and selling of currencies that belong to different countries. In Forex trading, the buying and selling of currencies happen at the same time. That is, if a trader is trading EURUSD pair, he/she is essentially selling the USD he has in order to buy Euros. Traders make a profit when they sell a currency at a higher price than the cost they paid to buy that particular currency. This entire process was complicated even a decade ago. But now, with the advent of technology, anyone can start trading by using a lot of online trading systems.

Currency Pairs

As discussed above, the buying and selling of currencies happen in pairs. There are three types of Forex currency pairs. They are Majors, Minors, and Exotics.

Major currency pairs are those where the USD is involved. These are the most frequently traded pairs in the market, and they make up to ~85% of the Forex transactions that happen in a day.

Examples: EUR/USD, USD/JPY, GBP/USD etc.

Minor currency pairs are those that don’t contain USD. They are also known as cross pairs. Euro, Pound, and Yen are the most popular currencies that make up the minor currency pairs.

Examples: EUR/CHF, AUD/JPY, GBP/CAD etc.

Exotic pairs are the ones where one is a major currency, and the other is a small or emerging currency.

Examples: USD/PLN, GBP/MXN, EUR/CZK etc.

Types of Forex markets

Spot market – The physical exchange of the currency pair takes place at the point of trade, i.e., as soon as the price is fixed between buyer and seller. The transaction is settled on the spot or at least within a short period of time.

Forward market – Here, a contract is made between the buyer and seller, where they agree upon a price to exchange the currency pair. This contract will be settled at a date in the future or within a range of future dates.

Futures market – Even in this type of market, a contract is fixed between the buyer and seller. A price is set on a future date delivery. The difference between Forward and Futures market is that in the latter, the contract is legally bonded between the parties.

That’s about the introduction to the Forex market. We hope you had a good read. In the next article, we will talk about some important Forex terms and phrases. Now, let’s see if you can get the below questions right.

[wp_quiz id=”41271″]
Categories
Forex Market Analysis

Daily FX Brief, October 07 – Major Trade Setups – Fed Chair Powell Speak! 

On Monday, the U.S. dollar continues to trade sideways in the wake of mixed economic figures. The series of soft United States data last week increased uncertainties on the assumption that the United States economy will be more flexible as compared to the other economies and pushed investors to start pricing in another rate cut by the Federal Reserve.

At the Fed front, the dollar may trade slightly bearish over the strong market expectation that the Federal Reserve will deliver the rate cut again at its upcoming policy meeting on 29-30 October to support the economy.

Economic Events to Watch Today

Let’s took at these fundamentals.


EUR/USD – Daily Analysis

The EUR/USD currency pair is flashing green and representing 10% gains on the day while the currency pair is currently trading around 1.0980, and the twenty-one-day moving average is found at 1.0996. The EUR/USD currency pair can hit the bullish level above the critical M.A. hurdle. Hence, there are some chances that the pair will continue its recovery trend if the German Factory Orders blow past expectations.

On the other hand, if the German Factory Orders decline more than expected, the EUR/USD currency pair could hit the bearish level and will come under the selling pressure below 1.0950.

The German factory orders data is scheduled to release at 06:00 GMT, and expectations are high that the German factory data will show the pace of decline in August.

Factory Orders are anticipated to decline by 1.5% month-on-month in August, after July’s 2.7% decline. The annualized number is expected to print at -4.6%.

The headline IHS Markit and BME Germany Manufacturing PMI, a single-figure snapshot of the performance of the manufacturing economy, increased slightly to 43.5 during August, but remains well below 50, indicating contraction for an 8-month in a row.

It should also be noted that the possibilities of a twenty-basis-points rate cut by the Federal Reserve during October 30 have turned back higher to 83%. Therefore, the EUR/USD bearish trend could be limited.


Daily Support and Resistance

S3 1.0895

S2 1.0937

S1 1.0958

Pivot Point 1.0978

R1 1.1

R2 1.102

R3 1.1062

EUR/USD – Trading Tips

On the technical front, the EUR/USD may find support at the crucial trading level of 1.0960 level. The MACD and RSI are holding in the bullish zone, suggesting odds of a bullish reversal

A bearish breakout of the 1.0967 level can extend selling until 1.0885. While buying can be seen over 1.0960 until 1.1035 levels. 


USD/JPY – Daily Analysis

USD/JPY currency pair still consolidating in the narrow range, although the pair has managed to hold its neck comfortably above around1-month lows.

After Friday’s price fluctuations, the USD/JPY currency pair started with a bearish break on Monday as the Chinese officials are hesitant to agree to a comprehensive trade deal extended by the United States President Donald Trump. The Japanese Yen’s relative safe-haven status is applying some bearish pressure on the major.

At the Fed front, the strong market expectation that the Federal Reserve will deliver the rate cut again at its upcoming policy meeting on 29-30 October in the wake to support the economy.

The series of soft United States data last week increased uncertainties on the assumption that the United States economy will be more flexible as compared to the other economies and pushed investors to start pricing in another rate cut by the Federal Reserve.

The weaker trend in the United States treasury bond yields was found pushing greenback lower, and at the same time, helped driving a slight bearish movement in the USD/JPY pair today. 


Daily Support and Resistance

S3 105.78

S2 106.33

S1 106.62

Pivot Point 106.88

R1 107.17

R2 107.43

R3 107.98

USD/JPY – Trading Tips

The USD/JPY pair covered the bearish gap that we can see on the 4-hour timeframe. The USD/JPY pair is trading below 50 periods EMA, which is placing a bearish pressure on the EUR/USD at 106.850. 

The MACD was massively bearish, but know it’s trying to exhibit a bullish crossover. Histograms above 0 are signalings chances of a bullish reversal in the USD/JPY. The pair has immediate support at 106.400, along with resistance at 107.450. 


GBP/USD – Daily Analysis

GBP/USD currency pair still consolidating in the narrow range and traded well on the bullish track held over the previous 1-week or so.

All factors failed to give any significant reason for the significant and led trading at the beginning of the recent week. The GBP currency is still flat due to Friday’s report that the European parliament president has denied the United Kingdom Prime Minister Boris Johnson’s new Brexit proposal.

However, the bearish range remained warm so far, due to slightly weaker trend surrounding the greenback, pressurized by the strong market expectations that the Federal Reserve will deliver the rate cut again at its upcoming meeting regarding monetary policy, the conference is scheduled to happen on 29-30 October.

On the flip side, the U.K. Prime Minister Boris Johnson still stands to take Britain out of the European Union on October 31, with deal or without, and caught investors from placing any aggressive bullish risk.

Due to serious of soft United States data, last week increased uncertainties on the assumption that the United States economy will be more flexible as compared to the other economies and pushed investors to start pricing in another rate cut by the Federal Reserve.


Daily Support and Resistance

S3 1.2169

S2 1.2245

S1 1.2291

Pivot Point 1.2322

R1 1.2367

R2 1.2398

R3 1.2474

GBP/USD – Trading Tips

The GBP/USD is trading with a bearish bias, as the 1.2340 level is extending it a substantial resistance today. The 50 EMA is likely to continue support at 1.2275, but the recent bearish engulfing candle may keep the GBP/USD under heavy selling pressure. 

The trading bias remains mostly bearish, and you should consider staying bearish below 1.2275 level today. 

All the best! 


Categories
Forex Market Analysis

Daily FX Brief, October 04 – Major Trade Setups – Buckle Up for NFP Event!

Daily FX Brief, October 04 – Major Trade Setups – Buckle Up for NFP Event! 

On Friday, the U.S. dollar index continues to weaken ahead of the U.S. NFP data, which is due in the New York session today. Lately, the Institute of Supply Management (ISM) released the Purchasing Manager Index (PMI) for Non-Manufacturing Goods as 51.6 against the expected 55.0 for September. 

The data showed that it fell to a 3-Year low this month. The release of weak indices of the Manufacturing and Non-manufacturing sector this week indicates the slow growth of the economy in the U.S. Consequently, we are seeing less growth in the U.S. dollar today.

Economic Events to Watch Today

Let’s took at these fundamentals.


EUR/USD – Daily Analysis

During the early Asian session, the EUR/USD currency pair hit the bullish track for the 4th consecutive day due to all-important United States Nonfarm Payroll data.

As of writing, the EUR/USD currency pair presently trading at 1.0978, hit the high level of 1.0984 and showing 0.13% gains on the day. The pair maintained its gains for the 4th consecutive session.

On the other hand, all traders are presently expecting more than 80% odds of the rate cut by the 25-basis-points at the Federal Reserve next meeting later this month. The expectations were 64% on Wednesday, and 40% were on Monday, and currently reached 80% so far.

The increasing probabilities of an October Federal reserve rate cut also support the bullish track put forward by the hourly chart golden crossover.

At the U.S. Payroll front, the data is scheduled to release at 12:30 GMT an expected to show the economy added 145,000 jobs during the September after the 130,000 additions during the August. Besides this, the Average Hourly Earnings are found while increasing by 3.2% year on year, and the jobless rate is estimated to stay flat at 3.7%.

Whereas, the sluggish data will prop the dovish Federal Reserve expectations and pushing the greenback lower across the board.

As in consequences, probably the EUR/USD pair will come under pressure and possibly hit the low level of 1.09 if the data beats forecasted figures by a considerable margin.   


Daily Support and Resistance


S3 1.0823

S2 1.0883

S1 1.0921

Pivot Point 1.0943

R1 1.0981

R2 1.1002

R3 1.1062

EUR/USD – Trading Tips

Before Non-farm payrolls, the EUR/USD is consolidating in a narrow range. Investors await for NFP and trying to stay out of the market until the actual figure is out. The 50-hour moving average (M.A.) had a hit above the 200-hour M.A., confirming a golden crossover – a buyer market sign. Therefore, the pair seems set to maintain the continuous recovery rally from recent lows near 1.0880. 

Consider staying bullish above 1.0970 to target 1.1040. The bearish target can be set at 1.0880. 


USD/JPY – Daily Analysis

The USD/JPY closed at 106.910 after placing a low of 106.480 on Thursday. With no economic release from japan side, the movement of USD/JPY solely depended on U.S. dollars on Thursday. The weak ISM Non-Manufacturing PMI at 19:00 GMT indicated a slowdown in the economic activity of the United States by coming as 52.6 against 55.1 expected. This raised the concerns of the U.S. falling under recession after the continuous disappointing economic releases from the U.S. for three consecutive days. 

On Wednesday U.S. Private sector showed that the hiring made by them in September was not satisfactorily affected by the trade disputes prevailing between U.S. & China.

Concerning trade disputes, on Wednesday, there was another announcement from Trump’s administration related to the Tariffs on European Goods. 

With the increased chances of U.S. economic slowdown and a third rate cut by Federal Reserve in upcoming policy meeting, the U.S. Dollar faced pressure for 3rd consecutive day and has made USD/JPY to move in Bearish Trend.

Other economic releases from the United States on Thursday were, the Unemployment Claims at 17:30 GMT, came as 219K against 215K expected, weighed the U.S. Dollar. At 18:45 GMT, the Final Services PMI came as expected 50.9. The Factory Orders came in favor of U.S. Dollar as -0.1% against -0.5% expected.


Daily Support and Resistance 

S3 105.7

S2 106.53

S1 106.86

Pivot Point 107.37

R1 107.69

R2 108.2

R3 109.04

USD/JPY – Trading Tips

The USD/JPY continues to trade bearish after violating the bullish channel on the 240 mins chart. The USD/JPY is now holding below 50 periods EMA, which is suggesting bearish bias among traders. 

On the lower side, the USD/JPY is likely to gain support at 106.400 area. The MACD and RSI are holding below 0 and 50, suggesting odds or more bearish bias in the USD/JPY. Let’s stay bearish below 107 to target 106.400 today. 


GBP/USD – Daily Analysis

The GBP/USD currency pair hit the high level of 1.2350 and maintains the recovery rally, as worries about the U.S. fundamentals weighing over the Brexit news.

The US ISM Non-Manufacturing Purchasing Managers Index PMI is entering the previous manufacturing level from the same surveyor. Besides, the increased level of uncertainty coming from the survey has extended pullback in the greenback from the 2-year highs.

On the other hand, the GBP/USD pair trades started the day with headlines concerning the European Union. The EU has given 7-days more to the United Kingdom Prime Minister Boris Johnson to announce a better offer. The Tory leader could increase the support of thirty-labour rebels that supports the Breit deal.

Later in the day, investors will keep their eyes on the September month employment data, namely Nonfarm Payrolls (NFP), Unemployment Rate, and Average Hourly Earnings. After the news report, the eyes will remain on the U.S. Federal Reserve Chairman Jerome Powell’s speech at the “Federal Reserve the meeting.


Daily Support and Resistance


S3 1.2088

S2 1.2186

S1 1.2242

Pivot Point 1.2283

R1 1.234

R2 1.2381

R3 1.2479

GBP/USD – Trading Tips

On the technical view, the 130-pip area between 50-day and 21-day simple moving averages (SMA), 1.2250, and 1.2380, respectively, may keep the pair’s trading moves limited. Today, consider staying bullish above 1.2330 to target 1.2400 and 1.2500. Whereas, the GBP/USD may remain bearish below 1.2330 to target 1.2275 and 1.2230. 

 All the best! 


Categories
Forex Course

Introduction To The ‘Ultimate Forex Course’ By The Forex Academy!

At Forex Academy, we give utmost importance to education. To be successful, you need to learn before you Earn. So for that same purpose, we have designed a proprietory course helped by industry experts. This extensive course will cover almost everything one needs to know about the Forex market. All relevant aspects of the trading business will be discussed here, starting right from the fundaments to the advanced trading concepts. We will be publishing one article per day so that it will be a continuous learning process. And guess what? The curse is entirely free for our readers.

Introduction To The Course

In this one-of-a-kind course, we will explain everything you need to know about Forex trading. The Forex market has evolved rapidly in recent times. It is not the same that you would have seen or heard a decade ago. The fundamentals are changing, psychology is changing, and complexity has increased. Technology not available in the 90s has now become robust and is being used extensively by traders and banks. As retail traders, we should prepare as best as possible to meet these global changes.

We have created this course, keeping in mind the rapid changes happening in the forex market. You need to use a structural method of learning, which is what we have done. Education shouldn’t be in bits and pieces, this will only create confusion, and you cannot gain anything from that knowledge. You will gain an insight into fundamental and technical expertise and how you can use them together to make the best trades. We have compiled this information from the best sources. Most importantly, the course contents have been written based on the personal experience of the writers. Forex.Academy is the right place to start for any person looking to start his trading career.

Why should you take up this course?

If you want to achieve your investment goals, this course is for you. Trading is not an easy game. It requires a lot of hard work and dedication. This journey begins with learning, and learning starts here. This course is a complete package for all the aspiring traders. Also, experienced traders who are willing to expand their knowledge must try this course. The articles are more reader-friendly, where topics are explained in simple language. The most complex strategies are described in the easiest way possible. Without having the right knowledge, it is impossible to succeed in trading.

Structure of the course

The course is divided into 37 chapters which comprise of 350+ articles, where a wide range of topics are covered. The chronological order of topics is in such a manner that every chapter is linked to the next. We have made sure that it does not lead to confusion at any point. You will find information on fundamentals, technical analysis, and price action. Market psychology is one such topic, which has been written with a lot of attention. And you too, should follow these principles to gain control over your mind.

Keep track of your learning with the quizzes

At the end of each article, we have included a quiz that will test your understanding of the topic. To be confident about what you have read, try to answer all of them correctly. If you are unable to answer, that means you need to reread the article. Rereading the article will clear all your doubts and make you an expert. Once you got all the answers right, you are ready to go ahead to the next section.

What will you learn by the end of this course?

By the time you reach the end of the course, you will be halfway through your trading journey. The only thing left for you to do is to practice the trading strategies discussed along the course. You will have all the knowledge you need to be a successful trader. See you on the course.

All the best! Happy Learning!