Categories
Forex Daily Topic Forex Price-Action Strategies

Mind the Gap Price Action Traders

In the Forex market, most pairs start trading with a gap after weekends. Most of them are not visible on charts such as the H1, H4, or the daily. Some pairs begin with a big gap, which is visible even on the major charts. It gets difficult for price action traders to trade and make a profit when a pair starts with an evident gap. In today’s article, we are going to demonstrate an example of this.

The trend starts with a bearish engulfing candle, which is a strong indication that the trend may sustain for a long time. The sellers are to wait for the price to consolidate and strong bearish reversal candle to go short on this chart. However, do not miss that the chart has a gap followed by trend continuation. It finds its support since it produces a doji candle followed by a bullish engulfing one.

The price finds its resistance as well. Look at the last candle on the chart. It is a bearish engulfing candle closing well below the level of support. Usually, the sellers may trigger a short entry right after the last candle closes in such price action. It is not a usual chart since it has a gap. Let us assume we have triggered a short entry here.

The next candle comes out as an inside bar bullish candle. The last candle comes out as a doji candle closing right at the breakout level. The bear still has control.

The last candle on this chart breaches through the level of stop loss. The trade does not go according to the sellers’ plan. The trend initiating and the breakout candle gets a 10 on 10. However, it gets us a loss. Do not forget this could happen any time with any trade setup. With this chart, something works against price action traders in both buying and selling. Can you guess what that is? Yes, it is the ‘Gap.’ Let us proceed to the next chart. It may create more drama.

It produces a spinning top. The buyers may think that they have a chance to take control next if it produces the next candle as a bullish engulfing candle.

It does not. It continues heading towards the South again at a slower pace. A chart with a big gap may act weird like this. Thus, it is best to avoid taking entry on a chart with a big gap.

Categories
Forex Course

47. Which is the best way to analyze the market?

Introduction

Now with the knowledge of three type analysis, let us determine the best type of analysis suitable for you.

Before that, let’s brush up through the previous lessons.

✨ Fundamental Analysis – This is a technique to analyze the market by considering the factors which affect the supply and demand of security (currency). Some of the fundamental indicators include interest rates, inflation, GDP, money supply, manufacturing PMI, etc.

✨ Technical Analysis – It is the analysis of the market by understanding the historical price movements of the currency. In other words, it is the study of price movements using technical tools like candlestick patterns and indicators.

✨ Sentimental Analysis – This type of analysis involves understanding the real essence of trading. Here, we get into the shoes of the bug players and determine if they’re buying or selling.

Out of these three, which do you think can help you find success in trading? Well, as a matter of fact, once can succeed in trading only if they have the knowledge of all these three types of analysis. Let us understand with an example of the hurdles that can come your way if you focus only on one type of analysis.

Let’s say a trader named Tim trade only on technical analysis, and he found a good buying opportunity on EUR/USD. But, after he hits the buy, he sees the market falling straight down 100 pips against him due to some news he wasn’t unaware of. This situation brings in emotions in him by which he ends up closing the trade. However, later in the day, he observes that the market ends up going in the direction he predicted.

Here, though his analysis was right, the obstacles like news and emotions took over the technical analysis and put him in a loss. Hence, from this, we can conclude that technical analysis, fundamental analysis, and sentimental analysis are interdependent on each other.

How to structure your analysis?

Above, we have discussed how crucial and dependent all three types of analysis are. However, there are traders in the industry who have expertise only in a kind of analysis but still manage to grow their accounts significantly. Below are some of the tips on how one must structure their analysis, considering they specialize in technical analysis.

  • Before you begin to analyze the market, determine if there is any upcoming news on the currency, you’re looking to trade. And it is recommended to stay away from the currency pairs which have fundamental news coming in.
  • Once you determine the currency pair you’re going to trade, you can begin your technical analysis on that pair.
  • And most importantly, before you place the trade, you must have a complete plan on all the situations that can possibly occur when you’re in the trade, including position sizing, stop-loss levels, and profit-taking levels.  Because, once you enter the trade, emotions take over technical analysis which can make you take incorrect trading decisions.

Therefore, following these three simple steps can drastically bring a change in the way you analyze the markets. Cheers.

[wp_quiz id=”57535″]
Categories
Forex Course

46. Analyzing the Forex Market: Sentimental Analysis

Introduction

Have you come across the saying that 95% of the traders lose money in Forex, and only a handful of 5% succeed? As a matter of fact, this statement is entirely true. Though trading in the Forex market is no different from doing business in the real market, most of the Forex traders find it challenging to succeed in trading. This is because, in the real world business, there is hardly any relation between business and emotions, whereas, the Forex market is closely related to human psychology.

Many traders trade based only on fundamental analysis or technical analysis and ignore the existence of the sentiment involved in trading. This is the reason we have the concept of 95% and 5%.

Why is there sentiment entailed in trading?

To answer this particular question, we’ll have to understand the core basics of trading.

Firstly, what is trading? Trading, according to the textbooks, is the process of buying and selling of products. Or in simple terms, it is the process where a seller sells his products to a buyer, or a buyer buys products from a seller.

Now, the point one must note here is that to buy or sell a product, both parties (buyer and seller) are obligatory. Without a buyer, the existence of a seller is useless, and without a seller, the presence of a buyer is pointless.

And this above concept is the answer to the above question. Let us understand how.

There is an end number of traders trading the Forex market. The logic for buying and selling is the same as the real-world market. That is, a trade cannot be completed without the presence of both parties. For example, if you want to buy a currency pair, then you mandatorily need a seller to sell it to you. And if there are no sellers in the market to sell it at your desired price, then your buy order will remain pending (incomplete).

Broadly speaking, traders can be segregated into two types. The first set of traders includes large banks, hedge funds, mutual funds, and big-time investors who move the market. And the second set comprises small retail traders who do not have the capability (enough capital) to drive the market.

How do big players always win?

Big players are the ones who always win in the market. And they make this possible by bringing in emotions in trading. Let us understand this with an example.

Let’s say a currency pair is in an uptrend from a month. At this point in time, what do you think the whole world is thinking? As obvious as it gets, most retail traders are looking at it as a buy. Now, since everyone (big players and retail traders) are looking to buy, there is no seller to sell it to them. This situation, in turn, creates loads of pending orders in the market. So, the masterminds (big players) start to become the sellers in the market to the retail buyers. And this continuous selling by the big players causes the market to drop pretty drastically.

Seeing this drastic fall in the market, all retail traders who were buying get stopped out, and the rest begin to look it as a sell. And once the retail traders start to sell, the big players buy it from these sellers (retail traders). Hence, from this, the market again starts to head north. This is how big players bring in emotion in the minds of the public, manipulate them in the market.

Finally, we can conclude by saying psychology plays a major rule when it comes to trading in the Forex market. And the sentimental analysis is all about learning more about psychological trading. So in our further lessons, we will be discussing a lot more on these topics.

[wp_quiz id=”57167″]
Categories
Forex Daily Topic Forex Price-Action Strategies

Need the patience to Manage Trade by Taking Partial Profit

Partial profit taking is a handy feature that Forex traders often use. Since the Forex market is very volatile, traders take out a portion of profit and let the rest of the trade run to get them more pips. Traders need to have patience, though, if they want to manage the trade by taking a partial profit. In today’s lesson, we are going to demonstrate an example of partial profit-taking and find out the importance of having patience.

This is a daily chart. The price produces a bullish harami right at the level where it bounces earlier. The daily-H4 combination traders are to flip over to the H4 chart to find out long opportunities. Let us flip over to the H4 chart.

The H4 chart looks fantastic for the buyers. The first candle comes out as a bullish engulfing candle followed by another bullish one. The price consolidates and produces a bullish reversal candle as well. The buyers are to wait for an H4 breakout at the resistance to trigger a long entry.

The price comes down to find its support and heads towards the North to make the breakout. Look at the breakout candle, which is a good-looking bullish candle with long lower shadow. The buyers have been waiting for this. It is time to trigger a long entry.

The price keeps heading towards the North after triggering the entry. The last candle comes out as a strong bullish candle, so the buyers let their trade to go along. Let us proceed to the next chart.

The chart produces a bearish reversal candle. The price may go up to the black marked level. It means that the price has enough space to travel and offer a handful of pips. The price may make a bearish move from here as well. What do the buyers do here? They may take out a portion of the profit. They may take out a 50% profit and leave the stop loss where it is. It will allow them grabbing more pips if it keeps going towards the North. If it does not, they will not lose a dime.

The price gets caught within a bullish rectangle. Do not forget that it has been a long time that the buyers were sticking with their trade. They have been very patient. The price still does not make an upside breakout. It might go either way. Let us proceed to the next chart.

At last, it makes a breakout at the first rectangle. It consolidates again with several candles and makes another bullish breakout. Eventually, it hits the level. Traders have grabbed more pips by taking a partial profit. However, we must not miss the part that they are to be extremely patient. Taking a partial profit may help us be more consistent in making a profit, but we now know what we have to put in to do it accordingly.


Categories
Forex Course

31. The Concept Of Margin Call & Margin Call Level

Introduction

By now, you would have known that risk management is the most crucial factor of consideration while trading in a margin account. The trader is not solely responsible for their risk, but brokers, too, have some features that directly or indirectly try reducing the risk of the traders. In the previous lesson, we understood what margin level was. And in this lesson, we shall be putting more meaning to it by introducing another term which is correlated with margin level. The margin term, which will be discussed in this lesson is ‘Margin Call Level.’ So, without any further talks, let’s get our feet wet with this topic.

Margin Call Level

Margin Call Level, as the name suggests, is a specific level in Margin Level when the broker warns the trader that their positions are at risk. It is a threshold level when the broker alerts the trader that some of their trades can be forced to close.

As mentioned, the Margin Call Level is closely related to Margin Level. Hence, Margin Call Level is expressed in terms of percentage.

Example

Let’s say the Margin Call Level set by the broker is 100%. So, if an account’s Margin Level falls below 100%, then it is said that the account has hit the Margin Call Level.

Margin Call

Margin Call and Margin Call Level is pretty much the same thing. Margin Call is simply a different version of the Margin Call Level. If Margin Call Level is a specific ‘level’ set by the broker, Margin Call is a ‘call’ or ‘notification’ given by the broker. So, when an account’s Margin Level falls below the Margin Call Level, the account holder will receive a call or notification from the broker notifying the same.

This above explanation was the simple exterior working of Margin Call. If we were to see the internal working of it, one would receive a Margin Call when the Equity value becomes less than the Used Margin. That is when the floating loss becomes larger than the Used Margin.

Now, let’s get this concept cemented by considering an example.

Assume that a trader has deposited $1,000 in his account. Also, he went short on EURUSD for 10,000. The required margin for this trade was $300. Considering this to be the only running trade, the Used Margin will be $300 (same as the Required Margin).

Let’s say the trade is performing well, and the current unrealized P/L is $100. The Equity at this point of time will be,

Equity = Account Balance + Floating P/L = $1,000 + $100 = $1,100

Now, since the trade is running in profit, the Margin Level will obviously be above the Margin Call Level.

Later, let’s say the trade is going into the negative to -$700. The Equity now will turn out to be $300 ($1,000 – $700).

With these values, let’s find out the Margin Level.

Margin Level = (Equity / Used Margin) x 100% = ($300 / $300) x 100% = 100%

Assuming that the Margin Call Level set by the broker is 100%, the trader will now receive a Margin Call as the current Margin Level is at 100%.

Now, wondering what will happen if the Margin Level falls significantly below the Margin Call Level? The answer to this shall be discussed in the next lesson. Make sure to take the quiz below before you go.

[wp_quiz id=”51027″]
Categories
Forex Market

Finding The Optimal Risk % In Forex Trading

Introduction

Calculating risk is one of the most important parts of Money Mangement. Many novice traders or traders with limited experience won’t be aware of the amount of risk they can tolerate. In this article, we shall focus on determining the appropriate risk % that fits your trading style. The goal of risk management is to gain control over three things:

  • Emotions
  • Leverage
  • Sustenance

Furthermore, by limiting the loss per trade, a trader can ensure that his/her trading capital is not wiped out in one single trade. Having this discipline systematically reduces the loss per trade and provides an opportunity for the trader to re-look at the situation.

Calculating the risk

One can determine the risk based on the following factors:

Win rate

Win rate refers to how often a trader takes profitable trades relative to the trades that result in a loss. Win rate is determined by using the risk-to-reward ratio (RRR) and is calculated by the following formula.

Win rate = 1/(1+RRR)

The above-given formula is also referred to as the Minimum win rate. If any trader is trading with an RRR of 1, then his/her minimum win rate will be 50%. So out of 100 trades, we require a minimum of 50 trades to end as winners to compensate for the losing trades.

This will help a trader in deciding their maximum risk based on the win rate. This formula can also determine if a trade can be taken or not. For example, if someone has a win rate of 25%, he/she will not be able to take trades that have a risk-to-reward ratio of less than 3.

Nature of the market

Depending on the market situation, the risk can vary substantially. In a trending market, like the one in the below chart, risk should be reduced as much as possible by using a stop-loss order. We are recommending this idea as you would most probably be trend trading, and there is no point in risking more than the usual (can be lesser).

Trending Market

In a market that is trapped in a range (below image), the risk is always higher. This means anyone who trades the consolidation market is essentially increasing their risk. This would mean increasing the stop-loss, thereby reducing the risk-to-reward ratio (RRR) of the trade.

Ranging Market

Maintaining a risk of 1% constantly, regardless of the market conditions, will help the traders to sustain the loses and stay in the game even after a series of losing trades. This is a conservative method that reaps fewer rewards, but the risk is certain.

Conclusion

The aim is to achieve some level of consistency in trading by allowing yourself and your trading strategy to fight the evil forces of the market. We would say in all circumstances, a max risk of 1% appears to be the winner if you are a conservative trader. When the risk increases, it is said to impact not only the capital of the trading account but also the psychology of a trader. Hence it is better to keep risk at a bare minimum in times of uncertainty.

Categories
Forex Market

Understanding Drawdown & Its Relation With Position Size

Introduction

Do you know that there is a safe way to choose the maximum lot size when you trade? That too while keeping your account safe from blowing when a losing streak of trades occur? To constantly stay in the game and be able to recover from losses requires patience, clarity, and, more importantly – optimal Position sizing. The position size in simple words is how much a trader invests in each trade. There are different models deployed to reach the optimal position sizing depending on the objective of the trade. Before that, let’s first understand what drawdown is and how it is related to position sizing.

What is the maximum drawdown?

The maximum drawdown is the biggest drop in the accumulated profit chart and, consequently, that of the trading capital. Imagine a situation where a trader had 200 pips in profit after a number of trades, and on the following days’ profit dropped to 136 pips before he can make new accumulated high.

So, the drawdown here was 200-136 = 64 pips

When this drawdown increases, it reaches a level (negative drawdown), after which it becomes impossible to trade (due to loss of trading capital). Maximum drawdown is the loss that the trader can take in order to survive in the market and be able to continue trading.

How is drawdown related to position sizing?

Taking the above example, let us assume that the trading capital was $500 and the trader trades with a lot size of 0.01. The drawdown he experienced was 64 pips, which is $6.4 (1 Pip = $0.1). So the amount of money he/she risking in this trade is 6.4/500 x 100 = 1.28% of the account size.

Now let us see how this drawdown increases with a change in position size.

How much drawdown can I handle so that it doesn’t affect the mental state and my trading style?

As you can see below, the drawdown % increase as the lot size increases and the account gets into an unsustainable state (Especially when the Trading Capital is $500). Hence you need to calculate risk based on your risk tolerance drawdown.

The right way to look at drawdown and position size

Typically, the drawdown occurs after a series of consecutive losses. The very first thing a trader needs to do is to analyze and figure out the number of losing trader he/she can endure. Depending on that, the maximum risk percentage should be defined. So essentially, this percentage is the maximum amount of trading capital a trader affords to lose. If the losses cross this percentage, his/her account get unsustainable.

For instance, I can bear a maximum drawdown of 20%. So I should be willing to design a strategy and chose my trading size in such a way that it is very unlikely for me to reach the 20% drawdown. Let’s denote the number of losing streaks as N. I should make sure that my strategy has a winning percentage of at least 50% or more with high RRRs. Let’s assume the maximum number of losing streaks I can afford is 10 (i.e. N=10).

Dividing the maximum drawdown (20%) with N (10) gives 2%. This means that I cannot risk more than 2% of my trading capital on a trade to sustain in the market. If I have more than one open trading position, I should be distributing the risk among all of the open positions. So here, if I have 2 open positions, I shouldn’t be risking more than 1% in each of the trades. This is one of the best ways to look at drawdown and position size.

Different approaches to position sizing

Defined Percentage Risk

In this position sizing strategy, we risk a fixed percentage of the trading capital (e.g., 1%) for each trade. This is followed by most of the traders across the world and it is pretty simple to use as well. Essentially, the trader is required to put the stop-loss more accurately and not randomly to prevent the stop-loss hunt. This might sound pretty easy but it needs a lot of discipline to overcome the greed and not raise the position size when you see a clear profitable trading signal.

The Kelly Criterion Model

John Kelly described this criterion pretty long ago, which computes the optimal position size for a series of trades.

Kelly Percentage = W – [(1-W) / R)

Where, W – Winning probability and R – Profit/Loss ratio

When a trader keeps a record of all their trades, they can calculate their winning probability and profit/loss ratio. Then, they can use them in the above equation to calculate the optimal position size.

Conclusion

You now know the importance of position size and its relation to drawdown. By using this, leverage can also be used appropriately to avoid blowing-up your account because of the drawdown. By doing this, you can maximize your earnings and reduce drawdown to an acceptable value.

Our suggestion for you is to use a trading strategy for a long time. If a strategy hasn’t been tried many times, the big drawdown might not have appeared yet. The bigger the history of using the strategy, the more confidence you will get to increase the lot size. Cheers!

Categories
Forex Basic Strategies

Trading With The Bollinger Band %B Indicator

Introduction

If you have experience trading with the Bollinger Bands indicator, you will find it easy to trade with the Bollinger Band %B indicator. The only difference is that, in this indicator, you can identify the relationship between the price and the bands with at most clarity.

What is the Bollinger Band %B indicator?

It is basically a technical indicator that quantifies the price of an asset with respect to the upper and lower limits of Bollinger Bands. We have derived 6 relations between the price and the indicator.

  • The %B is at zero when the currency pair is at the lower band.
  • % B will be at 100 when the currency pair is at the upper band.
  • The indicator is above 100 when the price of the currency pair above the upper band.
  • It is below zero when the price goes below the lower band.
  • The %B is above 50 when the price goes above the middle band.
  • And it is below 50 when the price goes below the middle band.

The Bollinger band %B uses the 20-day simple moving average (SMA) as the default parameter, just like the Bollinger Bands. This indicator is available on most of the trading platforms and terminals.

Bollinger Band %B formula

%B = (Price – Lower Band) / (Upper Band – Lower band)

Things to know

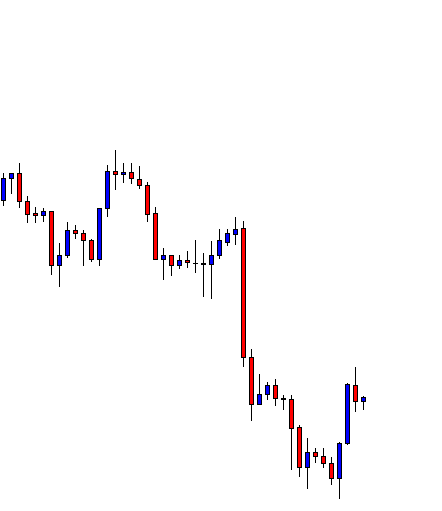
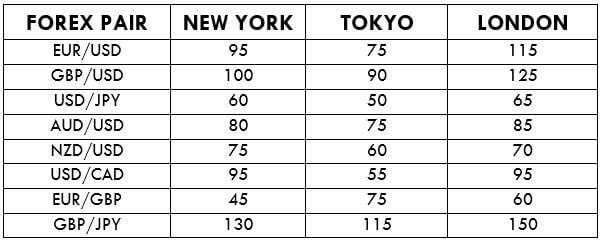
Before understanding the strategy, it is necessary to know a few things about the indicator as these concepts will be used in every step of the strategy. Below is the chart of a forex pair with the Bollinger Band %B indicator plotted to it.

  • The upper dashed line represents the 100% level of the %B indicator also known as the upper band.
  • The lower dashed line represents the 0% level also known as the lower band of the indicator.
  • The area in between the two dashed lines is known as the middle band.

These bands help us in identifying different trading opportunities. Hence, one needs to know about it before knowing the strategy.

The Strategy

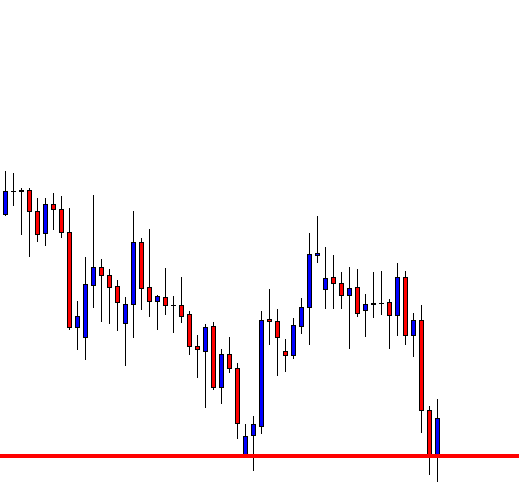
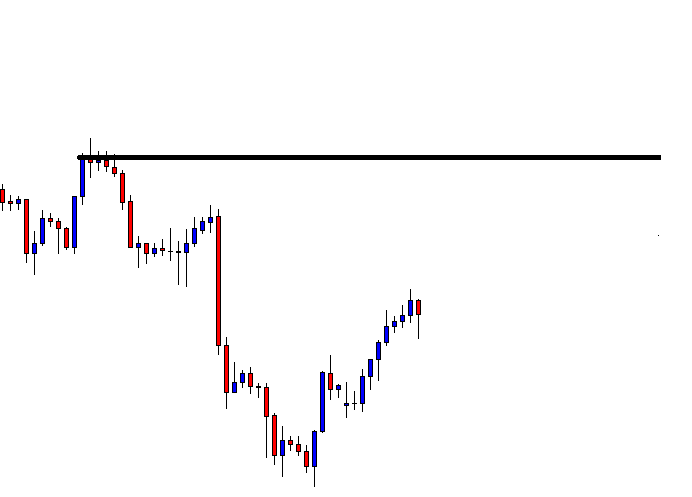
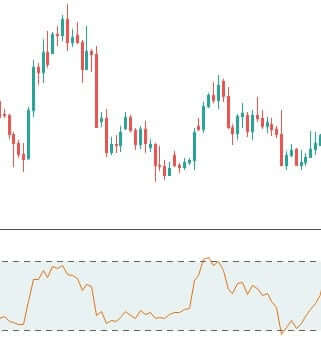
Step 1: Identify the major trend

To identify the overall trend of the market, the trader needs to shrink the chart and determine the trend.

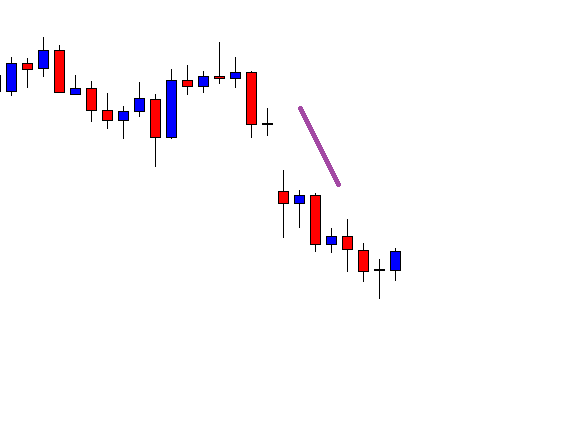
An uptrend is defined as a series of higher highs and higher lows, while a downtrend is defined as a series of lower lows and lower highs. In this strategy, we have taken the example of a downtrend, as shown in the figure. One can also see lower lows and lower highs in the above chart.

Let us see how the strategy works.

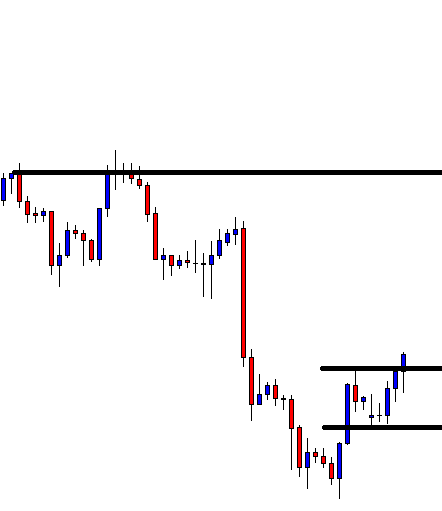
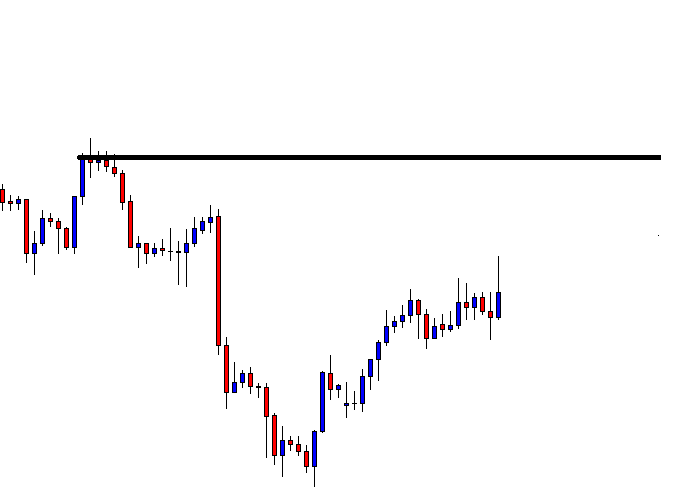
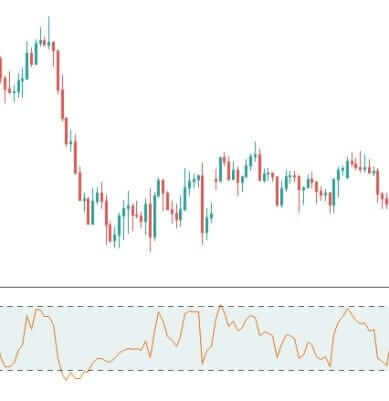
Step 2: Find the price where %B is above 100 or below 0 in the currency pair.

In this step, we are looking for the price where the indicator is above the upper band or below the lower band. This extreme price action is said to continue for long after taking a suitable entry.

A sell setup is formed when the indicator crosses below the lower band, and a buy setup is formed when the indicator crosses above the upper band. This strategy is almost reverse of other strategies (as oversold indicates buying in other strategies).

The above chart shows the crossing of the indicator below the lower band, which is apt for a sell trade. Just because the price is below the dashed line, we cannot take an entry immediately.

The next step is to find a pullback and then make an entry. We will then see how and where to take profits.

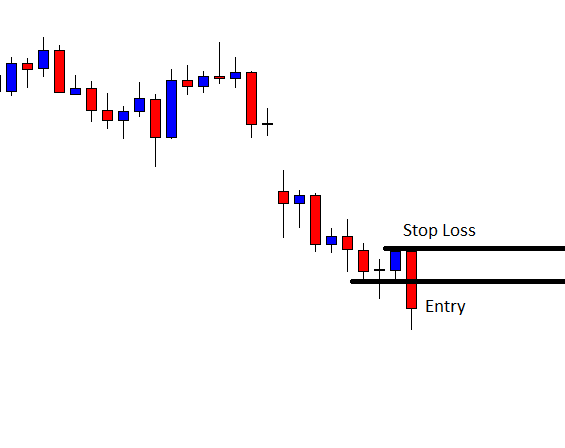
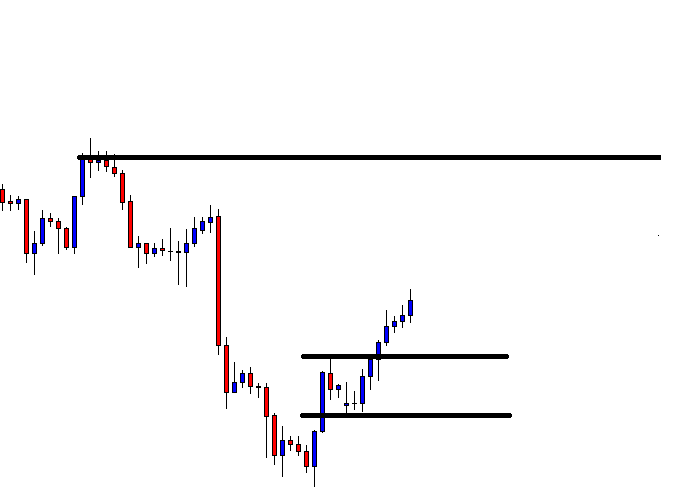
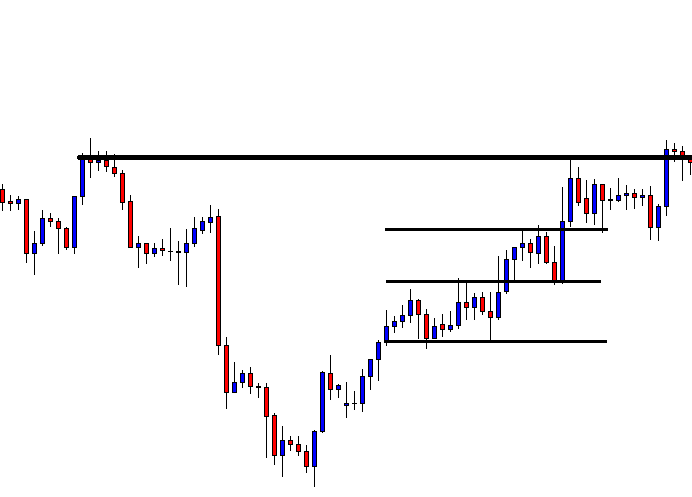
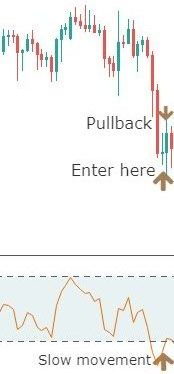
Step 3: Take an entry only at a suitable pullback.

By suitable pullback, we mean the opposite color candles should not be swift candles and should not make higher highs. If this happens, the current trend can be weak and may not sustain. The %B indicator can also assist us with the same, as the indicator should move slowly after crossing the lower band. If the indicator reacts and moves fast, it means the pullback is strong and could also result in a reversal. Finally, an entry can be taken after the close of at least two pullback candles.

The below figure explains the above paragraph clearly.

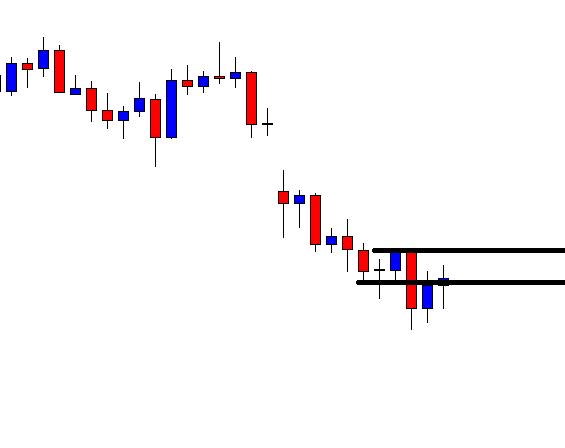
Step 4: Determining how to take profit

In this strategy, we follow a rule-based system for making profits which are again based on our indicator. A trader needs to cover his position after the indicator crosses the lower band once again and goes above the dashed line. This style of taking profit is different than in other strategies where it is based on a fixed percentage. This way of taking profits ensures that a trader is trading based on rules and guidelines which is a disciplined approach.

The below figure explains how profit is taken and the position is covered.

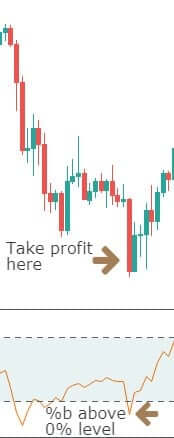
When the indicator goes above the 0% (lower band) level after crossing below, it means profit can be taken now and the trade can be closed.

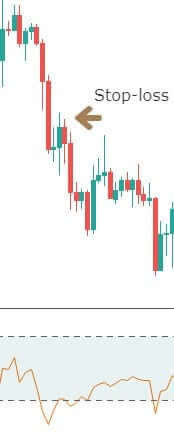
Step 5: Place a protective stop

Stop-loss is a mandatory and essential part of risk management, hence it needs to determined before entering a trade. For this strategy, stop-loss is placed above the high of the pullback which makes it an optimal place. The stop-loss, in this case, is very small which increases the risk to reward ratio (RR) considerably.

Here is exactly where it is recommended to put the stop loss.

The final trade setup would look something like this 👇

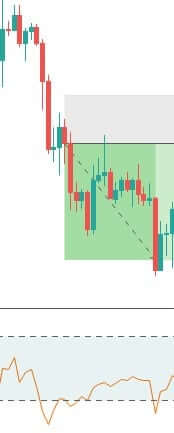
This results in a minimum of 2:1 RRR.

Final words

This is one of the easiest strategies which can be learned by new and experienced traders. It makes use of simple Bollinger bands added with a %B indicator. This indicator can also be combined with several other technical indicators and trading systems, but this alone, too, has a very good level of accuracy.  Now, we have to follow the money management principles to take the best trades and make huge profits from the same strategy. For this, you can also refer to our money management article series, which talks on various risk management topics. Cheers!

Categories
Forex Market

Advantages & Risks Involved With Volatility Trading In The Forex Market

Introduction

The forex market offers a lot of trading opportunities, but still, many traders find it difficult to make profits consistently. Emotions combined with undue risk and money management are often the main obstacles that new traders face.

In this article, we will discuss the hourly volatility in the forex market and the trading risks involved during these hours. Some traders trade the market based on its volatility. Few traders enjoy volatile markets, while others prefer trading in non-volatile conditions. So let’s get right into the topic.

The volatility of a major currency pair

Hourly volatility is relevant to short term forex traders but is not a significant factor for long term investors. The global trading sessions affect volatility within the 24 hours. A forex pair is typically most volatile when a major trading session opens, or two market sessions overlap with one another. For example, EUR/USD is the most volatile and active when London or New York is open because these markets are associated with the Euro and USD, respectively. The below figure depicts the volatility of EUR/USD in a day.

The average volatility of EUR/USD currency pair on a single day

The bar chart shown above represents the volatility of EUR/USD in a day. It depicts nothing but a candle with lower wick, body, and upper wick. One can see that during the Asia session, the price is not volatile. Whereas during the New York session, the price makes large movements shown by larger wick and body of the bar chart. Even without looking at candlestick charts on the trading platform, these bar charts are sufficient to decide at what time to trade during the day, which is much easier than analyzing candlestick charts.

Low volatile hours – Asia Session and Time b/w NY close & Asia Open  

Traders have a misperception that “More risk equals more return.” There is no doubt that highly volatile pairs deliver impressive returns, but research and data have found that lower-volatility sessions generate risk-adjusted returns over time. This is the reason why traders include the ‘Low volatility factor’ in their portfolio.

Risk of trading in low volatile hours

In times of low volatility, there is increased slippage, which means a trader will hardly get the price they desire for. This would mean eating up of their profits, or even sometimes a complete drain of profits (when trading on a lower time frame). In this way, a trader will not be trading according to the rules of money management. Hence, to manage risk, there is a right way to trade during such times. Some of them are discussed below.

Why is it important?

There are several reasons why trading in lower volatility conditions has the potential to create a lot of money over the long term.

Leverage aversion– In money management theory, we had mentioned earlier that the more leverage a trader use, the more is the risk. In times of lower volatility, traders are restricted from using the leverage from their trading account. As a result, they buy and sell currency pairs that are less risky with good profit potential.

The lottery ticket– Many traders treat the forex market as a “lottery” where they buy and sell currency pairs like they are purchasing lottery tickets. This, in turn, raises the bid of high-risk pairs, which leads to the type of lottery effect and increases volatility. Here, we need to find pairs that are under no one’s attention and buy them (which will be least volatile).

High volatile hours – London & New York Sessions

Many traders live on volatility in the forex market, as volatility is what creates profitable trading opportunities.

Risk of trading in high volatile hours

High volatility hours also has its own disadvantages. During such times, one can see their stop-losses getting triggered frequently. This happens due to the tricks played by more significant players like stop-loss hunting. Another risk is the high leverage provided by forex brokers. So to manage these risks, high volatile hours should be traded in a certain way. Some of them are listed below.

Trend trading– One key opportunity in a volatile market is that trending currency pairs may see the rate of their trend increase. When we are trading with the trend, our risk drastically reduces, which is good for money management.

Short-term strategies– In volatile markets, strategies work the best by booking profits automatically than manually. In this way, we will be eliminating emotions in trading as everything will be done by the system, which is crucial for risk management. Strategies also make use of indicators like RSI and Bollinger bands, which help in identifying overbought and oversold zones.

Bottom line

Every trading session and hour has its own advantages and risks, which a trader needs to evaluate, based on his/her risk appetite. The right time to trade depends on the personality of the trader and style of trading. Volatility on an hourly basis is more complex than how much a forex pair moves each day on an average basis. We see volatility varies drastically across different hours of the day and days of the week. We need to monitor and adapt to these changes. Cheers!

Categories
Forex Course

22. Perks Of Trading The Forex Market

Introduction

The foreign exchange market is, no doubt, the most popular market in the world. Though it is considered to be a very risky business, it can prove to be the best platform for trading and investing if things are done wisely. People often are in a dilemma to choose between the stock market, commodity market, and the forex market. Hence, it is important to know the benefits each market has to offer. So, in this lesson, we shall discuss some significant benefits the forex market has to offer.

Advantages of Trading Forex

Open 24/5

The forex market is traded throughout the day from Monday to Friday. And this got to be the biggest advantage for the part-time traders. Since there are quite a large number of people who are into 9-5 jobs, the forex market is an excellent option as one can trade anytime during the day. Hence, the forex market is the most flexible market when it comes to timings.

Great Liquidity

The forex market is the largest market in the world. It has a huge volume of orders coming in every single second. With high liquidity, trades are executed as soon as the order is placed. In fact, the forex market has the highest liquidity compared to any other market.

Margin Trading

In forex, the retail traders get the facility to trade with leverage. That is, with leverage trading, a trader can trade with quantities even if they do not possess the required amount. This is a great advantage as it paves the way for the small traders who are willing to participate in the market.

Nominal Commission and Transaction Costs

Another significant benefit to consider about the forex market is that the forex brokers don’t really charge any high fee, such as brokerage fees, exchange fees, or clearing fees. Having said that, they do charge commission, which is in the form of spreads. The bid/ask price, which is often referred to as the transaction cost, is typically around 1% when the market conditions are normal.

The Freedom on Lot Sizes

In forex, the brokers allow trading with as low as 0.001 lots. And traders can choose from 0.01 lots, 0.1 lots and 1 lot. Hence, there are variable lot sizes in this market. But, if you were to consider the futures market, the lot sizes are of one type and are determined by the exchanges.

Free Demo Trading

Demo trading is one of the best features the forex brokers have to offer. And the cherry to the cake is that demo trading accounts are free of cost. Demo trading can be very helpful to both novice and professional traders. Novice traders can use it to get the hang of placing orders and other features in the platform, while professional traders can use them to test the consistency of their strategies. Hence, we can consider demo trading to be a powerful risk-reducing tool.

Facility to Go long and Go Short

In the forex market, there is no directional bias. This is because currencies are traded in pairs. If a trader thinks the base currency would rise in value, they can go long, and if they think it will depreciate in value, they can go short. So, unlike the stock market, a trader need not borrow shares to sell short an instrument. Hence, traders can profit from both rising markets as well as falling markets without any complications.

Hence, these were some of the most significant features and advantages of the forex market. In the coming lesson, let us put up a comparison between different markets and see which market proves to be the best; for now, take the below quiz and see if you have understood this lesson correctly.

[wp_quiz id=”48839″]
Categories
Forex Videos

Who Is Trading Forex – Know Your Enemy!

Forex, so who’s trading?

The Forex market has a daily turnover of around US$5.3 trillion! That’s around £4 trillion. This market has been growing exponentially. However, growth has pulled back slightly since 2013.
So who is taking advantage of this incredibly liquid market, the biggest traded business on the planet? Large companies and institutions, including banks, HNW individuals, fund managers, firms that have overseas business activities and need to hedge their currency exposure, sovereign wealth funds, and governments’ central banks, importers and exporters, and everyday people in their bedrooms are now trading Forex; thanks to the proliferation of the internet!


But here is something that new retail traders do not appreciate, nor fully understand: Every single time that a new retail trader pulls the trigger on a trade, where he or she might be trading a pound, or a dollar per pip movement, or perhaps they have already done that, been lucky, and then leveraged their next couple of trades up to 5 or $10 per pip, they are trading against institutional traders who have at their disposal billions of dollars in their trading accounts. And when these guys pull the trigger on a trade, there are a host of professional traders on the opposite side of the fence trading against them! And with much deeper pockets. It is not unusual for an institution to hit a Forex exchange rate with over $500 million in one single ticket; it happens all the time. This kind of size can move the and exchange rate by 25 to 50 pips in the blink of an eye. So new traders be warned; this is what you are up against!
Also, many of these institutional traders will have been to university and studied economics, and cut their teeth trading on smaller accounts at their institutions, until such time as they have honed their skills and then been let loose on multi-billion dollar accounts. And now traders are up against adaptive algorithms which are now regularly used in the Forex market for auto trading purposes. These clever algorithms actually learn how to improve their trading, and they are getting better all the time!

However, it is well known that over 70% of new Forex traders will lose all their deposited money within six months. And this led – according to Reuters – to the China Banking Regulatory Commission banning banks from offering retail Forex on margin to their clients back in 2008. The writing was on the wall for retail FX traders in the west!


In 2014, the French regulator conducted a survey which concluded that the average % of losing clients was 89%, with clients who squandered €11K on average between 2009 and 2012. Over that four year period, 13,224 clients lost €175M. The estimated number of losing retail traders across Europe during this period was 1 million.

In 2015 the US National Futures Association announced a reduction on limits that US brokers could offer their retail clients to a maximum of 50:1 in 10 listed major foreign currencies and 20:1 on some others. Similarly, in 2018, The European Securities and Markets Authority (ESMA) confirmed stricter changes to the way brokers are able to offer retail Forex clients leveraged trading. We expect we shall see a lot more of this type of intervention in years to come.


Yet none of this really addresses the real issue, which is why people lose money trading Forex? It simply comes down to education. I wouldn’t strip a car engine down without first going to mechanic classes, or operate on a human without going to medical school, or fly a plane without lessons. And yet thousands of individuals think they can open a Forex trading account and consistently make money. Sure, they might get lucky initially and think they are on a roll, before over-leveraging themselves and wiping out their accounts. In our opinion, here at Forex.Academy, if governments want to intervene, they need to address education. Sure, reducing leverage and insisting on a larger margin requirement will slow down the rot. But

it won’t stop it, whereas insisting that traders are qualified – even to some basic degree of education level – would have a much better positive impact. Just like any profession, people need to be fully educated, and a basic level of education should be the first thing undertaken before newbies are let loose ‘trading,’ a term we use loosely! Under the circumstances, they are gamblers, and we all know what happens to most gamblers!

So to all you people who are thinking about becoming a currency trader, invest in a professionally put together education course and at least give yourself a chance in this volatile arena, which is fraught with danger and will think nothing of absorbing your hard-earned cash into its coffers!

Here at Forex.Academy, we recognize this issue and feel passionate about it. What’s more, we offer all the educational tools you will need to trade effectively, and the only investment you need to outlay is your time because our entire and comprehensive educational library is free!

Categories
Forex Course

21. Who Are The Forex Market Movers?

Introduction

In the previous lesson, we discussed how the forex market is structured. Now, it is time to take this topic a little deeper. In this article, let’s understand the Forex market movers. The participants of the market during the late 20th century were quite less. But, as time passed by, the number of participants grew exponentially. The big players got bigger, and the small retail traders found their way into the market. And at present, the forex market is no less than an ocean.

The participants of the Forex market

The Forex is approximately a $5 trillion market. This kind of liquidity comes from several types of traders. Some of them come with large pockets, some with medium-sized capital and the rest to make a quick buck. Now, let’s get an insight into all of these participants.

Central Banks

Central Banks play a crucial role in the Forex market. The interest rate policies of the Central Banks influence the exchange rates to a large extent. They are also responsible for Forex fixing. They take action in the Forex market to stabilize and pump in the competitiveness of that country’s economy. Moreover, they participate in the currency exchange to manage the country’s foreign exchange reserves.

Commercial Banks

Many assume that commercial banks come under the central banks’ category. However, this isn’t true. The commercial banks are the most active participants in the FX market. They’ve got the biggest pockets out there and trade with considerably large quantities of lots. Due to this, they partially determine the exchange rates of the currencies as well. About 100 to 200 banks around the world assumed to ‘make’ the market. The commercial banks facilitate the services to the retail clients for conducting foreign commerce and making an international investment. The commercial banks include large, medium, and small-sized banks, and as a whole, these banks are referred to as the interbank market.

Foreign Exchange Brokers

Forex brokers also have their significance in the market. They are agents who facilitate trading between two parties. Note that these brokers are just matchmakers and are not really involved in determining the exchange rates of currencies. Brokers constantly keep an eye on the exchange rates and try matching the price of buyers and sellers to execute a trade.

Multi-National Companies

The MNCs are major participants in the FX markets, who do not come from the banking side. These companies usually participate in the forward or the futures markets. Their participation comes from the cash flow between different countries. MNCs typically set up contracts to pay or receive a fixed amount of foreign currency in the future date.

Retailers

The exponentially growing market in the Forex is the retail market. The retailers include smaller speculators and investors. Speculators, unlike the participants mentioned above, are not in genuine need of foreign currencies. Their motive from the market is simple. They buy or sell with a hope that the price will move in their favor and can end up with a profit. They get their orders placed by brokers who act as an intermediary between buyers and sellers. The power of retailers to move the market is minimal because their contribution to the volume traded in Forex is less than 6% of the total Forex volume.

These are the different participants who make up the entire Forex market. In the upcoming lesson, we shall open up more about the Forex brokers. Don’t forget to take the below quiz to check your learnings.

[wp_quiz id=”48275″]
Categories
Forex Course

19. Decentralized Forex market and its hierarchy

Introduction

It is a known fact that the forex market is the market for trading currencies, and the stock market is for trading shares of a company. This being the major difference between the two, there is another significant difference you must know. The stock market is fully centralized, while the forex market is decentralized. In this lesson, let us discuss how different a decentralized market is to a centralized one. Apart from that, let us also understand the structure of the forex market.

The Centralized Market

In a centralized market (stock market), there exists an intermediary between the buyer and seller to trade in the market. There is an entity called the central exchange, which facilitates the transactions between the two parties. In the present day, ECNs on stock markets have brought this to an end as they connect both the parties directly, which ensures the bid and ask prices are unified. Also, the competition between ECNs and direct traders tighten spreads and increments the available volume, making harder the manipulation of the prices.

The Decentralized Market

In a decentralized market, there is no concept of centralized exchanges. With the absence of a central intermediary, there is direct trading between buyers and sellers among top institutions. However, by default, retail traders will have to approach a broker to facilitate their transactions. Depending on the liquidity provider, the quotes of the currencies typically vary from broker to broker. That makes accounts open on non-ECN brokers suitable for price and spread manipulation. There is a possibility that a retail trader won’t be guaranteed the real bid and ask prices in the market. However, though there is manipulation, the volume of traders in the forex market is much higher when compared to the stock market. This could be due to the fact that the leverage in the forex market is considerably higher than the stock market.

Hierarchy of the forex market

Banks and retail traders are not the only ones who contribute to the Forex Market. In fact, there is a linear organization in the contributors to the forex. The hierarchy for the same is given below based on their significance in the market.

  • Major Banks ( Central banks + Top Commercial Banks)
  • Electronic broking services (EBS) | Reuters dealing
  • Medium-sized banks and small-sized banks
  • Hedge funds and commercial companies | retail ECNs
  • Retail traders

From the above hierarchy, it is clear that the major banks are the largest contributors in the market. Major Banks consist of the largest banks around the world. The uniqueness of the major banks is that they trade directly with each other or via the EBSs or the Reuters dealing. Hence, it is also referred to as the interbank market. And this interbank market includes the medium-sized banks as well as the small-sized banks.

Next up in the line come the hedge funds, commercial companies, and retail ECNs. These sets of traders don’t make the transactions with the interbank market, but, instead, they get it done via commercial banks. Typically, the quotes offered here are much higher than that of the interbank market.

Finally, last up in the line stand the retail traders. Retail traders are the ones who place their trades via forex brokers. The number of traders in this hierarchy is extremely high. However, when it comes to the volume they trade, it is significantly lesser when compared to banks and hedge funds. Back in the day, it was not possible for small retail traders to enter the market. But, nowadays, anyone can trade the Forex market by depositing as low as $100 into their account.

Hence, this completes the lesson on the forex market hierarchy. In the following lesson, we shall take this topic forward by as we’ll be covering the different types of players in the forex market in detail.

[wp_quiz id=”47497″]
Categories
Forex Course

18. What Should You Know About Trading The New York Session

Introduction

After the Asian and the London session, the big fishes enter into the market, i.e., the New York market. When London’s session is halfway through its trading, the New York markets make an entry into the market. Precisely, the New York session begins at 8:00 AM EST. This session is also referred to as the North American session. The liquidity during this session is pretty high.

As we have discussed the average pip movement in the Tokyo session and the London session, let us compare the pip movement by considering all the three sessions. The London session tops the table, which is then followed by the New York session and, finally, the Tokyo session.

Average Pip Movement

London session > New York session > Tokyo session

Now, let us see the average pip movement for some of the extensively traded currencies in the market.

How to trade the New York session

The New York session opens at 8:00 AM EST, which is during the London session. That is, there is an overlap between the two sessions. Since the world’s two largest markets are trading in the forex market, one can expect a high volume of orders flowing into the markets. Hence, this is an ideal time to enter the market as the spreads are quite low during this phase of time.

During the New York session, the economic news begins to drop. And as a matter of fact, 85% of the news is related to the US Dollar. So, news traders can keep a close watch on all the US Dollar pairs as the news typically moves the market drastically.

During the market open, the liquidity of the market is excellent, but as the noon approaches, it begins to drop. That is, during lunch hours, the market goes into a consolidation phase.

Another interesting fact to consider is, the market loses its momentum on Friday afternoon as the weekend begins for the Asian and the European markets. Hence, it is not a good idea to trade on Friday afternoons. Apart from momentum, it is possible for the markets to reverse its direction as the traders might look to square their positions off.

Which pairs should you have on your watchlist

The liquidity during the start of the session is excellent, as the London markets are open as well. So, during this time, you can choose to trade any pair. However, it is recommended to concentrate more on the major and minor currency pairs.

Several news events come in during this session. So, a news trader can take advantage of them, although a novice trader should stay away from pairs affected by such events, as it requires abilities unrelated to technical analysis.

Therefore, all in all, the New York session is a session that can be profitable for all types of traders. The volatility of the market during this session stands in between the London session and the Asian session. Hence, if you’re a novice trader, it is a good idea to start off with the New York session.

We have completed this short tutorial in the New York session. And in the next lesson, we shall go more precisely into when exactly to trade the Forex market. Let’s see if you have understood this lesson correctly by answering the questions below.

[wp_quiz id=”47122″]
Categories
Forex Course

17. What Is The Best Time To Trade The Forex Market?

Introduction

The Forex market is open 24 hours daily and is traded from Monday to Friday. This feature makes it feasible for traders all around the world to trade it. However, it is not quite ideal to trade anytime in Forex. There are specific times of the day and week that offer greater liquidity. These are the times when the professional traders step into the market as well. So, let’s dive right into the topic.

The preferable time to enter the forex market

Liquidity and volatility are the two vital factors a trader must consider before choosing the best time to trade. Because, with the absence of liquidity and volatility, it is not possible to grab big moves in the market. Hence, one must look out for the times when there is a high volume of trading happening in Forex.

As far as liquidity is concerned, liquidity is excellent (as well as volatility) when two sessions overlap. During these times, the volume of orders double, making significant movements on major pairs. Hence, getting in-depth knowledge about how pairs behave during session overlaps is very important.

The overlapping sessions

The Tokyo-London Overlap

During the Asian session, there is not much movement in the market. But, when the London market opens, the Tokyo markets are still running. Hence the volume during the overlap time segment increases as both the markets are actively traded. Having said that, most of the volume comes from London, which ends up suppressing the Tokyo market. Hence, trading this overlap session is highly recommended.

The London-New York session

The London market and the New York market alone bring in considerable volatility. And when both these markets combine, the liquidity rises significantly. Hence, this becomes the ideal time to trade the forex market. Moreover, due to the high liquidity, the spreads during this time are incredibly tight.

Now that we’re clear with the preferable time to trade the markets let us discuss the preferred weekdays to engage in trading.

What are the days of the week best to trade?

Let us answer this question by considering the average pip movement of currencies pairs on all trading days of the week.

From the above table, we can ascertain that the pip movement on Monday is lesser when compared from Tuesday – Friday. Also, on Friday, once the afternoon sets off, the liquidity reduces considerably. Hence, to get the best from the Forex pairs, it is best to work during the middle of the week and near the time of the market openings.

This brings us to the end of this lesson. To get a recap of the above lesson, you can take up the quiz given below.

[wp_quiz id=”47251″]
Categories
Forex Course

14.The Different Sessions In The Forex Market

Introduction

The forex market is traded all across the world. In fact, it is open 24 hours. And these markets are traded in countries when their national markets are open. There are about four major countries where vast lumps of cash flow in and out of the forex market and thereby keeping it very liquid and volatile. To trade professionally, having an idea of the different markets open and close is vital. Hence, in this lesson, we shall be going over the various sessions in the forex market.

Forex market trading sessions

Though all countries trade in the forex market, there are a few countries where the massive volume of trading takes place. The 24 hours trading in the forex market is divided into four sessions. These four sessions are given as follows:

• The Sydney Session 

• The Tokyo Session

• The London Session

• The New York Session

Moreover, the open and close of these sessions vary based on the season as well. One session falls between March/April to October/November, and the other starts from October/November and goes up to March/April. The former is the spring/summer session, and the latter is the Fall/Winter session.

Trade timings during Spring/Summer (in the US)

Trade timings during the Fall/Winter (in the US)

Note that the time represented is the local time (US) and the EST, and is different from every country’s standard time. However, the standard market timings for most countries lie within 7:00 AM and 6:00 PM.

Furthermore, there is an overlap between sessions. That is, during the overlap, the Forex market is traded by two regions simultaneously. For example,

The New York and the London session has an overlap between 8:00 AM – 12:00 PM EST

The Sydney and the Tokyo session overlaps between 7:00 AM and 2:00 AM

And the London and the Tokyo session overlaps between 3:00 AM to 4:00 AM.

These overlapping sessions are essential for traders because at that time is when more liquidity and volatility are created in currency pairs. This is so because traders from two markets operate simultaneously.

Hence, this completes the lesson on the different sessions in the forex market. And in further lessons, we shall discuss each one of the sessions in detail. For now, test your learning of this lesson by taking up the quiz below.

[wp_quiz id=”46553″]
Categories
Forex Market

The Basics of Spread & Slippage

Spread

Did you know that each time you place a trade, you pay a fee to the broker for providing the opportunity & platform to trade? Spreads act as a fee on zero-commission accounts (STP accounts). A spread is simply the price difference between the purchase price and selling price of an asset. The broker always shows two quotes of currency – one at which they sell the underlying asset to you and another at which they buy the underlying asset from you. The spread between these two prices makes the broker’s revenue from the foreign exchange transactions they perform for their clients.

Bid-Ask spread

There are two types of forex rates, the Bid and the Ask.

The price you pay to buy the forex pair is called Ask. It is always slightly higher than the market price.

The price at which you sell the forex pair is called Bid. It is always slightly lower than the market price.

The price that you see on the chart is always a Bid price. The ‘Ask’ price is always higher than the ‘Bid’ price by a few pips. Spread is essentially the difference between these two rates.

Spread = Ask – Bid

For example, when you see EUR/USD rates quoted as 1.1290/1.1291, you buy the pair at the highest Ask price of 1.1291 and sell it lower Bid price of 1.1290. This particular quote shows a spread of 1 pip.

Types of spreads

The kinds of spread depend on the rules of the broker. Spreads can either be fixed or floating.

Fixed spreads remain fixed no matter what the market conditions are at any given point of time. The advantage of this type of spread is that the broker will not be able to widen the spreads during volatility.

Floating, also known as variable spreads, are continually changing. They widen or tighten depending on the supply and demand of currencies and market volatility.

Slippage

Slippage is a phenomenon in the forex market where currency prices change while an order is being placed, thus causing traders to enter or exit trades at prices higher or lower than they desire. Slippage happens because of the imbalance of buyers, sellers, and trade volumes. It also occurs when the market is less active with lower liquidity.

For instance, a trader wants to buy a currency pair at $1.0015 (Current Market Price) with a broker of his choice. Once he submits the buy order, the best-offered price suddenly changes to $1.0020. It is considered as a negative slippage of 5 pips. In the same example, if the best-offered buy price suddenly changes to $1.0005, it is regarded as a positive slippage of 10 pips.

How to avoid slippage?

Slippage cannot be entirely avoided if you trade using market orders, but it can be reduced. One way a trader can minimize slippage is to ensure that their broker has many liquidity providers. Another way is to avoid trading during periods of high volatility as prices move faster and at wider intervals. To check volatility, traders can make use of technical indicators such as Bollinger bands or Average True Range.

The only way to entirely avoid slippage is by using strategies that employ limit orders on entries and exits.

Categories
Forex Course

13. General Myths In The Forex Market Every Trader Must Be Aware Of

Introduction

Forex is the market for trading currency pairs. It is a real business that happens over the internet. However, many new traders do not take it seriously and often associate it with gambling. And this misconception still exists in the minds of people. Hence, it is necessary to fade these thoughts away as it could lead to significant losses in the long term.

Having that said, in this lesson, we shall discuss some of the myths and facts about the forex market, which are vital for traders to know.

Myths about the Forex Market

Forex is a get-rich-quick scheme

Many traders enter into this market with the assumption that they can make quick profits consistently. They start off with a small capital do make quite a good amount of money. This entices them, and they begin to maximize their lot sizes. In the end, they lose all of their profits, including their capital in just one trade. So, do not ever enter the forex market, considering it to be a game of gambling as it can completely blow away your account within no time.

Professional traders have an accuracy of 100% profitability

Whosoever be the trader, when they trade in the forex market, it is almost impossible to have only profitable trades. This is because; sometimes, there are events that happen to occur without the knowledge of the trader. And during these times, there is a high probability for the trade to go against your direction. So, the consistency of a successful trader is around 80-90%.

Stop-losses are purposefully triggered by the broker

Many traders believe that their stop-losses are hunted by their broker. But, this is just a misconception in the minds of people. Note that brokers have absolutely nothing to do with your stop-loss. It is the market itself that hunts for your stop-loss.

There exists ‘THE best strategy’ in trading

Many novice traders, in fact, all novice traders, go in search of the best strategy to trade. But, the truth is that the best strategy is not an absolute term. There are a countless number of strategies out there, and it all depends on you on how you adapt to it. Hence, there the concept of  ‘best strategy’ is just a myth.

You need to have a financial degree to trade in forex

Well, a great fact to know about the forex market is that you do not need any degree to qualify to trade. However, as we always say, education is definitely required for you to succeed in the market even though it is not a formal one.

The price movements in the forex market are entirely random

Even though the forex market is extremely hard to predict, the price movements are not entirely random. There are different ways through which a trader can assess the conditions of these prices. With the help of Technical Analysis or statistical (quant) methods, a trader can moderately anticipate the price action of currency pairs and thereby they can have an edge in the market.

This brings us to the end of this lesson. We hope we’ve cleared out some of the misconceptions you had about the forex market. To have a recap to this lesson, we have a quiz set up for you below.

[wp_quiz id=”46291″]
Categories
Forex Market

What Is Pip & Why Should You Know About It?

What is a pip?

Essentially, a pip represents the price interest point. It is known to be the smallest numerical price move in the forex market. As you know that most currencies are priced to 4 decimal places, obviously, any change in price would start from the last decimal point. For example, in the price quote, $1.0002, ‘2’ indicates the pip value. A pipette means the 5th decimal place, while pip is the 4th decimal place.

For most pairs (except JPY), it is equivalent to 0.01% or 1/100th of one percent. In the forex market, this is referred to as Basis Point (BPS). One BPS is equal to 0.01% and denotes the percentage change in the exchange rate.

Calculation of move

Now that you know what pip means, let us see how it changes the profit and loss in your trading account. Large positions will have greater monetary consequences in your balance. The formula for calculating the value of the position is:

Position size x 0.0001 = Monetary value of pip

Let us use the above formula and apply it in some real pairs. If you open a position of 1000 units, the pip value can be calculated as 1000 (units) x 0.0001 (one pip) = $0.1 per pip.

When you open buy positions and market reacts in your favor, for every pip movement, you will earn $0.1, and the same is the case for a sell position. If the market moves against you after you buy or sell, $0.1 will be lost per pip movement as the trend continues in the opposite direction. Increasing or decreasing the number of positions will have the exact effect on the pip value.

Different currencies and their pip value

Pip value varies per currency as they are dependent on how it is traded. It also depends on the trading platform and the price feed. It is important to know that there are brokers who show four digits as pip, and some show five. One of the most important points you need to know is the average daily trading range, in order to gauge volatility in the market.

Average daily pip movement of major currency pairs

Conclusion

To conclude, pips are the smallest increment by which a currency pair can change in value and represents the fourth decimal of a currency pair other than the Japanese yen. In the case of Japanese yen, the pip is located at the second decimal place. Proper knowledge of pips will help you determine your stop loss size, as it is a major part of any strategy. One should never underestimate the simplicity of pip. Now that you have learned what a pip means, you can proceed to more trading concepts. Cheers!