Categories
Forex Basics

Which Assets to Trade During a Recession

When speaking about a recession, investing might not be the first activity that comes to mind, however, during these testing times, investors and traders can still source out industries that with or without a recession have to keep the wheel rolling. Being able to sift through the thousands of options available, the key essential service providers are what you should be looking at during these dire times we are experiencing now.

Another great way to seek out those investment opportunities during a recession is to look back at the most recent recession and find out which industries managed to stay afloat, or even strive during that period. Below are the top five industries that managed to plow on during the tough times.

Healthcare

Although the financial situation of civilians may be negatively impacted by a recession, there are certain products and services that we really cannot do without, the first on that list is healthcare. During this COVID-19 pandemic, populations all around the world are investing in healthcare products as well as medical equipment to help prepare the people and their respective healthcare systems to combat this new virus.

This is not to say that all health care companies will make it out successfully as there are companies with large debts and less cash flow that will, unfortunately, suffer too during this time. It would also be best to stay away from new and upcoming biotech startups which are still in their early phases which makes them riskier. Therefore, it would be best to source out companies that have a low debt-to-equity ratio as these are the ones more likely to perform better.

Food

Like healthcare, food is a basic necessity that cannot be spared. Looking at the recession that took the world by storm back in 2008, it seems like although populations tend to take a step back from dining out and purchasing expensive food to cut down on their monthly cost, they shift their purchasing to cheaper, pre-packaged food options. Again, looking back to 2008, we can see that popular brands such as Walmart, McDonald’s and other large food chains did relatively well during that tough period.

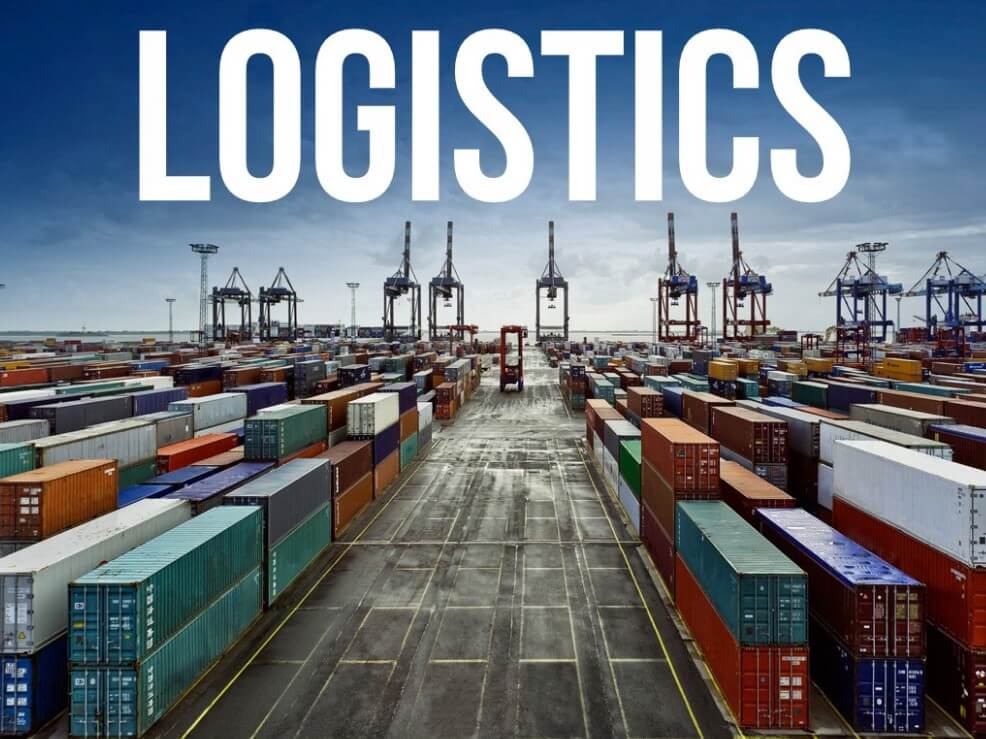
Freight and Logistics

The COVID-19 pandemic brought a halt to most air and sea transportation for people, however, goods are still being shipped and flown across the globe. Freight companies or companies that help to move freight from one country to the other are quite safe options when looking for trading opportunities during recessions such as the one we are currently experiencing.

Do it Yourself

By looking back at 2008, one can notice that although people are unlikely to go out looking to purchase new cars, furniture or properties, during tough times people tend to focus their time and effort on fixing/DIY projects around their household. Taking into consideration that this pandemic has put millions of people on lockdown inside their homes, home projects are definitely on the rise. Any large home and garden improvement centers, as well as auto retailers that focus on parts, might do better during these times

Discount Shops

The high unemployment rates currently plaguing countries all over the world, similar to 2008, people are shifting to more affordable and cheap essential items. When a person’s income is drastically decreased, they have 2 options, either to stop purchasing or to purchase cheaper options. When it comes to essential items, stopping purchasing is not an option, so discount stores such as Dollar General or Walmart are a safe option to invest in. Back in 2008, Dollar general rose by a whopping 60% in that year alone.

Needless to say, it is not only the above-mentioned industries that will most probably come out of this recession without too many scratches, however, but this list can also put you in the right frame of mind of what to look out for. Keep in mind, even from your own experience during recessions, what goods and services do you still require, what services are deemed as non-essential during these times and what would you prioritize if your income suddenly decreased?

Categories
Forex Assets

Analyzing The ‘CHF/AED’ Forex Exotic Pair

Introduction

CHF/AED is the short form for the Swiss Franc against the United Arab Emirates Dirham. It is considered an exotic currency pair. Currencies are always traded in pairs in the Forex market. The main currency in the pair is considered the base currency, while the sequential one is the quote currency.

Understanding CHF/AED

The market value of CHF/AED determines the value of AED required to buy one Swiss Franc. It is priced as 1 CHF per X AED. Hence, if the market price of this pair is 3.8835, these many United Arab Emirates Dirham units are necessary to buy one CHF.

Spread

The spread is the distinction between the ask-bid price. Mostly, these two prices are set by the stockbrokers. The gap between the pip values is through which brokers generate revenue. Below are the ECN & STP Spread values of CHF/AED pair.

ECN: 19 pips | STP: 24 pips

Fees

The fee is the minimum commission you pay to the broker on every single spot you open. There is no fee to be paid on STP accounts, but a few additional pips on ECN accounts.

Slippage

Slippage is the distinction between the price at which the trader implemented the trade and the original price he got from the broker – this changes based on the volatility of the market and the broker’s implementation speed.

Trading Range in CHF/AED

The trading range table will help you determine the amount of money that you will win or lose in every timeframe. This table signifies the minimum, average, and maximum pip movement in a currency pair.

Procedure to assess Pip Ranges

  1. Add the ATR indicator to your chart
  2. Set the period to 1
  3. Add a 200-period SMA to this indicator
  4. Shrink the chart so you can assess a large time period
  5. Select your desired timeframe
  6. Measure the floor level and set this value as the min
  7. Measure the level of the 200-period SMA and set this as the average
  8. Measure the peak levels and set this as Max.

CHF/AED Cost as a Percent of the Trading Range

The price of the trade alters based on the volatility of the market. Hence, the total cost comprises slippage and spreads, excluding from the trading fee. Below is the analysis of the cost difference in terms of percentages.

ECN Model Account

Spread = 19 | Slippage = 5 |Trading fee = 8

Total cost = Slippage + Spread + Trading Fee = 5 + 19 + 8 = 32 

STP Model Account

Spread = 24 | Slippage = 5 | Trading fee = 0

Total cost = Slippage + Spread + Trading Fee = 5 + 24 + 0 = 29

Trading the CHF/AED

The CHF/AED is not a very volatile pair. For example, the average pip movement on the 1H timeframe is only 42 pips. If the volatility is more significant, then the cost of the trade is low. Nevertheless, it involves a higher risk to trade highly volatile markets.

Also, the higher/lesser the proportions, the greater/smaller are the costs on the trade. We can then determine that the costs are higher for low volatile markets and high for highly volatile markets.

To reduce your risk, it is recommended to trade when the volatility is around the minimum values. The volatility here is low, and the costs are slightly high, corresponding to the average and the maximum values. But, if the priority is towards reducing costs, you could trade when the volatility of the market is near the maximum values.

Benefits on Limit orders

For orders that are implemented as market orders, there is slippage applied to the trade. But, with limit orders, there is no slippage valid. Only the spread and the trading fees will be accounted for estimating the total costs. Therefore, this will bring down the cost noticeably.

STP Model Account (Limit Orders)

Spread = 24 | Slippage = 0 | Trading fee = 0

Total cost = Slippage + Spread + Trading Fee = 0 + 24 + 0 = 24

Categories
Forex Assets

Examining The Volatility Of CHF/TRY Forex Exotic Pair

Introduction

The abbreviation of CHF/TRY is Swiss Franc, paired with the Turkish Lira. In this pair, CHF is the official currency of Switzerland and is also the fifth highly traded currency in the Forex Exchange market. In contrast, TRY stands for the Turkish Lira, and it is the official currency of Turkey. This pair is classified as an exotic pair.

Understanding CHF/TRY

In the Foreign exchange market, to determine the relative value of one currency, we need an alternative currency to evaluate. Hence, when we are buying a currency (base) we are simultaneously selling one (the quote currency). The market value of CHF/TRY helps us to understand the power of TRY against the CHF. So, if the trade rate for the pair CHF/TRY is 7.1972, it means to buy 1 CHF, we need 7.1972 TRY.

CHF/TRY Specification

Spread

Spread is the distinction between the ask-bit price that is set at the exchanges. Below are the spread values of the CHF/TRY currency pair in both ECN & STP accounts. The spread charges for ECN and STP brokers for the CHF/TRY pair can be found below.

ECN: 35 pips | STP: 40 pips

Fees

For every position, a trader enters the stockbroker charges some fee for it. Traders must know that this fee is charged only on ECN accounts and not on STP accounts.

Slippage

Slippage is the price difference between the trader’s execution and at which the broker executed the price. The difference is because of the high market volatility and slow execution speed.

Trading Range in CHF/TRY

A trading range is the interpretation of the volatility in CHF/TRY in several timeframes. The values are obtained from the Average True Range indicator. One can use the table as a risk management tool to identify the profit/loss that a trader is possessed.

Below is a table indicating the minimum, average, and max volatility (pip movement) on various timeframes.

Procedure to assess Pip Ranges

  1. Add the ATR indicator to your chart
  2. Set the period to 1
  3. Add a 200-period SMA to this indicator
  4. Shrink the chart so you can assess a large time period
  5. Select your desired timeframe
  6. Measure the floor level and set this value as the min
  7. Measure the level of the 200-period SMA and set this as the average
  8. Measure the peak levels and set this as Max.

CHF/TRY Cost as a Percent of the Trading Range

The total cost of the trade fluctuates based on the volatility of the market. So, we must figure out the occasions when the costs are less to place ourselves in the market. Below is a table demonstrating the variant in the costs based on the change in the volatility of the market.

Note: The percentage rates represent the relative scale of costs and not the fixed costs on the trade.

ECN Model Account

Spread = 35 | Slippage = 5 | Trading fee = 8

Total cost = Slippage + Spread + Trading Fee = 5 + 35 + 8= 48

STP Model Account

Spread = 40 | Slippage = 5 | Trading fee = 0

Total cost = Slippage + Spread + Trading Fee = 5 + 40 + 0 = 45

The Ideal way to trade the CHF/TRY

Volatility and cost are the two components traders take into consideration for trading any security in the market. With the assistance of the above tables, let us evaluate these two factors to trade the CHF/TRY Forex pair.

As we can see, the pip variation is significantly high between the minimum volatility and the average volatility in each timeframe. As a day trader, our aim is to make income from the market’s pip movement. But, if there is hardly any movement in the price, it becomes tricky to make profits from the market. Thus, it is ideal to trade when the volatility is at the average value.

The cost of trade rises as the volatility decrease. They are inversely proportional. In other words, highly volatile markets have minimum costs. Though it is quite risky to trade markets with higher volatility, it can be considered by aggressive traders with optimal money management techniques in place as the costs are low. Hence, to retain a balance among the cost and volatility, traders may find trading occasions when the volatility is near the average values or a little above it.

Categories
Forex Assets

Everything About Trading The CHF/DKK Forex Asset Class

Introduction

The abbreviation of CHF/DKK is Swiss Franc, paired with the Danish Krone. Here CHF is the official currency of Switzerland and is also the fifth highly traded currency in the Forex market. In contrast, DKK stands for the Danish Krone, and it is the official currency of Denmark and the provinces of Greenland and the Faroe Islands.

Understanding CHF/DKK

In the Foreign exchange market, to ascertain the comparative value of one currency, we need an alternative currency to evaluate. Once when we buy a currency, which is identified as the base currency and simultaneously sell the quote currency. The market value of CHF/DKK helps us to comprehend the power of DKK against the CHF. So if the trade rate for the pair CHF/DKK is 6.9915, it means to buy 1 CHF, we need 6.9915 DKK.

CHF/DKK Specification

Spread

A spread is described as a distinction between the buying & offering price of a Forex pair. In other words, it is a distinction between the ask-bid price of an asset. Below is the spread charges for ECN and STP stock brokers for CHF/DKK pair.

ECN: 12 | STP: 17

Fees

A Fee is a cost that we traders pay to the broker for achieving a trade. The Fees differ on the type of broker (STP/ECN) we use.

Slippage

When we want to implement a trade at a specific market rate, but as a replacement for it, the trade gets implemented at a different rate, and that is because of the slippage. Slippage occurs when we deal with a volatile market, and when we execute a large order at the same time.

Trading Range in CHF/DKK

The trading range in the table below will ascertain the amount of money we will gain or lose in each timeframe. We have the interpretation of the minimum, average, and maximum pip movement in a currency pair in the below table. Now we will use the ATR indicator that demonstrates the price movement in a currency pair.

Below is a table demonstrating the minimum, average, and max volatility (pip movement) on numerous timeframes.

Procedure to assess Pip Ranges

  1. Add the ATR indicator to your chart
  2. Set the period to 1
  3. Add a 200-period SMA to this indicator
  4. Shrink the chart so you can assess a large time period
  5. Select your desired timeframe
  6. Measure the floor level and set this value as the min
  7. Measure the level of the 200-period SMA and set this as the average
  8. Measure the peak levels and set this as Max.

CHF/DKK Cost as a Percent of the Trading Range

The price of trade differs on the type of broker and fluctuates based on the volatility of the market. The aggregated cost of trade involves spread, fees, and occasionally slippage if the volatility is high. To reduce the cost of the trade, we can use limit orders as an alternative for market execution.

ECN Model Account

Spread = 12 | Slippage = 5 | Trading fee = 8

Total cost = Slippage + Spread + Trading Fee = 5 + 12 + 8= 25

STP Model Account

Spread = 17 | Slippage = 5 | Trading fee = 0

Total cost = Slippage + Spread + Trading Fee = 5 + 17 + 0 = 22

The Ideal way to trade the CHF/DKK

CHF/DKK is an exotic currency pair. Here, the average pip movement in 1hr timeframe is 99, which implies higher volatility. The greater the volatility, the greater is the risk and low cost of the trade and the other way around. Considering the above tables, we can see from the trading range that when the pip movement is lower, the proportion is high, and when the pip movement is elevated, the proportion is low.

The ratios are higher in the minimum column. This indicates the cost is high when the volatility of the market is lower. For example, on the 1H timeframe, when the volatility is 24 pips, the cost percentage is 104.17%. Meaning, one must accept high costs if they enter or exit trades when the volatility is around 24 pips. So, preferably, it is suggested to trade when the market volatility is higher than the average.

Categories
Forex Assets

Costs Involved While Trading The XBR/USD Asset Class

Introduction

BCO is an acronym for Brent Crude Oil, which is one of the two types of crude oil and is a benchmark for determining the price of oil, along with West Texas Intermediate (WTI) crude oil. BCO is also known by Brent Blend, Brent Oil, and London Brent. It is the benchmark for the majority of the crude oil from the Atlantic basin, which marks for two-thirds of the crude oil price traded internationally. In the market, it is traded with the ticker XBR/USD.

Understanding XBR/USD

Brent Crude is a commodity traded in barrels. The price of XBR/USD depicts the value of the US Dollar for 1 barrel of crude oil. It is quoted as 1 XBR per X USD. For example, if the market price of XBR/USD is 41.42, then it means that each barrel of crude oil is worth $41.42.

XBR/USD Specification

Spread

It is the basic difference between the bid price and the ask price. The spread on ECN and STP account model is as follows:

ECN: 11 | STP: 15

Fee

There is a fee (commission) for every position a trader opens. However, this fee is only on the ECN account, not the STP account.

Slippage

Slippage is the difference between the price intended by the trader and the price given by the broker. It occurs due to two factors:

  • Broker’s execution price
  • The volatility of the market

 Trading Range in XBR/USD

It is the representation of the volatility of the market in different time frames. The table values represent the minimum, average, and maximum pip movements in various time frames. 

Procedure to assess Pip Ranges

  1. Add the ATR indicator to your chart
  2. Set the period to 1
  3. Add a 200-period SMA to this indicator
  4. Shrink the chart so you can assess a large time period
  5. Select your desired timeframe
  6. Measure the floor level and set this value as the min
  7. Measure the level of the 200-period SMA and set this as the average
  8. Measure the peak levels and set this as Max.

XBR/USD Cost as a Percent of the Trading Range

The following are two tables that represent the variation in the fee in terms of a percentage for different time frames. The percentage values are calculated by finding the ratio between the total cost and the volatility values.

ECN Model Account

Spread = 11 | Slippage = 5 | Trading fee = 5

Total fee = Spread + Slippage + Trading fee

Total fee = 11 + 5 + 5 = 21 (pips)

STP Model Account

Spread = 15 | Slippage = 5 | Trading fee = 0

Total fee = Spread + Slippage + Trading fee

Total fee = 15 + 5 + 0 = 20 (pips)

Trading the XBR/USD

Crude oil is a commodity that is rigorously traded in the market. Its volatility and liquidity are comparable to major and minor currency pairs, providing good opportunities for traders to participate in the market. The crude oil prices are driven by various fundamental factors and its Demand and Supply. The reflection of the same is seen on the charts. Thus, traders can apply technical analysis as well to forecast the price movements.

There is a fee on every trade you take with a forex broker. This fee is the same irrespective of the time frame you trade on. So, traders must place themselves in a position that will have a reasonable cost for a sufficient P/L. The trading range and the cost percentage table are the tools for it.

The larger the percentage value, the higher is the relative fee on the trade and vice versa. For example, let’s there are two traders – 1D and 4H trading with the same lot size. The 1D trader places a take profit to 200 pips, while the 4H trader places it at 100 pips. But the fee paid by both the traders is the same. But, seeing the relative fee, the 4H trader pays a higher fee than the 1D trader because his take profit is only 100 pips. Thus, the percentage values are higher in the 1D time frame than the 4H time frame.

There is another scenario where the relative cost changes based on the volatility of the market. In simple terms, the relative fee can vary even if a trader trades in the same time frame. Precisely, the relative fee is higher when the volatility of the market is around the minimum values. Therefore, to balance between the total fee and the P/L, one must trade when the market volatility is above the average volatility, irrespective of the time frame traded.

Categories
Forex Assets

Asset Analysis – Analyzing The XAG/USD Asset Class

Introduction

Silver is a precious metal standing after Gold. It is a vital asset to understand and forecast the potential movements in the commodity market. This is because buyers and sellers trade the silver market based on global macro trends. Moreover, Silver highly correlates with the Gold Spot prices. XAG/USD is the ticker for Silver against the US Dollar. XAG can be traded against other fiat currencies as well.

Understanding XAG/USD

Silver is a commodity that is traded in troy ounces (Oz), just like any other precious metal. The market price of XAG/USD represents the value of the US Dollar for 1 ounce (Oz) of Silver. It is quoted as 1 XAG per X USD. For example, if the market price of XAG/USD is 17.432, it signifies that each ounce of Gold is worth $17.432.

XAG/USD Specification

Spread

Spread is essentially the difference between the buying price and the selling price. The spread varies on the based account-model used.

ECN: 15 | STP: 21

Fee

A fee is basically the commission on the trade. It applies only to ECN accounts, not STP accounts.

Slippage

The arithmetic difference between the price asked by the trader and the price given by the Broker is referred to as slippage. It occurs due to two reasons: High market volatility & Broker’s execution speed

Trading Range in XAG/USD

The minimum, average, and maximum pip movement in different time frames is represented in the following table. It can be used to assess your risk on the trade.

Procedure to assess Pip Ranges

  1. Add the ATR indicator to your chart
  2. Set the period to 1
  3. Add a 200-period SMA to this indicator
  4. Shrink the chart so you can assess a large time period
  5. Select your desired timeframe
  6. Measure the floor level and set this value as the min
  7. Measure the level of the 200-period SMA and set this as the average
  8. Measure the peak levels and set this as Max.

XAG/USD Cost as a Percent of the Trading Range

Cost a percent of the trading range is the representation of the variation in fees on the trade-in different time frames for varying volatility.

ECN Model Account

Spread = 15 | Slippage = 5 | Trading fee = 5

Total fee = Spread + Slippage + Trading fee

Total fee = 15 + 5 + 5 = 25 (pips)

STP Model Account

Spread = 21 | Slippage = 5 | Trading fee = 0

Total fee = Spread + Slippage + Trading fee

Total fee = 21 + 5 + 0 = 26 (pips)

Trading the XAG/USD

Silver Spot is extensively traded in the commodity market, after Gold Spot. It offers enough volatility and liquidity for traders to participate in the market. Silver highly correlates to Gold. Traders can use it as a proxy to place their bets on Silver prices. The technical analysis can be used on Silver as applied to any other market. Even though there is enough volatility in this pair, it is not ideal for entering any time into the market. The reason for it can be accounted for through the cost percentage table.

The cost percentage table represents how expensive a trade is going to be based on the time frame and volatility. Note that, the absolute total cost will remain the same irrespective of the two factors but will vary relatively. For instance, a 1H trader must pay the same fee a 4H trader pays for their trade. But, there a catch; the 4H trader generates more P/L than a 1H trader.

Thus, to have a balance between the P/L and fee on the trade, one must trade when the market volatility at or above the average values. Trading in low volatility markets will cause hurdles in the market to reach your target. Hence, we will have to pay the same costs, even for a small P/L.

Categories
Forex Assets

AUD/RON – What Should You Know Before Trading This Exotic Pair?

Introduction

The abbreviation of AUD/RON is Australian Dollar paired with Romanian Leu. Here AUD is the official currency of Australia and is also to be the fifth most traded currency in the Forex market. While RON stands for The Romanian leu, and it is the currency of Romania.

Understanding AUD/RON

In AUD/RON currency pairs, the first currency (AUD) is the base currency, and the second currency (RON) is the quote currency. In the Foreign Exchange market, we always buy the base currency and simultaneously sell the quote currency and vice versa. Here, the market value of AUD/RON helps us to understand the strength of RON against the AUD. So if the exchange rate of the pair AUD/RON is 2.9141, it means to buy1 AUD we need 2.9141 RON.

Spread

Forex brokers charge some commission on the trade we open, and that depends on the ask and the bid price by the broker. Spread is the difference between this Ask and Bid price. Every broker has different ask and bid prices. Below is the spread charges for ECN and STP brokers for AUD/RON pair.

ECN: 33 pips | STP: 35 pips

Fees

A Fee is the charges that we traders pay to the broker for opening a trade. This fee depends on the type of broker we use (STP/ECN).

Slippage

When we want to execute a trade at a particular market rate, but instead, the trade gets executed at a different rate. This is because of slippage. Slippage can take place at any time, but mostly we can counter a volatile market, and when we execute a large order at the same time.

Trading Range in AUD/RON

As a trader, our main motive should be to know the market volatility and avoid losses. The trading range here will determine the amount of money we will win or lose in a given amount of time. ATR is a technical indicator that indicates the price movement in a currency pair. In the below table, we have the representation of the minimum, average, and maximum pip movement in a currency pair. We will evaluate it merely by using the ATR indicator combined with 200-period SMA.

Procedure to assess Pip Ranges

  1. Add the ATR indicator to your chart
  2. Set the period to 1
  3. Add a 200-period SMA to this indicator
  4. Shrink the chart so you can determine a significant period
  5. Select your desired timeframe
  6. Measure the floor level and set this value as the min
  7. Measure the level of the 200-period SMA and set this as the average
  8. Measure the peak levels and set this as Max.

AUD/RON Cost as a Percent of the Trading Range

The cost of trade depends on the broker type and varies based on the volatility of the market. The overall cost of trade includes spread, fees, and sometimes slippage if the volatility is more. To decrease the cost of the trade, we can use limit orders instead of market execution.

ECN Model Account

Spread = 33 | Slippage = 3 |Trading fee = 5

Total cost = Slippage + Spread + Trading Fee = 3 + 33 + 5 = 41

STP Model Account

Spread = 35| Slippage = 3 | Trading fee = 0

Total cost = Slippage + Spread + Trading Fee = 3 + 35 + 0 = 38

Trading the AUD/RON

AUD/RON is an exotic currency pair. As we can see, the average pip movement in 1hr is 127, which shows the volatility is very high. Note, the higher the volatility, the higher is the risk and lower is the cost of the trade and vice versa.

Taking an example, we can see from the trading range that when the pip movement is lower, the charge is high, and when the pip movement is high, the charge is low. AUD/RON must be traded with proper risk management because of its volatile nature. If we have our strategy with adequate risk management, we can trade in a volatile market too.

Categories
Forex Assets

Trading The AUD/DKK Forex Pair & Analyzing The Trading Costs Involved

Introduction

The abbreviation of AUD/DKK is the Australian Dollar paired with the Danish Krone. Here, AUD is the official currency of Australia and many others like Christmas Island and Norfolk Island. AUD is also to be the fifth most traded currency in the Forex market. In contrast, DKK stands for the Danish Krone, and it is the currency of Denmark, Greenland, and the Faroe Islands.

Understanding AUD/DKK

In AUD/DKK currency pairs, the first currency(AUD) is the base currency, and the second currency(DKK) is the quote currency. In the foreign exchange market, when we sell a currency pair, we always sell the base currency and simultaneously buy the quote currency and vice versa. Here, the market value of AUD/DKK helps us to understand the strength of DKK against the AUD. So if the exchange rate for the pair AUD/DKK is 4.4625, it means we need 4.4625 DKK to buy 1 AUD.

Spread

Forex brokers have two prices for currency pairs: the bid and ask price. The bid price is the price in which we sell an asset, and ask is the price at which we buy it. The difference between the ask and the bid price is called the spread. Below are the spread values for the AUD/DKK Forex pair.

ECN: 20 pips | STP: 23 pips

Fees

A Fee is the charges that we traders pay to the broker for opening a trade. This fee depends on the type of broker (STP/ECN) we use.

Slippage

When we want to execute a trade at a particular price, but instead, if the trade gets executed at a different price, we call that difference as Slippage. The Slippage can take place at any time, but mostly we can counter a volatile market.

Trading Range in AUD/DKK

As a trader, our main motive should be to avoid losses and risks. The trading range here will determine the amount of money we will win or lose in a given amount of time. ATR is a technical indicator that indicates the price movement in a currency pair. In the below table, we have the representation of the minimum, average, and maximum pip movement in a currency pair. We will evaluate it merely by using the ATR indicator combined with 200-period SMA.

Procedure to assess Pip Ranges

  1. Add the ATR indicator to your chart
  2. Set the period to 1
  3. Add a 200-period SMA to this indicator
  4. Shrink the chart so you can assess a significant period
  5. Select your desired timeframe
  6. Measure the floor level and set this value as the min
  7. Measure the level of the 200-period SMA and set this as the average
  8. Measure the peak levels and set this as Max.

AUD/DKK Cost as a Percent of the Trading Range

The cost of trade depends on the broker type and varies based on the volatility of the market. The total cost of trade involves spread, fees, and sometimes Slippage if the volatility is more.

ECN Model Account

Spread = 20 | Slippage = 3 |Trading fee = 5

Total cost = Slippage + Spread + Trading Fee = 3 + 20 + 5 = 28 

STP Model Account

Spread = 23| Slippage = 3 | Trading fee = 0

Total cost = Spread + Slippage + Trading Fee = 23 + 3 + 0 = 26

Trading the AUD/DKK

AUD/DKK is an exotic currency pair that less traded in the forex exchange market. The average pip movement in 1hr is 183, which shows the volatility is very high.

Note, The higher the volatility, the higher is the risk and lower is the cost of the trade and vice versa. Taking an example, we can see from the trading range when the pip movement is more, the cost is low, and when the pip movement is low, the cost is high.

Trading using LIMIT ORDERS

To reduce our costs of trade, we can place the trades using limit orders instead of market orders. In doing so, we can eliminate the Slippage that will help reduce the overall cost of the trade. An example of a Limit order is given below.

Spread = 20 | Slippage = 0 |Trading fee = 5

Total cost = Slippage + Spread + Trading Fee = 0 + 20 + 5 = 25

Categories
Forex Assets

Everything About Trading The ‘AUD/NOK’ Forex Exotic Pair

Introduction

The abbreviation of AUD/NOK is the Australian Dollar and the Norwegian Krone. AUD is the official currency of Australia and many others like Christmas Island, Cocos Islands, and Norfolk Island. This currency is also proven to be the fifth most traded currency in the Forex market right after USD, EURO, JPY, and GBP. Whereas the NOK stands for Norwegian Krone, and it is the official currency of Norway and its dependent territories.

Understanding AUD/NOK

In the Forex, Currency pairs are the national currencies from two countries coupled for being exchanged in reference to each other. The first currency here is the base currency, and the second currency is the quote currency. Here, the market value of AUD/NOK helps us to understand the strength of NOK against the AUD. So if the value for the pair AUD/NOK is 6.5921, it means we need 6.5921 NOK to buy 1 AUD.

Spread

All Forex brokers have two different prices for currency pairs: selling price and buying price, and they are known as bid and ask price. Spread is the difference between the selling price and the buying price. Below is the spread for ECN and STP brokers for the AUD/NOK pair.

ECN: 50 pips | STP: 53 pips

Fees & Slippage

A Fee in Forex is the commission we need to pay to the broker for executing a particular position. If we subtract the trader’s expected price with the actual price at which the trade is executed, we get the Slippage. It occurs when the volatility of the currency pair is high. It may also occur when a large number of orders are placed at the same time.

Trading Range in AUD/NOK

Volatility is a basic measure of risk every trader should be well aware of before entering the market. Whether we have a profit or loss in a given time period relies on the pip movement of that currency pair. This can be assessed using the trading range table. The trading range here represents the minimum, average, and maximum movement of the pip in AUD/NOK.

Procedure to assess Pip Ranges

  1. Add the ATR indicator to your chart
  2. Set the period to 1
  3. Add a 200-period SMA to this indicator
  4. Shrink the chart so you can assess a significant period
  5. Select your desired timeframe
  6. Measure the floor level and set this value as the min
  7. Measure the level of the 200-period SMA and set this as the average
  8. Measure the peak levels and set this as Max.

AUD/NOK Cost as a Percent of the Trading Range

We must be aware of the over cost we will pay to trade a currency pair. The cost of trading a currency pair depends mostly on the volatility and also the broker, which we use. The overall cost here involves spread, slippage, and the trading fee. Below we will see the calculation of the cost variation in terms of percentages.

ECN Model Account

Spread = 50 | Slippage = 3 |Trading fee = 5

Total cost = Slippage + Spread + Trading Fee = 3 + 50 + 5 = 58

STP Model Account

Spread = 53 | Slippage = 3 | Trading fee = 0

Total cost = Slippage + Spread + Trading Fee = 3 + 53 + 0 = 56

Trading the AUD/NOK

We are much aware of major and minor currency pairs, but there are few currencies that are less traded in the foreign exchange market. These currencies are called exotic-cross currency pairs. AUD/NOK is one such exotic pairs. As we see in the trading range chart, the average pip movement of AUD/NOK is 205, and by this, we can conclude that AUD/NOK is a volatile market.

To have a better understanding of the volatility, we will try to understand this with the help of an example. In the 1H time frame, the average pip movement is 205, and the cost percentage is 28.29%. Where in the minimum pip movement in 1hr is 81 and trading, it will cost us 71.60%.

This shows us that higher the volatility lesser is the cost of a trade. But trading in a volatile market involves risk as the movement of the pips is very fast. However, we can trade a volatile market if we follow proper money management rules.

Categories
Forex Assets

‘BNB/USD’ – Analyzing The Trading Costs Involved

Introduction

BNB/USD is the abbreviation for the cryptocurrency pair Binance coin against the US dollar. This pair is quite volatile to trade compared to coins like Bitcoin, Ether, Ripple, and Litecoin. It has a market capitalization of 2.76B. Because of its volatile nature, this pair is usually traded in cryptocurrency exchanges than forex brokers.

Understanding BNB/USD

The market price of BNB/USD represents the value of the US Dollar equivalent to one Binance coin. It is quoted as 1 BNB per X USD. For example, if the value of BNB/USD is 17.541, then we can say that each Binance coin is worth 17.541 US dollars.

BNB/USD specifications

Spread

Spread is the difference between the bid and the ask price that is set the exchanges. Below are the spread values of the BNB/USD currency pair in both ECN & STP accounts.

ECN: 45 pips | STP: 53 pips

Fee

For every position a trader opens, the broker charges some fee for it. Traders must know that this fee is applicable only on ECN accounts and not on STP accounts.

Slippage

Slippage is the difference between the price required by the trader for execution and the price at which the broker executed the price. There is this difference due to the high market volatility and slower execution speed.

Trading Range in BNB/USD

A trading range is the representation of the volatility in BNB/USD in different timeframes. The values are extracted from the Average True Range indicator. One may use the table as a risk management tool as it determines the profit/loss that a trader is possessed towards.

Procedure to assess Pip Ranges

  1. Add the ATR indicator to your chart
  2. Set the period to 1
  3. Add a 200-period SMA to this indicator
  4. Shrink the chart so you can assess a large time period
  5. Select your desired timeframe
  6. Measure the floor level and set this value as the min
  7. Measure the level of the 200-period SMA and set this as the average
  8. Measure the peak levels and set this as Max.

BNB/USD Cost as a Percent of the Trading Range

The total cost of the trade varies based on the volatility of the market. So, we must figure out the times when the costs are less to position ourselves in the market. Below is a table representing the variation in the costs based on the change in the volatility of the market.

Note: The percentage values only depict the relative magnitude of costs and not the actual costs on the trade.

ECN Model Account

Spread = 45 | Slippage = 10 |Trading fee = 10

Total cost = Slippage + Spread + Trading Fee = 10 + 45 + 10 = 65

STP Model Account

Spread = 53 | Slippage = 10 | Trading fee = 0

Total cost = Slippage + Spread + Trading Fee = 10 + 53 + 0 = 63

Trading the BNB/USD

Volatility and Cost are the two factors traders take into account for trading any security in the market. With the assistance of the above tables, let’s analyze these two factors to ideally trade the BNB/USD.

Volatility

In every timeframe, we can see that the pip difference is significantly high between the minimum volatility and the average volatility. As a day trader, our aim is to make money from the movement of the market. But, if there is hardly any movement in the price, then it becomes challenging to extract some money out from the market. Hence, it is ideal to trade when the volatility is at least at the average value.

Cost

The cost increases as the volatility decrease. They are inverse to each other. In other terms, highly volatile markets have the least costs. However, it is quite risky to trade markets with extreme volatility though the costs are low. Hence, to maintain a balance between the cost and volatility, traders may find trading opportunities when the volatility is around the average values or a little above it.

Bonus

Traders can also bring down their total costs by placing orders as ‘limit’ instead of ‘market.’ This will entirely cut the slippage on the trade and therefore reduce the total cost. In the above example, the total cost would decrease by ten pips, which quite a decent reduction for just changing the type of order execution.

Categories
Forex Assets

Analyzing GBP/BGN Exotic Pair & Comprehending The Costs Involved

Introduction

GBP stands for the British pound sterling, which is sometimes also known as the Pound. It is the 4th most traded currency in the Foreign Exchange market after USD, EURO and YEN. Whereas, BGN is the abbreviation of the Bulgarian lev, and it is the official currency of Bulgaria.

Understanding GBP/BGN

In Forex, the currencies are traded in pairs. In this case, GBP is the base currency, and BGN is the quote currency. Generally, if the value of the base currency goes up, the value of the quote currency goes down and vice versa. The market value of GBP/BGN determines the strength of BGN against GBP. It can be easily comprehended as 1GBP is equal to how much of BGN. So, if the exchange rate of GBP/BGN is 2.2409, to buy 1GBP, we need 2.2409 BGN.

Spread

Spread is the athematic difference between the bid and ask prices. Here, the bid is the selling price, whereas ask is the buying price of the currency pair. So basically, the spread is a type of commission brokers make for the services they provide. Below are the ECN and STP spread values for the pair GBP/BGN.

ECN: 19 pips | STP: 22 pips

Fees

It is obvious that we need to pay some commission to the broker every time we place a trade. A Fee is simply that commission we pay to the broker for opening a particular position. This fee varies from the type of broker we use. For example, there is no fee charged for STP account models, whereas a few pips are charged by ECN brokers.

Slippage

Slippage is referred to as the difference between the expected price at which the trader wants to buy/sell a currency pair and the price at which the trade is executed in real-time. It is important to know that slippage can occur at any time. However, it mostly happens when the market is extremely volatile.

Trading Range in GBP/BGN

Whether we make a profit or loss in a given time period depends on the movement of a currency pair. This can be assessed using the trading range table that is given below. It is basically a representation of the min, avg, and the maximum pip movement in a Forex currency pair. Evaluating the volatility of the market before taking the trade is the most important thing to do. The trading range here is to measure the volatility of the GBP/BGN pair.

Procedure to assess Pip Ranges

  1. Add the ATR indicator to your chart
  2. Set the period to 1
  3. Add a 200-period SMA to this indicator
  4. Shrink the chart so you can assess a significant period
  5. Select your desired timeframe
  6. Measure the floor level and set this value as the min
  7. Measure the level of the 200-period SMA and set this as the average
  8. Measure the peak levels and set this as Max.

GBP/BGN Cost as a Percent of the Trading Range

Most of the time, the cost of trade depends on the type of broker we choose. This varies based on the market’s volatility. The total cost involves the costs incurred from slippage and spreads along with the trading fee. Below we have discussed the cost variation in terms of percentages. Let’s look into both the ECN and the STP models.

ECN Model Account

Spread = 19 | Slippage = 3 |Trading fee = 5

Total cost = Slippage + Spread + Trading Fee = 3 + 19 + 5 = 27

STP Model Account

Spread = 22| Slippage = 3 | Trading fee = 0

Total cost = Slippage + Spread + Trading Fee = 3 + 22 + 0 = 25

Trading the GBP/BGN

The GBP/BGN is an exotic-cross currency pair and is a low volatile market. As seen in the Range table, the average pip movement on the 1-hour time frame is only 36. This clearly shows that if we trade this pair, we will have to wait for a more extended period to get some good profit as the pip movement is very less.

On any given day, if the market volatility is high, the cost of the trade is lower and vice-versa. However, this shouldn’t be considered as an advantage always because more the volatility, the riskier is our trade.

For instance, in the 1M time frame, the maximum pip range value is 1559, and the minimum is 336. When we compare the fees for both the pip movements, we find that 8.04% is the fee for the former, and it is only 1.73% for the latter. Hence we can infer that the prices are higher for low volatile markets and low for highly volatile markets.

Categories
Forex Assets

Exploring The GBP/XPF Exotic Forex Currency Pair

Introduction To GBP/XPF

The abbreviation of GBP/XPF is British Pound vs. the French Pacific Franc. Here GBP is the official currency of the United Kingdom, and many others, it is also proven to be the fourth most traded currency in the forex market after USD, EURO, and JPY. In contrast, The CFP franc is the currency used in French overseas.

Understanding GBP/XPF

We know that in currency pairs, the first currency is the base currency, and the second currency is the quote currency. Here, the market value of GBP/XPF helps us to understand the strength of XPF against the GBP. So let’s take if the exchange rate for the pair GBP/XPF is 135.984, it means we need 135.984 XPF to buy 1 GBP.

Spread

We have two different prices for currency pairs in forex, the bid and ask price. Here the “bid” price at which we can SELL the base currency, and The “ask” price is at which we BUY the base currency. The difference between the ask price and the bid price is called the spread. Below is the spread for ECN and STP broker for the GBP/XPF pair.

ECN: 52 pips | STP: 55 pips

Fees

A Fee in forex is simply the commission we need to pay to the broker for opening a particular position. The fees depend on the type of broker we use. Like for example, we don’t have any fees for ECN, but we have some for STP.

Slippage

Slippage is the difference between the trader’s anticipated price and the actual price at which the trade is executed. It mostly occurs when the volatility of the currency pair is high and also, sometimes, when a large number of orders are placed at the same time.

Trading Range in GBP/XPF

Volatility is an essential factor that every trader should take into consideration before entering the market. The amount of capital we will win or lose in a given amount of time can be evaluated using the trading range table. Here, the trading range is a representation of the minimum, average, and maximum pip movement in a currency pair. This can be evaluated simply by using the ATR indicator combined with 200-period SMA.

Procedure to assess Pip Ranges

  1. Add the ATR indicator to your chart
  2. Set the period to 1
  3. Add a 200-period SMA to this indicator
  4. Shrink the chart so you can assess a significant period
  5. Select your desired timeframe
  6. Measure the floor level and set this value as the min
  7. Measure the level of the 200-period SMA and set this as the average
  8. Measure the peak levels and set this as Max.

GBP/XPF Cost as a Percent of the Trading Range

The cost of trade depends mostly on the broker and also varies based on the volatility of the market. We have various costs involved in the overall trading cost that includes slippage, spreads, and sometimes the trading fee. Below is the calculation of the cost variation in terms of percentages. The conception of it is discussed in the following sections.

ECN Model Account

Spread = 52 | Slippage = 3 |Trading fee = 5

Total cost = Slippage + Spread + Trading Fee = 3 + 52 + 5 = 60

STP Model Account

Spread = 55| Slippage = 3 | Trading fee = 0

Total cost = Slippage + Spread + Trading Fee = 3 + 55 + 0 = 58

Trading the GBP/XPL

There are some currencies that are very less traded in the foreign exchange market. These currencies are called exotic-cross currency pairs. GBP/XPL is one such exotic currency pairs. Further, the average pip movement on the 1H timeframe is only 14 pips, which is considered to be very less volatile.

We also have to note that if we trade in a low volatile market, our trading will be very expensive. However, It is recommended to trade in a currency pair with medium volatility. To comprehend this better, we will try to understand this with the help of an example.

As we can see in the 1M time frame, the Maximum pip range value is 865, and the minimum is 217. Now when we compare the trading cost in accordance with the pip movement, we note that in 217pip movement fess is 26.73%, and for 865pip movement, fess is only 6.71%. So overall we can conclude that trading this pair will be very expensive.

Categories
Forex Assets

Analyzing The GBP/SAR Exotic Currency Pair

Introduction

In the Forex market, currencies are traded in pairs, and one currency is always quoted against the other. The abbreviation of GBP/SAR is British Pound Saudi Riyal. Here, the first currency GBP is the base currency, and the second one SAR is the quote currency.

Understanding GBP/SAR

We compare the value of one currency to another, and hence when we buy a currency pair, we are essentially buying the base currency and selling the quote currency. The market value of GBP/SAR determines the strength of SAR against the GBP, so if the exchange rate for the pair GBP/SAR is 4.7167, it means we need 4.7167 SAR to buy 1 GBP.

Spread

Trading the Forex market usually does not involve in spending a lot of commissions like the Stock market. Here, Forex brokers make a profit through spreads. The difference between the Bid and the Ask prices of an asset is called the spread. Some broker has the cost inbuilt into the buy and sell prices of the currency pair we want to trade instead of charging a separate fee. Below are the spread values of ECN and STP brokers for the GBP/SAR pair.

ECN: 40 pips | STP: 44 pips

Fees

A Fee is simply the charges we pay to the broker for executing a particular trade. The fee varies from the type of broker we use. For example, the fee on the STP account model is zero, but we can expect a few pips on ECN accounts.

Slippage

Slippage is the implementation of a trade at a price different from that requested by a trader. Slippage can either be positive (be additional profit) or negative (additional loss) and Mostly occurs when the market is volatile.

Trading Range in GBP/SAR

The trading range is used here is to measure the volatility of the GBP/SAR pair. The amount of money we will win or lose in a given amount of time can be assessed using the trading range table. The minimum, average, and maximum pip movement of the currency pair is represented in the trading range. This can be evaluated simply by using the ATR indicator combined with 200-period SMA.

Procedure to assess Pip Ranges

  1. Add the ATR indicator to your chart
  2. Set the period to 1
  3. Add a 200-period SMA to this indicator
  4. Shrink the chart so you can assess a significant period
  5. Select your desired timeframe
  6. Measure the floor level and set this value as the min
  7. Measure the level of the 200-period SMA and set this as the average
  8. Measure the peak levels and set this as Max.

GBP/SAR Costs as a Percent of the Trading Range

The cost of trade depends on the broker and differs according to the volatility of the market. This is because the trading cost includes slippage, fees, and the spread. The cost of variation in terms of percentage is given below. We will look into both the ECN model and the STP model.

ECN Model Account

Spread = 40 | Slippage = 3 |Trading fee = 5

Total cost = Slippage + Spread + Trading Fee = 3 + 40 + 5 = 48

STP Model Account

Spread = 44| Slippage = 3 | Trading fee = 0

Total cost = Slippage + Spread + Trading Fee = 3 + 44 + 0 = 47

Trading the GBP/SAR Forex pair

The GBP/SAR is an exotic-cross currency pair and is a low volatile market. Looking at the pip range table, the average pip movement on the 1H timeframe is only 62 pips. Hence, The volatility of this currency pair is on the lower side. We know that the higher the volatility, the lower will be the cost to execute the trade. However, this is not an advantage as trading in a volatile market involves more risk.

Let’s take, for example, in the 1M time frame, the Maximum pip range value is 3952, and the minimum is 896. When we compare the trading fees for both the pip movements, we note that for 896pip movement fess is 5.36%, and for 3952pip movement, fess is only 1.21%. As we can conclude from the above example, trading the GBP/SAR currency pair will be a bit expensive.

Categories
Forex Assets

Trading The EOS/USD Crypto-Fiat pair & Understanding The Costs Involved

Introduction

EOS is a blockchain-based cryptocurrency, as well as a platform for decentralized app execution. This blockchain was developed despite the existence of Bitcoin and Ethereum to solve the problem of speed and scalability.

Understanding EOS/USD

The price of EOS/USD represents the value of the US Dollar equivalent to one EOS. It is quoted as 1 EOS per X USD. So, if the market price of EOS/USD is 2.5290, these many dollars are required to buy one EOS.

EOS/USD specifications

Spread

The difference between the bid & ask prices is known as spread. It changes with the execution model used brokers. Below are the spreads for both ECN & STP models for EOS/USD pair.

Spread on ECN: 10 pips | Spread on STP: 13 pips

Fee

A Fee is basically the commission on the trade. Note that there is a fee on ECN accounts, not STP.

Slippage

Due to high market volatility and the broker’s slower execution speed, slippage occurs. It is a difference in the price intended by the trader and price executed by the broker.

Trading Range in EOS/USD

The trading range is basically a tabular representation of the pip movement in EOS/USD for different timeframes. These numbers can be used traders as a risk management tool as determines the approx. profit/loss that can be made on a trade.

Procedure to assess Pip Ranges

  1. Add the Average True Range indicator to your price chart
  2. Then set the period to one
  3. Add a 200-period Simple Moving Average to this indicator
  4. You can assess a large time period by shrinking the price chart
  5. Select your desired timeframe
  6. Measure the floor level and set this value as the min
  7. Measure the level of the 200-period SMA and set this as the average
  8. Measure the peak levels and set this as Max.

EOS/USD Cost as a Percent of the Trading Range

The total cost comprising of the spread, slippage, and trading fee, changes with the volatility of the market. Hence, it is necessary for traders to position themselves to avoid paying high costs.

Below is a table representing the variation in the costs for different values of volatility.

ECN Model Account

Spread = 10 | Slippage = 3 |Trading fee = 5

Total cost = Slippage + Spread + Trading Fee = 3 + 10 + 5 = 18

STP Model Account

Spread = 13 | Slippage = 3 | Trading fee = 0

Total cost = Slippage + Spread + Trading Fee = 13 + 3 + 0 = 16

Trading the EOS/USD

The volatility and liquidity in this pair are similar to coins like Bitcoin and Ethereum. Hence, this makes EOS/USD a tradable pair. The spread in this pair is between 10-15 pips, which is extremely less compared to its volatility. Due to this, the costs reduce significantly. The highest cost percentage is only 18%.

However, we cannot ignore the fact about the volatility in this pair. This pair is pretty volatile and must be traded cautiously. It is recommended for traders to trade when the volatility of the market is around the average values. Furthermore, the costs can be reduced even further by placing orders as a limit or stop instead of the market. In doing so, the slippage will become zero and will reduce the total cost of the trade.

Categories
Forex Assets

Exploring The GBP/ILS Forex Exotic Currency Pair

Understanding GBP/ILS

GBP/ILS is the abbreviation for the Pound sterling against the Israeli Shekel. In currency pairs, the first currency GBP here is the base currency and the second currency ILS is the quote currency. In Forex currency pairs, if the value of, let’s say, the base currency goes up, the quote currency’s value will go down and vice versa.

Also, when we buy a currency pair, we buy the base currency and implicitly sell the quote currency. The market value of GBP/ILS determines the strength of ILS against the GBP that can be understood as 1 Pound is equal to how much ILS. So if the conversion rate for the pair GBP/ILS is 4.4725, it means to buy 1 GBP, we need 4.4725 ILS.

Spread

We know that the “bid” is the price at which we sell the currency, and “ask” is the price is at which we can BUY the currency. The arithmetic difference between the ask and bid price is known as the spread. The spread is how most of the brokers make money. There are also brokers who charge a separate fee instead of making profits in the form of spread. Below are the ECN and STP spreads for the GBP/ILS Forex pair.

ECN: 54 pips | STP: 56 pips

Fees

Every time we place a trade, some commission must be paid to the brokers, and that is known as a fee. This fee varies from broker to broker. For instance, there is no fee charged on STP account models, but ECN brokers do charge some fee.

Slippage

The arithmetic difference between the expected price of a trader and the price at which the trade is executed is known as slippage. It can occur mostly when the market is volatile & fast-moving. Another reason when the slippage may occur is when we place a huge number of orders at the same time.

Trading Range in GBP/ILS

The trading range here is to measure the volatility of the GBP/ILS pair. Whether we make a profit or loss in a given time period depends on the movement of a currency pair that can be assessed using the trading range table. It is a representation of the min, avg, & max pip movement in a currency pair.

Procedure to assess Pip Ranges

  1. Add the Average True Range indicator to your price chart
  2. Make sure to set the period to one
  3. Then add a 200-period Simple Moving Average to ATR
  4. Shrink the chart in order to assess a significant period
  5. Select the timeframe of your choice
  6. Floor level must be measured and set that value as the min
  7. 200-period SMA must be measured and set that value as average
  8. Finally, measure the peak levels and consider this as Max values.

GBP/ILS Cost as a Percent of Trading Range

The cost of trade depends on the broker and mostly varies based on the market’s volatility. The below tables represent the cost variation in terms of percentages.

ECN Model Account

Spread = 54 | Slippage = 3 |Trading fee = 5

Total cost = Slippage + Spread + Trading Fee = 3 + 54 + 5 = 62


STP Model Account

Spread = 56| Slippage = 3 | Trading fee = 0

Total cost = Slippage + Spread + Trading Fee = 3 + 56 + 0 = 59

Trading the GBP/ILS

The GBP/ILS is an exotic-cross currency pair and is a trending market. We consider the market to be trending when the price generally moves in one direction, either downwards or upwards. As seen in the Range table, the average pip movement on the 1-hour time frame is 112. This clearly shows that the pip movements are normal, and this currency pair is tradable.

Note that the higher the volatility, the lower is the cost of the trade. However, this is not an advantage as it is risky to trade highly volatile markets. Let’s take, for example, in the 1M time frame, the Maximum pip range value is 3469, and the minimum is 1080. When we compare the fees for both the pip movements, we find that for 1080pip movement fess is 5.74%, and for 3469pip movement, fess is only 1.79%.

So, we can confirm that the prices are higher for low volatile markets and low for highly volatile markets. It is recommended to trade when the market volatility is around the average values, but experienced traders who strictly follow money management can trade in a volatile market. The volatility here is moderate, and the costs are a little high compared to the maximum values. But, if our priority is towards reducing costs, we may trade when the volatility of the market is around the maximum values.

Categories
Forex Assets

‘LTC/USD’ – Understanding The Crypto/Fiat Pair & Trading Costs Involved

Introduction

Cryptocurrencies are traded in pairs by pairing them with a fiat currency. Always, the cryptocurrency is written on the left and the fiat currency on the right. LTC/USD is a cryptocurrency, which is an abbreviation for the Litecoin versus the US Dollar. Like the Bitcoin and Ethereum, Litecoin is extensively traded in the exchange market.

Understanding LTC/USD

The market price of LTCUSD depicts the value of the US Dollar, which is equivalent to 1 Litecoin. It is quoted as 1 LTC per X USD. For example, if the value of LTCUSD is 41.69, then one Litecoin is worth 41.69 US Dollars.

LTC/USD specifications

Spread

Spread is the difference between the bid and the ask price in the market, where bid price is given considered when shorting a pair and ask price when going long on a pair. The varies from broker to broker. It also differs based on the type of execution model used. Below are the spreads for the LTC/USD pair for both ECN & STP accounts.

  • Spread on ECN: 50 pips (0.5 USD)
  • Spread on STP: 60 pips (0.6 USD)

Fee

ECN brokers charge some commission on every position a trader opens and closes. The fee for ECN accounts is about $0.18 per standard lot, which corresponds to 18 pips.

Slippage

Slippage is the difference between the price asked by the user and the price given by the broker. There is this difference due to two reasons – High market volatility & broker’s execution speed.

Trading Range in LTC/USD

Below is the trading range table for the LTCUSD, which represents the minimum, average, and maximum volatilities of a pair for different timeframes using the ATR indicator. These values can prove to be helpful for assessing one’s profit/loss on a trade.

Procedure to assess Pip Ranges

  1. Add the ATR indicator to your chart
  2. Set the period to 1
  3. Add a 200-period SMA to this indicator
  4. Shrink the chart so you can assess a large time period
  5. Select your desired timeframe
  6. Measure the floor level and set this value as the min
  7. Measure the level of the 200-period SMA and set this as the average
  8. Measure the peak levels and set this as Max.

LTC/USD Cost as a Percent of the Trading Range

The cost as a percent of the trading range represents the variation of cost on a trade based on the change in the volatility of the market. And these variations are indicated as a percentage. Using the magnitude of the percentages, we shall determine the ideal times of the day to trade this coin.

ECN Model Account

Spread = 50 | Slippage = 5 |Trading fee = 18

Total cost = Slippage + Spread + Trading Fee = 18 + 50 + 5 = 73

STP Model Account

Spread = 60 | Slippage = 5 | Trading fee = 0Total cost = Slippage + Spread + Trading Fee = 5 + 60 + 0 = 65

Trading the LTC/USD

LTCUSD is a crypto-fiat pair that has got enough volatility and liquidity to trade in the market. LTC is the fourth highest traded coin in terms of volume. However, it is not apt to trade anytime during the day. There are ways through which one reduces their costs for the same trade.

In the above table, if the percentages are high, then the costs are very high and vice versa. So, the cost is more for low volatile markets and less for high volatile markets. If you are a scalper or short-term trader, you may trade when the volatility is high as the profit margin is small, and you can avoid high costs.

Positional traders – these traders usually aim for large movements, and high costs become a little insignificant for their big pip movements. So, such traders may trade when the volatility is around the average values. Finally, it is not advisable to trade during low volatilities because the costs are high, and there is barely any movement in the market.

Slippage is a variable in total costs that can be eliminated by placing orders as ‘limit’ or ‘stop.’ We hope you found this analysis on LTCUSD useful. Stay tuned for more informative content. Cheers.

Categories
Forex Assets

Understanding The GBP/HUF Exotic Currency Pair

Introduction

GBP stands for British Pound Sterling, and it is the 4th most traded currency in the Foreign Exchange market after USD, EURO and YEN. It is the official currency of the United Kingdom and some other countries like Jersey, South Georgia, and Guernsey. Whereas HUF stands for Hungarian forint, and it is the official currency of Hungary.

GBP/HUF

We know that the currencies in the Forex market are traded in pairs. GBP/HUF is the abbreviation for the Pound sterling against The Hungarian Forint. In this case, the first currency (GBP) is the base currency, and the second (HUF) is the quote currency.

Understanding GBP/HUF

To find the relative value of one currency in the Forex market, we need another currency to compare. If the value of the base currency goes down, the value of the quote currency goes up and vice versa. The market value of GBP/HUF determines the strength of HUF against the GBP. It can be easily understood as 1GBP is equal to how much of HUF. So if the exchange rate for the pair GBP/HUF is 414.425, it means we need 414.425 HUF to buy 1 GBP.


Spread

Forex brokers have two different prices for currency pairs: the bid and ask price. Here the “bid” price at which we can SELL the base currency, and The “ask” price is at which we can BUY the base currency. Hence, the difference between the ask and the bid price is called the spread. Some brokers, instead of charging a separate fee for trading, they already have the fees inbuilt in the spread. Below are the ECN and STP for the pair GBP/HUF.

ECN: 57 pips | STP: 60 pips

Fees

When we place any trade, there is some commission we need to pay to the broker. A Fee is simply that commission that we pay to the broker each time we execute a position. The fee also varies from the type of broker we use; for example, there is no fee on STP account models, but a few pips on ECN accounts.

Slippage

Slippage alludes to the difference between the expected price at which the trader wants to execute the trade and the price at which the trade is being executed. It can occur at any time but mostly happens when the market is fast-moving and volatile. Also, sometimes when we place a large number of orders at the same time.

Trading Range in GBP/HUF

The trading range is a tabular representation of the pip movement in a currency pair for different timeframes. Using this, we can assess the risk on a trade for each given timeframe. A trading range essentially represents the minimum, average, and maximum pip movement in a currency pair. This can be evaluated easily by using the ATR indicator combined with 200-period SMA.

Procedure to assess Pip Ranges

  1. Add the ATR indicator to your chart
  2. Set the period to 1
  3. Add a 200-period SMA to this indicator
  4. Shrink the chart so you can assess a significant period
  5. Select your desired timeframe
  6. Measure the floor level and set this value as the min
  7. Measure the level of the 200-period SMA and set this as the average
  8. Measure the peak levels and set this as Max.

GBP/HUF Cost as a Percent of the Trading Range

The cost of trade mostly depends on the broker and varies based on the volatility of the market. This is because the total cost involves slippage and spreads apart from the trading fee. Below is the representation of the cost variation in terms of percentages. The comprehension of it is discussed in the following sections. We will be looking into both the ECN model and the STP model.

ECN Model Account

Spread = 57 | Slippage = 3 |Trading fee = 5

Total cost = Slippage + Spread + Trading Fee = 3 + 57 + 5 = 65

STP Model Account

Spread = 60|Slippage = 3 | Trading fee = 0

Total cost = Slippage + Spread + Trading Fee = 3 + 60+ 0 = 63

Trading the GBP/HUF

The GBP/HUF is an exotic-cross currency pair, and the volatility in this pair is decent. As seen in the Range table, the average pip movement on the 1-hour time frame is 205. Here in the GBP/HUF pair, HUF is an emerging currency. We must know that the cost of trade decreases ad the volatility od the pair increases. But this should not be considered as an advantage because it is risky to trade high volatile markets as the price keeps fluctuations.

For instance, in the 1-hour timeframe, the maximum pip range value in this pair is 343 pips, and the minimum pip range value is 27 pips. When we compare the fees for both the pip movements, we find that for 27 pip movement fees is 270.74%, and for 343 pip movement, the fess is only 18.95%.

So, we can confirm that the prices are higher for low volatile markets and high for highly volatile markets. Hence we must always try to make our entries and exits when the volatility is minimum or average than to that of maximum values. But if your preference is absolutely towards reducing your trading costs, you may trade when the volatility of the market is around the maximum values.

Categories
Forex Assets

Analyzing The GBP/TWD Forex Currency Pair

Introduction to GBP/TWD

GBP stands for British pound sterling, and it is typically known as Pound. It is the official currency of the United Kingdom and some other countries like Jersey, South Georgia, and Guernsey. The pound is also the 4th most traded currency in the foreign exchange after USD, EUR & YEN. Whereas TWD is the abbreviation of The New Taiwan dollar. The central bank of Taiwan issues this currency.

GBP/TWD

Currency pairs are the national currencies from two countries coupled for being exchanged in reference to each other. In the Forex market, one currency is always quoted against the other. GBP/TWD is the abbreviation for the Pound sterling against the New Taiwan dollar. In this case, the first currency(GBP) is the base currency, and the second(TWD) is the quote currency.

Understanding GBP/TWD

In Forex, to find out the relative value of one currency, we need another currency to compare. If the value of the base currency goes down, the value of the quote currency goes up and vice versa. The market value of GBP/TWD determines the strength of TWD against the GBP. This can be easily understood as 1GBP is equal to how much of TWD. So if the exchange rate for the pair GBP/TWD is 37.093, it means we need 37.093 TWD to buy 1 GBP.

Spread

Forex brokers have two different prices for currency pairs: the bid and ask price. The bid price is the selling price, and ask is the buy price. The difference between the ask and the bid price is called the spread. Spread is basically a type of commission by which brokers make their money. Below are the ECN and STP for the pair GBP/TWD.

ECN: 49 pips | STP: 52 pips

Fees

Each time we place a trade, we need to pay some commission on it. A Fee is simply that commission we pay to the broker for opening a particular position. The fee also varies from the type of broker we use; for example, there is no fee on STP account models, but a few pips on ECN accounts.

Slippage

Slippage refers to the difference between the trader’s expected price and the actual price at which the trade is executed. It can occur at any time but mostly happens when the market is fast-moving and volatile. Also, sometimes when we place a large number of orders at the same time.

Ranges in GBP/TWD

The Range is a measure of volatility. It tells how much the currency pair has moved in a determined period. Whether a trader makes a profit or loss in a given time period depends on the movement of a currency pair and can be determined using the trading range table. It is a representation of the minimum, average, and maximum pip movement in a currency pair. This can be evaluated simply by using the ATR indicator combined with 200-period SMA.

Procedure to assess Pip Ranges

  1. Add the ATR indicator to your chart
  2. Set the period to 1
  3. Add a 200-period SMA to this indicator
  4. Shrink the chart so you can assess a significant period
  5. Select your desired timeframe
  6. Measure the floor level and set this value as the min
  7. Measure the level of the 200-period SMA and set this as the average
  8. Measure the peak levels and set this as Max.

GBP/TWD Cost as a Percent of the Trading Range

The cost of trade mostly depends on the broker and varies based on the volatility of the market. This is because the total cost involves slippage and spreads apart from the trading fee. Below is the representation of the cost variation in terms of percentages. The comprehension of it is discussed in the following sections. We will look into both the ECN model and the STP model.

ECN Model Account

Spread = 49 | Slippage = 3 |Trading fee = 5

Total cost = Slippage + Spread + Trading Fee = 3 + 49 + 5 = 57

STP Model Account

Spread = 52| Slippage = 3 | Trading fee = 0

Total cost = Slippage + Spread + Trading Fee = 3 + 52 + 0 = 55

Trading the GBP/TWD Forex Pair

The GBP/TWD is an exotic-cross currency pair and is a ranging market. A market is said to be ranging when the price hits the support and resistance at least three times. As seen in the Range table, the average pip movement on the 1-hour time frame is only 47. This clearly shows that if we trade in this pair, we will have to wait for a more extended period of time to get some good profit because of such a less movement in the pips.

Here in GBP/TWD, TWD is considered to be an emerging currency. Note that the higher the volatility, the lower is the cost of the trade. However, this is not an advantage as it is risky to trade highly volatile markets.

For example, in the 1M time frame, the maximum pip range value is 3009 and in minimum pip range, the value is 687. When we compare the fees for both the pip movements, we find that for 687 pip movement fees is 8.30%, and for 3009pip movement, fess is only 1.89%.

So, we can infer that the cost of trade is higher in the low volatile markets and high in the highly volatile markets. It is recommended to trade when the volatility is around the minimum values. The volatility here is low, and the costs are a little high compared to the average and the maximum values. But, if our priority is not towards reducing costs, we may trade when the volatility of the market is around the maximum values.

Categories
Forex Assets

Trading The GBP/PHP Exotic Currency Pair

Introduction

The expansion of GBP is the Great Britan Pound, and this currency is very well known as the Pound Sterling. It is the official currency of the United Kingdom and many other countries like British Overseas Territories, South Sandwich Islands, etc. Where in PHP is known as the Philippine peso and generally referred to as the Piso. It is the official currency of the Philippines, and it is printed by The Central Bank of the Philippines.

GBP/PHP

In the Forex market, currency pairs of any two countries are coupled for being exchanged in reference to each other. GBP/PHP is the abbreviation for the Pound sterling against The Philippine peso. In this case, the first currency (GBP) is the base currency, and the second (PHP) is the quote currency. The GBP/PHP is classified as an exotic-cross currency pair.

Understanding GBP/PHP

As we know, the trading of currencies in the Forex market typically happens in pairs. One currency is quoted against the other, and to find out the relative value of one currency, we need another currency to compare. The market value of GBP/PHP determines the strength of PHP against the GBP. This can be easily understood as 1 GBP is equal to how much PHP. So if the exchange rate for the pair GBP/PHP is 63.377. It means 1 GBP is equivalent to 63.377 PHP.

Spread

Forex brokers have two different prices for currency pairs, and they are the bid and ask prices. The bid is a selling price while the ask is a buy price. The difference between the ask and the bid price is called the spread. The spread is how most of the brokers make their money. The spreads of GBP/PHP in both ECN & STP brokers can be found below.

ECN: 45 pips | STP: 48 pips

Fees

When we execute a trade, we need to pay the broker some commission. A Fee is that commission we pay to the broker each time we execute a position. There is no fee on STP account models, but ECN brokers charge some pips as a trading fee.

Slippage

Sometimes while trading in a volatile market, we won’t be able to execute a trade at the price we want it to get executed. Slippage is the difference between the trader’s expected price and the actual price at which the trade is executed. It may occur at any time but mostly happens when the market is fast-moving and volatile. It can also happen when we place a large number of orders at the same time.

Trading Range in GBP/PHP

The amount of money we will win or lose in a given amount of time can be assessed using the trading range table. It is a representation of the minimum, average, and maximum pip movement in a currency pair. This can be evaluated by using the ART indicator combined with 200-period SMA.

Procedure to assess Pip Ranges

  1. Add the ATR indicator to your chart
  2. Set the period to 1
  3. Add a 200-period SMA to this indicator
  4. Shrink the chart so you can assess a significant period
  5. Select your desired timeframe
  6. Measure the floor level and set this value as the min
  7. Measure the level of the 200-period SMA and set this as the average
  8. Measure the peak levels and set this as Max.

GBP/PHP Cost as a Percent of the Trading Range

The cost of trade mostly depends on the broker and varies based on the volatility of the market. This is because the total cost involves slippage and spreads apart from the trading fee. Below is the representation of the cost variation in terms of percentages. The comprehension of it is discussed in the following sections.

ECN Model Account

Spread = 45 | Slippage = 3 |Trading fee = 5

Total cost = Slippage + Spread + Trading Fee = 3 + 45 + 5 = 53

STP Model Account

Spread = 48 | Slippage = 3 | Trading fee = 0

Total cost = Slippage + Spread + Trading Fee = 3 + 48 + 0 = 51

Trading the GBP/PHP Forex Pair

The GBP/PHP is an exotic-cross currency pair with great volatility. For instance, the average pip movement on the 1H timeframe is 261 pips. As a matter of fact, PHP is one of the most emerging currencies in the previous year. We can find amazing trading opportunities in this currency pair if observed correctly.

When the volatility is high, the cost of trade will always be less. It is vice versa when the volatility is low. But this should not be considered as an advantage because it is always risky to trade when the volatility is high. To comprehend the above tables, higher percentages mean the costs of trade in the corresponding time frames are high. And when the percentages are low, trading costs are relatively low in those time frames.

Generally, it is recommended to take trades when the volatility of the market is around minimum to average values. Because, at min values, the volatility of the market will be low. But the costs are a bit high here when compared to the average and the maximum values. Trading at max values will reduce your trading costs but increase the risk of the trades. So we suggest you take a call according to the market situation.

There is another way to reduce the cost of trades, i.e., by using Limit Orders over Market Orders. By using these limit orders, slippage can completely be eliminated and thereby reducing the overall trading costs. In the below table, you can see how the costs have reduced by using limit orders with an STP broker.

STP Model Account (Using Limit Orders) 

Spread = 48 | Slippage = 0 | Trading fee = 0

Total cost = Slippage + Spread + Trading Fee = 0 + 48 + 0 = 48

Categories
Forex Assets

GBP/INR Exotic Pair – Analyzing The Trading Costs Involved

Introduction

GBP Pound sterling, also known as the pound, is the official currency of the United Kingdom. It is very well known, and in fact, it is the fourth most-traded currency in the Forex market. INR (Indian rupee) is the official currency of India. This currency is controlled and managed by the Reserve Bank of India.

GBP/INR

In the Forex market, one currency is always quoted against the other as the currencies are trades in pairs. GBP/INR represents the trading of the Pound sterling against the Indian rupee. In this case, the first currency (GBP) is the base, and the second (INR) is the quote currency. The GBP/INR is classified as exotic-cross currency pair.

Understanding GBP/INR

To find out the relative value of one currency, we need another currency to compare. If the value of the base currency goes down, the value of the quote currency goes up and vice versa.

The market value of GBPINR determines the strength of INR against the GBP. This can be easily understood as 1GBP is equal to how much INR. So if the exchange rate for the pair GBP/INR is 94.034, it means 1GBP is equal to 94.034 INR.

Spread

Forex brokers have two different prices for currency pairs: the bid and ask price. The bid price is the selling price, and ask is the buy price. The difference between the ask and the bid price is called the spread. The spread is how brokers make their money. Below are the spreads for GBP/INR currency pair in both ECN & STP brokers.

ECN: 55 pips | STP: 57 pips

Fees

A Fee is simply the commission we pay to the broker each time we execute a position. There is no fee on STP account models, but a few pips on ECN accounts.

Slippage

Slippage refers to the difference between the trader’s expected price and the actual price at which the trade is executed. It can occur at any time but mostly happens when the market is fast-moving and volatile. Also, sometimes slippage occurs when we place a large number of orders at the same time.

Trading Range in GBP/INR

The amount of money we will win or lose in a given amount of time can be assessed using the trading range table. It is a representation of the minimum, average, and maximum pip movement in a currency pair. This can be evaluated simply by using the ART indicator combined with 200-period SMA.

Procedure to assess Pip Ranges

  1. Add the ATR indicator to your chart
  2. Set the period to 1
  3. Add a 200-period SMA to this indicator
  4. Shrink the chart so you can assess a significant period
  5. Select your desired timeframe
  6. Measure the floor level and set this value as the min
  7. Measure the level of the 200-period SMA and set this as the average
  8. Measure the peak levels and set this as Max.

GBP/INR Cost as a Percent of the Trading Range

The cost of trade mostly depends on the broker and varies based on the volatility of the market. This is because the total cost involves slippage and spreads apart from the trading fee. Below is the representation of the cost variation in terms of percentages. The comprehension of it is discussed in the following sections.

ECN Model Account

Spread = 55 | Slippage = 3 |Trading fee = 5

Total cost = Slippage + Spread + Trading Fee = 3 + 55 + 5 = 63

STP Model Account

Spread = 57 | Slippage = 3 | Trading fee = 0

Total cost = Slippage + Spread + Trading Fee = 3 + 57 + 0 = 60

Trading the GBP/INR Exotic pair

The GBP/INR is an exotic-cross currency pair and is volatile in nature. For instance, the average pip movement on the 1H timeframe of this pair is about 432 pips. From the above tables, it is clear that the higher the volatility, the lower is the cost of the trade. However, this is not an advantage as it is risky to trade when the markets are highly volatile.

While reading the above tables, if the percentages are larger, higher are the costs on the trade. Likewise, if the percentages are small, lower are the costs. So, this can be interpreted as the trading costs are higher for low volatile markets and lower for high volatile markets.

It is always recommended to trade when the volatility is around the minimum values. Because at min values, the volatility is low, and the costs are a little high compared to the average and maximum values. But, if your priority is towards reducing costs, you may trade when the volatility of the market is around the average values. Cheers!

Categories
Forex Assets

GBP/TRY – Knowing The Trading Costs Involved While Trading This Exotic pair

Introduction

GBP Pound sterling, also known as the pound, is the official currency of the United Kingdom and many others. The sterling is the fourth most-traded currency in the Forex market. On the other hand, TRY is known as the Turkish lira. It is the official currency of Turkey and the self-declared Turkish Republic of Northern Cyprus.

GBP/TRY

Currency pairs are the national currencies from two countries coupled for being exchanged in reference to each other. In the Forex, one currency is quoted against the other. GBP/TRY is the abbreviation for the Pound sterling against The Turkish lira. In this case, the first currency(GBP) is the base currency, and the second(TRY) is the quote currency. The GBP/TRY is classified as an exotic-cross currency pair.

Understanding GBP/TRY

In the Forex market, to find out the relative value of one currency, we need another currency to compare. The market value of GBPTRY determines the strength of TRY against the GBP that can be easily understood as 1GBP is equal to how much lira(TRY), so if the exchange rate for the pair GBPTRY is 8.0877. It means in to order to buy 1GBP we need 8.0877 TRY

If the value of the base currency goes down, the value of the quote currency goes up and vice versa.

Spread

The broker provides us with two prices, Ask price and Bid price. Here, the Bid price is the buy price, and the Ask price is the Sell price. The difference between the ask and the bid price is called the spread. The spread is how brokers make their money.

ECN: 61 pips | STP: 64 pips

Fees

A Fee is simply the commission we pay to the broker each time we execute a position. There is no fee on STP account models, but a few pips on ECN accounts.

Slippage

Slippage refers to the difference between the trader’s expected price and the actual price at which the trade is executed. It can occur at any time but mostly happens when the market is fast-moving and volatile. Also, sometimes when we place a large number of orders at the same time.

Trading Range in GBP/TRY

The amount of money you will win or lose in a given amount of time can be assessed using the trading range table. It is a representation of the minimum, average, and maximum pip movement in a currency pair. This can be evaluated simply by using the ATR indicator combined with 200-period SMA.

Procedure to assess Pip Ranges

  1. Add the ATR indicator to your chart
  2. Set the period to 1
  3. Add a 200-period SMA to this indicator
  4. Shrink the chart so you can assess a significant period
  5. Select your desired timeframe
  6. Measure the floor level and set this value as the min
  7. Measure the level of the 200-period SMA and set this as the average
  8. Measure the peak levels and set this as Max.

GBP/TRY Cost as a Percent of the Trading Range

The cost of trade mostly depends on the broker and varies based on the volatility of the market. This is because the total cost involves slippage and spreads apart from the trading fee. Below is the representation of the cost variation in terms of percentages. The comprehension of it is discussed in the following sections.

ECN Model Account

Spread = 61 | Slippage = 3 |Trading fee = 5

Total cost = Slippage + Spread + Trading Fee = 3 + 61 + 5 = 69


STP Model Account

Spread = 64 | Slippage = 3 | Trading fee = 0

Total cost = Slippage + Spread + Trading Fee = 3 + 64 + 0 = 67


Trading the GBP/TRY

From the trading range table, it can clearly be ascertained that this pair is very volatile. For example, the pip average pip movement in the 1H timeframe is as high as 400 pips. This also means that the risk is high from the 1H timeframe all the way to the 1M timeframe.

As far as the costs are concerned, it is in favor of the traders. This is because the greater the volatility, the lower are the costs. That is the reason the percentage values are large in the min column and comparatively smaller in the average and max columns.

With this in mind, one can opt to trade this pair when the volatility values are between the minimum and average. In doing so, the volatility will be comparatively lower, which in turn reduces the risk on the trade and also keeps the cost in balance with the volatility.

Categories
Forex Assets

Exploring The GBP/HKD Forex Exotic Currency Pair

Introduction

GBP Pound sterling, also known as the pound, is the official currency of the United Kingdom and many others. It is one of the oldest currencies and is further divided into pence. Where in HKD is known as Hong Kong Dollar, and it is the official currency of Hong Kong. One HKD is divided into 100 cents.

GBP/HKD is the abbreviation for the Pound sterling against the Hong Kong Dollar. Here, the first currency (GBP) is the base, and the second currency (HKD) is the quote currency. It is classified as an exotic-cross currency pair.

Understanding GBP/HKD

In Forex, to find out the relative value of one currency, we need another money to compare. The market value of GBP/HKD determines the strength of HKD against the GBP, i.e., It can simply be understood as 1GBP is equal to how much HKD, so if the exchange rate for the pair GBPHKD is 9.254. It means that we need 9.254 HKD to buy 1 GBP. If the value of the base currency goes down, the value of the quote currency goes up and vice versa.

Spread

Forex brokers have two different prices for currency pairs: the bid and ask price. The bid price is the selling price, and ask is the buy price. The difference between the ask and the bid price is called the spread. The spread is how brokers make their money. For this currency pair, the spread values for ECN & STP brokers are as follows.

ECN: 33 pips | STP: 36 pips

Fees

A Fee is simply the commission we pay to the broker on each position we open. There is no fee on STP account models, but a few pips on ECN accounts.

Slippage

Slippage refers to the difference between the trader’s expected price and the actual price at which the trade is executed. It can occur at any time, but it mostly happens when market orders are placed during high volatile conditions. It may also occur when large orders are placed at a time.

Trading Range in GBP/HKD

The amount of money we win or lose in a given amount of time can be assessed using the trading range table. The following table is a representation of the minimum, average, and maximum pip movement in a currency pair. This can be assessed very easily by using the Average True Range (ATR) indicator combined with 200-period SMA.

Procedure to assess Pip Ranges

  1. Add the ATR indicator to your chart
  2. Set the period to 1
  3. Add a 200-period SMA to this indicator
  4. Shrink the chart so you can assess a large time period
  5. Select your desired timeframe
  6. Measure the floor level and set this value as the min
  7. Measure the level of the 200-period SMA and set this as the average
  8. Measure the peak levels and set this as Max.

GBP/SGD Cost as a Percent of the Trading Range

The cost of trade varies based on the volatility of the market. This is because the total cost involves slippage and spreads apart from the trading fee. Below is the representation of the cost variation in terms of percentages. The comprehension of it is discussed in the coming sections.

ECN Model Account

Spread = 33 | Slippage = 3 |Trading fee = 5

Total cost = Slippage + Spread + Trading Fee = 3 + 15 + 5 = 41

STP Model Account

Spread = 36 | Slippage = 3 | Trading fee = 0

Total cost = Slippage + Spread + Trading Fee = 3 + 19 + 0 = 39

Trading the GBP/HKD Currency Pair

The GBPHKD is an exotic-cross currency pair and is a normal ranging market. For instance, the average pip movement on the 1H timeframe is only 49 pips. Note that the higher the volatility, the lower is the cost of the trade. However, this is not an advantage as it is risky to trade highly volatile markets.

Also, the larger/smaller the percentages, the higher/lower are the costs on the trade. So, we can infer that the costs are higher for low volatile markets and high for highly volatile markets. To reduce our risk, it is recommended to trade when the volatility is around the minimum values. The volatility here is low, and the costs are a little high compared to the average and the maximum values. But, if your priority is towards reducing costs, you may trade when the volatility of the market is around the maximum values.

Advantage from Limit orders

When orders are executed as market orders, there is slippage on the trade. But, with limit orders, there is no slippage as such. Only trading fees and the spread will be taken into consideration to calculate the total costs. This method will bring down the cost significantly.

Categories
Forex Assets

Trading The GBP/THB Forex Exotic Pair

Introduction

GBP

Pound sterling, also know as the pound, is the official currency of the United Kingdom and many others. The Pound sterling is the oldest currency and even the fourth most-traded currency in the foreign exchange market, after the United States dollar, the euro, and the Japanese yen.

THB

Thai Bhat is the official currency of Thailand. It’s divided into 100 satangs, According to Bloomberg, the Thai baht was the world’s best-performing currency in 2018, and since then, Thai baht is the 10th most frequently used world payment currency.

GBPTHB is the abbreviation for the Pound sterling against the Thai baht. Here, the GBP is the base currency, and the THB is the quote currency. It is classified as an exotic-cross currency pair.

Understanding GBP/THB

In Forex, to find the relative value of one currency, we need another money to compare. The market value of GBPTHB determines the cost of THB that is required to buy one GBP. It can simply be understood as 1GBP is equal to how much THB, so if the exchange rate for the pair GBPTHB is 1.6894. It means that we need 38.92 THB to buy 1 GBP.

Spread

Forex brokers have two different prices for currency pairs: the bid and ask price. Here the “bid” price at which you can SELL the base currency, and The “ask” price is at which you can BUY the base currency. Hence, the difference between the ask and the bid price is called the spread. The spread is how brokers make their money. Some broker Instead of charging a separate fee for trading, they already have the fees inbuilt in the spread.

ECN: 28 pips | STP: 31 pips

Fees

A Fee is simply the commission you pay to the broker on each position you open. There is no fee on STP account models, but a few pips on ECN accounts.

Slippage

slippage refers to the difference between the trader’s expected price and the actual price at which the trade is executed. It occurs when market orders are placed during high fast-moving, highly volatile as well as when large orders are placed at a time.

 Trading Range in GBP/THB

The amount of money you will win or lose in a given amount of time can be assessed using the trading range table. This is a representation of the minimum, average, and maximum pip movement in a currency pair.

Procedure to assess Pip Ranges

  1. Add the ATR indicator to your chart
  2. Set the period to 1
  3. Add a 200-period SMA to this indicator
  4. Shrink the chart so you can assess a large time period
  5. Select your desired timeframe
  6. Measure the floor level and set this value as the min
  7. Measure the level of the 200-period SMA and set this as the average
  8. Measure the peak levels and set this as Max.

GBP/THB Cost as a Percent of the Trading Range

The cost of trade varies based on the volatility of the market. This is because the total cost involves slippage and spreads apart from the trading fee. Below is the representation of the cost variation in terms of percentages. The comprehension of it is discussed in the next sections.

ECN Model Account

Spread = 28 | Slippage = 3 |Trading fee = 5

Total cost = Slippage + Spread + Trading Fee = 3 + 28 + 5 = 36

STP Model Account

Spread = 31 | Slippage = 3 | Trading fee = 0

Total cost = Slippage + Spread + Trading Fee = 3 + 31 + 0 = 34

Trading the GBP/THB

The GBPTHB is an exotic-cross currency pair and is a normal ranging market. For instance, the average pip movement on the 1H timeframe is only 82 pips. Note that the higher the volatility, the lower is the cost of the trade. However, this is not an advantage as it is risky to trade highly volatile markets.

Also, the larger/smaller the percentages, the higher/lower are the costs on the trade. So, we can infer that the prices are higher for low volatile markets and high for highly volatile markets.

To reduce your risk, it is recommended to trade when the volatility is around the minimum values. The volatility here is low, and the costs are a little high compared to the average and the maximum values. But, if you’re priority is towards reducing costs, you may trade when the volatility of the market is around the maximum values.

Categories
Forex Assets

Trading The GBP/SGD Exotic Currency Pair

Introduction To GBP & SGD Pairs

GBP

Great Britain Pound is also known in some contexts as the pound or sterling. It is the official currency of the United Kingdom and many British overseas territories. It is subdivided into 100 pence. The Pound Sterling is the oldest currency in continuous use, and also the fourth most-traded currency in the Forex market, after the United States dollar, the euro, and the Japanese yen.

SGD

The Singapore dollar is Singapore’s official currency, and it is divided into 100 cents. This currency is the thirteenth most traded currency in the world by value.

GBPSGD is the abbreviation for the Pound sterling against the Singapore Dollar. It is classified as an exotic-cross currency pair. In this currency pair, the GBP is the base currency, and the SGD is the quote currency.

Understanding GBP/SGD

In Forex, in order to find out the relative value of one currency, we need another currency to compare. It shows how much the GBP (the base currency) is worth as measured against the SGD (quote currency). It can simply be understood as 1GBP is equal to how much SGD. So if the exchange rate for the pair GBPSGD is 1.6894. It means that one GBP costs 1.6894 SGD.

Spread

The spread is the difference between the Bid (Sell) price and the Ask (Buy) price of an asset. The spread is how brokers make their money. Some broker Instead of charging a fee for performing a trade, the cost is built as a difference between the buy and sell prices of the currency pair.

ECN: 15 pips | STP: 19 pips

Fees

A Fee is simply the commission we pay to the broker on each position we open. There is no fee on STP account models, but a few pips on ECN accounts.

Slippage

Slippage is the difference between the price at which the trader wants to execute the trade and the price at which the trade is effectively executed. Slippage can occur at any time but is mostly happens when the market is very Volatile.

Trading Range in GBP/SGD

The amount of money we will win or lose in a given amount of time can be assessed using the trading range table. This is a representation of the minimum, average, and maximum pip movement in a currency pair.

Procedure to assess Pip Ranges

  1. Add the ATR indicator to your chart
  2. Set the period to 1
  3. Add a 200-period SMA to this indicator
  4. Shrink the chart so you can assess a large time period
  5. Select your desired timeframe
  6. Measure the floor level and set this value as the min
  7. Measure the level of the 200-period SMA and set this as the average
  8. Measure the peak levels and set this as Max.

GBP/SGD Cost as a Percent of the Trading Range

The cost of trade varies based on the volatility of the market. This is because the total cost involves slippage and spreads apart from the trading fee. Below is the representation of the cost variation in terms of percentages. The comprehension of it is discussed in the coming sections.

ECN Model Account

Spread = 15 | Slippage = 3 | Trading fee = 5

Total cost = Slippage + Spread + Trading Fee = 3 + 15 + 5 = 23

STP Model Account

Spread = 19 | Slippage = 3 | Trading fee = 0

Total cost = Slippage + Spread + Trading Fee = 3 + 19 + 0 = 22

Trading the GBP/SGD currency pair

The GBPSGD is an exotic-cross currency pair and is a normal ranging market. For instance, the average pip movement on the 1H timeframe is only 62 pips. Note that the higher the volatility, the lower is the cost of the trade. However, this is not an advantage as it is risky to trade highly volatile markets.

Also, the larger/smaller the percentages, the higher/lower are the costs on the trade. So, we can infer that the costs are higher for low volatile markets and high for highly volatile markets.

To reduce the risk, it is recommended to trade when the volatility is around the minimum values. The volatility here is low, and the costs are a little high compared to the average and the maximum values. But, if you’re priority is towards reducing costs, you may trade when the volatility of the market is around the maximum values.

Also, we can take advantage of the Limit orders to reduce costs. When orders are executed as market orders, the risk of slippage always persists. But, with the help of limit orders, we can completely avoid slippage, thereby reducing the overall trading cost. When slippage is Zero, only trading fees and the spread will be taken into consideration to calculate the total costs. Hence, it brings down the cost significantly.

Categories
Forex Assets

Understanding The EUR/EGP Exotic Currency Pair

Introduction

The Euro Area’s euro against the Egyptian Pound is abbreviated as EUREGP. This is an exotic-cross currency pair in the forex market. In this pair, the EUR is the base currency, and the EGP is the quote currency.

Understanding EUR/EGP

The market price of the EUREGP depicts the value of EGP that is equivalent to one euro. It is simply quoted as 1 EUR per X EGP. So, for example, if the market price of this pair is 17.8341, then exactly 17.8341 Egyptian Pounds is required to purchase one Euro.

Spread

The difference between the bid price and the ask price is referred to as the spread. These two values are set by the brokers. Hence, it is different for different brokers. The spread also varies based on how the orders are executed.

ECN: 100 pips | STP: 111 pips

Fees

The fee is simply the commission paid on the trade. There is no fee on STP execution model but a few pips on the ECN execution model. However, the fee absence on STP accounts is usually compensated by higher spreads.

Slippage

Slippage is the difference between the price which was wanted by the trader and the price the broker actually gave the trader. It is typically not possible for brokers to give the exact price intended by the traders due to reasons:

  • Broker’s trade execution speed
  • Market volatility

Trading Range in EUR/EGP

Trading range is an illustration of the pip movement in a currency pair for different timeframes ranging from 1H to 1M. These volatility values help in assessing the risk involved in a trade. Basically, it acts as an effective risk management tool. Another application to it is discussed in the subsequent section.

Procedure to assess Pip Ranges

  1. Add the ATR indicator to your chart
  2. Set the period to 1
  3. Add a 200-period SMA to this indicator
  4. Shrink the chart so you can assess a large time period
  5. Select your desired timeframe
  6. Measure the floor level and set this value as the min
  7. Measure the level of the 200-period SMA and set this as the average
  8. Measure the peak levels and set this as Max.

EUR/EGP Cost as a Percent of the Trading Range

This is a very helpful application of the trading range. In the cost as a percent of the trading range, we combine the volatility values with the total cost on the trade and observe how the cost varies for changing volatilities.

ECN Model Account

Spread = 100 | Slippage = 10 |Trading fee = 3

Total cost = Slippage + Spread + Trading Fee = 10 + 100 + 3 = 113

STP Model Account

Spread = 111 | Slippage = 10 | Trading fee = 0

Total cost = Slippage + Spread + Trading Fee = 3 + 111 + 0 = 114

Trading the EUR/EGP

The EUR/EGP is an exotic-cross currency pair. This pair is highly volatile, but the trading volume is pretty low. However, this pair can still be traded in certain situations.

Firstly, we can see that the spreads on this pair are high. This is because the volatility in this pair is very high. For example, the average pip movement in the 1H timeframe is over 400 pips. So, we can’t really say that the spread of this pair is high.

Consider the table representing the variation in the costs. We can see that the percentages are highest in the min column. And the values are considerably small in the average and max column. If we were to interpret this, the cost of the trade reduces as the volatility of the market increases. So, based on the type of trader you are, you can choose to enter the market. For example, if you’re concerned about the high costs, then you may trade when the volatility of the market is at its peak. If you’re a conservative trader who needs petty low volatility, then you may use it during low volatilities, but you’ll have to bear high costs for it.

Furthermore, there is a way through which you can bring down your existing cost on the trade. This is simply by executing trades using limit or stop orders instead of the market. In doing so, the slippage will be nullified. So, in our example, the total cost would reduce by ten pips.

Categories
Forex Assets

EUR/MXN – Analyzing The Costs Involved While Trading This Exotic Pair

Introduction

EUR/MXN is the abbreviation for the Euro Area’s euro against the Mexican Peso. It is classified as an exotic-cross currency pair. Here, the EUR is the base currency, and the MXN is the quote currency.

Understanding EUR/MXN

The market value of EURMXN determines the value of MXN that is required to buy one euro. It is quoted as 1 EUR per X MXN. So, if the market price of this pair is 24.4733, then these many units of Mexican pesos are required to buy one EUR.

Spread

The spread is the difference between the bid price and the ask price. These two prices are set by the brokers. The pip difference is through which brokers generate revenue.

ECN: 46 pips | STP: 49 pips

Fees

A fee is simply the commission you pay to the broker on each position you open. There is no fee on STP account models, but a few pips on ECN accounts.

Slippage

Slippage is the difference between the price at which the trader executed the trade and the price he actually got from the broker. This changes based on the volatility of the market and the broker’s execution speed.

Trading Range in EUR/MXN

The amount of money you will win or lose in a given amount of time can be assessed using the trading range table. This is a representation of the minimum, average, and maximum pip movement in a currency pair.

Procedure to assess Pip Ranges

  1. Add the ATR indicator to your chart
  2. Set the period to 1
  3. Add a 200-period SMA to this indicator
  4. Shrink the chart so you can assess a large time period
  5. Select your desired timeframe
  6. Measure the floor level and set this value as the min
  7. Measure the level of the 200-period SMA and set this as the average
  8. Measure the peak levels and set this as Max.

EUR/MXN Cost as a Percent of the Trading Range

The cost of trade varies based on the volatility of the market. This is because the total cost involves slippage and spreads apart from the trading fee. Below is the representation of the cost variation in terms of percentages. The comprehension of it is discussed in the coming sections.

ECN Model Account

Spread = 46 | Slippage = 3 |Trading fee = 3

Total cost = Slippage + Spread + Trading Fee = 3 + 46 + 3 = 52

STP Model Account

Spread = 49 | Slippage = 3 | Trading fee = 0

Total cost = Slippage + Spread + Trading Fee = 3 + 49 + 0 = 52

Trading the EUR/MXN

The EURMXN is a very volatile pair. For instance, the average pip movement on the 1H timeframe is only 335 pips. Note that the higher the volatility, the lower is the cost of the trade. However, this is not an advantage as it is risky to trade highly volatile markets.

Also, the larger/smaller the percentages, the higher/lower are the costs on the trade. So, we can infer that the costs are higher for low volatile markets and high for highly volatile markets.

To reduce your risk, it is recommended to trade when the volatility is around the minimum values. The volatility here is low, and the costs are a little high compared to the average and the maximum values. But, if you’re priority is towards reducing costs, you may trade when the volatility of the market is around the maximum values.

Advantage from Limit orders

When orders are executed as market orders, there is slippage on the trade. But, with limit orders, there is no slippage as such. Only trading fees and the spread will be taken into consideration to calculate the total costs. Hence, this will bring down the cost significantly.

Categories
Forex Assets

Everything About EUR/TRY Forex Currency Pair

Introduction

EUR/TRY is the abbreviation for the Euro area’s euro against the Turkish Lira. This pair is classified as an exotic-cross currency pair. In this pair, EUR is the base currency, and TRY the quote currency.

Understanding EUR/TRY

The price of this pair determines the value of TRY, which is equivalent to one euro. It is quoted as 1 EUR per X TRY. For example, if the value of this pair is 6.5552, then about 6.5 Turkish Liras are required to purchase one euro.

EUR/TRY Specification

Spread

Spread is simply the difference between the bid price and the ask price in the market. This value is controlled by the brokers. This value varies on the type of execution model used for executing the trades.

Spread on ECN: 40 pips | Spread on STP: 44 pips

Fees

The fee in Forex is similar to the one that is pair to stockbrokers. Note that, there is no fee on STP accounts, but a few pips on ECN accounts.

Slippage

The slippage on a trade is the difference between the price that is demanded by the trader and the price that is actually executed by the broker. Market volatility and the broker’s execution speed are the reasons for slippage to occur.

Trading Range in EUR/TRY

A trading range is the representation of the minimum, average, and the maximum volatility of this pair on the 1H, 4H, 1D, 1W, and 1M timeframe. Using these values, we can assess our profit/loss margin of trade. Hence, this proves to be a helpful risk management tool for all types of traders.

Procedure to assess Pip Ranges

  1. Add the ATR indicator to your chart
  2. Set the period to 1
  3. Add a 200-period SMA to this indicator
  4. Shrink the chart so you can assess a large time period
  5. Select your desired timeframe
  6. Measure the floor level and set this value as the min
  7. Measure the level of the 200-period SMA and set this as the average
  8. Measure the peak levels and set this as Max.

EUR/TRY Cost as a Percent of the Trading Range

With the volatility values obtained from the above table, we can see how the cost varies as the volatility of the market varies. All we did is, got the ratio between the total cost and the volatility values and converted into percentages.

ECN Model Account 

Spread = 40 | Slippage = 3 | Trading fee = 3

Total cost = Spread + Slippage + Trading Fee = 40 + 3 + 3 = 46

STP Model Account

Spread = 44 | Slippage = 3 | Trading fee = 3

Total cost = Spread + Slippage + Trading Fee = 44 + 3 + 0 = 47

The Ideal way to trade the EUR/TRY

The EURTRY is a pair with enough volatility and liquidity. Hence, this makes it simpler to trade this exotic-cross currency.

From the above table, we can see that the percentage values are all within 200%. This means that the costs are low irrespective of the timeframe and volatility you trade.

Digging it a little deeper, the costs are higher when the volatility of the market is low and lower for higher volatilities. However, we cannot ignore the fact that this pair is highly volatile. For example, the maximum volatility on the 1H timeframe is as high as 456. So, traders must be cautious before trading this pair.

When it comes to the best time of the day to trade this pair, it is ideal for entering this pair during those times of the day when the volatility is in between the average values because this will ensure decent volatility as well as low costs.

Furthermore, traders can easily reduce their costs by placing orders as ‘limit’ and ‘stop’ instead of ‘market.’ In doing so, the slippage on the trade will not be considered in the calculation of the total costs. So, in our example, the total cost will reduce by three pips.

Categories
Forex Assets

Exploring The EUR/THB Exotic Currency Pair

Introduction

EUR/THB is the abbreviation for the Euro area’s euro against the Thai Baht. This pair is classified as an exotic currency pair. In this pair, EUR is the base currency, and THB is the quote currency.

Understanding EUR/THB

The market value of this pair represents the value of THB equivalent to one EUR. It is quoted as 1 EUR per X THB. For example, if the current market price of this pair is 35.345, these many units of THB are required to purchase one euro.

EUR/THB Specification

Spread

The algebraic difference between the bid and the ask price is referred to as the spread. Spread is determined by the brokers and varies based on the execution model they use.

Spread on ECN: 25 pips | Spread on STP: 28 pips

Fee

The fee is simply the commission paid on the trade. However, this fee is levied only on ECN accounts, not STP accounts.

Slippage

When you execute orders by market, the price you receive from the broker is different from the price you trigger your order. This happens solely due to the changes in the market volatility and the speed with which brokers execute the trades.

Trading Range in EUR/THB

The trading range is the representation of the range of pip movement in a currency pair. These pip values help in assessing the profit/loss in a trade, even before opening positions. In the below table, we have included six timeframes, ranging from 1H to 1M.

Procedure to assess Pip Ranges

  1. Add the ATR indicator to your chart
  2. Set the period to 1
  3. Add a 200-period SMA to this indicator
  4. Shrink the chart so you can assess a large time period
  5. Select your desired timeframe
  6. Measure the floor level and set this value as the min
  7. Measure the level of the 200-period SMA and set this as the average
  8. Measure the peak levels and set this as Max.

EUR/THB Cost as a Percent of the Trading Range

The cost as a percent of the trading range is the representation of the cost variation in the trade. The cost varies based on the volatility of the market. Having an idea of the cost variation, we can find our ideal times of day to trade in the market with reduced costs.

ECN Model Account

Spread = 25 | Slippage = 3 | Trading fee = 3

Total cost = Spread + Slippage + Trading Fee = 25 + 3 + 3 = 31

STP Model Account

Spread = 28 | Slippage = 3 | Trading fee = 0

Total cost = Spread + Slippage + Trading Fee = 28 + 3 + 0 = 31

The Ideal way to trade the EUR/THB

Before getting right into it, let’s comprehend the above tables. To analyze the tables, we consider the magnitude of the percentages. The higher the percentages, the higher is the cost of the trade. Conversely, lower percentages imply lower costs.

The costs in the min column are higher compared to the max column. This means that the costs are high when the volatility of the market is low, and the converse holds true as well.

The ideal way to trade this pair is completely dependent on the type of trader you are. For instance, if you are a trader looking for low costs, then you may trade when the volatility is high. Since the majority of the traders need a balance between the two, they may trade when the volatility of the market is somewhere around the average values in the trading range table.

Another simple technique to reduce costs is implementing strategies such that orders are executed using limit orders instead of market orders. In doing so, the slippage will be completely eradicated, and the total costs will be reduced by a decent number.

Categories
Forex Assets

Everything You Should Know About The EUR/SEK Forex Pair

Introduction

EUR/SEK is the abbreviation for the Euro Area’s euro against the Swedish Krona. This exotic-cross currency pair has enough volatility but lacks liquidity. This is the reason this has pretty high spreads. In this pair, EUR is the base currency, and SEK is the quote currency.

Understanding EUR/SEK

The market price of EURSEK as a whole determines the value of SEK that is required to buy one euro. It is quoted as 1 EUR per X SEK. For example, if the value of this pair is 10.5839, then this amount of SEK is required to purchase one EUR.

EUR/SEK Specification

Spread

The difference between the bid price and the ask price is called the spread. This value is different from one ECN and STP accounts. The approximate values of the same are mentioned below.

Spread on ECN: 50 pips | Spread on STP: 55 pips

Fees

The fee is simply the commission paid for the trade. This, too, depends on the type of execution model used by the broker. The fee on ECN accounts is a few pips, while it is nil on STP accounts.

Slippage

The slippage is the difference between the trader’s intended price and the broker’s executed price. There is this difference because orders are executed by the ‘market.’ The two main reasons for slippage to occur include, broker’s execution speed & Market volatility.

Trading Range in EUR/SEK

With the values in the trading range, which depict the pip movement in different timeframes, we can determine the gain or loss that is possible on trade.

These values are obtained by combining the moving average with the average true range indicator. A complete procedure to get it into your charts is given below.

Procedure to assess Pip Ranges

  1. Add the ATR indicator to your chart
  2. Set the period to 1
  3. Add a 200-period SMA to this indicator
  4. Shrink the chart so you can assess a large time period
  5. Select your desired timeframe
  6. Measure the floor level and set this value as the min
  7. Measure the level of the 200-period SMA and set this as the average
  8. Measure the peak levels and set this as Max.

EUR/SEK Cost as a Percent of the Trading Range

Firstly, the total cost is calculated by finding the sum of the spread, slippage, and trading fee. And this cost varies as the volatility of the market changes. Below is a table that represents the cost variation for EURSEK for both ECN and STP accounts.

ECN Model Account 

Spread = 50 | Slippage = 3 | Trading fee = 3

Total cost = Spread + Slippage + Trading Fee = 50 + 3 + 3 = 56

STP Model Account

Spread = 55 | Slippage = 3 | Trading fee = 0

Total cost = Spread + Slippage + Trading Fee = 55 + 3 + 0 = 58

Note: The costs may seem high because of the Spreads. As we know, these Spreads keep changing from time to time. At times we have seen the spreads for this pair being as low as 10. But we have considered the maximum spread to give you the maximum cost percentages.

The Ideal way to trade the EUR/SEK

From the trading range table, we can clearly see that the volatility in this pair is pretty high. However, this does not mean that it cannot be traded.

Coming to the next two tables, the percentage values are within the 600% mark. Note that the higher the value of the percentages, the higher is the cost. The opposite holds true, as well. Since the percentage values are high in the min column, we can conclude that the costs are high when the volatility of the market is low.

Now, to have a balance between the costs and the volatility, one must trade during those times when the volatility of the market is around the average values in the trading range table.

Moreover, there is a way through which we can nullify the slippage on the trade. This can simply be done by placing orders using ‘limit’ instead of ‘market.’ In doing so, the total cost will reduce by a decent amount.

Categories
Forex Assets

EUR/NOK – Everything You Should Know Before Trading This Currency Pair

Introduction

EUR/NOK is the abbreviation for the Euro Area’s euro against the Norwegian Krone. This pair is classified as an exotic-cross currency. Here, EUR is the base currency, and NOK is the quote currency.

In this asset article, we shall understand what the value of this pair means, the volatility in different timeframes, the cost variations, and finally, the ideal way to trade this pair.

Understanding EUR/NOK

The value of this pair represents the value of NOK equivalent to one EUR. It is quoted as 1 EUR per X NOK. For example, if the value of this pair is 10.4373, approx. 10 Krones are required to purchase one euro.

EUR/NOK Specification

Spread

The difference between bid and ask prices set by the brokers is referred to as the spread on the trade.

There are two types of trade execution models in forex, namely, ECN and STP. The spread on both vary.

  • Spread on ECN: 55 pips
  • Spread on STP: 57 pips

Fees

For every position you take on your account, you are required to pay some fee for it. This fee is typically between 5-10 pips. Moreover, there is no fee as such in STP accounts.

Slippage

When orders are executed by the market, the trader will not receive the exact price at which he triggered the button. The difference between the actual received price and the triggered price is called the slippage.

Trading Range in EUR/NOK

A Trading range is a tabular representation of the pip movement in a currency pair for different timeframes. Below is the same table for the EURNOK currency pair. From these values, we can assess our profit/loss on a trade beforehand. All you must do is, find the product of the volatility value and the pip value ($0.95).

Procedure to assess Pip Ranges

  1. Add the ATR indicator to your chart
  2. Set the period to 1
  3. Add a 200-period SMA to this indicator
  4. Shrink the chart so you can assess a large time period
  5. Select your desired timeframe
  6. Measure the floor level and set this value as the min
  7. Measure the level of the 200-period SMA and set this as the average
  8. Measure the peak levels and set this as Max.

EUR/NOK Cost as a Percent of the Trading Range

This is an application to the above trading range table. By clubbing these values with the total cost of a trade, we can determine the cost variations for changing volatilities.

ECN Model Account 

Spread = 55 | Slippage = 3 | Trading fee = 3

Total cost = Spread + Slippage + Trading Fee = 55 + 3 + 3 = 61

STP Model Account

Spread = 57 | Slippage = 3 | Trading fee = 0

Total cost = Spread + Slippage + Trading Fee = 57 + 3 + 0 = 60

The Ideal way to trade the EUR/NOK

Trading the EURSEK is similar to trading any other exotic-cross pair. This pair has pretty high volatility with liquidity lesser than major/minor pairs. This is the reason for its spreads to be at 55 pips. Yet, this pair can still be traded.

From the above cost percentage table, we can infer that the magnitudes are large in the min column and small in the max column. This means that the costs are more for low volatilities are less for high volatilities. It is neither preferable to trade during high volatilities nor when the costs are less, for obvious reasons. So, to maintain equilibrium between costs and volatility, it is ideal for entering this pair when the volatility is more or less near the average values in the trading range table.

Another simple way to bring down your costs is by placing orders by ‘limit’ and ‘stop.’ When trades are not executed as market orders, the slippage is cut off. Hence, the total cost is reduced by a decent percentage. An example of the same is given below.

Spread = 55 | Slippage = 0 | Trading fee = 3

Total cost = Spread + Slippage + Trading Fee = 55 + 0 + 3 = 58

Categories
Forex Assets

Analyzing The Costs Involved While Trading The EUR/DKK Forex Pair

Introduction

The Euro Area’s euro against the Danish Krone, in short, is written as EURDKK. This is an exotic pair in the forex market. Typically, this pair is traded with low volumes. Here, EUR is the base currency, and DKK is the quote currency.

Understanding EUR/DKK

The current market price in the exchange of this pair depicts the value of Danish Krone equivalent to one euro. It is simply quoted as 1 EUR per X DKK. For example, if the current value of EURDKK is 7.4702, then about 7.5 DKK are required to buy one euro.

EUR/DKK Specification

Spread

In the foreign exchange market, spreads are the primary source through which brokers make money. They set a different price for buying and a different price for selling the same currency pair. This difference is referred to as the spread. This spread varies from broker to broker and also from the type of execution model used.

Spread on ECN: 40 pips | Spread on STP: 42 pips

Fee

This fee is the same fee is paid to the stockbrokers. In other terms, this is the commission that is paid to the broker. The fee on ECN accounts is between 5-10 pips, while it is nil on STP accounts.

Slippage

The difference between the price at which the trader executed the trade and actual executed price is called the slippage on the trade. This happens only on market orders, due to two reasons – Market volatility & Broker’s execution speed

Trading Range in EUR/DKK

As the name partially suggests, the trading range is a range of pip movements in a currency pair in different timeframes. Pip movement is also referred to as the volatility values. These values are extremely helpful in figuring the gain/loss that can be made on a trade.

Procedure to assess Pip Ranges

  1. Add the ATR indicator to your chart
  2. Set the period to 1
  3. Add a 200-period SMA to this indicator
  4. Shrink the chart so you can assess a large time period
  5. Select your desired timeframe
  6. Measure the floor level and set this value as the min
  7. Measure the level of the 200-period SMA and set this as the average
  8. Measure the peak levels and set this as Max.

EUR/DKK Cost as a Percent of the Trading Range

The total cost of the trade is determined by summing up the slippage, spread, and the trading fee. And this cost is not fixed. It varies based on the volatility of the market. Below is the tabular representation of the cost variation, which is signified in percentages.

ECN Model Account

Spread = 40 | Slippage = 3 | Trading fee = 3

Total cost = Spread + Slippage + Trading Fee = 40 + 3 + 3 = 46

STP Model Account

Spread = 42 | Slippage = 3 | Trading fee = 0

Total cost = Spread + Slippage + Trading Fee = 42 + 3 + 0 = 45

Note: The costs may seem significantly high because of the Spreads. As we know, these Spreads keep changing from time to time. At times we have seen the spreads for this pair being as low as 12. But we have considered maximum spread to give you the maximum cost percentages.

The Ideal way to trade the EUR/DKK

Trading the EURDKK is different from trading the major/minor currency pairs. And this can be easily figured out from the percentage values.

From the table, we can infer that the percentage values are extremely high on the 1H, 2H, and 4H timeframes. This means that the costs in these timeframes are super-high. Hence, trading this pair on these lower timeframes is a bad decision.

However, if we look at the next three rows (1D, 1W, and 1M), we can see that the percentage values are significantly lower than the above values. Hence, this makes this pair tradable on the daily, weekly, and monthly timeframes.

Consider the charts of EURDKK on the 1H and the 1D timeframe. On the 1H timeframe chart, we can see that there is barely any movement in the price. Also, volatility is high here.

On the other hand, on the 1D timeframe, there is enough movement in the prices, and the volatility is not very high as well. Hence, making it the ideal timeframe to trade.

Moreover, a simple and effective way to reduce costs is by trading using limit and stop orders instead of market orders. In doing so, the slippage will be completely nullified. Hence, the total cost will significantly reduce.

Categories
Forex Assets

Trading Costs Involved While Trading The EUR/SGD Exotic pair

Introduction

EUR/SGD is the abbreviation for the Euro area’s euro against the Singapore Dollar. This is one of the most traded exotic currency pairs in the world. In this pair, EUR is the base currency, and SGD is the quote currency.

Understanding EUR/SGD

The price of this pair represents the value of SGD, which is equal to one EUR. It is quoted as 1 EUR per X SGD. For example, if the value of this pair is 1.5552, then about 1.5 Singapore Dollars are required to purchase one euro.

EUR/SGD Specification

Spread

The spread is the difference between the bid and the ask price in the market. These two prices are set by the brokers. And it depends on the type of execution model used by the brokers.

Spread on ECN: 10 pips | Spread on STP: 11 pips

Fees

On ECN accounts, for every position you open, there is some fee involved with it. This is different for different brokers. However, on STP accounts, there is no fee as such.

Slippage

To put it in simple words, slippage is the difference between the trader’s demanded price and price given by the broker. The trader does not get his intended price due to two reasons – Broker’s execution speed & Market volatility

Trading Range in EUR/SGD

With the trading range table, we can assess our gain/loss on a trade in a given timeframe even before we open positions for it. This is done by considering the past volatility of the market.

Now, to determine the profit/loss on a trade, all you must do is, multiply the volatility value with the pip value ($7.25).

Procedure to assess Pip Ranges

  1. Add the ATR indicator to your chart
  2. Set the period to 1
  3. Add a 200-period SMA to this indicator
  4. Shrink the chart so you can assess a large time period
  5. Select your desired timeframe
  6. Measure the floor level and set this value as the min
  7. Measure the level of the 200-period SMA and set this as the average
  8. Measure the peak levels and set this as Max.

EUR/SGD Cost as a Percent of the Trading Range

This is an excellent application to the above volatility table. By considering the pip movement values, we can determine the cost variation of a trade as well. To do so, we find the ratio between the total cost and volatility value and convert it into percentages. Below are the cost variations for ECN and STP accounts models.

ECN Model Account 

Spread = 10 | Slippage = 3 | Trading fee = 3

Total cost = Slippage + Spread + Trading Fee = 3 + 10 + 3

Total cost = 16

STP Model Account

Spread = 11 | Slippage = 3 | Trading fee = 0

Total cost = Slippage + Spread + Trading Fee = 3 + 11 + 0

Total cost = 14

The Ideal way to trade the EUR/SGD

Comprehending the costs : Large/Small percentage -> High/Low costs

From the above the tables and the implications, we can conclude that costs are high when the volatility of the low and high when the volatility is low. And when it comes to the ideal way to trade this pair, conservative traders may trade it during those times when the volatility values are at or above the average values. This will ensure enough volatility as well as affordable costs. And other aggressive traders may trade during any of the extremes.

Also, traders can reduce their total costs by trading using limit orders and stop orders. Unlike the market orders, limit and stop orders do not include slippage on the trade. Hence, this will reduce costs considerably.

Categories
Forex Assets

Trading The USD/HRK Forex Currency Pair

Introduction

USDHRK is the abbreviation for the United States Dollar against the Croatian Kuna. Thw USDHRK is an emerging currency pair. Unlike the major/minor currency pair, this pair has high volatility and low liquidity. The volume is less too. Here, USD is the base currency, and HRK is the quote currency.

Understanding USD/HRK

The value of this pair determines the value of HRK equivalent to one USD. It is simply quoted as 1 USD per X HRK. For example, if the value of this pair is 6.6123, then 6.6123 Kuna is required to buy one US Dollar.

Spread

Spread is the way through which retail brokers make money from their clients. And it is through the difference between the bid price and the ask price in the market. This value is set by the brokers and varies from the type of execution model they use.

ECN: 25 pips | STP: 30 pips

Fees

A fee is basically the commission that you are liable to pay one each trade you make. This is similar to the one that is levied by stockbrokers. However, the fee is charged only by ECN brokers. There is no fee as such in STP accounts.

Slippage

In market orders, when you execute a trade, you don’t get the exact executed price. The actual executed price is different. This difference between the prices is what is known as slippage. Market volatility and the broker’s execution speed are two factors that affect the slippage on the trade.

Trading Range in USD/HRK

The minimum, average, and maximum volatility can be used to determine the risk of a trade. The profit/loss can be simply calculated by multiplying the volatility value with the pip value (per standard lot).

Procedure to assess Pip Ranges

  1. Add the ATR indicator to your chart
  2. Set the period to 1
  3. Add a 200-period SMA to this indicator
  4. Shrink the chart so you can assess a large time period
  5. Select your desired timeframe
  6. Measure the floor level and set this value as the min
  7. Measure the level of the 200-period SMA and set this as the average
  8. Measure the peak levels and set this as Max.

USD/HRK Cost as a Percent of the Trading Range

The total cost of the trade can be found as the sum of spread, slippage, and trading fee. This total cost is variable and is dependent on the volatility of the market. Below is the representation of the variation in the costs for different volatilities and timeframes.

ECN Model Account

Spread = 25 | Slippage = 3 |Trading fee = 3

Total cost = Slippage + Spread + Trading Fee = 3 + 25 + 3 = 31

STP Model Account

Spread = 30 | Slippage = 3 | Trading fee = 0

Total cost = Slippage + Spread + Trading Fee = 3 + 30 + 0 = 33

The Ideal way to trade the USD/HRK

The percentages in the above tables depict how the cost varies on the trade. The higher the value, the higher is the cost of the trade. Similarly, the smaller the percentages, the lower is the costs.

From the above tables, it can be ascertained that the costs are high for low volatilities, as the percentage values are high in the min column. And the costs are lower for high volatilities. So, the ideal way to trade this pair is dependent on the type of trader you are. For instance, a trader who is particular about costs may trade when the volatility of the currency pair is high. The traders who wish to keep a balance between the two may trade during those times when the volatility is around the average values.

Moreover, one may reduce their costs by trading using limit or stop orders instead of market orders. This will cut off the slippage factor on the trade and bring down the total costs pretty much. An example of the same is given below.

Spread = 25 | Slippage = 0 |Trading fee = 3

Total cost = Slippage + Spread + Trading Fee = 0 + 25 + 3 = 28

Categories
Forex Assets

Analyzing The USD/MAD Forex Currency Pair

Introduction

USD/MAD is the abbreviation for the US dollar against the Moroccan Dirham. This pair is classified as an emerging currency pair in the forex market. In this pair, USD is the base currency, and MAD is the quote currency. Typically. It is seen that this pair has pretty low volatility and liquidity. However, it can still be traded under certain conditions.

Understanding USD/MAD

The market price of this currency pair determines the value of MAD that is equivalent to one USD. For instance, if the current market price of USD/MAD is 9.5867, then these many Moroccan Dirhams are required to purchase one USD.

Spread

The difference between the bid price and the ask price is referred to as the spread. This is the primary way through which brokers generate revenue. Spread is a variable and is different with different brokers. It also differs based on the execution model used by the broker.

ECN: 35 pips | STP: 40 pips

Fees

The commission paid on each trade is the fee on that trade. Note that, the concept of the fee is only ECN accounts and not STP accounts. The fee on ECN accounts is typically between 5-10 pips.

Slippage

Slippage is the difference between the price intended by the client and the price that is actually executed by the broker. There is this difference due to two reasons:

  • Market’s volatility
  • Broker’s execution speed

Trading Range in USD/MAD

The trading range is the tabular representation of the volatility of the market in different timeframes. These values help in assessing the minimum, average, and maximum profit/loss in six different timeframes.

Procedure to assess Pip Ranges

  1. Add the ATR indicator to your chart
  2. Set the period to 1
  3. Add a 200-period SMA to this indicator
  4. Shrink the chart so you can assess a large time period
  5. Select your desired timeframe
  6. Measure the floor level and set this value as the min
  7. Measure the level of the 200-period SMA and set this as the average
  8. Measure the peak levels and set this as Max.

USD/MAD Cost as a Percent of the Trading Range

The total cost of the trade is calculated by adding up the slippage, spread, and the trading fee. It is not constant but varies based on the volatility of the market. Below are tables that represent how costs vary for different timeframes and volatilities.

ECN Model Account

Spread = 35 | Slippage = 3 |Trading fee = 3

Total cost = Slippage + Spread + Trading Fee = 3 + 35 + 3 = 41

STP Model Account

Spread = 40 | Slippage = 3 | Trading fee = 0

Total cost = Slippage + Spread + Trading Fee = 3 + 40 + 0 = 43

The Ideal way to trade the USD/MAD

Starting off from the trading range table, we can see that the volatility of this pair is quite high. The spread, too, is higher than other emerging pairs. So, it is not really ideal to trade at any time in 24 hours.

When we have a look at the cost percentage tables, we can see that the percentages are high in the minimum column, and low in the max column. This implies that the costs are high during low volatilities, and costs are low during high volatilities. So, the best time to trade this pair is when the volatility is around the average values because this assures decent volatility as well as affordable costs.

Furthermore, the costs can be reduced by placing orders as ‘limit’ instead of ‘market’. In doing so, the slippage on the total costs will be made zero. So, spread and trading fee will be the only factors involved in calculating the total cost.

Categories
Forex Assets

Understanding The USD/TWD Forex Currency Pair

Introduction

USDTWD is the abbreviation for the US dollar against the New Taiwan Dollar. Due to the involvement of Taiwan in this pair, this pair is classified as an Asian emerging currency pair. Here, the US Dollar is the base currency, and the New Taiwan Dollar is the quote currency.

Understanding USD/TWD

The TWD required to purchase one USD is determined by the price on the exchange rate. It is simply quoted as 1 USD per X TWD. For example, if the price of this pair was 25.856, a rounded figure of 26 TW Dollars are needed to buy one US Dollar.

Spread

The spread is a type of fee that is paid to the broker on each trade. The amount to be paid depends on the lot size traded and also the volatility of the market. It is simply the difference between the bid price and the ask price on the exchange board. The bid and ask price is typically different from different brokers. It also varies based on the execution model implemented by the broker.

ECN: 27 pips | STP: 30 pips

Fees

The commission that a broker charges on each of your trade is the fee. This, too, depends on the type of execution model. Note that there is no fee on STP accounts. However, this is covered by higher spreads.

Slippage

In market orders, one does not get the exact price at which they triggered their buy/sell button. It varies due to the market volatility and the broker’s execution speed. This could be in favor of or against the client.

Trading Range in USD/TWD

The trading range is a range of pip movement values in different timeframes. In simple terms, it tells the number of pips the currency pair has moved in a given timeframe. For example, if the minimum volatility value on the 1H timeframe is five pips, then it means that this pair moves at least five pips in about an hour or so. These values can be helpful in figuring the approximate P/L on a trade, even before placing the trade.

Procedure to assess Pip Ranges

  1. Add the ATR indicator to your chart
  2. Set the period to 1
  3. Add a 200-period SMA to this indicator
  4. Shrink the chart so you can assess a large time period
  5. Select your desired timeframe
  6. Measure the floor level and set this value as the min
  7. Measure the level of the 200-period SMA and set this as the average
  8. Measure the peak levels and set this as Max.

USD/TWD Cost as a Percent of the Trading Range

From the above table, one may even determine the total cost variation in trade in different timeframes for different volatilities. With these values, we can, in turn, determine the ideal way to trade this currency pair.

ECN Model Account

Spread = 27 | Slippage = 3 |Trading fee = 3

Total cost = Slippage + Spread + Trading Fee = 3 + 27 + 3 = 33

STP Model Account

Spread = 30 | Slippage = 3 | Trading fee = 0

Total cost = Slippage + Spread + Trading Fee = 3 + 30 + 0 = 33

The Ideal way to trade the USD/TWD

The magnitude of the percentages in the table represents how high or low is the cost of the trade. It is proportional to the cost of the trade. In the below table, we can clearly see that the costs are high in the min column, depicting high costs for lower volatilities. Similarly, low costs for high volatilities.

Also, the costs are pretty high on lower timeframes compared to the higher timeframes. So, this definitely is not the best pair to trade for scalpers. With an investment point of view, it could prove to be the best pair irrespective of the timeframe you’re trading. Talking about a positional trader, it is ideal to trade during those times when the volatility of the market is around the average values.

Another simple way to bring your costs down is by placing limit or stop orders instead of market orders. This considerably brings down the cost of the trade as the slippage in such orders is nil.

Below is an example of the cost percentages when the slippage is made zero.

Spread = 30 | Slippage = 0 | Trading fee = 0

Total cost = Slippage + Spread + Trading Fee = 0 + 30 + 0 = 30

Categories
Forex Assets

Trading Costs Involved While Trading The USD/PHP Forex Pair

Introduction

USD/PHP is the abbreviation for the US dollar versus the Philippine Peso. Since Philippine is involved in the pair, this classified under the Asian emerging pairs. In this pair, the USD is the base currency and the PHP is the quote currency.

Understanding USD/PHP

The current market price determines the price of PHP that is equivalent to one US dollar. It is simply quoted as 1 USD per X PHP. For example, if the price of this pair was 50.96, then around 51 pesos would be required to buy one US dollar.

Spread

The difference between the bid price and the ask price is referred to as the spread. This value a variable that varies from broker to broker as well as the type of execution model used by the brokers.

ECN: 3 pips | STP: 4 pips

Fees

The fee is a synonym for commission. It is levied on the ECN accounts only and not STP accounts.

Slippage

Slippage is some sort of a fee that is paid only on market orders. Slippage is the pip difference between the trader’s requested price and the price that was given by the broker. There is variation primarily due to two reasons – Market’s volatility & Broker’s execution speed

Trading Range in USD/PHP

Wanting to know how much could be your minimum average and maximum profit/loss of a trade in a given timeframe? Below is a table that will help you with it. With the pip movement values in the table, one can determine their risk on the trade. All you have to do is, multiply the volatility value with the pip value ($19.24). This will yield the value for one standard lot size.

 Procedure to assess Pip Ranges

  1. Add the ATR indicator to your chart
  2. Set the period to 1
  3. Add a 200-period SMA to this indicator
  4. Shrink the chart so you can assess a large time period
  5. Select your desired timeframe
  6. Measure the floor level and set this value as the min
  7. Measure the level of the 200-period SMA and set this as the average
  8. Measure the peak levels and set this as Max.

USD/PHP Cost as a Percent of the Trading Range

Apart from the profit/loss in a trade, we can even determine the cost variation in altering volatilities. To do so, we have taken the ratio between the volatility value and the total cost and represented it as a percentage.

ECN Model Account

Spread =3 | Slippage = 3 |Trading fee = 3

Total cost = Slippage + Spread + Trading Fee = 3 + 3+ 3 = 9

STP Model Account

Spread = 4 | Slippage = 3 | Trading fee = 0

Total cost = Slippage + Spread + Trading Fee = 3 + 4 + 0 = 7

The Ideal way to trade the USD/PHP

Firstly, from the trading range table, we can infer that the volatility of this pair is feeble. But, note that, the small pip movement values do not mean you’ll have to trade large quantities to make a good profit. Since the pip value (per standard lot) is $19.24, even a 0.1 pip will generate $1.924.

Coming to the cost table, the percentages here are too high, especially in the min column. So it is recommended to not trade during low volatilities as It will have high costs. So, to reduce costs, it is ideal to trade when the volatility of the market is on the higher side. As far as the risk involved in highly volatile markets is concerned, you may cut down your lot sizes.

To simplify it even further, you can bring down your costs by executing your trades as limit/stop orders instead of market orders. This eliminates the slippage involved in the calculation of total costs on the trade.

Categories
Forex Assets

Analyzing The USD/KRW Forex Currency Pair

Introduction

USDKRW is the abbreviation for the US Dollar against the South Korean Won. This pair comes under the branch of emerging currency pairs. Here, the US Dollar, being on the left, is the base currency, and the KRW is the quote currency.

Understanding USD/KRW

The market price of this determines the value of KRW equivalent to the US $1. It is quoted as 1 USD per X KRW. So, if the market price of USDINR is 1199.70, these many units of the quote currency are required to purchase one unit of the base currency.

Spread

The algebraic difference between the bid price and the ask price is referred to as the spread. This is the primary source through which brokers generate their revenue. The spread varies from broker to broker and also the way through which they execute the trades.

ECN: 24 pips | STP: 25 pips

Fees

A fee is nothing but the commission that you pay to the broker on each trade. It is similar to that one that is paid to stock market brokers. Below is the fee on ECN and STP accounts.

ECN – 5-10 pips | STP – 0 pips

Slippage

Slippage is the variation in the price that was intended by the trade and price that was executed by the broker. Market volatility and the broker’s execution speed are the sole reasons for slippage to occur.

Trading Range in USD/KRW

A trading range is a table of volatility values in different timeframes. It shows the minimum, average, and maximum pip movement in USDKRW.

Procedure to assess Pip Ranges

  1. Add the ATR indicator to your chart
  2. Set the period to 1
  3. Add a 200-period SMA to this indicator
  4. Shrink the chart so you can assess a large time period
  5. Select your desired timeframe
  6. Measure the floor level and set this value as the min
  7. Measure the level of the 200-period SMA and set this as the average
  8. Measure the peak levels and set this as Max.

USD/KRW Cost as a Percent of the Trading Range

This an application to the above range table. Here, we determine the variation in the costs for changing volatility and a set of timeframes. With this, we can figure out the ideal times of the day to enter and exit this currency pair.

ECN Model Account

Spread = 19 | Slippage = 3 |Trading fee = 3

Total cost = Slippage + Spread + Trading Fee = 3 + 24 + 3 = 30

STP Model Account

Spread = 20 | Slippage = 3 | Trading fee = 0

Total cost = Slippage + Spread + Trading Fee = 3 + 25 + 0 = 28

The Ideal way to trade the USD/KRW

Though the Forex market is a 24-hour market, it is not really ideal to trade anytime during the day. This is due to the changes in the costs as the volatility changes.

From the table, we can observe that the cost percentage values are higher in the minimum column and comparatively lower in the maximum column. This means that the costs are high during less volatile markets, and low for highly volatile markets. So, choosing the right time to trade is dependent on the type of trader you are.

For instance, if a trader is concerned about the costs and ignorant of the volatility, then he may trade the market during high volatilities. But, if you’re a trader who’s concerned about both the factors, then you may trade during those times when the volatility of the market is around the average values. This will provide you with decent volatility with pretty low costs as well.

There is another way through which one can lower their cost much more. And this is through taking trades using limit orders instead of market orders. Considering the above-mentioned example, the total cost now would be reduced by three pips.

Categories
Forex Assets

Assessing The USD/UAH Exotic Forex Currency Pair

USD/UAH is the abbreviation for the currency pair US dollar against the Ukrainian Hryvnia. It is classified as an emerging currency pair. The volatility, liquidity, and volume in this pair, is significantly low. In this pair, the US dollar is the base currency, and UAH is the quote currency.

Understanding USD/UAH

The value of the pair as a whole represents the value of UAH that is equivalent to one US dollar. It is quoted as 1 USD per X UAH. For instance, if the value of USDUAH is 24.19, then about 24 Hryvnias are required to purchase one US dollar.

Spread

The difference between the bid price and the ask price is referred to as the spread. Spread usually varies from broker to broker, and also on the execution model used by the brokers.

ECN: 20 pips | STP: 23 pips

Fees

As the name pretty much suggests, the fee is the charge paid to the broker on each trade. Below is the fee on ECN and STP accounts.

ECN – 5-10 pips | STP – 0 pips

Slippage

Due to the changes in the volatility and the broker’s execution speed on the trade, a trader does not get the exact price he needed. And the difference between the two prices is called slippage.

Trading Range in USD/UAH

Risk management is a vital factor in trading. The trading range is a tabular representation of the pip movement in a currency pair in different timeframes. And these values help in determining the gain or loss on a trade.

Note: The product of the pip movement value and the pip value (per standard lot) yields the profit/loss in a trade for a particular timeframe.

Procedure to assess Pip Ranges

  1. Add the ATR indicator to your chart
  2. Set the period to 1
  3. Add a 200-period SMA to this indicator
  4. Shrink the chart so you can determine a large time period
  5. Select your desired timeframe
  6. Measure the floor level and set this value as the min
  7. Measure the level of the 200-period SMA and set this as the average
  8. Measure the peak levels and set this as Max.

USD/UAH Cost as a Percent of the Trading Range

The total cost of a trade is determined by the sum of the spread, slippage, and the trading fee. And this varies from time to time, based on the volatility of the market. Below are the tables that represent the costs for different volatilities and timeframes.

ECN Model Account

Spread = 20 | Slippage = 3 |Trading fee = 5

Total cost = Spread + Slippage + Trading Fee = 20 + 3 + 5 = 28

STP Model Account

Spread = 23 | Slippage = 3 |Trading fee = 5

Total cost = Spread + Slippage + Trading Fee = 23 + 3 + 5 = 31

The Ideal way to trade the USD/UAH

Firstly, the percentage values depict the cost variation on the trade. The magnitude of the percentage is directly proportional to the cost of the trade.

We can see that the minimum pip movement in 1H, 2H, and 4H timeframe is 0 pips. So, it is pointless to trade in the lower timeframes. However, one may trade this pair on the higher timeframes, like the 1D, 1W, and 1M. To reduce costs even further and to have decent volatility, one may preferably trade when the volatility of the market is above the average values.

Furthermore, limit orders is another way through which a trader can bring down their costs considerably. This is because limit orders, unlike the market orders, do not have any slippage on it. For instance, the total cost on an ECN account for limit orders would be,

Total cost = Spread + Slippage + Trading Fee = 20 + 0 + 5 = 25

Corollary

We can see that on average volatilities, it almost takes a week range to cover the costs if the trade goes in the direction of the trade.  That means this pair is unsuitable to trade short-term. The use of limit orders to catch the price entry at the absolute minimum of the week, combined with ultra-reliable timing, is the only way to succeed. There are lots of better pairs to choose from.

Categories
Forex Assets

Learning The Costs Involved While Trading The USD/RUB Pair

Introduction

USD/RUB is the tick symbol for the US Dollar against the Russian Ruble. This emerging currency pair has high volatility and usually low volume. Here, the US Dollar is the base currency, and the RUB is the quote currency.

Understanding USD/RUB

The price of this pair determines the value of RUB that’s equivalent to one US Dollar. It is quoted as 1 USD per X RUB. For example, if the market price of this pair was 68.69, then these many Rubles are required to purchase one US Dollar.

Spread

It is the difference between the bid price and ask price in the exchange market. This value is set by the brokers and varies from each other. Also, it varies on the type of execution model.

ECN: 21 pips | STP: 23 pips

Fees

This fee is levied by stockbrokers as well. The fee on ECN and STP account is given below.

ECN: 3-10 pips | STP: 0 pips

Slippage

The difference between the investor’s intended price and the real price executed by the broker is called slippage. Slippage happens solely due to the changes in the market’s volatility and speed with which the broker executes a trade.

Trading Range in USD/RUB

The trading range is a tabular illustration of the minimum, average, and maximum volatility in a currency pair for a given timeframe. Using these values, traders can quickly assess their risk on the trade for any of the given timeframes.

Procedure to assess Pip Ranges

  1. Add the ATR indicator to your chart
  2. Set the period to 1
  3. Add a 200-period SMA to this indicator
  4. Shrink the chart so you can assess a substantial period
  5. Select your desired timeframe
  6. Measure the floor level and set this value as the min
  7. Measure the level of the 200-period SMA and set this as the average
  8. Measure the peak levels and set this as Max.

USD/RUB Cost as a Percent of the Trading Range

Total cost is the sum of the slippage, spread, and the trading fee. This varies based on the volatility of the market. And below is a table that represents the cost variation for different volatilities.

ECN Model Account

Spread = 21 | Slippage = 3 |Trading fee = 3

Total cost = Slippage + Spread + Trading Fee = 3 + 21 + 3 = 27

STP Model Account

Spread = 23 | Slippage = 3 | Trading fee = 0

Total cost = Slippage + Spread + Trading Fee = 3 + 23 + 0 = 26

The Ideal way to trade the USD/RUB

Note that, the larger the value of the percentages, the higher is the cost on the trade and vice versa. The table clearly says the costs are high for low volatilities as the magnitudes of costs are high in the min column. But, it is not really ideal to trade in these extreme regions. To ensure decent volatility with comparatively low costs, it is ideal to trade this pair when the Volatility is around the average value in the trading range table.

We can see that slippage is a pretty heavy variable in the total costs. However, it can be nullified simply by placing orders using limit/stop orders rather than market orders. The drop in the total costs on the trade is represented in the below table as follows.

We can see, also that there are substantial costs when trading the USDRUB pair, even ion a daily timframe. That means that you will need to be right on direction and extension of the movement to be profitable, because, on an average trading range it would require about 12 hours of positive price movement to cover the trading costs. Therefore it is recommended to trade this exotic pair on swings of more than a week, to reduce the percent of the movement that is absorbed by the trade cost.


Categories
Forex Assets

Asset Analysis – EUR/HKD Exotic Currency Pair

Introduction

EUR/HKD is the abbreviation for the Euro area’s euro against the Hong Kong dollar. It is classified as an exotic currency pair that usually has high volatility and low trading volume. Here, the EUR is the base currency, and the HKD is the quote currency.

Understanding EUR/HKD

The current value of the pair represents the value of HKD that is equivalent to one USD. It is quoted as 1 EUR per X HKD. For example, if the value of this pair is 9.8764, then these many units of HKD are required to buy one US dollar.

Spread

In trading, the difference between the bid price and the ask price is referred to as the spread. Spread typically varies from broker to broker. The approximate spread on ECN and STP accounts is given below.

ECN: 17 pips | STP: 18 pips

Fees

The fee is the commission you pay to your broker for each position you open. The value of this, too, is in the hands of the broker. However, note that there are no fee STP accounts.

Slippage

Slippage is the difference between the price at which the trader executed the trade and the price he actually received from the broker. Essentially, slippage depends on two factors:

  • Broker’s execution speed
  • Market’s volatility

Trading Range in EUR/HKD

Knowing how much profit you can make or how much loss you can incur in a trade in a specific time frame is vital. The Trading Range can be assessed using the table given below. It represents the minimum, average, and maximum pip movement in EURHKD in different timeframes.

Procedure to assess Pip Ranges

  1. Add the ATR indicator to your chart
  2. Set the period to 1
  3. Add a 200-period SMA to this indicator
  4. Shrink the chart so you can determine a large period
  5. Select your desired timeframe
  6. Measure the floor level and set this value as the min
  7. Measure the level of the 200-period SMA and set this as the average
  8. Measure the peak levels and set this as Max.

EUR/HKD Cost as a Percent of the Trading Range

Total cost is not constant for every trade you take. It varies based on the volatility of the market. And the variation of it can be obtained from the two tables given below.

ECN Model Account

Spread = 17 | Slippage = 3 |Trading fee = 3

Total cost = Slippage + Spread + Trading Fee = 3 + 17 + 3 = 23

STP Model Account

Spread = 18 | Slippage = 3 | Trading fee = 0

Total cost = Slippage + Spread + Trading Fee = 3 + 18 + 0 = 21

The Ideal way to trade the EUR/HKD

Exotic currency pairs tend to have high volatility and low volume. And it is not ideal to trade during these times. So, let us find out the best times of the day to trade this currency pair by comprehending the above tables.

The higher percentages depict higher costs on the trade. It can be ascertained that the percentages are on the upper side in the min column. Hence, we can conclude that the costs are high when the volatility of the market is high and vice versa.

And, when it comes to determining the right time to enter the market, one may open positions when the volatility of the market is around the average volatility. This method will ensure both decent volatility and low costs.

Market orders result in slippage, and limit orders do not. Hence, placing limit orders is another way through which one can considerably reduce their total costs on the trade.

Categories
Forex Assets

Understanding The USD/THB Exotic Forex Pair

Introduction

USD/THB is the abbreviation for the US Dollar versus Thailand’s Thai Baht. It is an exotic currency pair which usually has high volatility and low trading volume. US Dollar, in this pair, is the base currency, and the Thai Baht is the quote currency.

Understanding USD/THB

The value of USDTHB represents the number of THB that are equivalent to one USD. It is quoted as 1 USD per X THB. So, if the market price of this pair is 30.98, then one has to produce 30.98 THB to buy one USD.

Spread

Spread is the difference between the bid and the ask price of the currency pair set by the brokers. It typically varies from broker to broker and also from the type of order execution. The spreads on ECN and STP accounts are as shown below.

ECN: 10 pips | STP: 11 pips

Fees

There is a fee associated with every trade you take. The fee is also referred to as the commission on the trade. Its value is usually a constant but varies from the type of execution model. The fee on STP accounts is nil, while there are a few pips of fee on ECN accounts.

Slippage

Slippage is the difference between the trader’s required price and the price at which his trade was executed. Since exotic pairs are highly volatile, the slippage is quite high.

Trading Range in USD/THB

Below we shoe a table representation of the minimum, average, and maximum pip movement in a currency pair. These values help us determine the profit or loss that can be made on a trade in a given amount of time. All you have to do is, multiply any one of the below values with the value per pip ($32.26). The result is the potential profit gained or lost on the trade for one bar of the timeframe.

Procedure to assess Pip Ranges

  1. Add the ATR indicator to your chart
  2. Set the period to 1
  3. Add a 200-period SMA to this indicator
  4. Shrink the chart so you can assess a large period
  5. Select your desired timeframe
  6. Measure the floor level and set this value as the min
  7. Measure the level of the 200-period SMA and set this as the average
  8. Measure the peak levels and set this as Max.

USD/THB Cost as a Percent of the Trading Range

The cost as a trading range represents the cost variation in trade in different volatilities of the market. It is presented in percentages of the total range. Thus, it helps determine the best moments to enter the market to ensure lower costs.

ECN Model Account

Spread = 10 | Slippage = 3 |Trading fee = 3

Total cost = Slippage + Spread + Trading Fee = 10 + 3 + 3 = 16

STP Model Account

Spread = 11 | Slippage = 3 | Trading fee = 0

Total cost = Slippage + Spread + Trading Fee = 11 + 3 + 0 = 14

The Ideal way to trade the USD/THB

Trading exotic pairs are different from trading the major and minor pairs. However, there are times when one can trade this pair by making attempts to reduce the costs.

The magnitude of the percentages represents the costs of the trade. The higher the percentages, the higher are the costs on the trade. It can be seen from tables that the costs are high on the min column and comparatively lower in the max column. This clearly means the costs are high during high volatilities and vice versa.

However, when it comes to determining the right time to trade, one must trade during those moments when the volatility is around the higher values because this will ensure pretty great volatility as well as low costs.

Furthermore, another simple way to reduce costs is by trading using limit/stop orders instead of market orders. Limit orders will eliminate the slippage and significantly reduce the total cost of the trade.

Finally, we can see that we must be pretty sure of the direction and extension of the trend to trade the USDTHB, and avoid trading it intraday. Using the daily chart and limit orders, we still would need almost 4 Hours of a positive movement (with the trade) to pay the costs. Therefore we practical setups would ask for at least 2-3 days of market action for propper reward-to-risk factors.

Categories
Forex Assets

What Should You Know Before Trading The CHF/JPY Currency Pair

Introduction

CHFJPY is a symbolic representation of the Swiss franc against the Japanese yen. Here, CHF is the base currency, and JPY is the quote currency. Since it does not have USD involved, it is classified as a cross-currency pair.

Understanding CHF/JPY

The market price of this pair is the number of JPY that are required to purchase one CHF. It is quoted as 1 CHF per X JPY. For example, it’s current value is 112.31, then 112.31 yen are needed to buy one Swiss franc.

Spread

Spread in forex is the difference between the bid price of a currency and the ask price of it. And this pip difference is used up by the brokers as a form of fee. However, it is not a fixed value. It varies from brokers to brokers.

ECN: 1.3 | STP: 2.1

Fees

Spread is not the only form of fee that is levied by the brokers. There is a commission on the trade as well. The commission is nil on STP accounts, but pips on ECN accounts.

Slippage

When entering a trade using market orders, the trader does not get the exact price he intended when he executed it. There might be a difference in pips. This difference is referred to as slippage. Slippage may be in favor of or against the trader.

Trading Range in CHF/JPY

The trading range is simply a representation of the minimum, average, and maximum pip movement in a currency pair. With these values, one can assess how much money a trader will be risking in a particular timeframe. For example, if the average pip movement on the 4H in this pair is 15 pips, then a trader can expect to win or lose $150.6 in about 4H or so.

Procedure to assess Pip Ranges

  1. Add the ATR indicator to your chart
  2. Set the period to 1
  3. Add a 200-period SMA to this indicator
  4. Shrink the chart so you can determine a large time period
  5. Select your desired timeframe
  6. Measure the floor level and set this value as the min
  7. Measure the level of the 200-period SMA and set this as the average
  8. Measure the peak levels and set this as Max.

CHF/JPY Cost as a Percent of the Trading Range

Apart from knowing the profit or loss can one can incur in a given timeframe, it is necessary to assess the cost of these trades as well. Below is a table that represents the cost variation in different volatilities. And these costs are determined by finding the ratio between the total cost and the volatility.

ECN Model Account

Spread = 1.3 | Slippage = 2 |Trading fee = 1

Total cost = Slippage + Spread + Trading Fee = 2 + 1.3 + 1 = 4.3

STP Model Account

Spread = 2.1 | Slippage = 2 | Trading fee = 0

Total cost = Slippage + Spread + Trading Fee = 2 + 2.1 + 0 = 4.1

The Ideal way to trade the CHF/JPY

The forex market is open 24hours. However, it is not ideal to enter the market at any time. There are times when the costs are low, and times when it’s high.

The percentages in the table are directly proportional to the costs of the trade. It is seen that the percentages are high in the minimum column, and low in the maximum column. Hence, we can conclude that costs are inversely proportional to the volatility of the market. Now, when it comes to choosing the right time to trade, it is best to enter during those times when the volatility of the market is around the average values. This will ensure enough volatility in the market and low costs as well.

In addition, placing orders using limit/pending orders reduces costs too because this will completely nullify the slippage on the trade and will bring down the total cost significantly.

Categories
Forex Assets

Analyzing The CAD/JPY Forex Asset Class

Introduction

CADJPY is the abbreviation for the currency pair, the Canadian dollar against the Japanese yen. This pair is one of the most extensively traded cross currency pairs. In CADJPY, CAD is referred to as the base currency and JPY as the quote currency.

Understanding CAD/JPY

The value of CADJPY is the value of JPY, which is required to purchase one CAD. It is quoted as 1 CAD per X JPY. For example, if the current market price of this pair is 82.651, then these many units of Japanese yen are needed to buy one Canadian dollar.

Spread

The bid price is the price used to sell a currency, and ask price is the price used to buy a currency. There is always a difference between the two prices. This difference is called the spread. It varies from broker to broker and also the type of their execution model.

ECN: 1.1 | STP: 2

Fees

Similar to stockbrokers, there are forex brokers who charge a few pips of fee on each position a trader opens and closes. This fee is no different from the commission brokers levy. On STP accounts, the fee is nil, while on ECN accounts, it is between 6-10 pips depending on the broker one is using.

Slippage

Slippage in trading is the difference between the price requested by the trader and the price he actually received. The two factors responsible for slippage are,

  • The volatility of the market
  • Broker’s execution speed

Trading Range in CAD/JPY

A trading range is a tabular representation of the number of pips a currency pair moved in a given timeframe. It represents the minimum, average as well as the maximum pip movement in six different timeframes. These values prove to be important for assessing one’s risk on a trade. For example, if the minimum pip movement in CADJPY on the 4H timeframe is ten pips, then a trader can expect to lose $917 in about 4H.

Procedure to assess Pip Ranges

  1. Add the ATR indicator to your chart
  2. Set the period to 1
  3. Add a 200-period SMA to this indicator
  4. Shrink the chart so you can determine a large period
  5. Select your desired timeframe
  6. Measure the floor level and set this value as the min
  7. Measure the level of the 200-period SMA and set this as the average
  8. Measure the peak levels and set this as Max.

CAD/JPY Cost as a Percent of the Trading Range

As already mentioned, there is a fee for every trade you take. And knowing the percent fee on the trades you are taking is important, as it depends on the volatility of the market and the timeframe you are trading.

Below is a representation of the total cost variation on trade in terms of percentages. Since costs on ECN accounts are different from STP accounts, we have two separate tables for this concept.

ECN Model Account

Spread = 1.1 | Slippage = 2 |Trading fee = 1

Total cost = Slippage + Spread + Trading Fee = 2 + 1.1 + 1 = 4.1

STP Model Account

Spread = 2 | Slippage = 2 | Trading fee = 0

Total cost = Slippage + Spread + Trading Fee = 2 + 2 + 0 = 4

The Ideal way to trade the CAD/JPY

Before getting right into it, let us comprehend the above tables. The higher the values of the percentages, the higher are the costs on the trade. It is pretty evident from the table that, percentage values are on the higher side in the min column and comparatively lower in the max column. This means that the costs are high when the volatility of the market is low and vice versa. Also, the trades that are taken based on a long term perspective, the costs are considerably low.

One may trade the high volatility markets to minimize your costs, or trade during low volatility by paying high costs. However, it is ideal to enter during those times of the day when the volatility is close to the average values. During these times, one can expect comparatively low costs with enough volatility as well.

On a further note, another simple and effective way to reduce costs is by trading using limit orders. This entry method will take slippage out of the total costs and bring down its value considerably. An example of the same is given below.

Spread = 2 | Slippage = 0 | Trading fee = 0

Total cost = Slippage + Spread + Trading Fee = 2 + 0 + 0 = 2

Categories
Forex Assets

Fundamentals Of CAD/CHF Forex Currency Pair

Introduction

CAD/CHF is a currency pair where two currencies, namely, the Canadian dollar and the Swiss franc, are involved. It is a cross-currency pair. Here, CAD is called the based currency, and CHF is called the quote currency.

Understanding CAD/CHF

The current market price of CADCHF tells the value of CHF equivalent to one CAD. It is represented as 1 CAD per X CHF. For example, if the value of CADCHF in the market is 0.7372, then one must pay 0.7372 Swiss francs to buy one Canadian dollar.

Spread

In simple terms, the spread is the difference between the bid price and the ask price set by the brokers. It is not a fixed value and differs from time to time and broker to broker. It also varies based on the type of execution model.

ECN: 1 | STP: 2

Fees

The fee is the commission that is levied by the broker on each trade a trader takes. This, too, like the spread, differs from broker to broker and the type of their execution model. Fee on ECN accounts is 6-10 pips, while it is nil on STP accounts.

Slippage

Slippage is the difference between the trader’s executed price and the price he actually received from the broker. There is always this difference due to the volatility of the market and the broker’s trade execution speed. Note that slippage only happens on market orders.

Trading Range in CAD/CHF

Apart from analyzing the direction of the market, one must predetermine their risk and reward based on the volatility and the timeframe. Knowing how much a trader will gain or lose in a given time frame is a vital trade management tool. And below is a table through which one can determine their profit/loss that can be made in a specified timeframe. For example, the average pip movement on the 1H timeframe is 6.8. So, a trader can expect to be in a profit of $68.34 or in a loss of the same amount.

Procedure to assess Pip Ranges

  1. Add the ATR indicator to your chart
  2. Set the period to 1
  3. Add a 200-period SMA to this indicator
  4. Shrink the chart so you can assess a large time period
  5. Select your desired timeframe
  6. Measure the floor level and set this value as the min
  7. Measure the level of the 200-period SMA and set this as the average
  8. Measure the peak levels and set this as Max.

CAD/CHF Cost as a Percent of the Trading Range

An application to the above volatility table is to find the cost differences on trades by considering the volatility and the total cost on a trade. Below is the table that illustrates the variation in cost on a trade, in terms of percentage. The comprehension of it is discussed in the subsequent topic.

ECN Model Account

Spread = 1 | Slippage = 2 |Trading fee = 1

Total cost = Slippage + Spread + Trading Fee = 2 + 1 + 1 = 4

STP Model Account

Spread = 2 | Slippage = 2 | Trading fee = 0

Total cost = Slippage + Spread + Trading Fee = 2 + 2 + 0 = 2

The Ideal way to trade the CAD/CHF

The higher the magnitude of the percentage, the higher is the cost of the trade.

The values in the table are least in the min column and highest in the max column. This simply means that the costs are high when the volatility of the market is low and vice versa.

In the average column, the values are not as low as in the max column, and not as high as in the max column. The volatility here is moderate too. Hence, this becomes our ideal time of the day to trade in the market.

To sum it up, one must trade during those times of the day when the volatility is more or less near the average values. This will ensure decent volatility as well as minimal costs.

There is another simple technique to reduce costs on trade. When trades are executed using limit order instead of market orders, the slippage becomes nil. So, this brings down the total cost of the trade by a significant value.

Categories
Forex Assets

Basics Of Trading The AUD/CHF Currency Pair & Analyzing The Trading Costs Involved

Introduction

AUDCHF is the abbreviation for the Australian dollar and the Swiss franc. It is a cross-currency pair in the market. AUD being on the left is the base currency, and CHF (on the right) is the quote currency. One can expect high volatility and liquidity during the Australian session.

Understanding AUD/CHF

The value of AUDCHF represents the amount of Swiss Francs required to buy one Australian dollar. It is quoted as 1 AUD per X CHF. For example, if the value of AUDCHF is 0.6885, then this number represents the CHF that is to be produced by the trader to buy one AUD.

AUD/CHF Specification

Spread

Spread is the difference between the bid price and the ask price of the market set by the brokers. It is not a fixed value. It differs from the account type as well as the broker.

ECN: 0.7 | STP: 1.7

Fees

Brokers charge a fee on every trade a trader takes. It could be per execution or finished trade (round trip). Also, it varies from the type of account model. Typically, fee on ECN type is 5-10 pips, and 0 on STP type.

Slippage

Slippage is the difference between the price demanded by the trader and the price he actually received from the broker. There is always a variation in this due to the broker’s execution speed and market volatility.

Trading Range in AUD/CHF

Wanting to know how much profit one can make in a given time? If so, then you may find the answer in the table illustrated below. This table is the representation of the min, average, and max volatility of the currency pair in different timeframes. And with these values in the table, one can determine the profit on a trade.

Procedure to assess Pip Ranges

  1. Add the ATR indicator to your chart
  2. Set the period to 1
  3. Add a 200-period SMA to this indicator
  4. Shrink the chart so you can determine a significant period
  5. Select your desired timeframe
  6. Measure the floor level and set this value as the min
  7. Measure the level of the 200-period SMA and set this as the average
  8. Measure the peak levels and set this as Max.

AUD/CHF Cost as a Percent of the Trading Range

The cost as a percent of the trading range is determined in the following table using different volatilities, assuming that the trading range can be seen as the potential profit on a given timeframe. The percentages are obtained by finding the ratio between the total cost of the trade and the range values. These values, thus, help in assessing the right moments in the day to trade the currency pair.

ECN Model Account

Spread = 0.7 | Slippage = 2 |Trading fee = 1

Total cost = Slippage + Spread + Trading Fee = 2 + 0.7 + 1 = 3.7

STP Model Account

Spread = 1.7 | Slippage = 2 | Trading fee = 0

Total cost = Slippage + Spread + Trading Fee = 2 + 1.7 + 0 = 3.7

The Ideal way to trade the AUD/CHF

Firstly, the higher the value of the percentage, the higher is the cost of the trade. It is pretty evident from the above tables that the costs are higher in the min column and keep decreasing in the subsequent columns. Meaning, as the volatility increases, the total cost of the trade reduces. But, it is not ideal to trade in either of the extremes. To have an affordable cost and optimal volatility, it is best to enter during those times of the day when the pip movement for the pair is more or less equal to the average values.

Furthermore, the total cost can easily be reduced by trading using limit order instead of market orders. This methodology would bring down the slippage to zero. Hence, significantly affecting the percentage values. And an example of the same is depicted below.

Categories
Forex Assets

Understanding The AUD/CAD Forex Currency Pair

Introduction

AUDCAD is the abbreviation for the currency pair, the Australian dollar, and the Canadian dollar. It is a cross-currency pair. One can expect great volatility and liquidity in the market during the Australian session. AUD is the base currency, and CAD is the quote currency.

Understanding AUD/CAD

The value of AUDCAD is the number of Canadian dollars required to buy one Australian dollar. It is quoted as 1 AUD per X CAD. For example, if the value of this pair is 0.9013, then 0.9013 CAD is needed to purchase one AUD.

AUD/CAD Specification

Spread

Spread in trading is the difference between the bid price and the ask price set by the broker. This pip difference is how brokers generate revenue. The spread always varies from broker to broker and the type of account model.

ECN: 1 | STP: 1.9

Fees

Apart from spreads, brokers charge a few pips of fee or commission on each trade you take. This exists only ECN accounts, as a fee on STP accounts is nil.

Slippage

Due to the delay in the broker’s execution speed and volatility of the market, a trader doesn’t get the exact price he intended. This difference in prices is referred to as slippage. It typically varies from 0.5 pips to 5 pips.

Trading Range in AUD/CAD

The trading range is the representation of the minimum, average, and maximum volatility in the market in a given timeframe. This proves to be useful in determining the profit/loss that can be made in a specific amount of time. One can determine this simply by finding the product of the pip movement on the required timeframe and the pip value (mentioned in the specification table).

Procedure to assess Pip Ranges

  1. Add the ATR indicator to your chart
  2. Set the period to 1
  3. Add a 200-period SMA to this indicator
  4. Shrink the chart so you can assess a large time period
  5. Select your desired timeframe
  6. Measure the floor level and set this value as the min
  7. Measure the level of the 200-period SMA and set this as the average
  8. Measure the peak levels and set this as Max.

AUD/CAD Cost as a Percent of the Trading Range

The cost of trade is an essential point of consideration in trading. Cost is that factor that is not fixed and varies on different variables. For example, when the volatility changes, the costs change. The same is the case with timeframes as well. Below is a table that illustrates the variation in the costs on a trade for different timeframes and volatilities.

ECN Model Account

Spread = 1 | Slippage = 2 |Trading fee = 1

Total cost = Slippage + Spread + Trading Fee = 2 + 1 + 1 = 4

STP Model Account

Spread = 1.9 | Slippage = 2 | Trading fee = 0

Total cost = Slippage + Spread + Trading Fee = 2 + 1.9 + 0 = 3.9

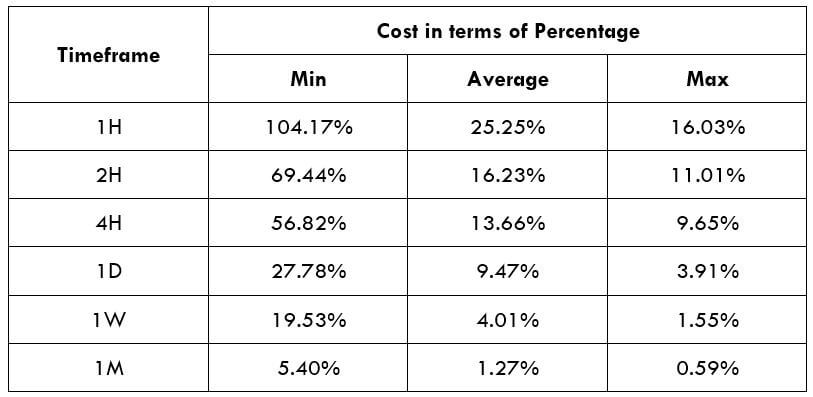
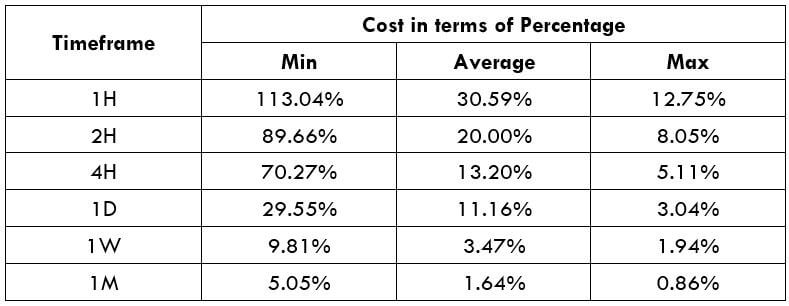
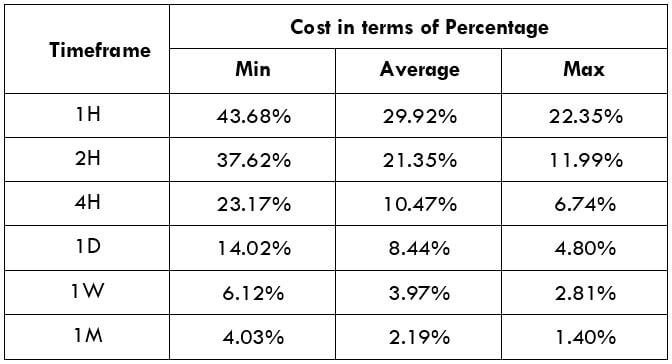
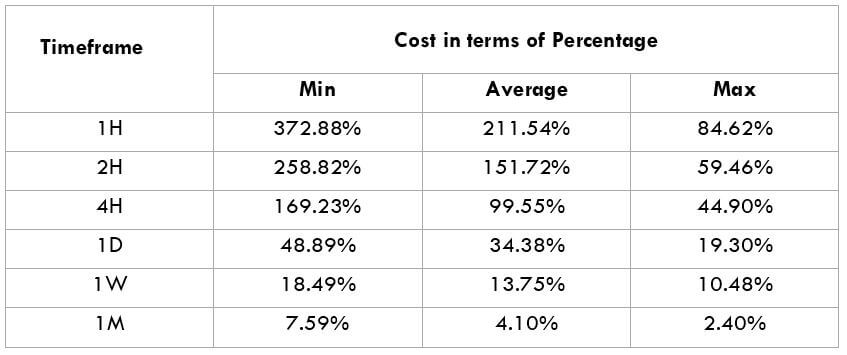
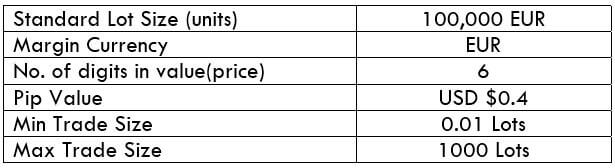
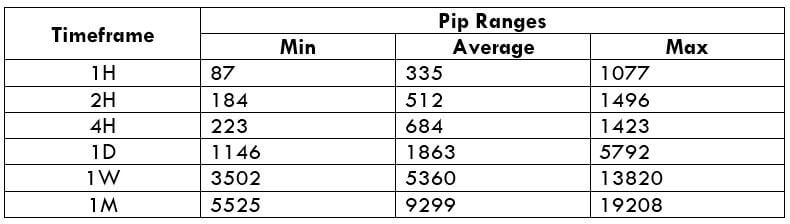
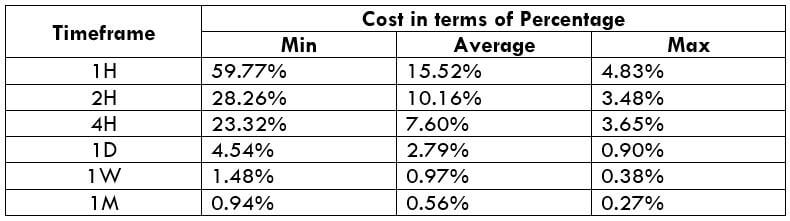
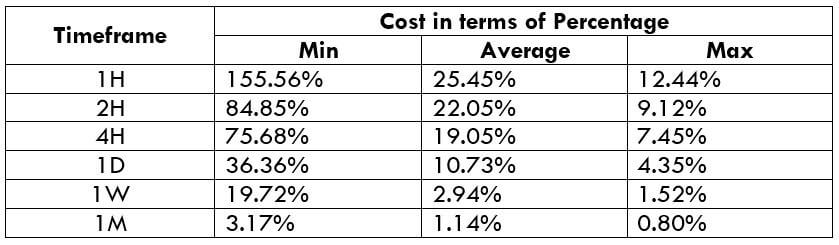
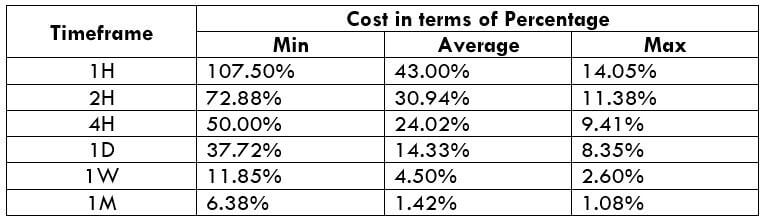
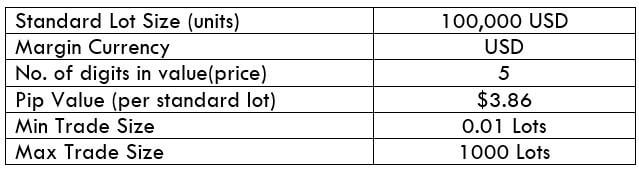
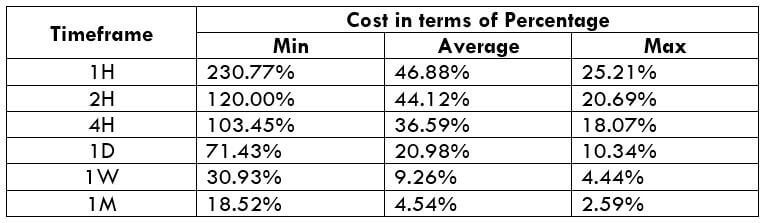
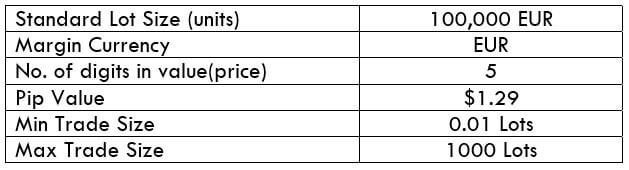
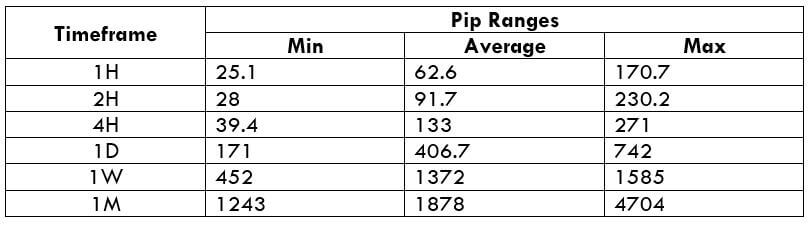
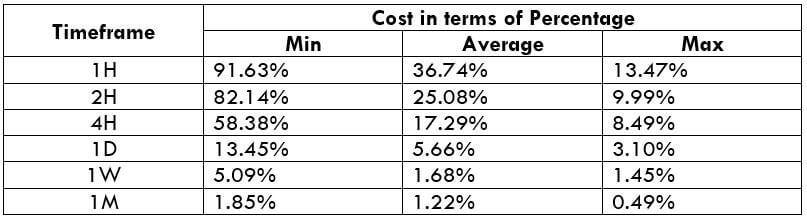
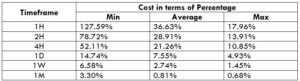
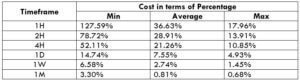
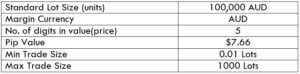
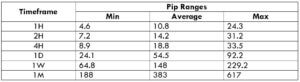
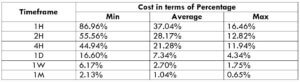
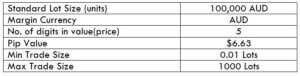
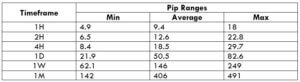
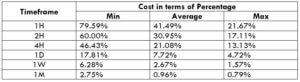
The Ideal way to trade the AUD/CAD

Comprehending the above tables is simple. The higher the magnitude of the costs, the higher is the total cost that has to be paid on a trade and vice versa. In the table, the percentages are on the higher side in the min column and lower in the max column. Hence, it can be concluded that the costs are higher when the volatility is low and vice versa. However, it isn’t ideal to trade in these situations. It is rather preferred to enter the market when the volatility is around the average values because the costs are affordable, and the volatility is as needed.

Moreover, it is recommended to design strategies such that limit orders are put to use. This shall completely eliminate the slippage on the trade. And with the elimination of slippage, the total cost would significantly reduce as well.

Categories
Forex Assets

AUD/NZD – Everything About This Forex Currency Pair

Introduction

AUD/NZD is derived from the full-form of the currency pair, the Australian dollar, and the New Zealand dollar. It comes under the classification of cross currency pairs. In this pair, AUD is the base currency, and NZD is the quote currency.

Understanding AUD/NZD

The value of AUD/NZD depicts the value of NZD that is equivalent to AUD. It is simply quoted as 1 AUD per X NZD. For example, if the current value of this pair is 1.0405, then these many New Zealand dollars are needed to purchase one Australian dollar.

AUD/NZD Specification

Spread

Spreads are a typical way through which brokers make money. The pip difference between the bid price and the ask price is their profit margin, which is referred to as the spread. It varies from the type of account model.

ECN: 0.9 | STP: 1.8

Fees

The fee is basically the commission on a trade levied by the broker on each trade. Again, it varies from the type of account model.

Fee on STP = 0

Fee on ECN = 6 to 10 pips (starts from as low as one pip)

Slippage

The slippage is the difference between the broker’s executed price and the trader’s execution price. There is this variation as the order is executed using market execution. There are two reasons for slippage to take place.

  • Broker’s execution speed
  • Market’s volatility

Trading Range in AUD/NZD

Assessing the profit/risk is a great add-on to one’s trading analysis. With this, the trader can know how long he must before his trade performs. And below is the table that enables the analysis of it.

Procedure to assess Pip Ranges

  1. Add the ATR indicator to your chart
  2. Set the period to 1
  3. Add a 200-period SMA to this indicator
  4. Shrink the chart so you can assess a large time period
  5. Select your desired timeframe
  6. Measure the floor level and set this value as the min
  7. Measure the level of the 200-period SMA and set this as the average
  8. Measure the peak levels and set this as Max.

AUD/NZD Cost as a Percent of the Trading Range

This is one great application of the above table. By combining these values with the total cost of trade, one can determine variations in the costs by varying the parameters like volatility and timeframe.

ECN Model Account

Spread = 0.9 | Slippage = 2 |Trading fee = 1

Total cost = Slippage + Spread + Trading Fee = 2 + 0.9 + 1 = 3.9

STP Model Account

Spread = 1.8 | Slippage = 2 | Trading fee = 0

Total cost = Slippage + Spread + Trading Fee = 2 + 1.8 + 0 = 3.8

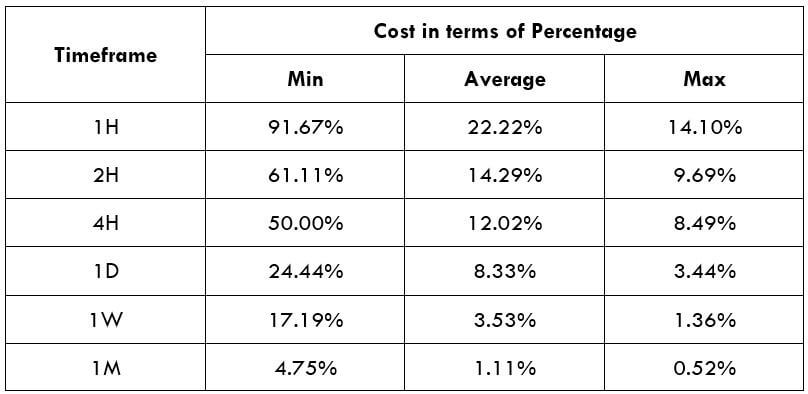
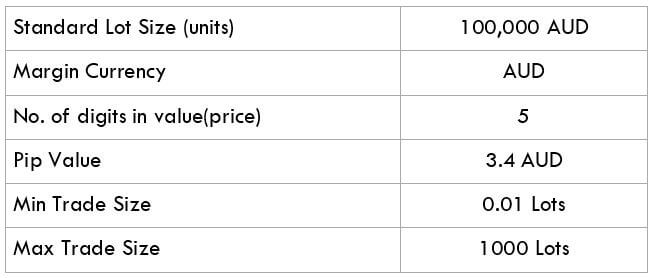
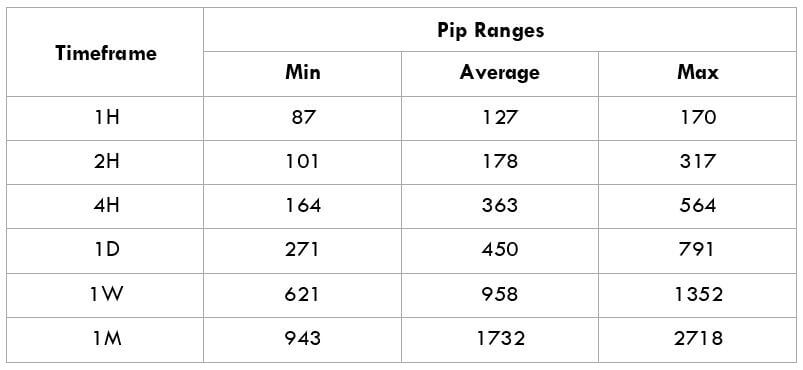
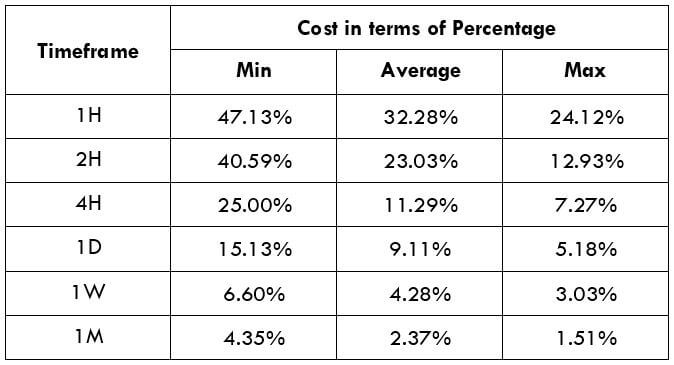
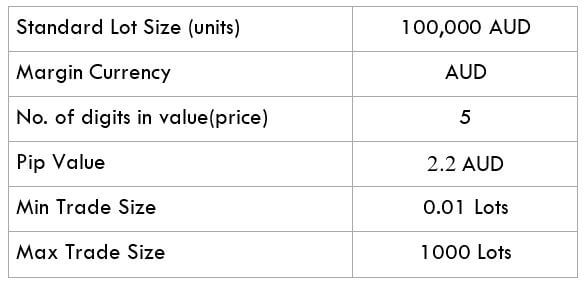
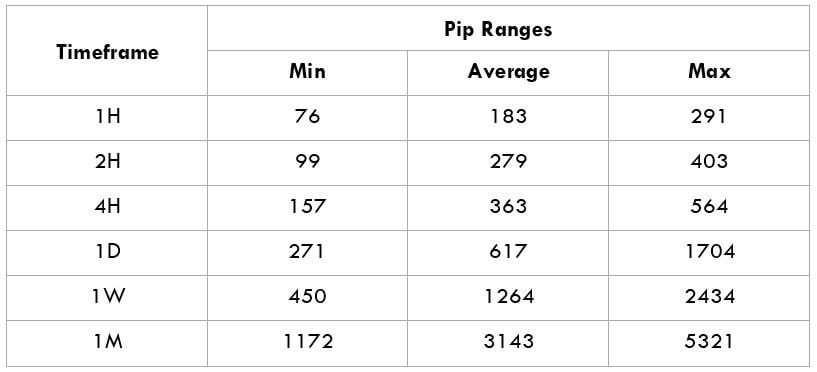
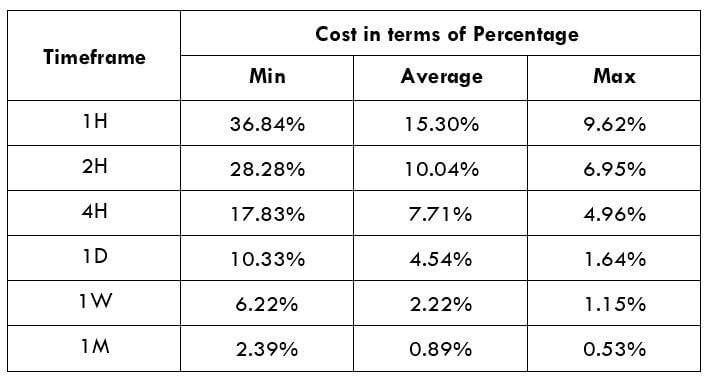
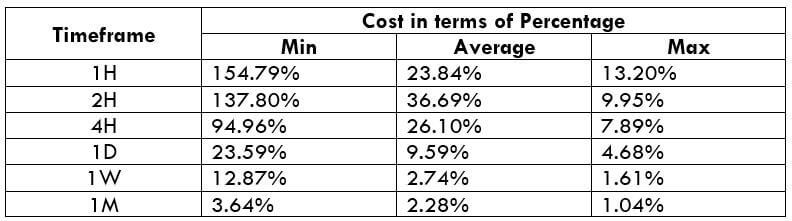
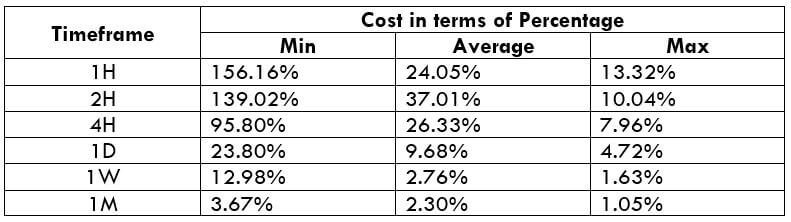
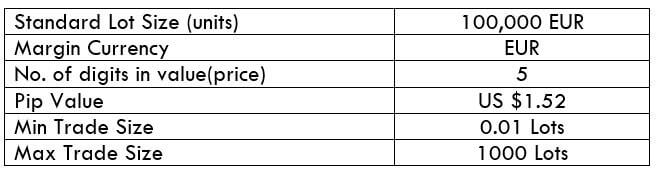
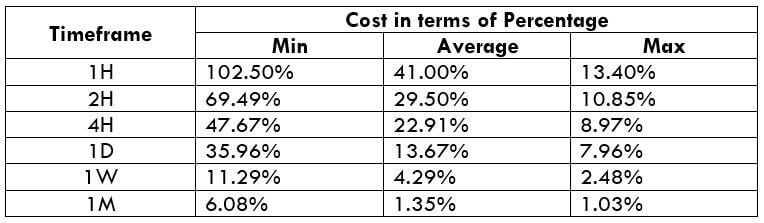
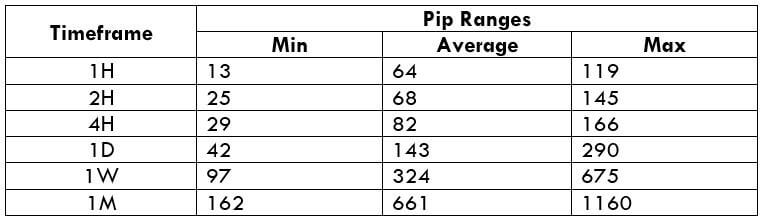
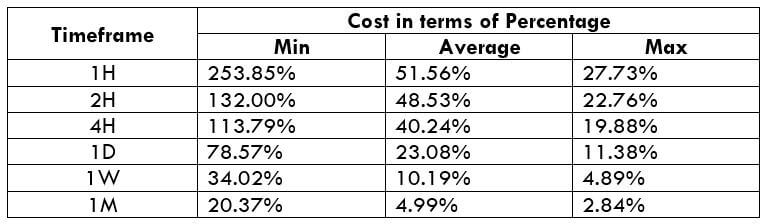
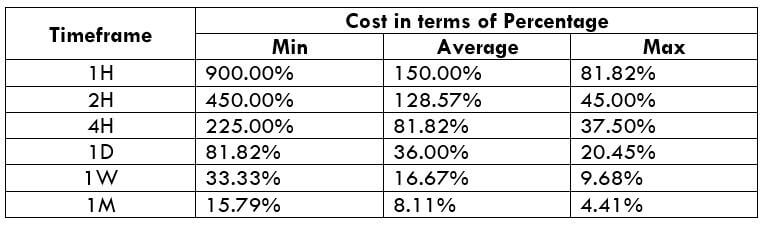
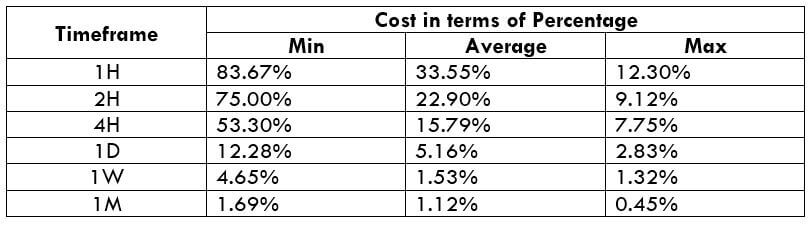
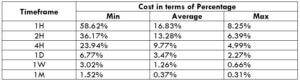
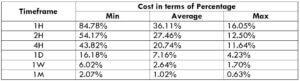
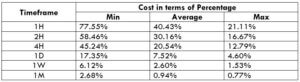
The Ideal way to trade the AUD/NZD

Before getting into finding the best way to trade this pair, let us comprehend what the above table has got to say.

The higher the magnitude of the percentages, the higher is the cost on the trade for that particular volatility and timeframe. The min column represents low volatility, and the max column represents high volatility.

It can clearly be ascertained from the table that the percentages are comparatively higher on the min column and lower on the max column. This means that the costs are high when volatility is low and vice versa.

But, it is not ideal to trade in neither of the two situations mentioned below.

When the volatility is high -> because of the risk involved
When the volatility is low -> because the costs are high

Now, to maintain a balance between all the parameters, it is best to trade when the pip movement is around the average values.

Furthermore, another simple way to reduce cost is by trading using a pending/limit order instead of market orders, as it will nullify the slippage on the trade. And this, in turn, will reduce the total cost of the trade as well.

Categories
Forex Assets

What Should You Know Before Trading The NZD/JPY Currency Pair

Introduction

NZDJPY, or the NZD/JPY or the New Zealand dollar against the Japanese yen, is a cross-currency pair in the Forex market. The left currency (NZD) represents the base currency, and the one the right (JPY) represents the quote currency.

Understanding NZD/JPY

The market value of NZDJPY is a value of JPY that is required to buy one NZD. It is quoted as 1 NZD per X JPY. For example, if the CMP (current market price) of NZDJPY is 72.657, then it takes 72.657 yen to buy one New Zealand dollar.

NZD/JPY Specification

Spread

Spread is the difference between the bid price and the ask price controlled by the broker. It varies across brokers and their type of execution.

ECN: 0.8 | STP: 1.7

Fees

On every trade a trader takes, there are few pips of fee on it. And this is only on ECN accounts because the fee on STP accounts is nil.

Slippage

Slippage, which happens on market orders, is the difference between the price asked by the client and the price he actually received. There are two primary reasons for it, namely, the broker’s execution speed and the change in volatility of the market.

Trading Range in NZD/JPY

The average, minimum, and maximum pip movement is determined in the trading range table. This comprehensive table helps traders assess the profit they can generate and loss they can incur in a given timeframe. Moreover, this table is helpful in analyzing the cost variation in a trade, which shall be discussed in the next section.

Procedure to assess Pip Ranges

  1. Add the ATR indicator to your chart
  2. Set the period to 1
  3. Add a 200-period SMA to this indicator
  4. Shrink the chart so you can assess a large time period
  5. Select your desired timeframe
  6. Measure the floor level and set this value as the min
  7. Measure the level of the 200-period SMA and set this as the average
  8. Measure the peak levels and set this as Max.

NZD/JPY Cost as a Percent of the Trading Range

The cost of a trade is not the same throughout the trading day. It varies based on the volatility of the market. Hence, it is necessary to know during what times the cost is high and what times it is low. This could be found out from the table illustrated below.

ECN Model Account 

Spread = 0.8 | Slippage = 2 |Trading fee = 1

Total cost = Slippage + Spread + Trading Fee = 2 + 0.8 + 1 = 3.8

STP Model Account

Spread = 1.7 | Slippage = 2 | Trading fee = 0

Total cost = Slippage + Spread + Trading Fee = 2 + 1.7 + 0 = 3.7

The Ideal way to trade the NZD/JPY

The magnitude of the cost percentage is directly proportional to the cost of a trade. So, the higher the value of the percentage, the higher is the cost of a trade. From the table, it can be observed that the cost is highest in the min column compared to the other two columns. This means that the costs are highest when the volatility of the market is low and vice versa, irrespective of the timeframe you’re trading. It is neither ideal to trade when the volatility of the market is high, nor when the costs are high. The average column is on the one we focus on. Trading when the volatility is at the average value is when you can expect moderate volatility and decent costs.

Also, you may reduce your costs by trading using limit or pending orders instead of market orders. This will bring the slippage to ground zero. This, in turn, will reduce the total cost of the trade as well. An example of the same is illustrated below.

Spread = 1.7 | Slippage = 0 | Trading fee = 0

Total cost = Slippage + Spread + Trading Fee = 0 + 1.7 + 0 = 1.7

Hence, it is seen that the costs have reduced by around 50% of the previous value.

Categories
Forex Assets

Understanding The Basics Of NZD/CHF Forex Pair

Introduction

NZDCHF is a cross-currency pair in the Forex market. It is an abbreviation for the New Zealand dollar and the Swiss franc. Here, NZD is the base currency, and CHF is the quote currency.

Understanding NZD/CHF

The value of NZDCHF simply represents the units of CHF equivalent to one unit of NZD. It is quoted as 1 NZD per X CHF. For example, in the market, if the price of NZDCHF is 0.64535, then it requires those many units of CHF to buy one NZD.

NZD/CHF Specification

Spread

The bid price and ask price in the market is typically not the same. The difference between these two prices is referred to as the spread. And this difference amount is used by the broker. It varies from the type of account model.

ECN: 1.1 | STP: 1.9

Fees

The fee is basically the commission that has to be paid on each trade you take. It varies from broker to broker and their execution type. Typically, there is no fee on STP accounts, but a few pips on ECN accounts.

Slippage

Another type of fee traders have to bear is the slippage. It is the difference between the trader’s requested price and the broker’s executed price. Slippage always is changing due to the ups and downs in market volatility and the broker’s execution speed.

Trading Range in NZD/CHF

Many novice traders randomly take trades without determining the amount they’re going to risk. The trading range is that representation, which indirectly illustrates the risk and profit area in a trade, in a given time frame. For example, if the average pip movement on NZDCAD on the 4H timeframe is 20 pips, then the trader will be risking $205.4 in an hour on an average.

Procedure to assess Pip Ranges

  1. Add the ATR indicator to your chart
  2. Set the period to 1
  3. Add a 200-period SMA to this indicator
  4. Shrink the chart so you can assess a large time period
  5. Select your desired timeframe
  6. Measure the floor level and set this value as the min
  7. Measure the level of the 200-period SMA and set this as the average
  8. Measure the peak levels and set this as Max.

NZD/CHF Cost as a Percent of the Trading Range

Apart from knowing the profit/loss that can be made from a trade in a given time, it is also necessary to know the cost variation in different volatilities and timeframes. Below is a table representing the cost as a percentage that is obtained by considering the volatility, timeframe, and the total cost on a trade.

ECN Model Account 

Spread = 1.1 | Slippage = 2 |Trading fee = 1

Total cost = Slippage + Spread + Trading Fee = 2 + 1.1 + 1 = 4.1

STP Model Account

Spread = 1.9 | Slippage = 2 | Trading fee = 0

Total cost = Slippage + Spread + Trading Fee = 2 + 1.9 + 0 = 3.9

The Ideal way to trade the NZD/CHF

Trading on any timeframe and during any volatility is not an efficient way of trading. There are specific times in the market when you must enter/exit. This can be determined from the above two tables. Firstly, the higher the magnitude of the percentage, the higher is the cost of a trade for that particular timeframe and volatility. It can be ascertained from the table that the costs are low for high volatilities and high for low volatilities. And neither of the two states is ideal to trade. To keep your cost affordable and volatility moderate, it is ideal to trade when the volatility is nearby the average values.

Furthermore, it is recommended to have strategies that enable the use of limit orders. Because trading with limit orders will completely cut off the slippage on the trade Nullifying it, the total cost will significantly reduce, which, in turn, will reduce the cost percentage as well. For example, it was observed that cost percentages were reduced by about 50% when the slippage was removed.

Categories
Forex Assets

What Should You Know Before Trading The NZD/CAD Currency Pair

Introduction

NZDCAD is the abbreviation for the currency pair New Zealand dollar against the Canadian dollar. It is referred to as a cross-currency pair. Here, NZD is the base currency, and CAD is the quote currency. In this article, we shall be going over everything you need to know about this currency. Firstly, let’s get started by understanding what the value of NZDCAD depicts.

Understanding NZD/CAD

Comprehending the value of a currency pair is simple. The value of NZDCAD determines the Canadian dollars that must be paid to buy one New Zealand dollar. It quoted as 1 NZD per X CAD. For example, if the current value of NZDCAD is 0.86595, then 0.86595 CAD is required to purchase one NZD.

NZD/CAD Specification

Spread

Spread is the primary way through which brokers make revenue. They have a different price for buying and selling. The difference between these prices is called the spread. It varies from broker to broker and their execution type.

ECN: 1 | STP: 1.8

Fees

For every execution, there is a fee levied by the broker. This fee is also referred to as the commission on a trade. It is nil on STP accounts. And on ECN accounts, it is usually within 6 to 10 pips.

Slippage

Slippage is the variation in the price executed by you and the price you actually received. It happens on market orders. Slippage depends on two factors:

  • The volatility of the market
  • Broker’s execution speed

Trading Range in NZD/CAD

The trading range is a tabular representation of the pip movement in a currency pair in various timeframes. These values help in assessing the risk-on trade as it determines the minimum, average, and maximum profit that can be made on a trade.

Procedure to assess Pip Ranges

  1. Add the ATR indicator to your chart
  2. Set the period to 1
  3. Add a 200-period SMA to this indicator
  4. Shrink the chart so you can assess a large time period
  5. Select your desired timeframe
  6. Measure the floor level and set this value as the min
  7. Measure the level of the 200-period SMA and set this as the average
  8. Measure the peak levels and set this as Max.

NZD/CAD Cost as a Percent of the Trading Range

Cost a percentage of the trading range is an excellent application of the above table. By manipulating the values with the total cost, the variations in costs in different at different volatilities and timeframes can be calculated. For this, the ratio between the total cost and pip movement is found out and represented in percentage.

ECN Model Account 

Spread = 1 | Slippage = 2 |Trading fee = 1

Total cost = Slippage + Spread + Trading Fee = 2 + 1 + 1 = 4

STP Model Account

Spread = 1.8 | Slippage = 2 | Trading fee = 0

Total cost = Slippage + Spread + Trading Fee = 2 + 1.8 + 0 = 3.8

Comprehending the above tables

There are two variables here, namely, timeframe and volatility. By varying these two, the variation in the total cost is examined. Note that the higher the percentage, the higher is the cost on a trade and vice versa. From this, we can make out that the prices are high when the volatility is low. And prices are low when volatility is high. Also, as the timeframe widens, the cost decreases.

The Ideal way to trade the NZD/CAD

It is not ideal to trade when the volatility is high, as it is risky. It is also not the best choice to trade when the volatility is low, as the costs are high. So, to keep a balance between both volatility and cost, it is ideal to trade when the pip movement of the pair is around the average values.

Talking about timeframes, trading the 4H or the Daily would be great, as the cost is bearable, and the trade wouldn’t take too long to perform as well.

Another simple hack to reduce cost is by trading using limit/pending orders instead of market orders. This will significantly reduce costs on a trade because the slippage on the trade becomes 0. It is observed that the cost reduces by about 50% of the original value. Below is a table representing the cost percentage when the slippage is made zero.