General Overview
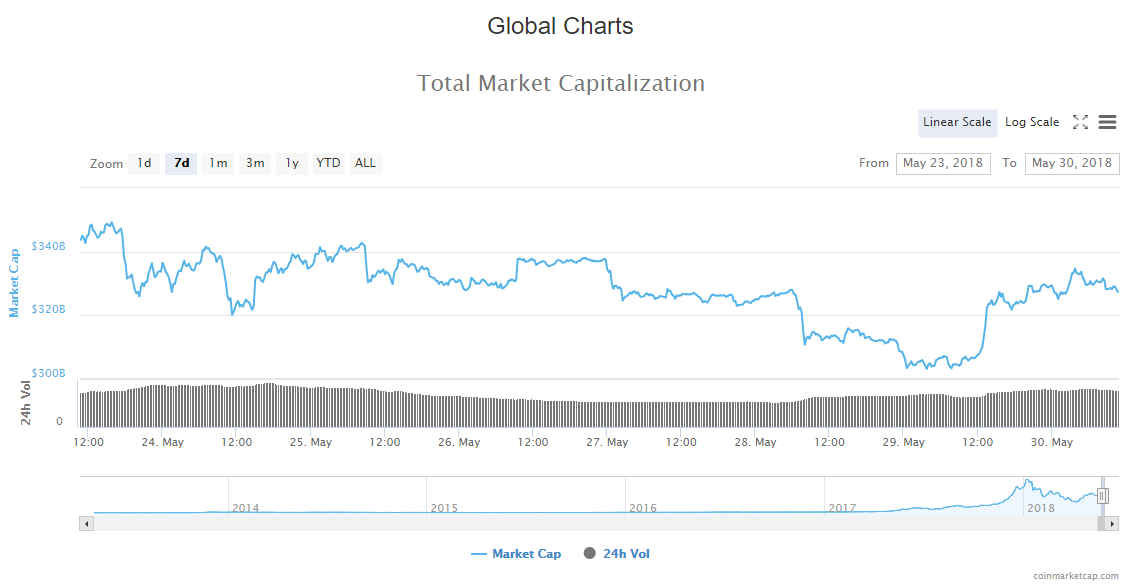
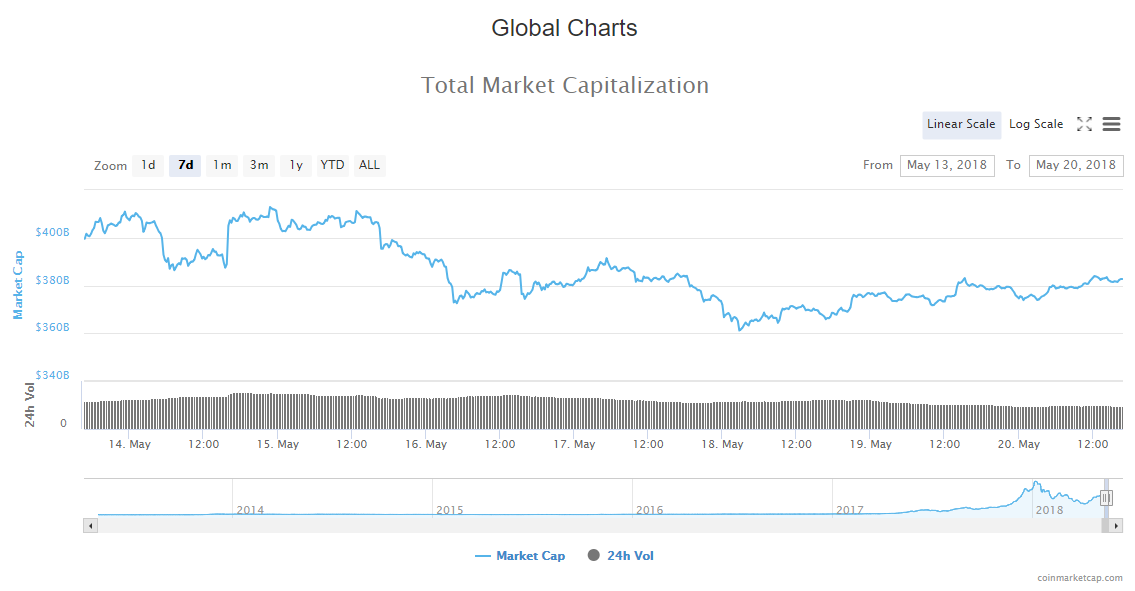
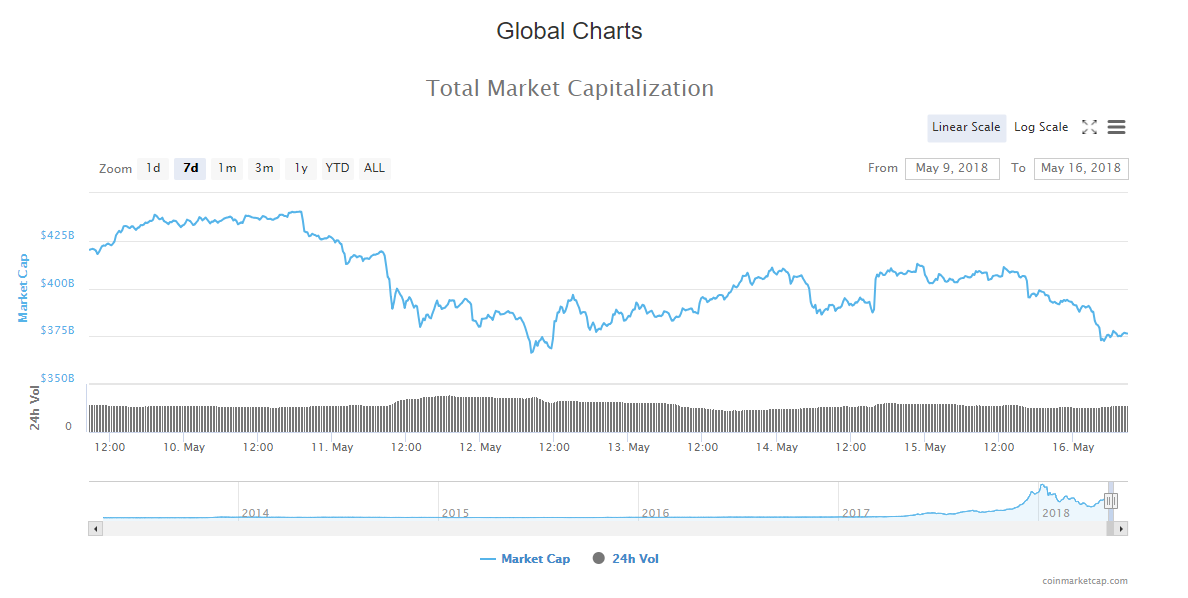
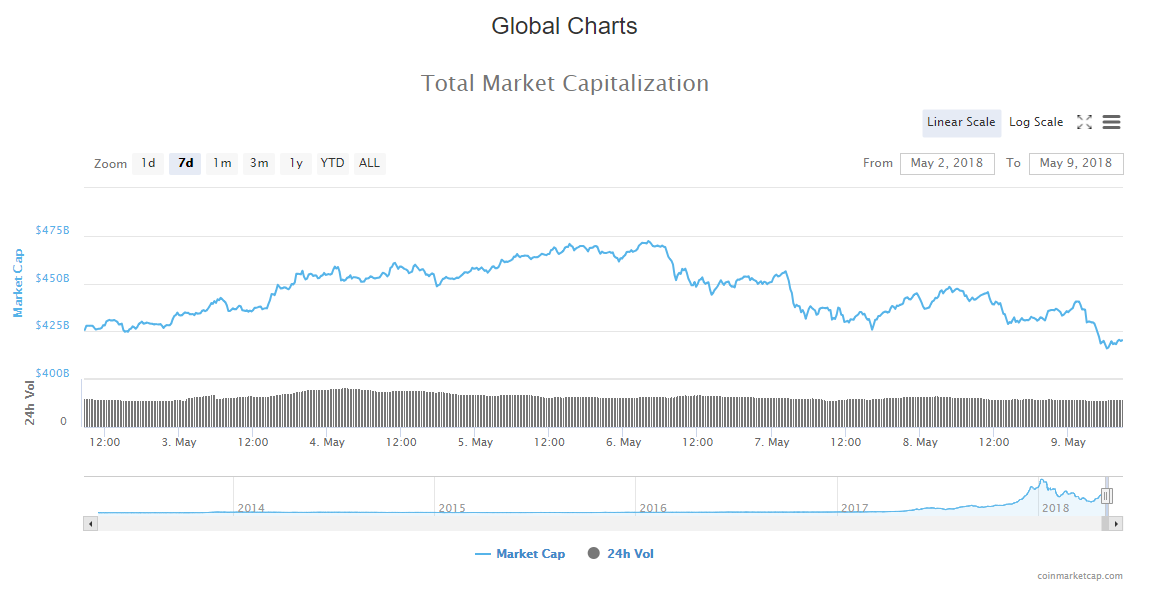
Market Cap: $343,665,292,792
24h Vol: $15,166,854,450
BTC Dominance: 37.9%
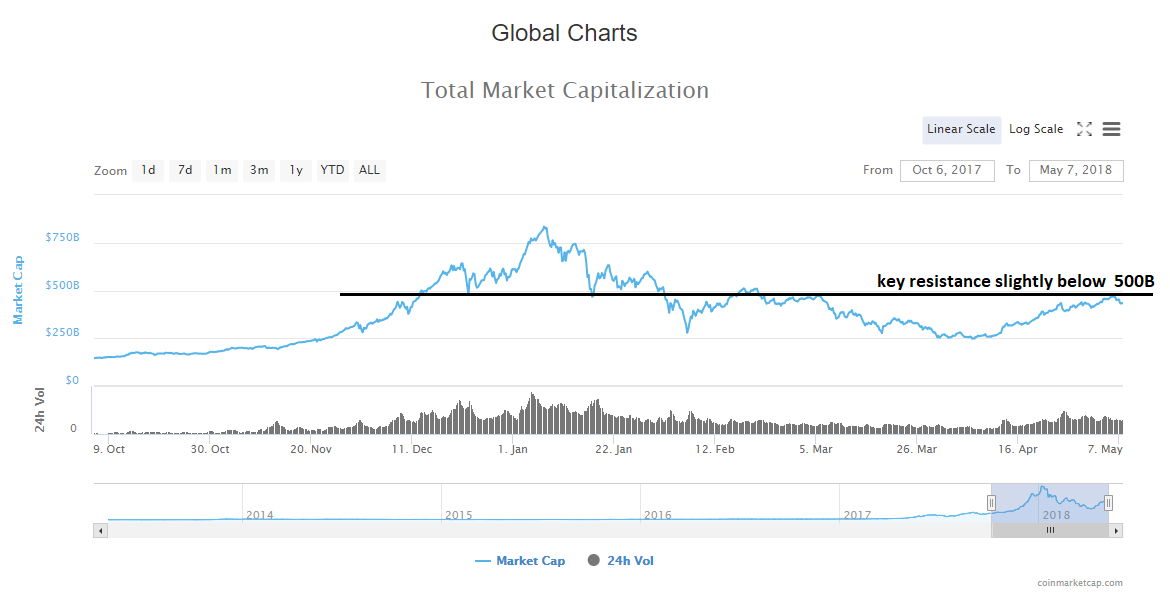
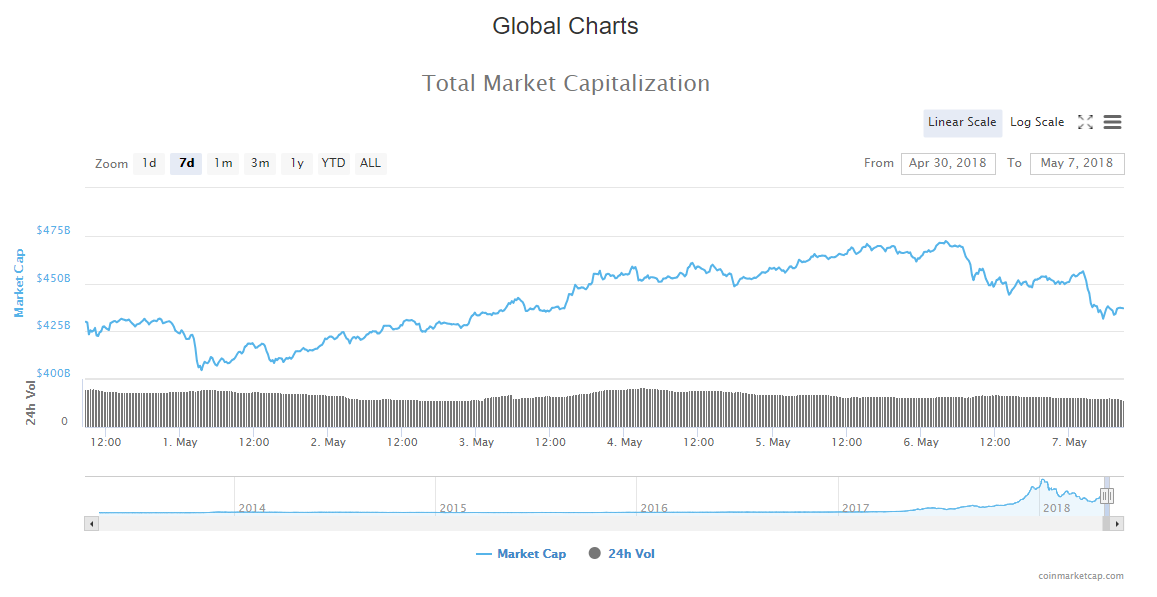
From yesterday’s open at $341B, the crypto market cap fell to 330,636,000,000$ to yesterday’s low from where the evaluation has been rising. It had experienced an overall increase of 3 million dollars.
 The market is dominantly in green with an average increase of 2% amongst the top 100 coins. Biggest gainers are Nexus by 15%, Binance coin 12.54%, and the biggest loser is Huobi Token who dropped by 11% today.
News
Overall, news that came out in the last 24 hours is mostly positive, however, there are some significant negative items. Out of those that are positive, we can put them into two categories – blockchain tech adoption and positive relation to cryptocurrencies.
Regarding blockchain adoption these are the stories that stand out:
Samsung SDS is launching its own blockchain platform called “Nexfinance”, according to the official press release.
Nexfinance is a digital banking platform, applying artificial intelligence, blockchains, big data analytics and advanced IT technologies, such as intelligent process automation (IPA).
U.S. government telecoms agency seeks feedback on blockchain technology for its international agenda
In an announcement, the National Telecommunications and Information Administration (NTIA), which is part of the U.S. Department of Commerce, said that it wanted stakeholders’ input in “shaping its international agenda.”
As the tech evolves and is showing the benefits, many are jumping aboard to seize the opportunity and have the first mover advantage. There are two major news items regarding banks utilisation of the tech as well, as the traditional finance industry fear its decentralised competition.
South Africa’s Central Bank Pilots Tokenised Fiat Interbank Payment System
South Africa’s Central Bank (SARB) has successfully piloted a Proof-of-Concept (PoC) for an interbank payment system that tokenises fiat using Quorum, according to an SARB press release published June 5th. Quorum is an Ethereum-based private blockchain.
Chinese Central Bank Develops Blockchain System to Digitise Paper Checks (Cheques)
The People’s Bank of China (PBoC) has revealed a blockchain-powered system to digitise paper checks (cheques), local media Financial News reports June 5. The system aims combat financial fraud as well as reduce expenses for printing them.
Even though what was previously stated is evident, representatives from multiple central banks discussed in Amsterdam on Money20/20 conference whether or not cryptocurrency are posing a threat to the fiat system.
During a panel talk titled “Cryptocurrency, the Central (Bank) Question”, representatives from the Swiss National Bank, the Bank of Lithuania, the Bank of England, and the Bank of Canada took turns responding to the question “Can cryptocurrencies spell the end of fiat currencies?”.
Source: cointelegraph.com
They have concluded that cryptos are not yet a threat to the fiat system, as long as central banks are doing a good job. As a matter of fact, central banks are doing a fantastic job, but for themselves – which is why Bitcoin was invented in the first place.

As the dollar devaluates throughout the years, through fractional reserve banking and insane money printing, the purchasing power diminishes and national debt is rising insanely. A Keynesian economic model proves it to be unsustainable which is why people are looking for better alternatives. That’s why people are enthusiastic about cryptocurrencies.
Adena Friedman, president, and CEO of Nasdaq Inc,. recognizes this trend as he stated in an interview on Bloomberg Businessweek on June 5., that cryptocurrencies are at “the height of a hype cycle” and can become a “financial element of the Internet.”
On the other side, some like Jim Chanos, hedge fund manager, who said last year, that he “didn’t understand” Bitcoin or blockchain technology, now said speaking at Institute for New Economic Thinking that:
“This is simply a security speculation game masquerading as a technological breakthrough in monetary policy.”
According to him, in the event of a global crisis, it would be “better” to own food or a government-backed (fiat) currency.
Even though cryptos are “not there yet” would it really be better to hold fiat currency in a global crisis that was probably induced by those same central banks?
Analysis
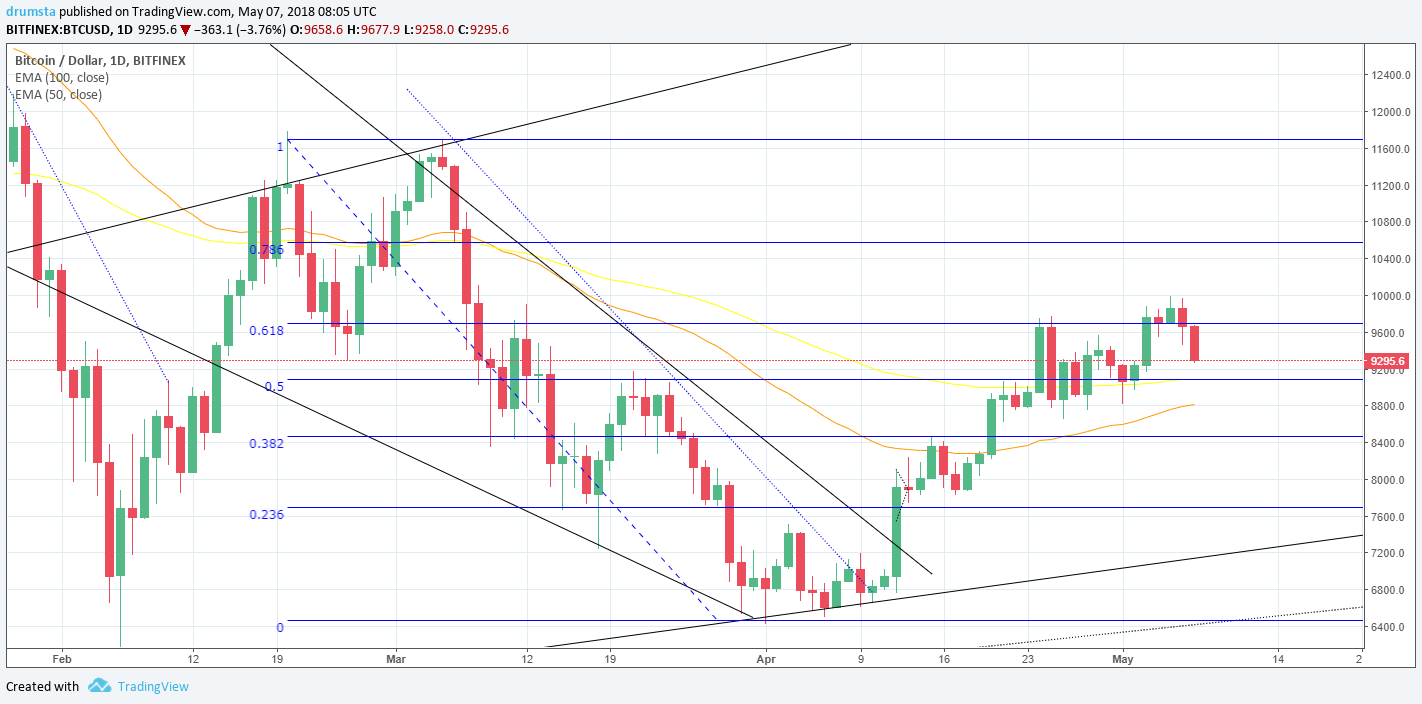
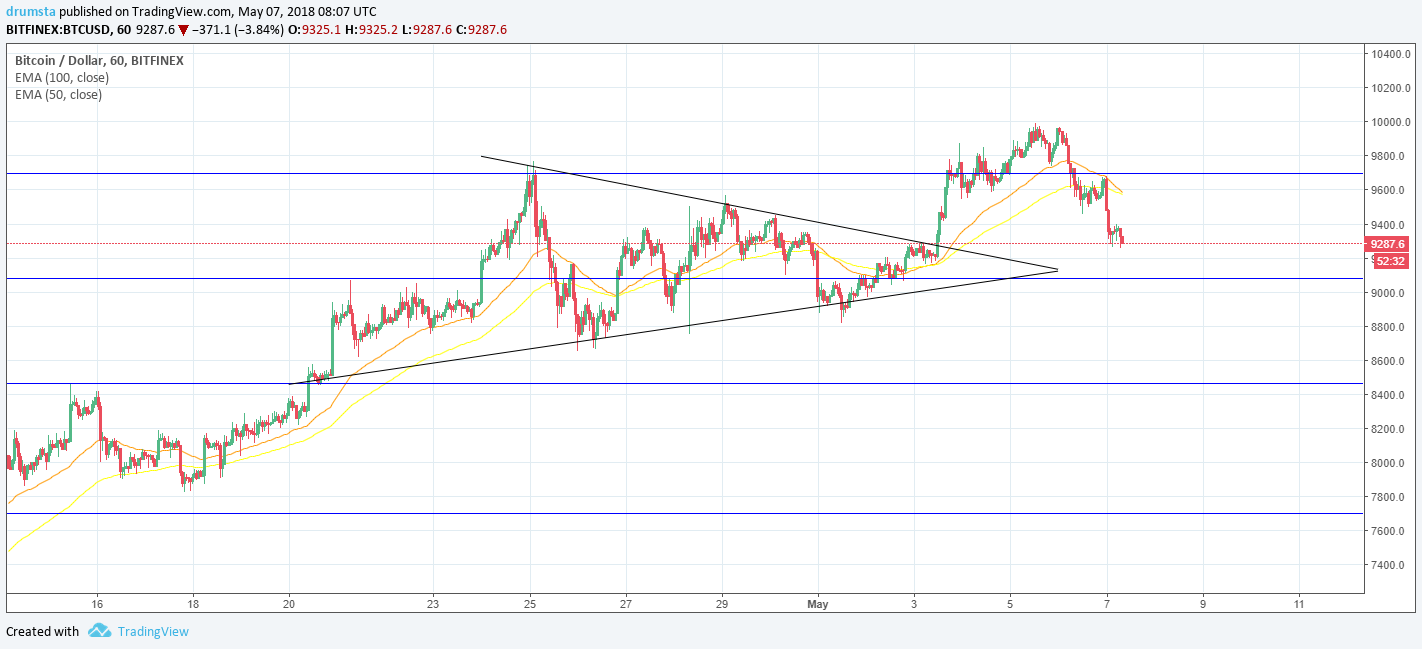
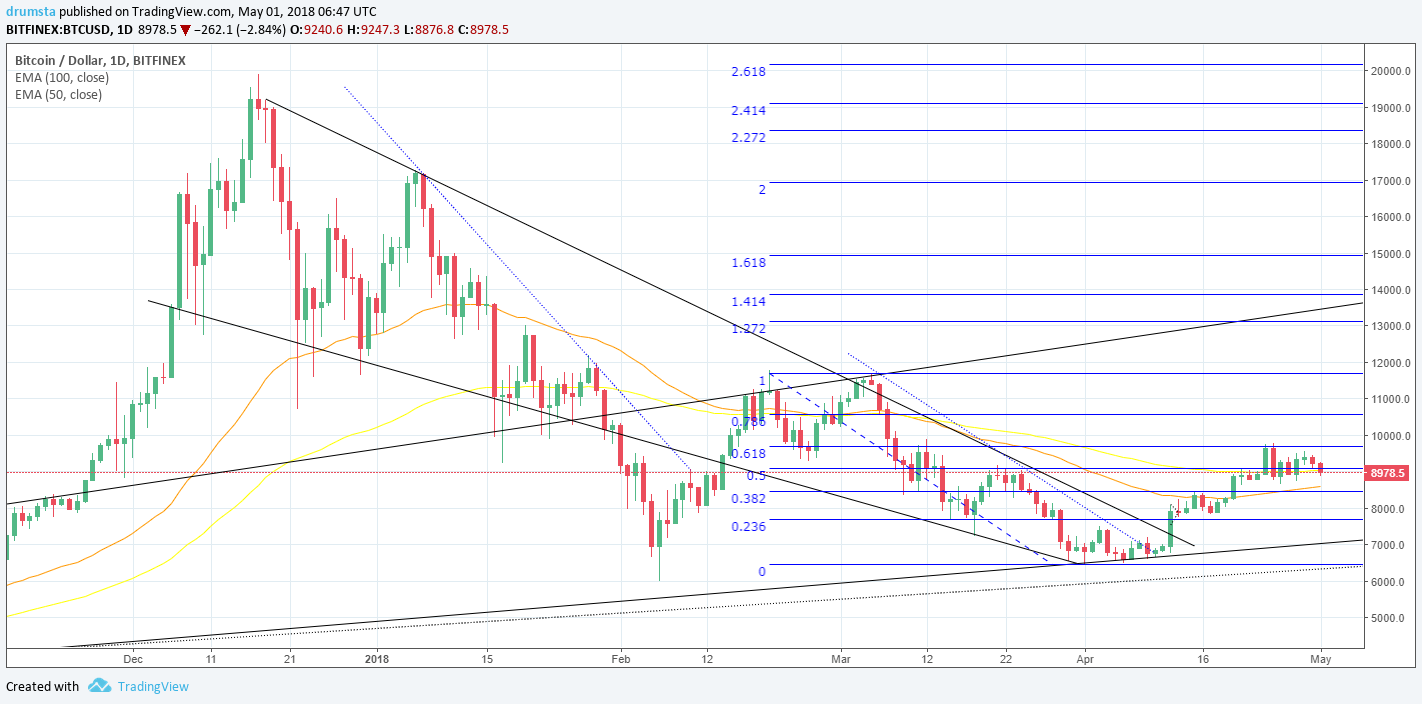
BTC/USD
From yesterday’s open at 7471$ the price of Bitcoin has increased by 1.65%, coming to 7595$ where it is currently sitting.
Looking at the hourly chart we can see that the price is yet again below the support baseline and form a cluster but this time there’s now higher high which is the sign of weakness. I am expecting the price to drop from here like it did three times previously, and the first support would be at yesterday’s open of 7470$ levels.
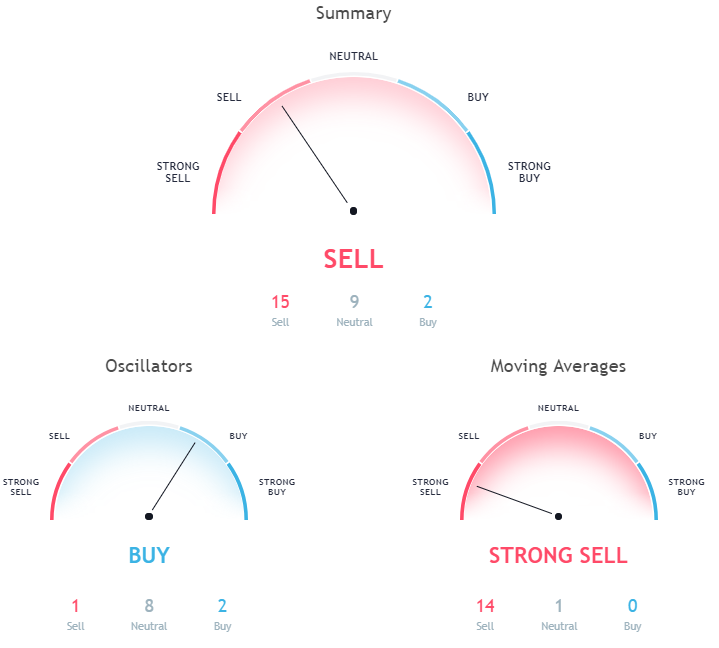
Market sentiment
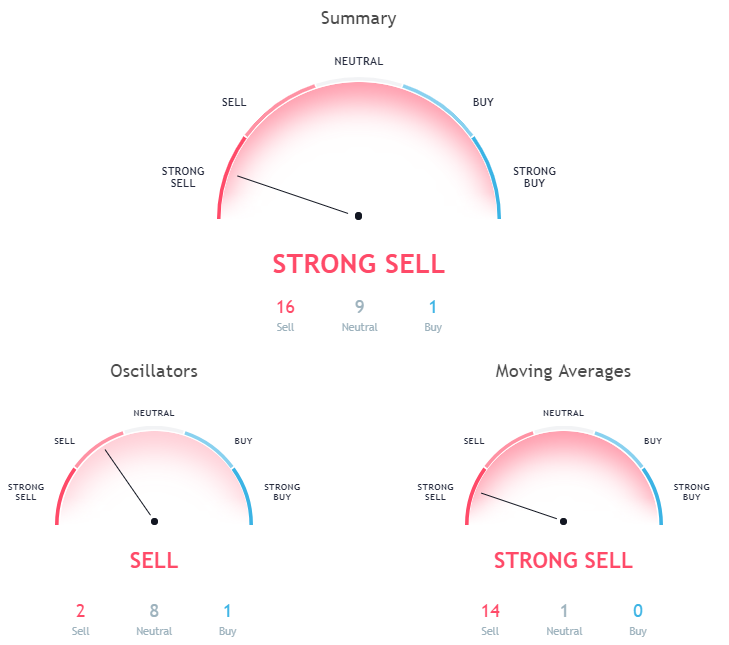
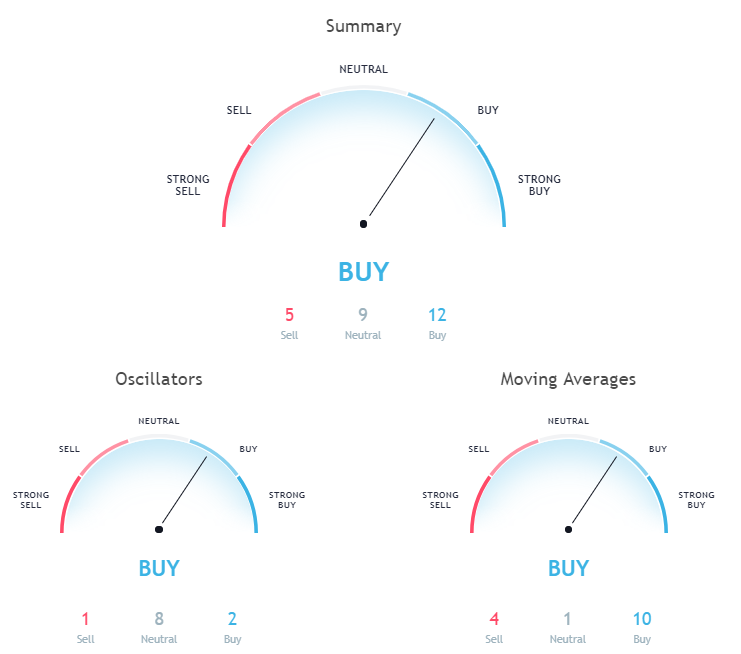
Hourly chart technicals are on buy, but it looks more like neutral as we have 8 indicators signalling a buy, 9 are neutral, and 9 sell.
Pivot points
S3 6950.3
S2 7253.3
S1 7437.6
P 7556.3
R1 7740.6
R2 7859.3
R3 8162.3
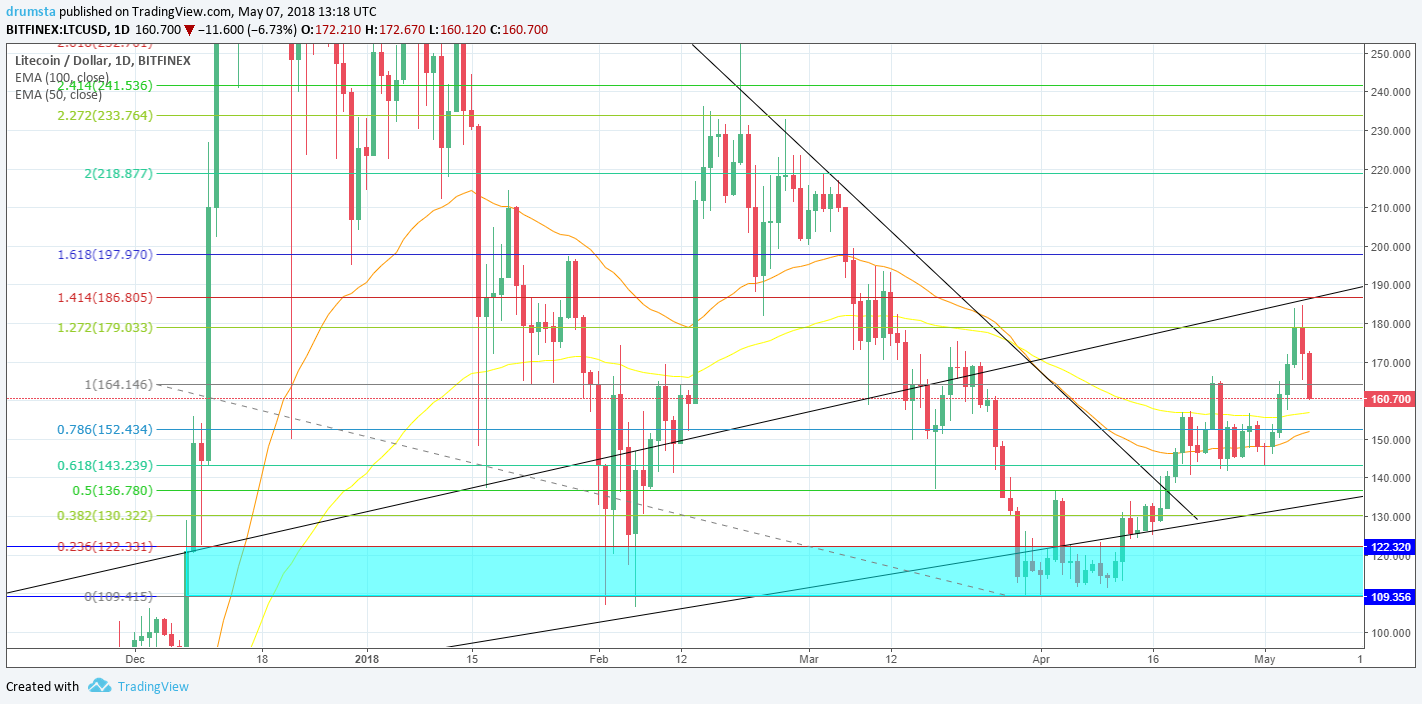
LTC/USD
From yesterday’s low at 116.115$ the price of Litecoin has increased by 4.16% coming to 121.140$ where it is currently.
Looking at the hourly chart we can see that the price is still in the retracement zone, and currently in a triangle which can be interpreted as a bull flag. If the price breaks out from above, I would expect to see the interaction with the retracement zone resistance at 124,7$, but from the degrees of the triangles trendlines, we can see that sellers are more aggressive and that the price is likely heading down afterwards.
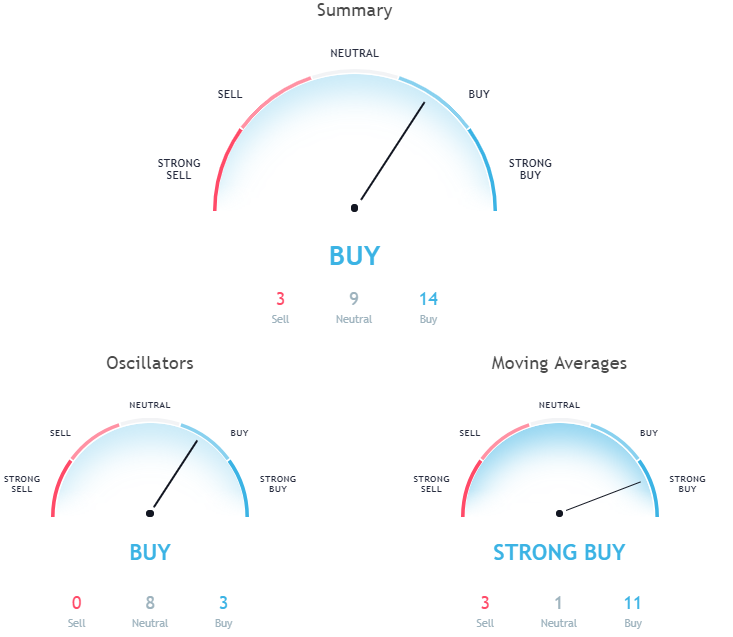
Market sentiment
Litecoin is in the buy zone, as indicated from hourly chart technicals.
Oscillators are on sell (8), and moving averages are signalling a buy (9).
Pivot points
S3 105.807
S2 113.097
S1 117.743
P 120.387
R1 125.033
R2 127.677
R3 134.967
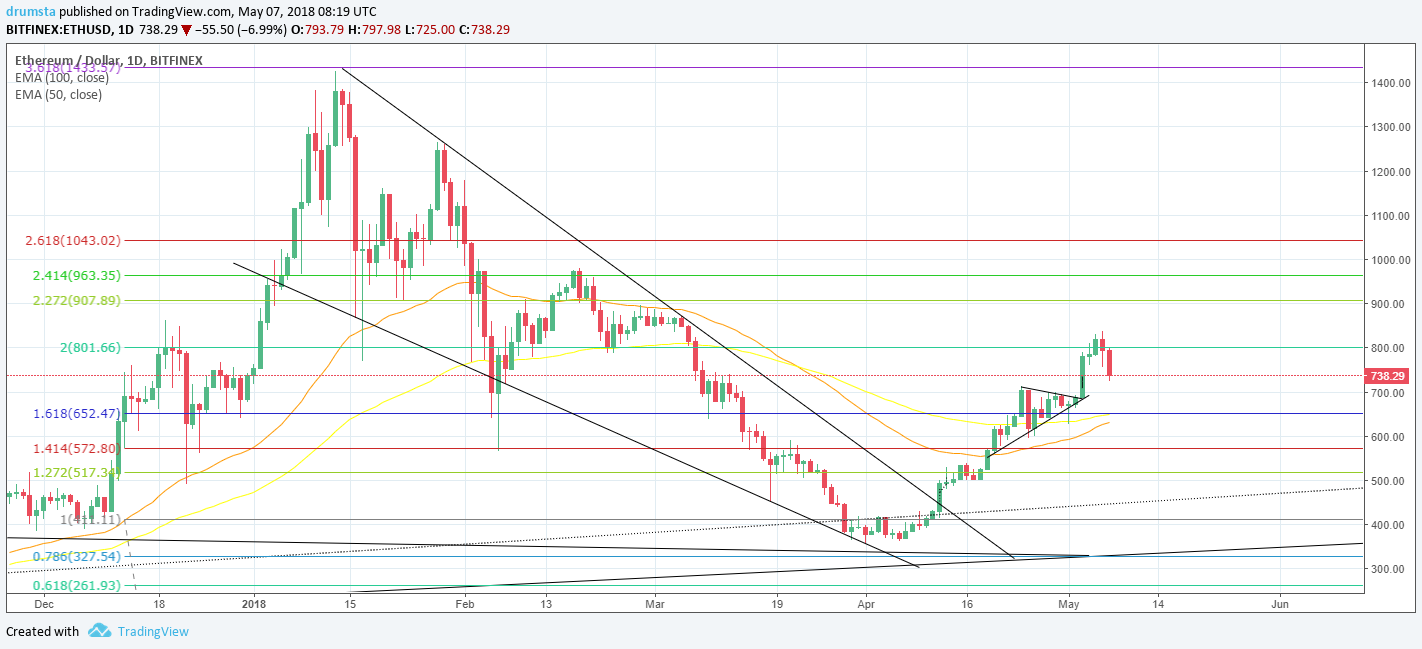
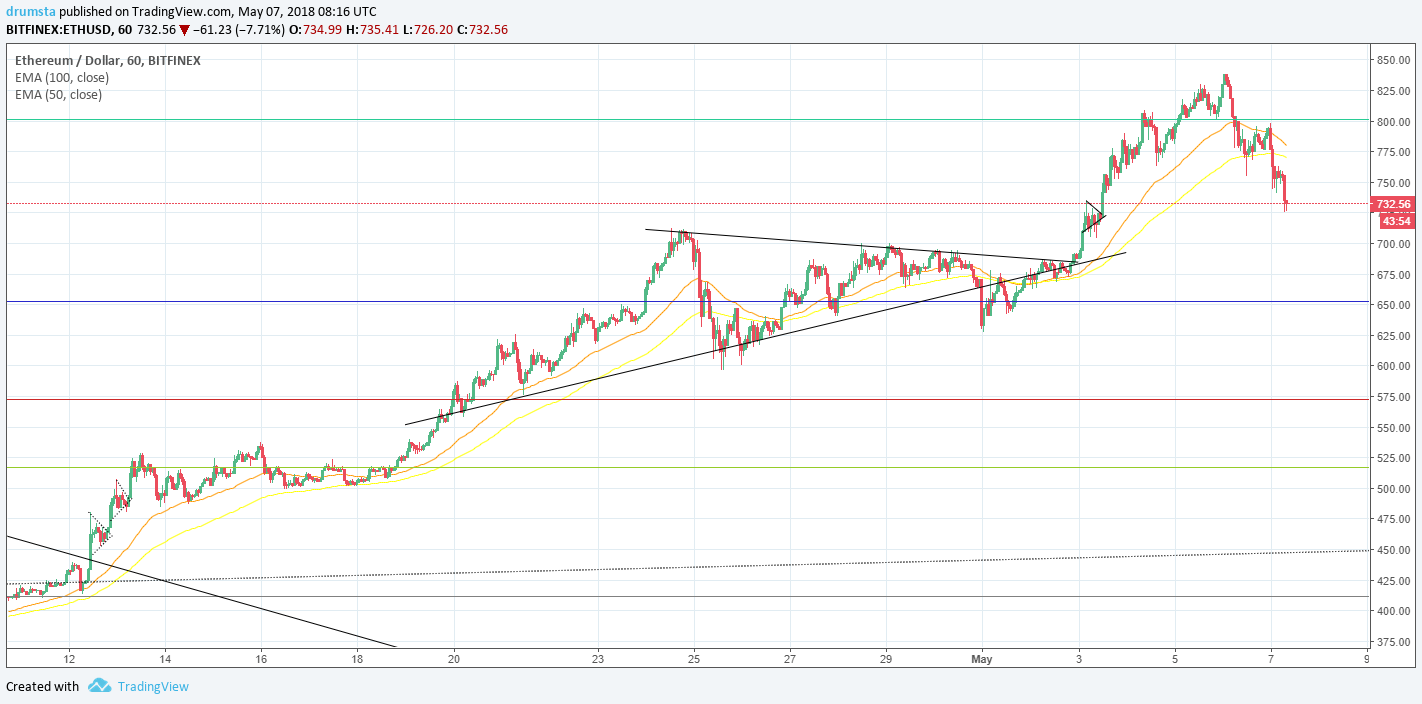
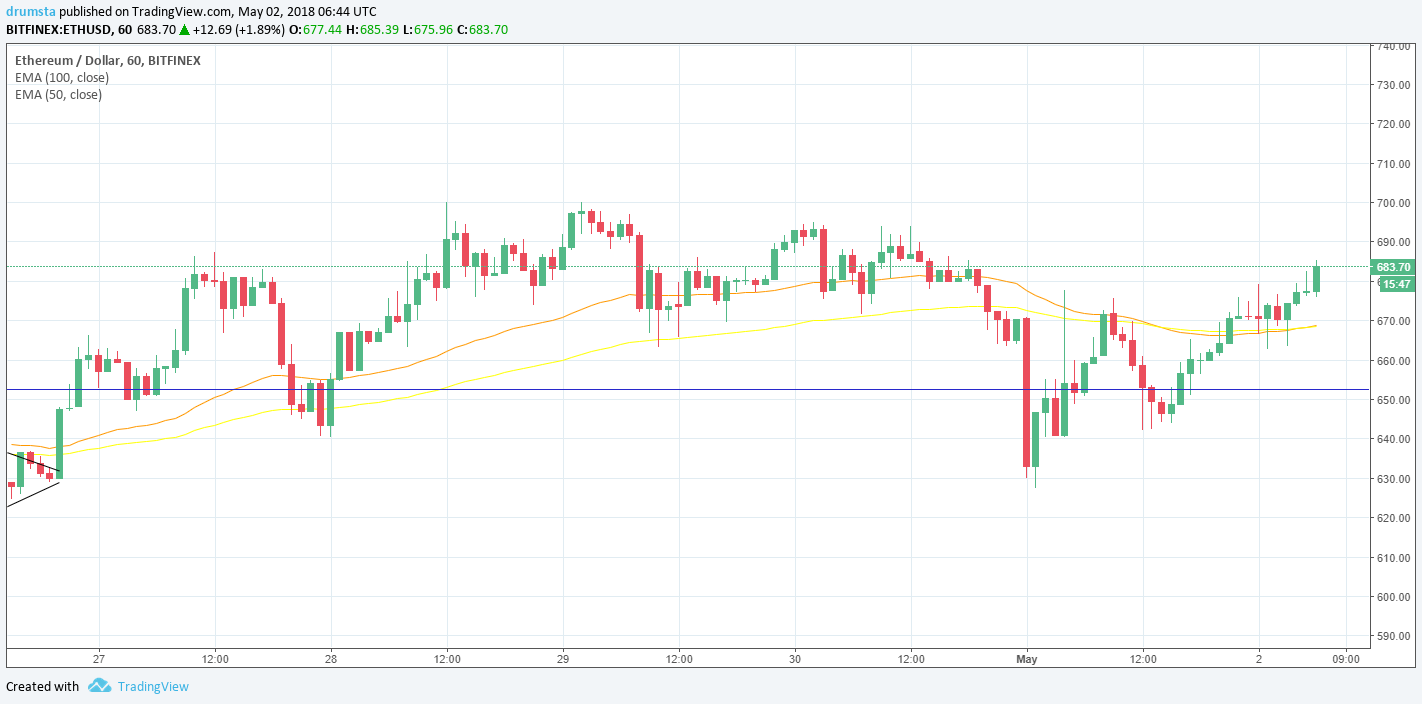
ETH/USD
From yesterday’s low at 576.13$ the price of Ethereum has increased by 4.62% rising to 602.8$ where it is currently sitting.
On the hourly chart, we can see that the price is yet again above the down channels resistance line and 0.382 Fibonacci level. As the price action is showing signs of topping as indicated by the cluster which resembles the previous one, I am expecting it to go down from here probably to this last uptrend support line (blue line) and down channels resistance line intersection to retest for support.
Market sentiment
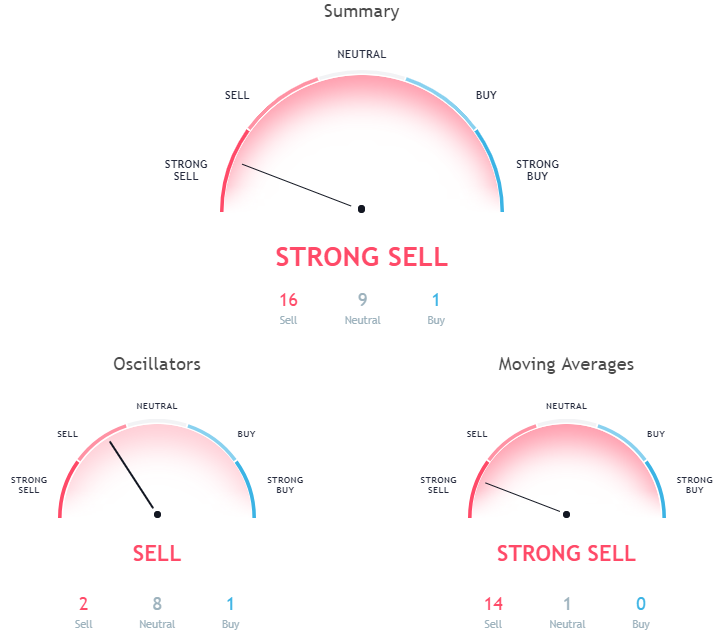
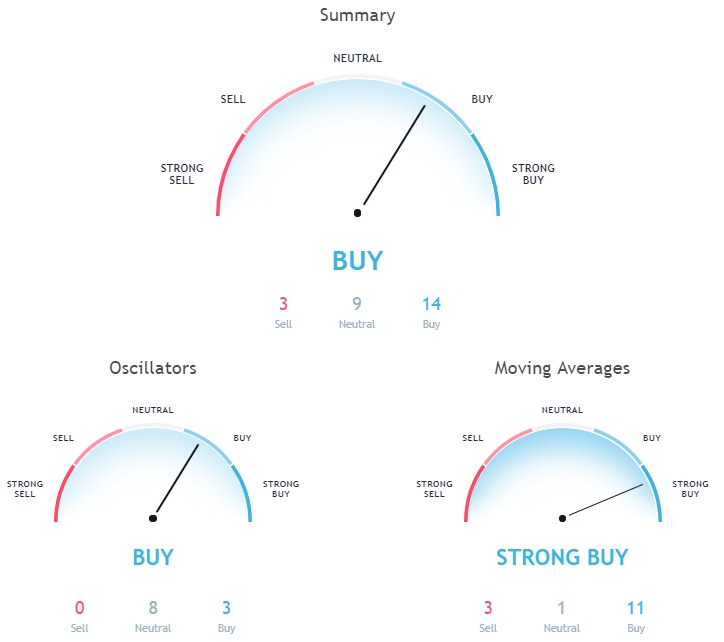
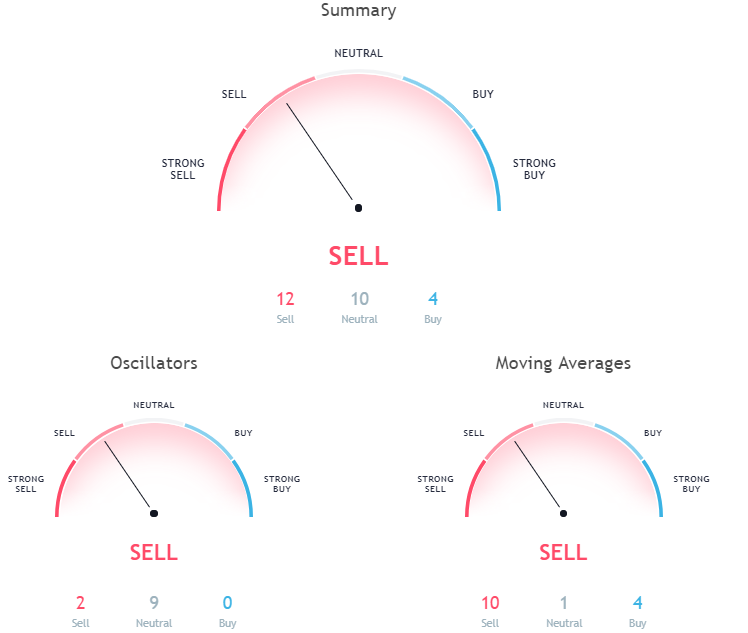
Hourly chart technicals signal a buy, however, it more looks like neutral as 7 indicators are on sell, 10 on neutral and 9 on buy.
Pivot points
S3 522.99
S2 561.21
S1 584.96
P 599.44
R1 623.18
R2 637.66
R3 675.88
XMR/USD
In the last 24 hours, the price of Monero has been rising. From yesterday’s low to yesterday’s high, the price increased by 7.8%. However, from yesterday’s open until now, Monero has increased overall only 1.65% – from 160.9$ to 163.420$ where it is now.
Looking at the hourly chart we can see that the price action is between the triangle support line (black line) and wedge support line (blue line) which I’ve declared a dominant pattern in the charting section previous week. Currently, we see another triangle forming and the price bounced off its resistance line. I would expect a few more bounces before a breakout, but I wouldn’t recommend trading it because if the proximity of the triangle and wedge support which would surely repeal the price in either way, so the trade would be short-lived.
Market sentiment
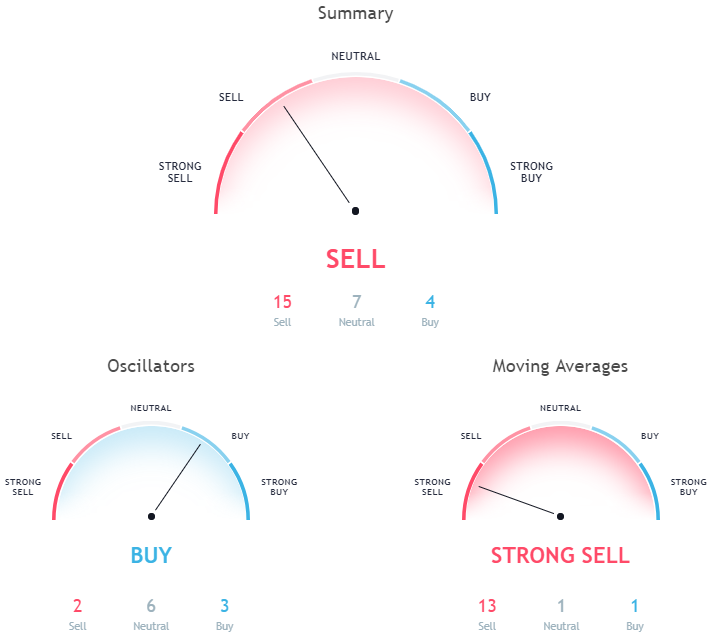
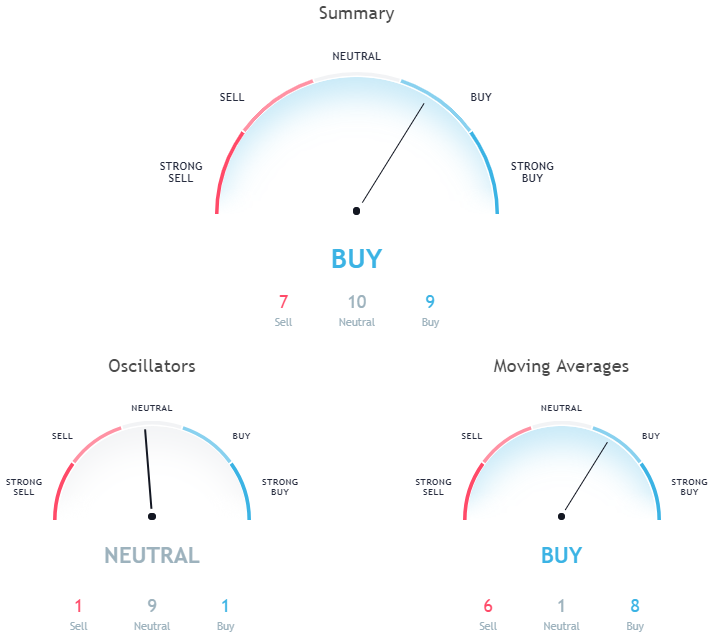
Monero is in the sell zone, as indicated by the hourly chart technicals.
Oscillators are on neutral, and moving averages on a strong sell.
Pivot points
S3 137.857
S2 151.127
S1 159.123
P 164.397
R1 172.393
R2 177.667
R3 190.937
Conclusion
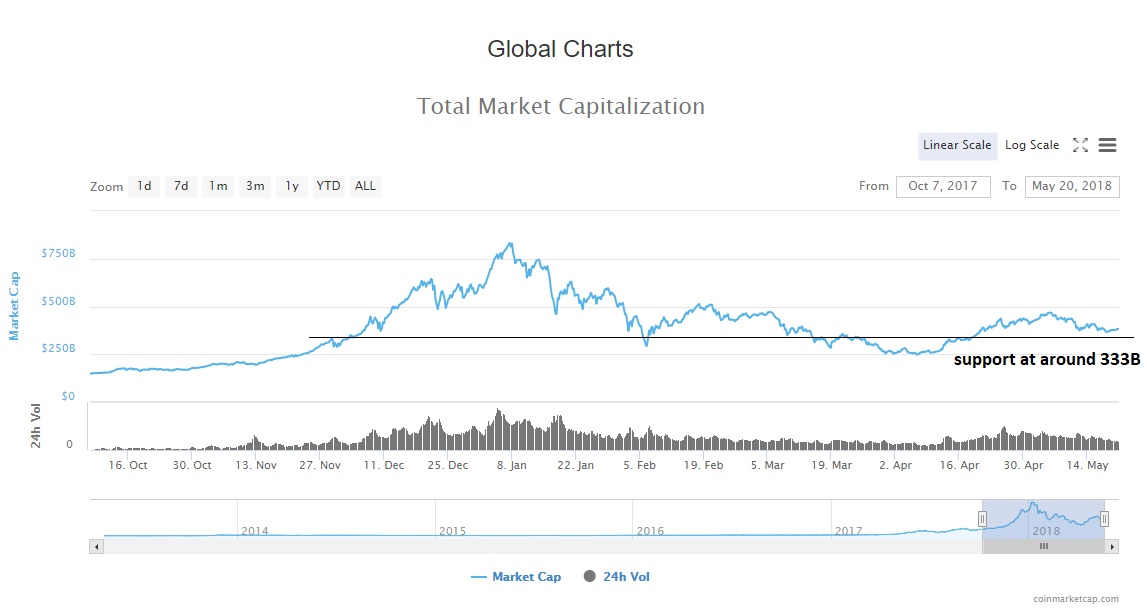
As the prices have shown a lot of sideways movement in the last few days, unable to create significant highs and are not falling further below, we are soon going to see a triggered action. As the prices are hovering at around the same levels for days I would expect people to get anxious and start selling as they would fear not to lose money, because the prices aren’t going higher. In that case, we may see a retest of prior lows or even lower lows which would in the case of Bitcoin mean a drop to 7000-6500$ levels.
 Cryptocurrency Charts Live


 Pivot points:

 Pivot points:
 Pivot points:
 Pivot points:
 Pivot points:


 Pivot points:
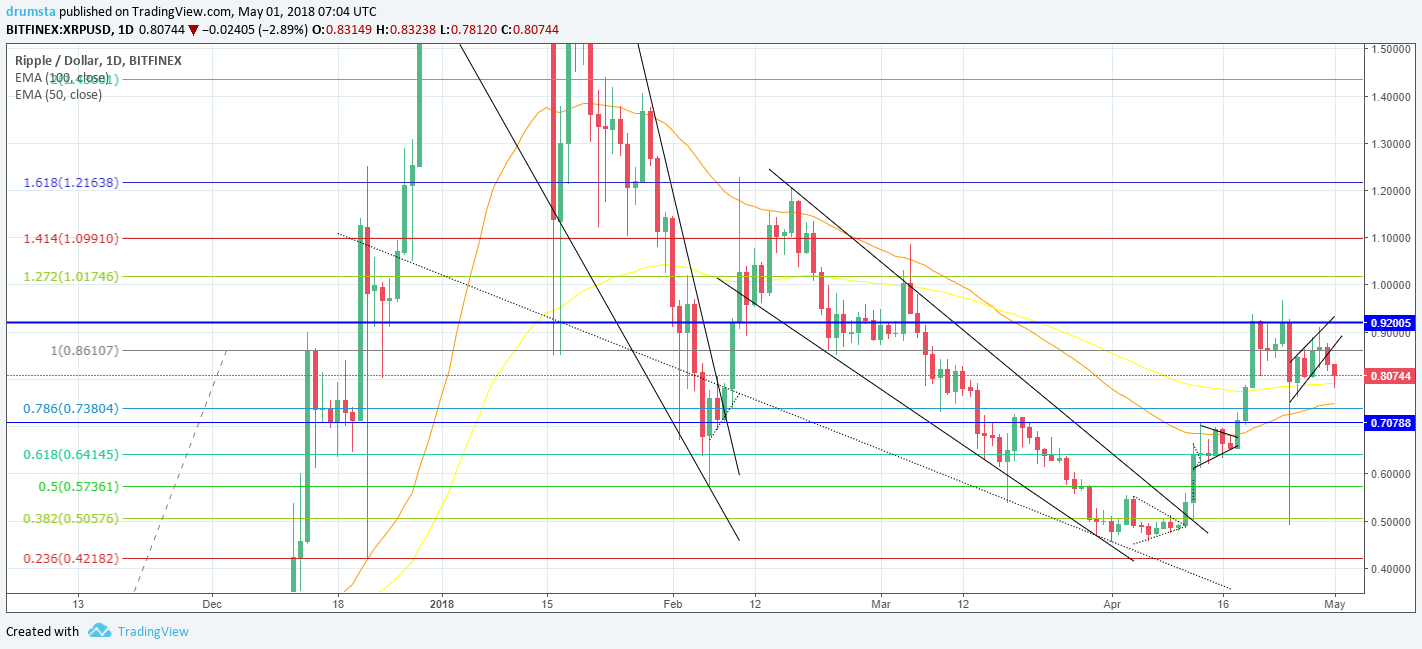
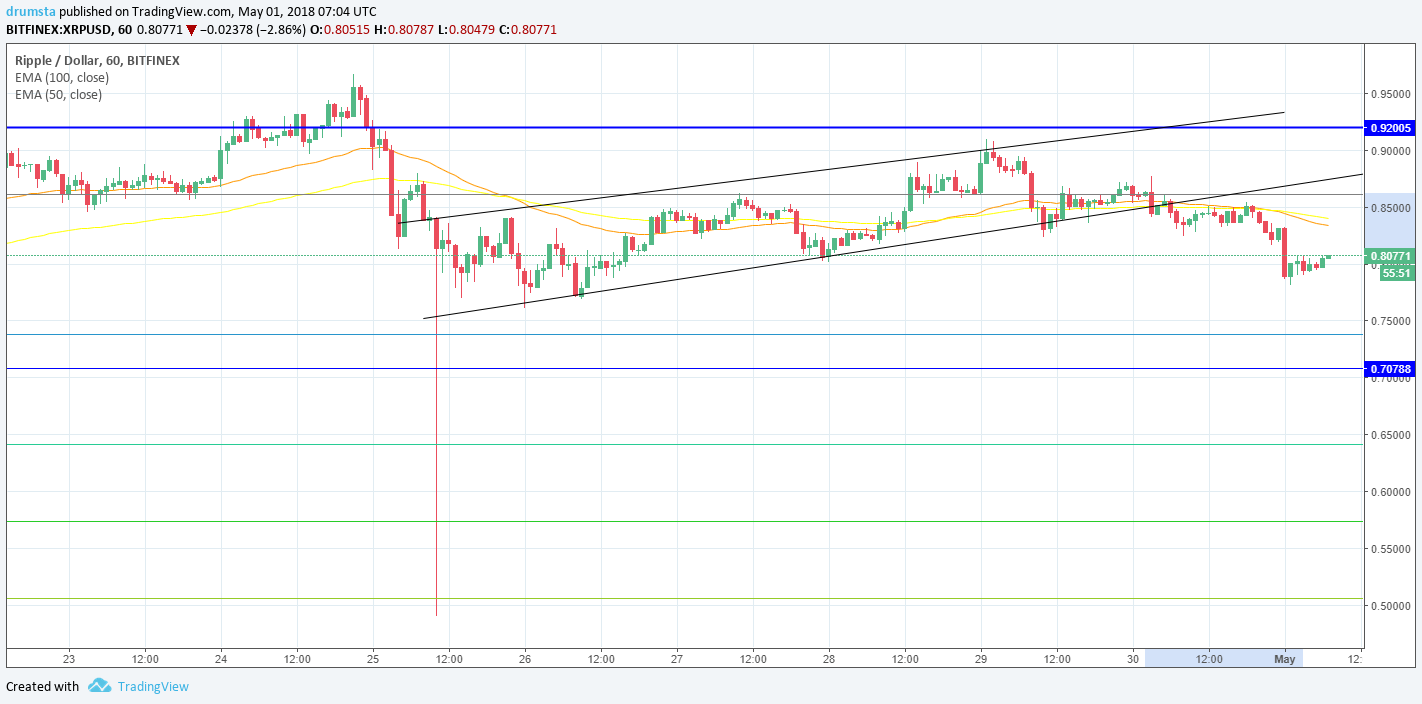
 The current market sentiment for Ripple is positive, meaning 87,88% of 66 mentions in total are positive.
 Pivot points:


 The current market sentiment for Ethereum is positive, meaning out of 133 mentions in total 77,44% were positive.
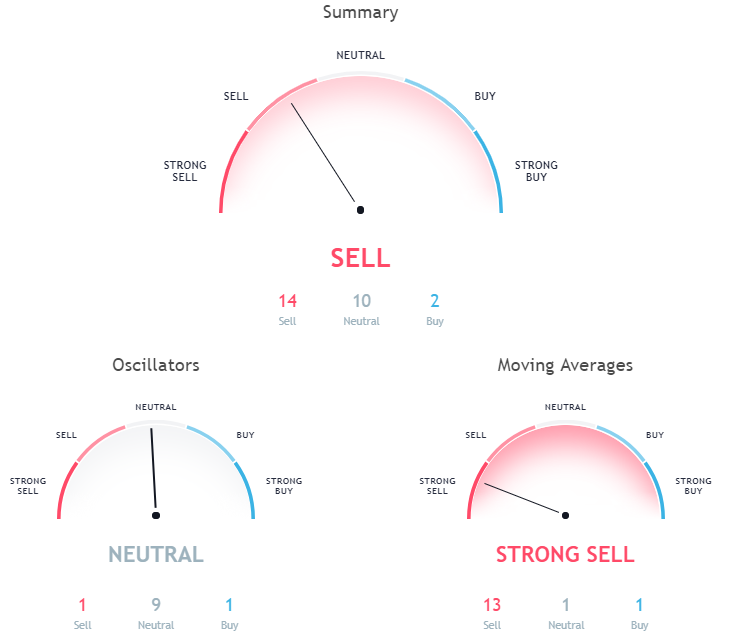
 Overall, hourly chart signals a buy, however, there are also nine neutral signals.
 The current sentiment for Ripple is slightly positive meaning 62.71 out of 59 mentions in total are positive.
 Overall hourly chart signals a buy.


 Overall, hourly


 The current sentiment is positive, meaning 75% of 64 mentions in total are positive.
 Overall, hourly chart signals a sell.