The cryptocurrency sector has started its consolidation period after a bloodbath it experienced yesterday. The largest cryptocurrency by market cap is currently trading for $17,164, representing a decrease of 3.07 % on the day. Meanwhile, Ethereum is gaining 0.01% on the day, while XRP managed to gain 2.47%.
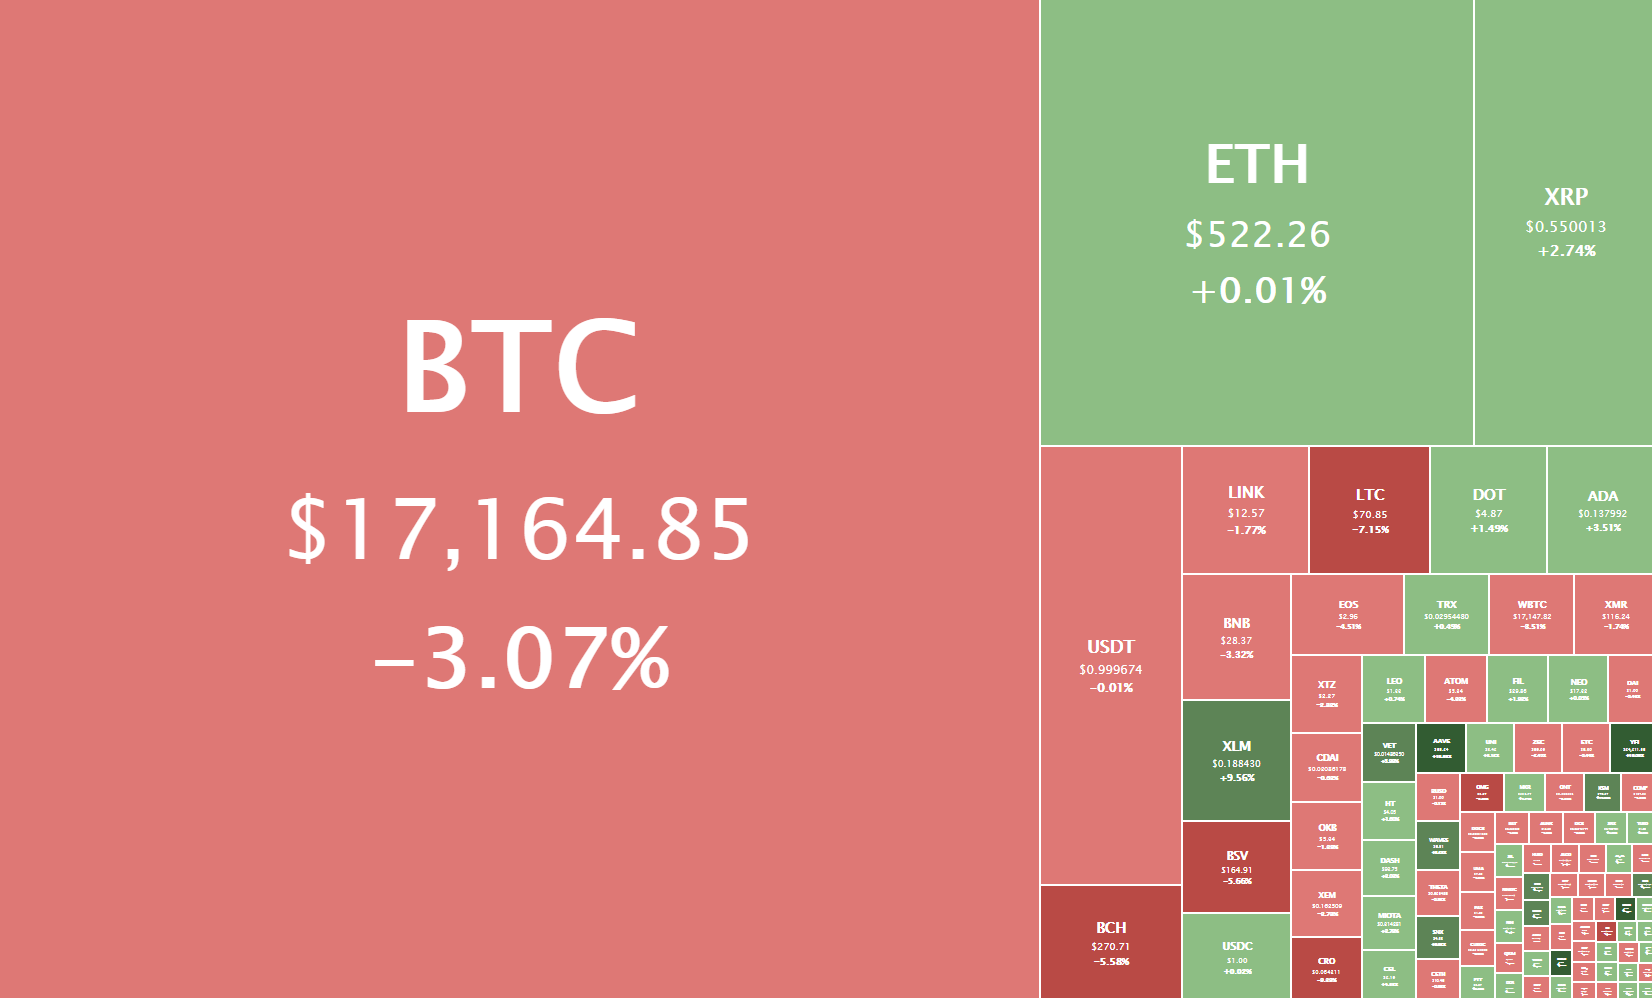
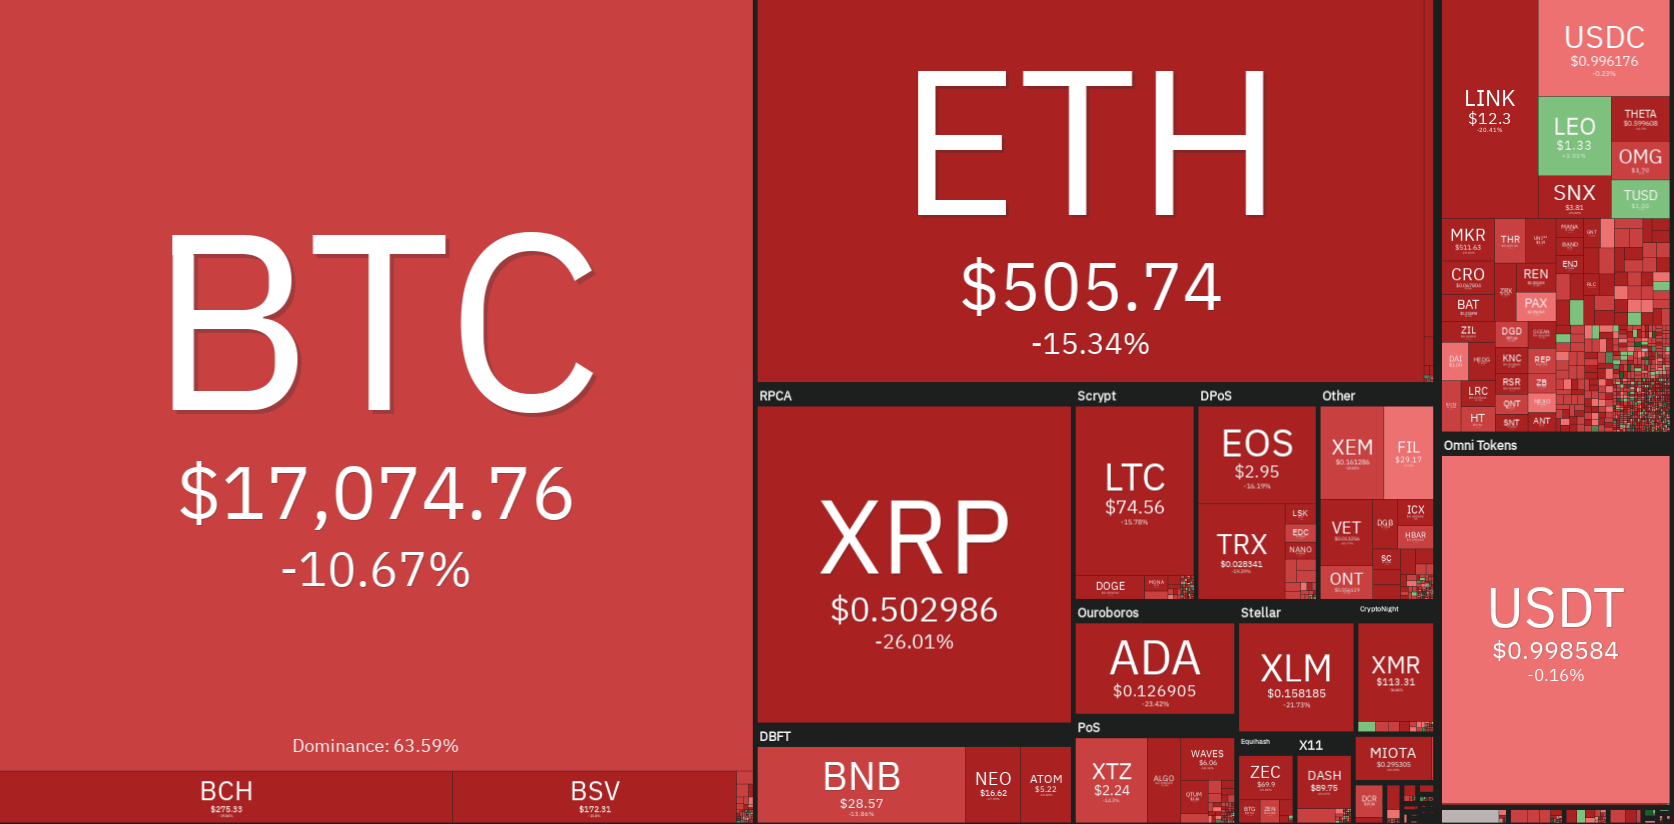
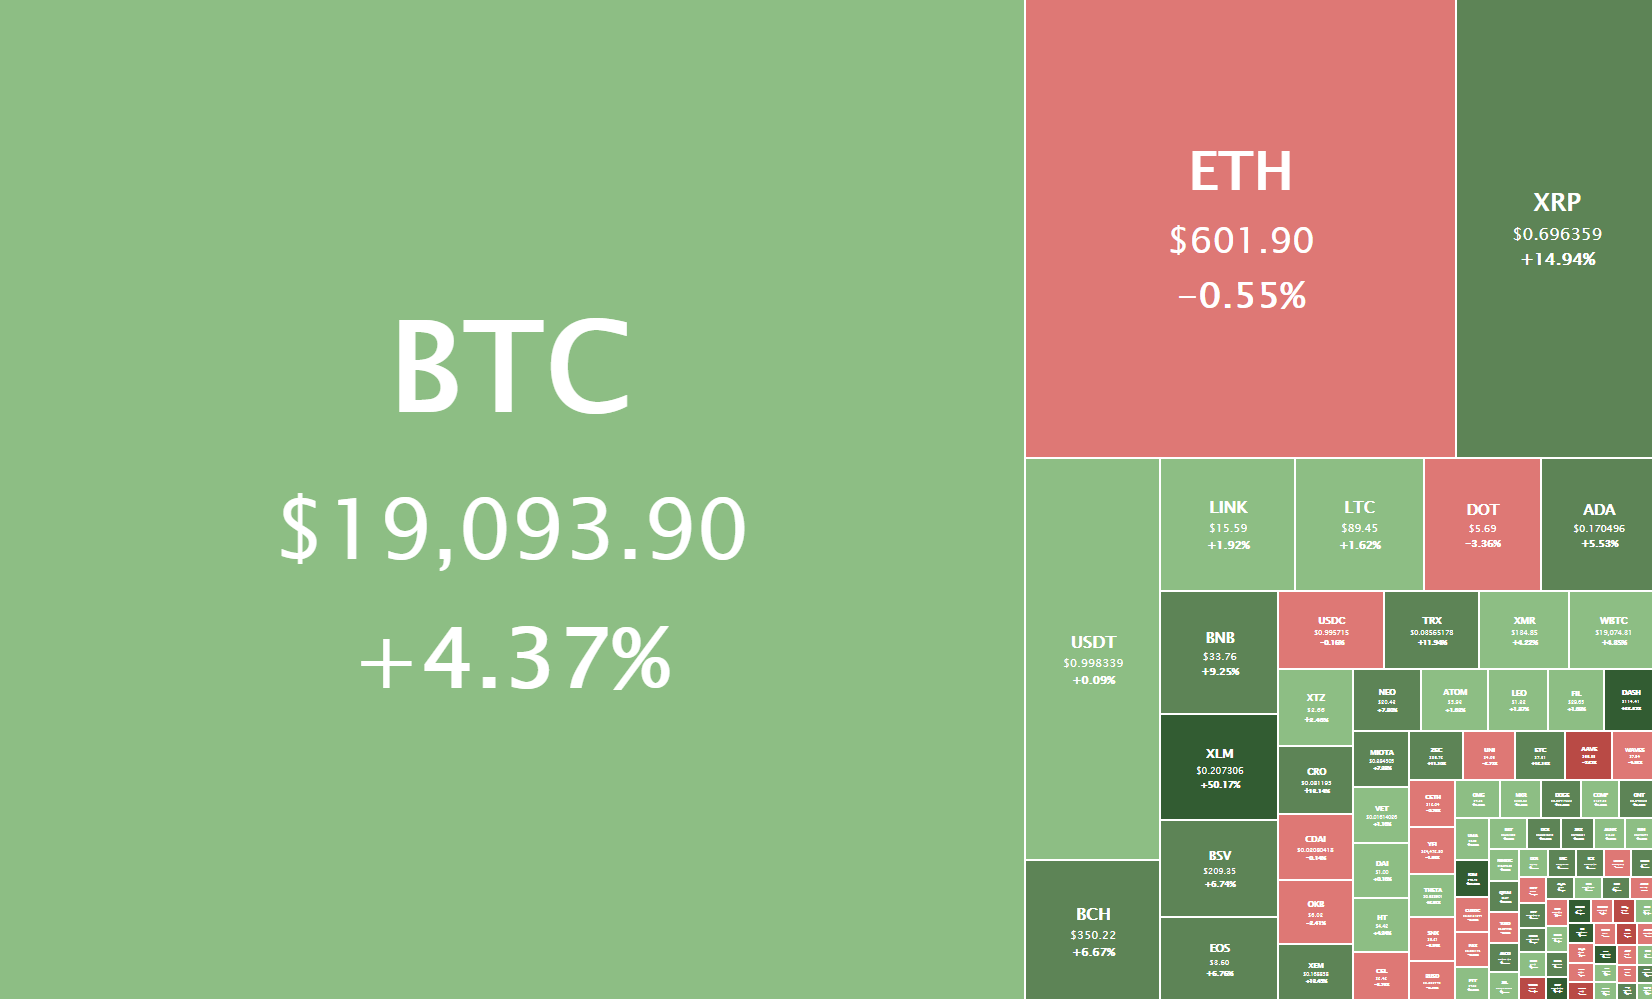
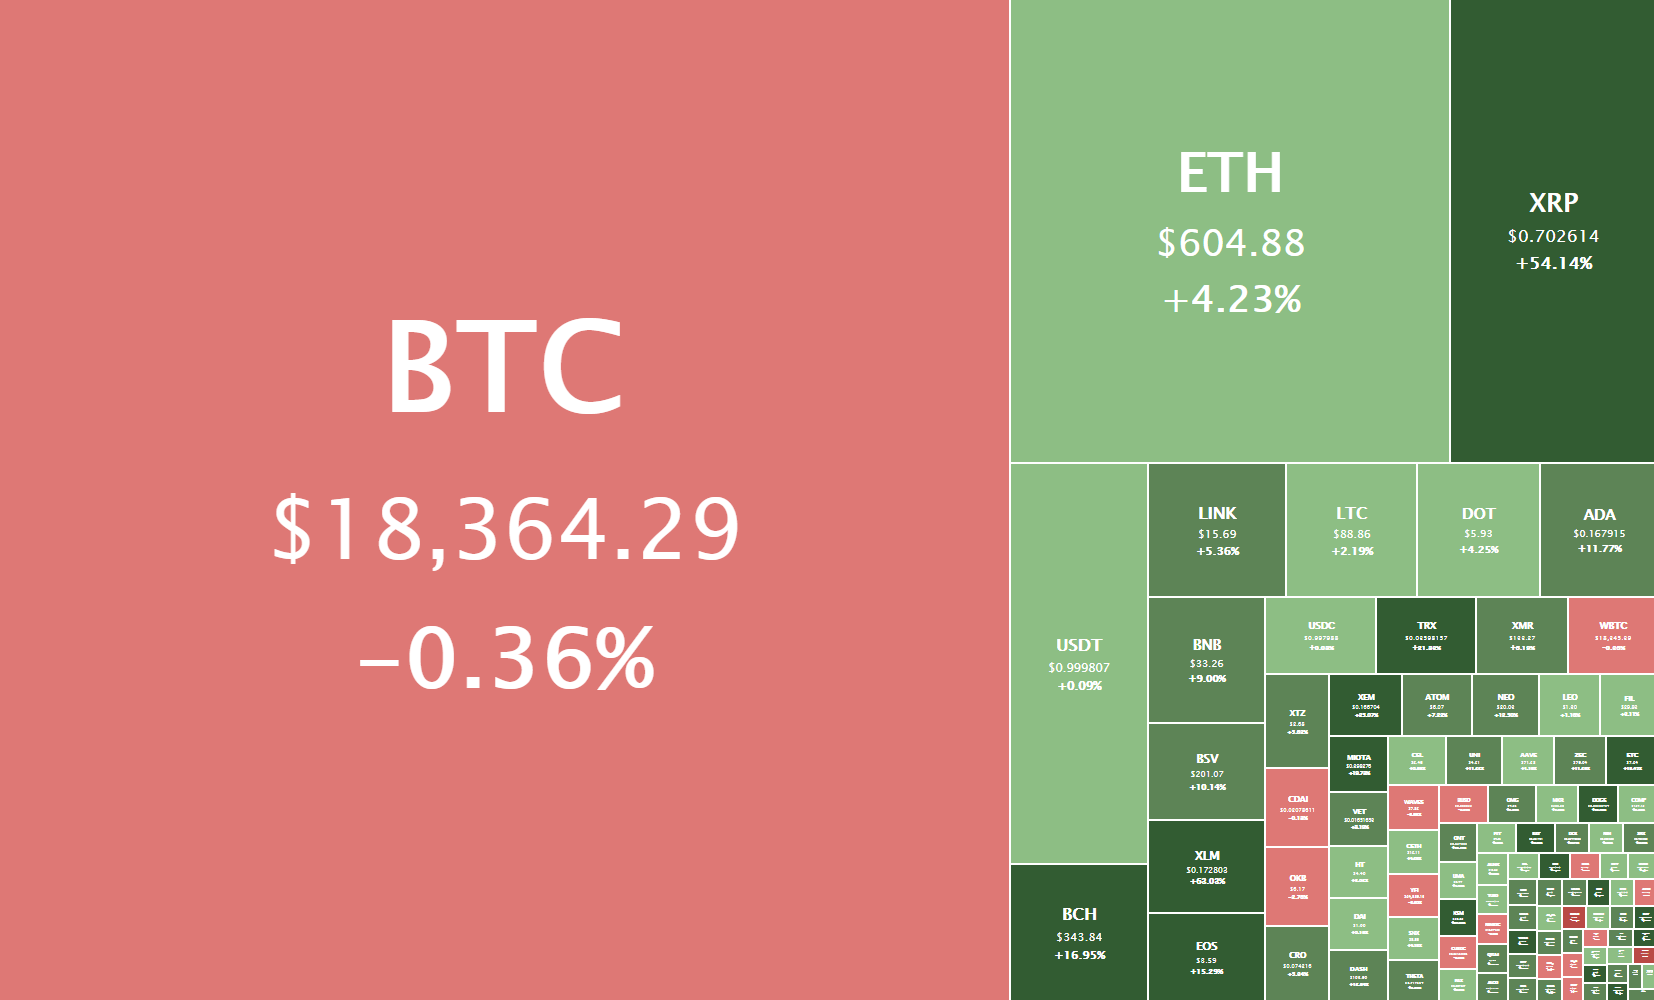
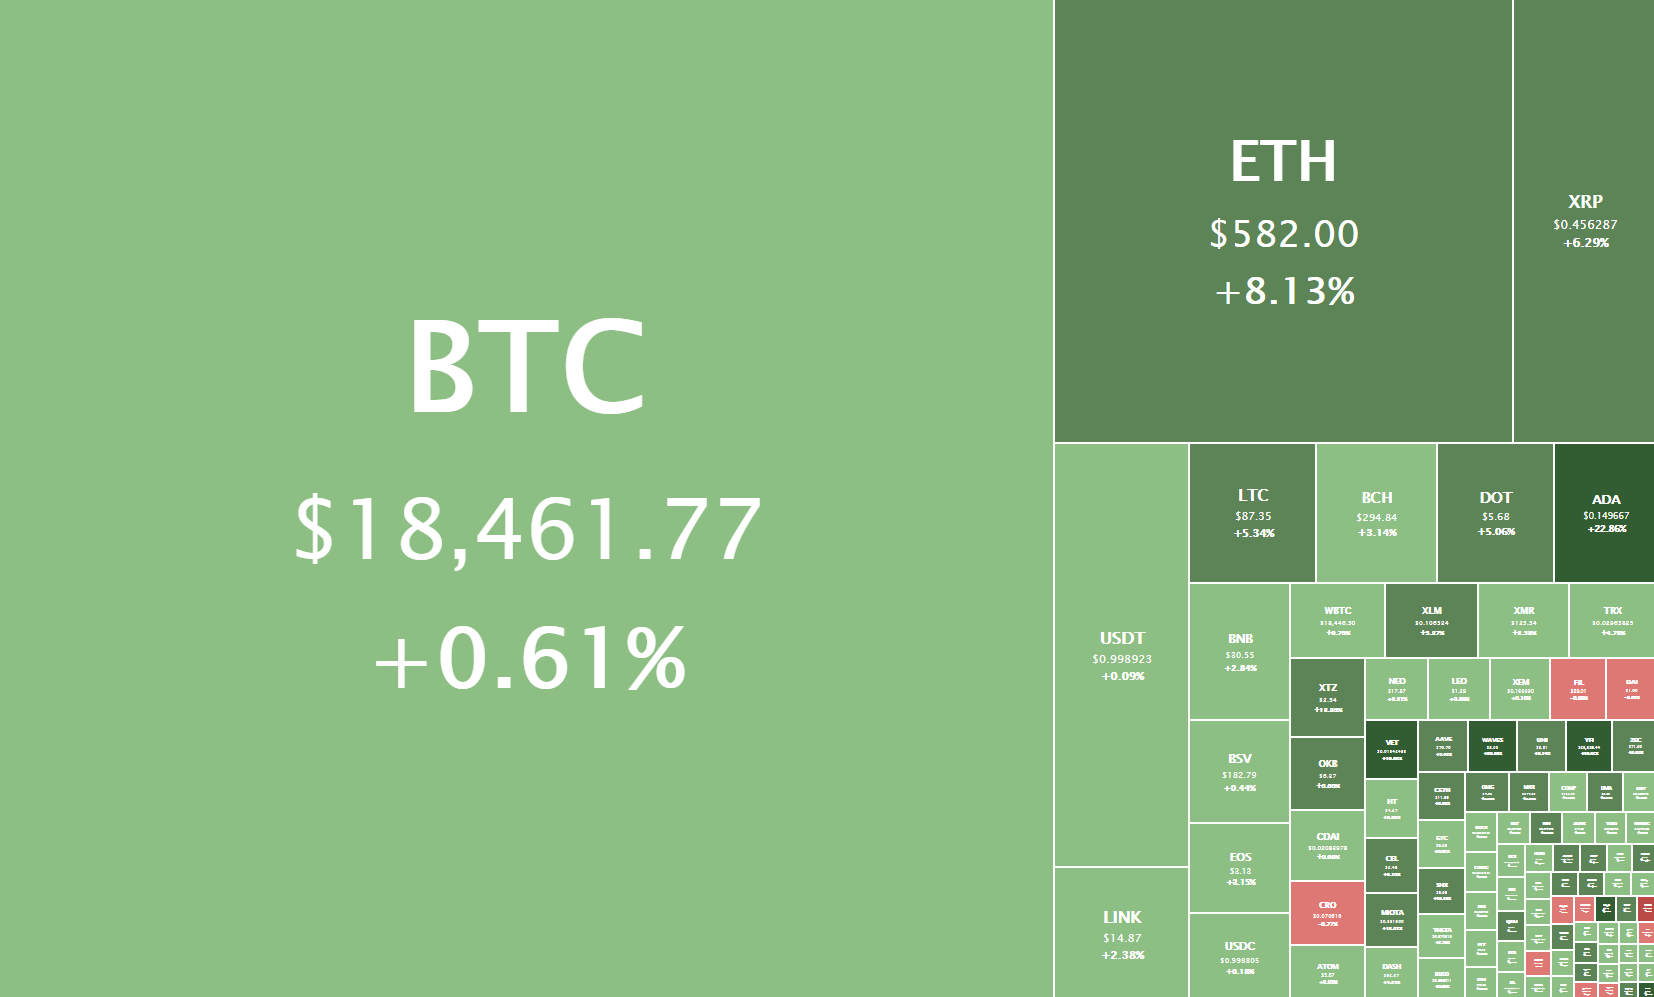
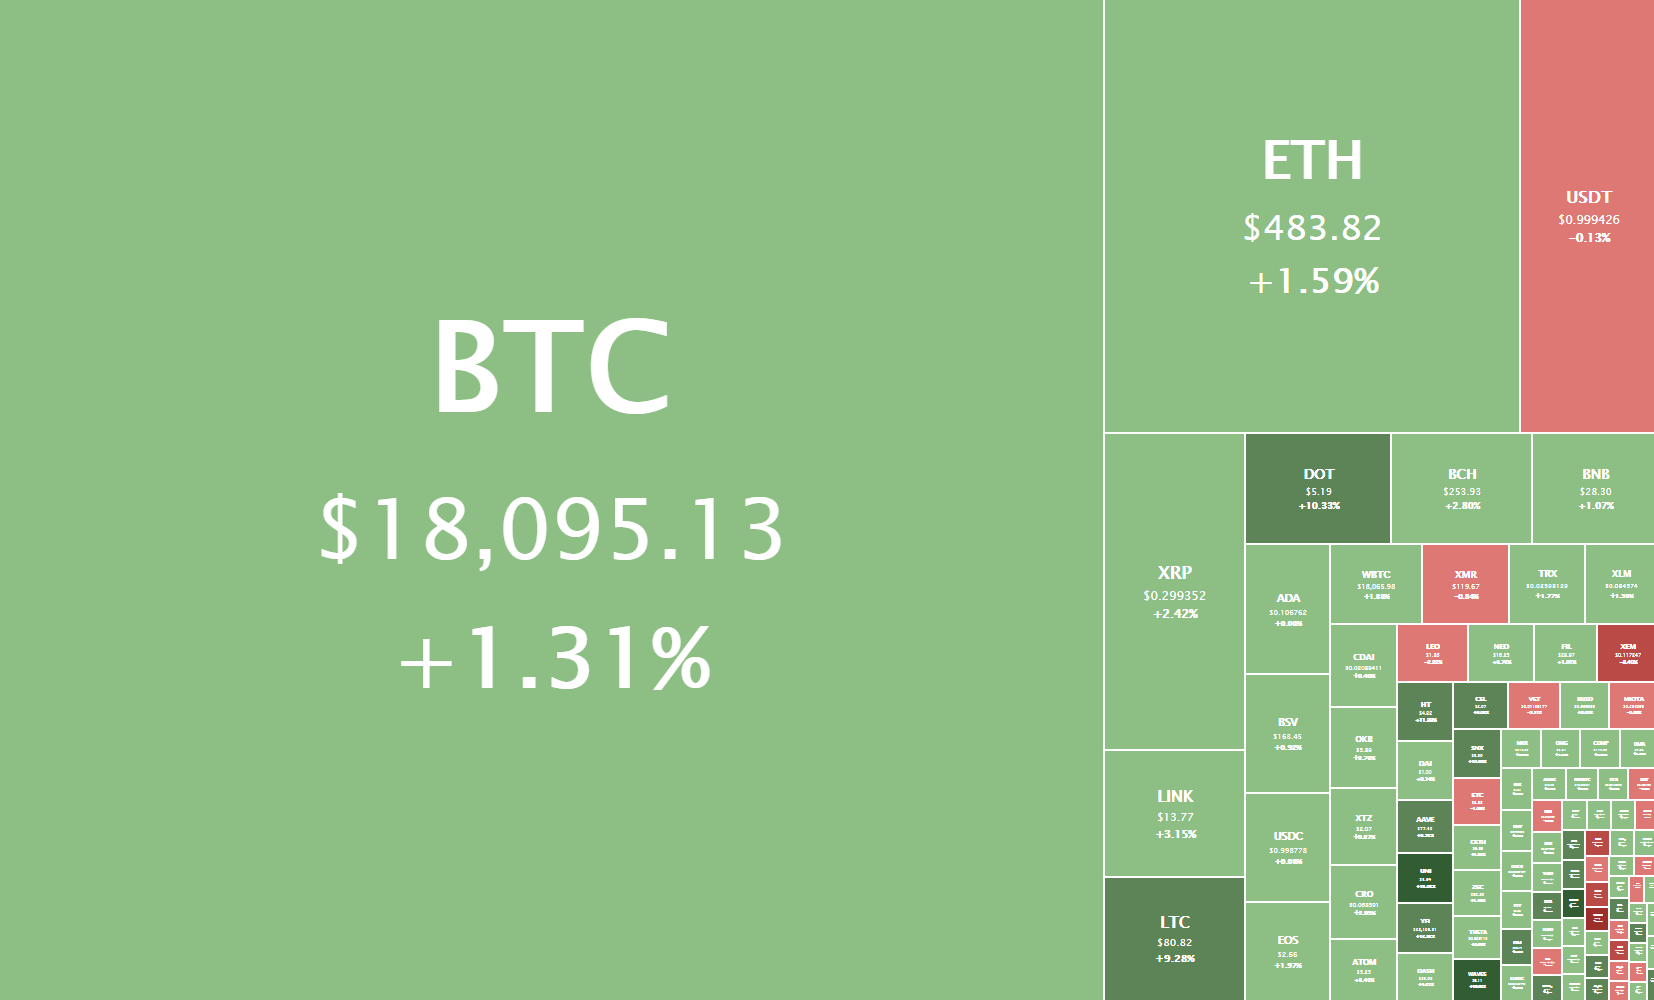
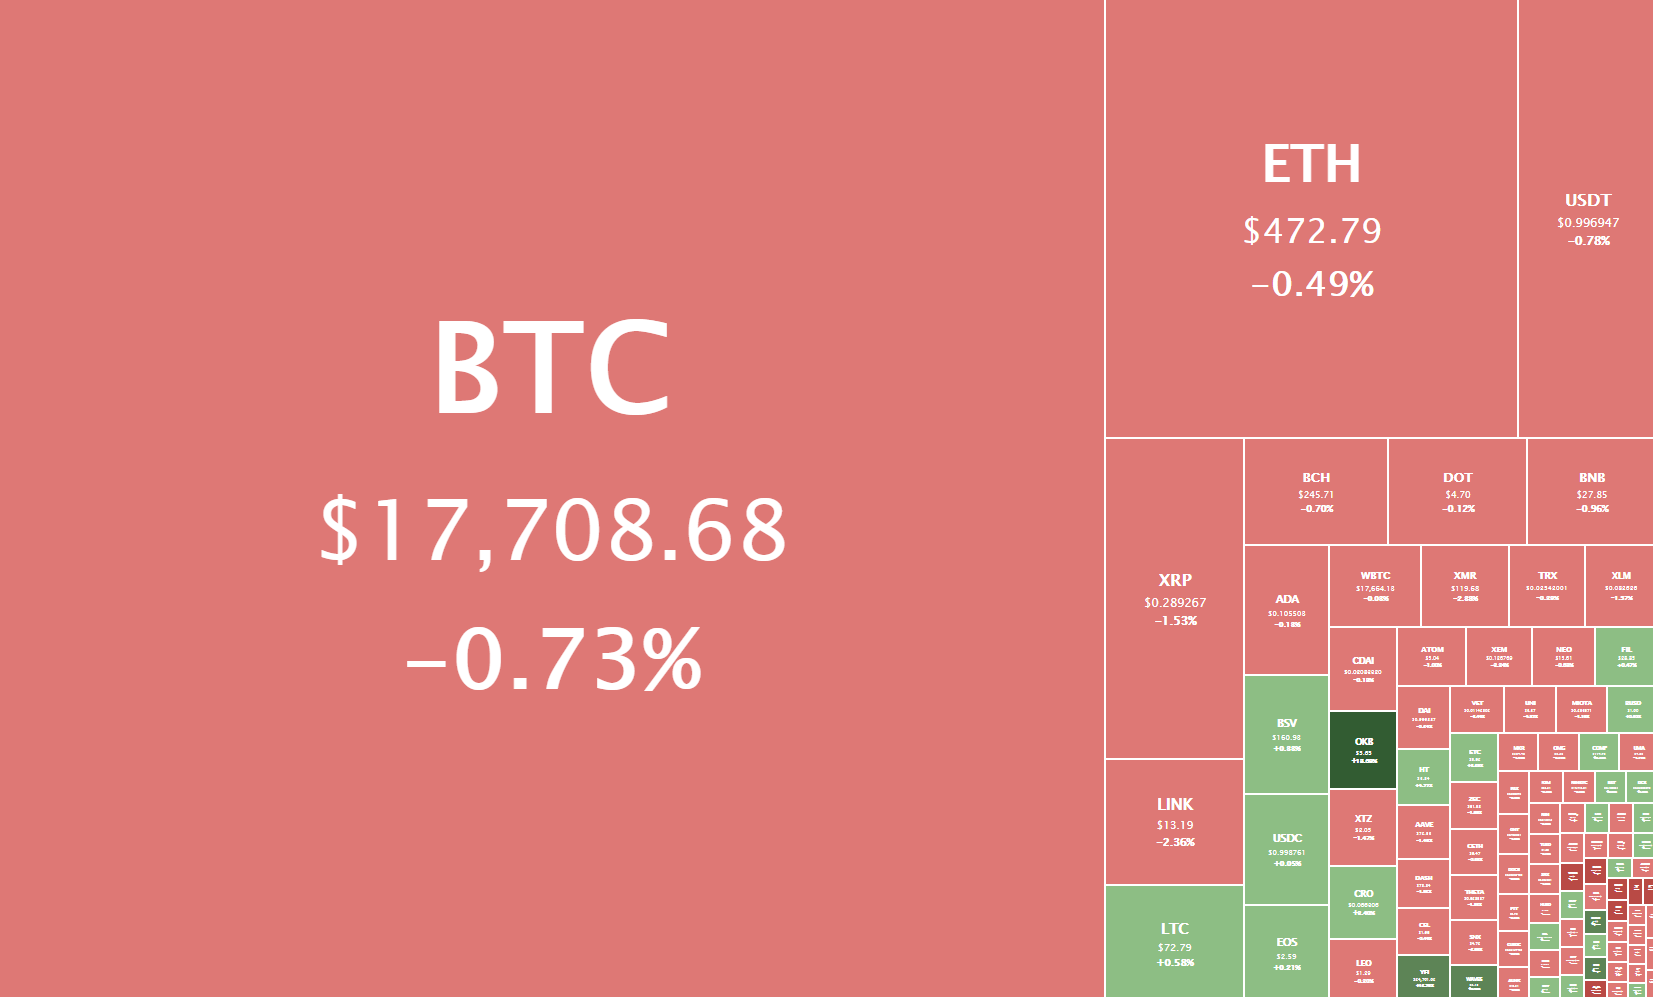
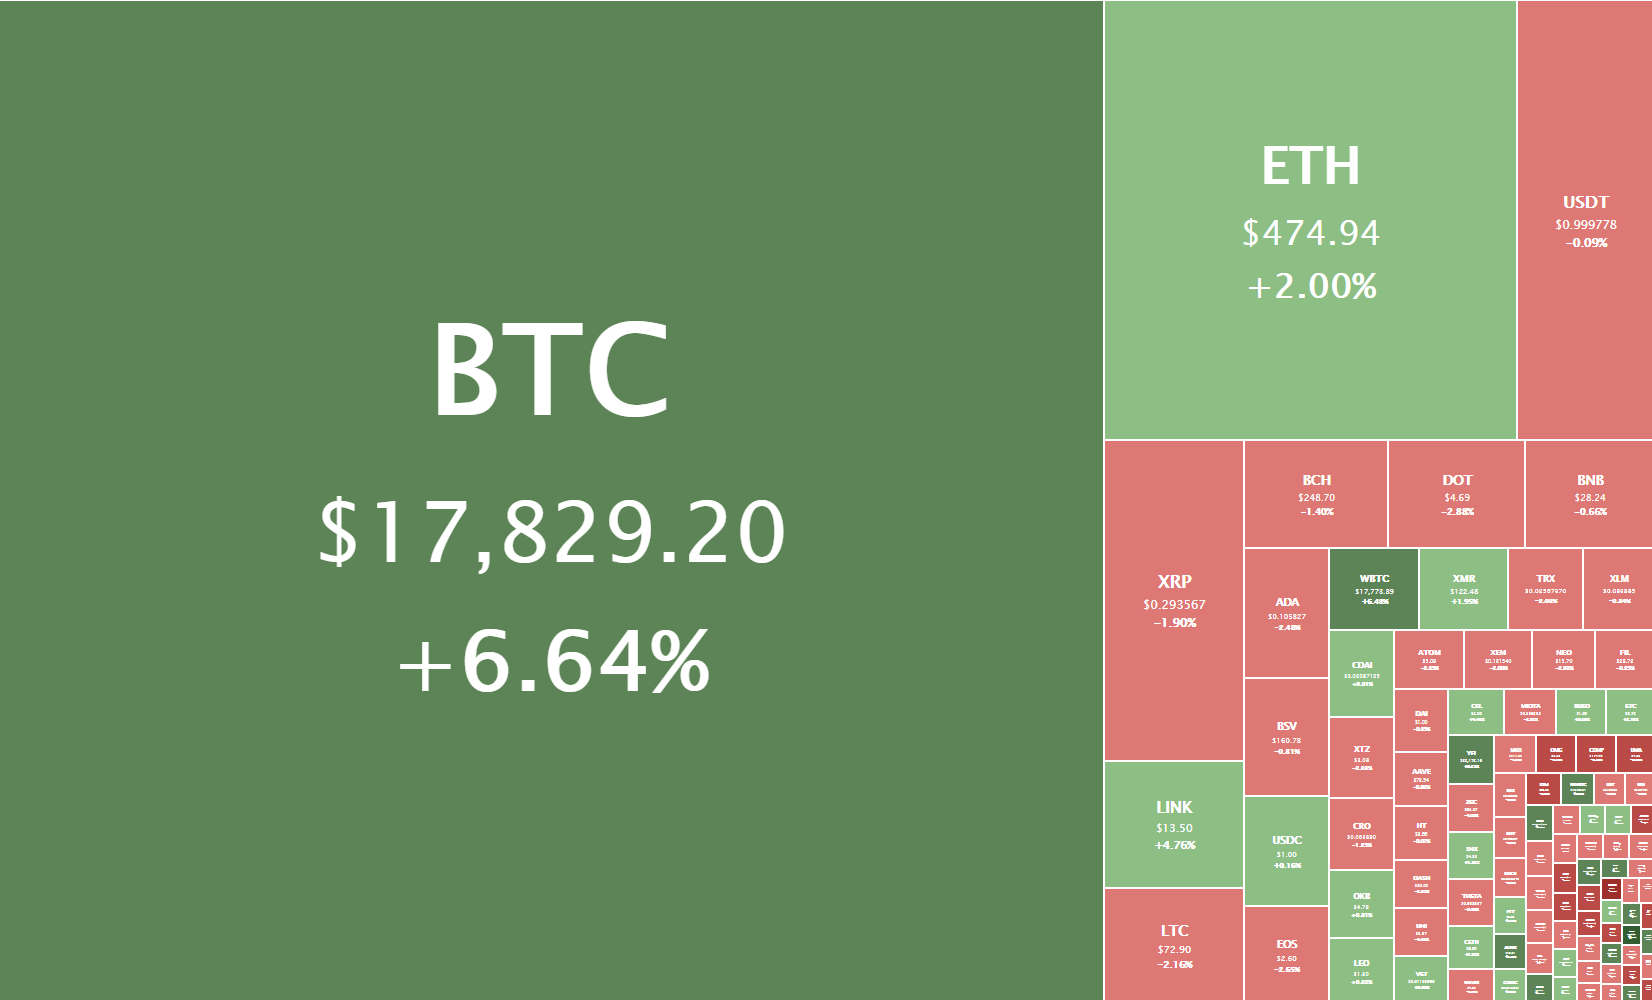
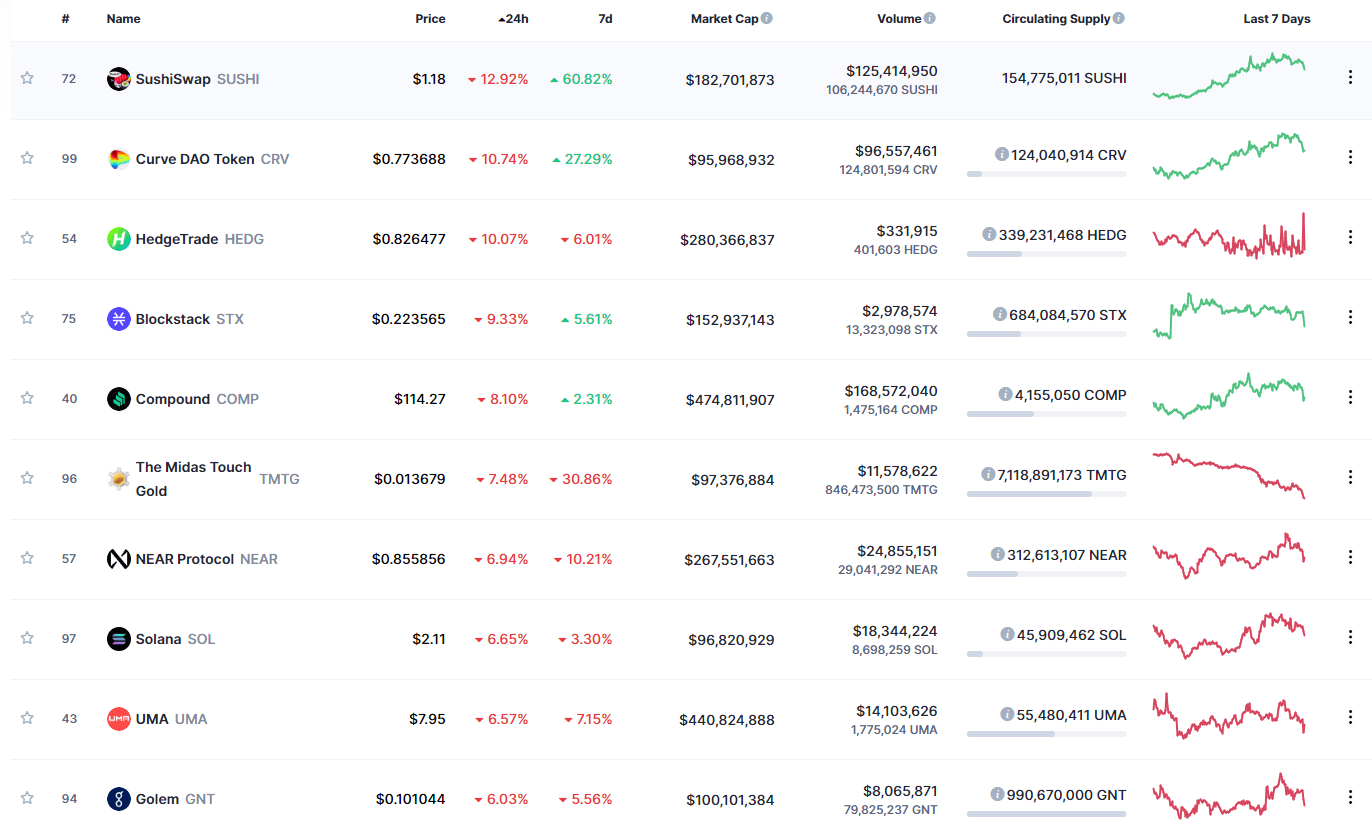
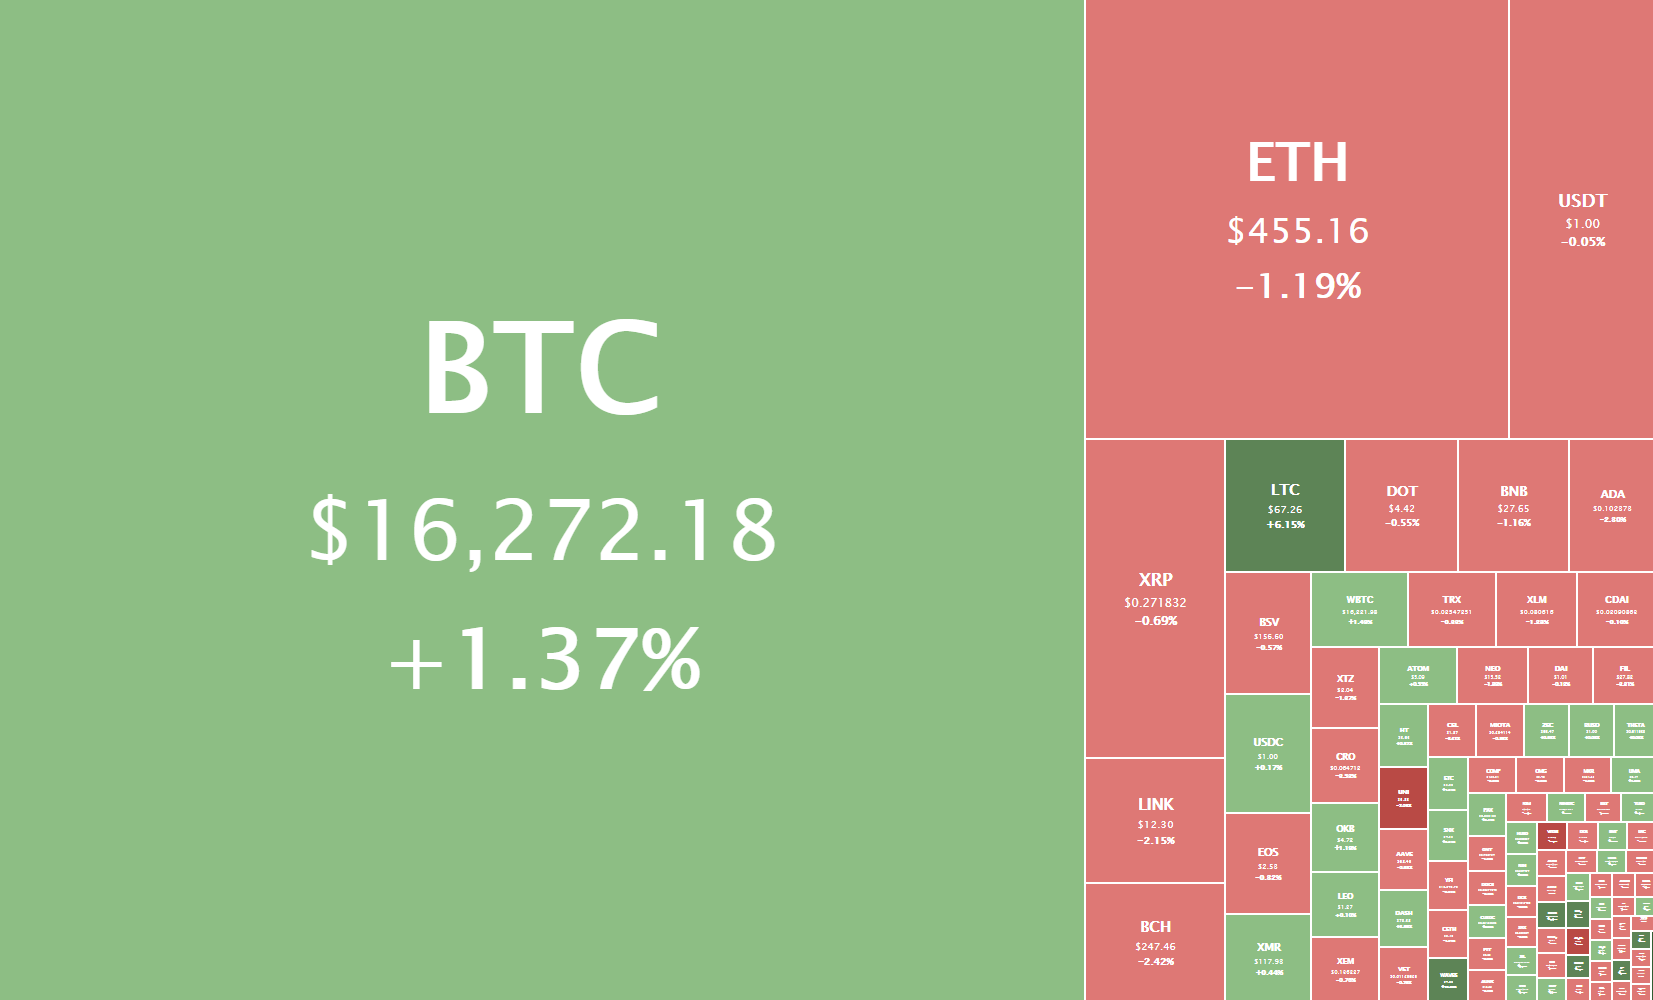
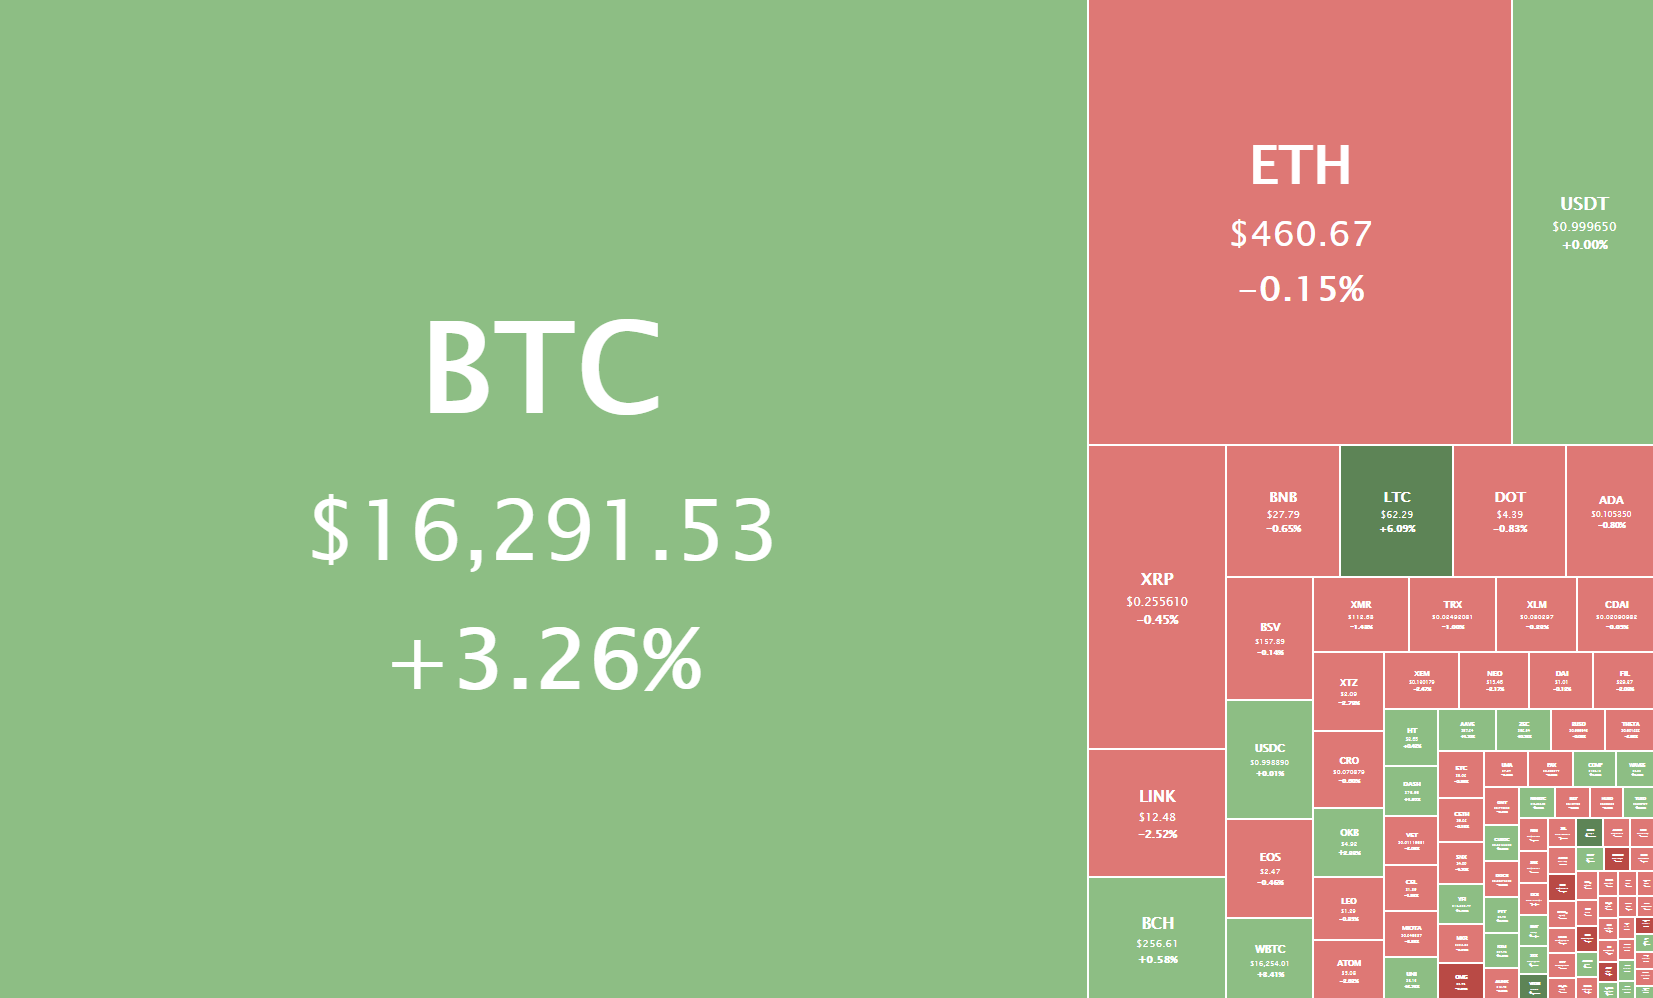
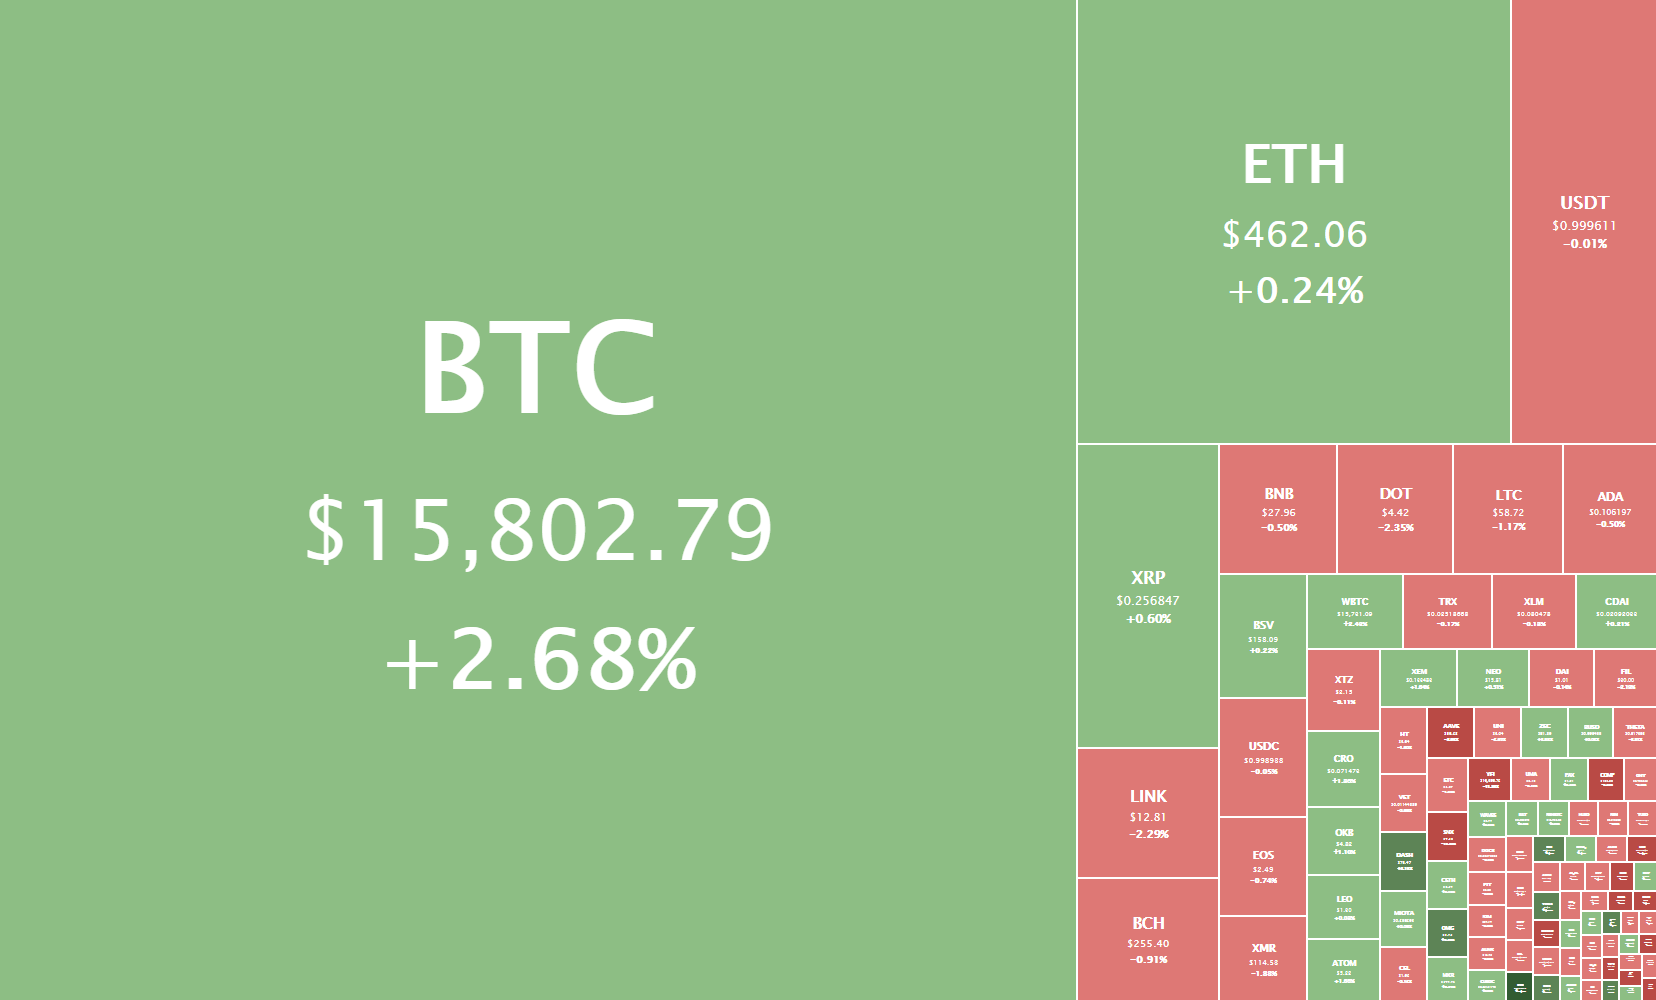
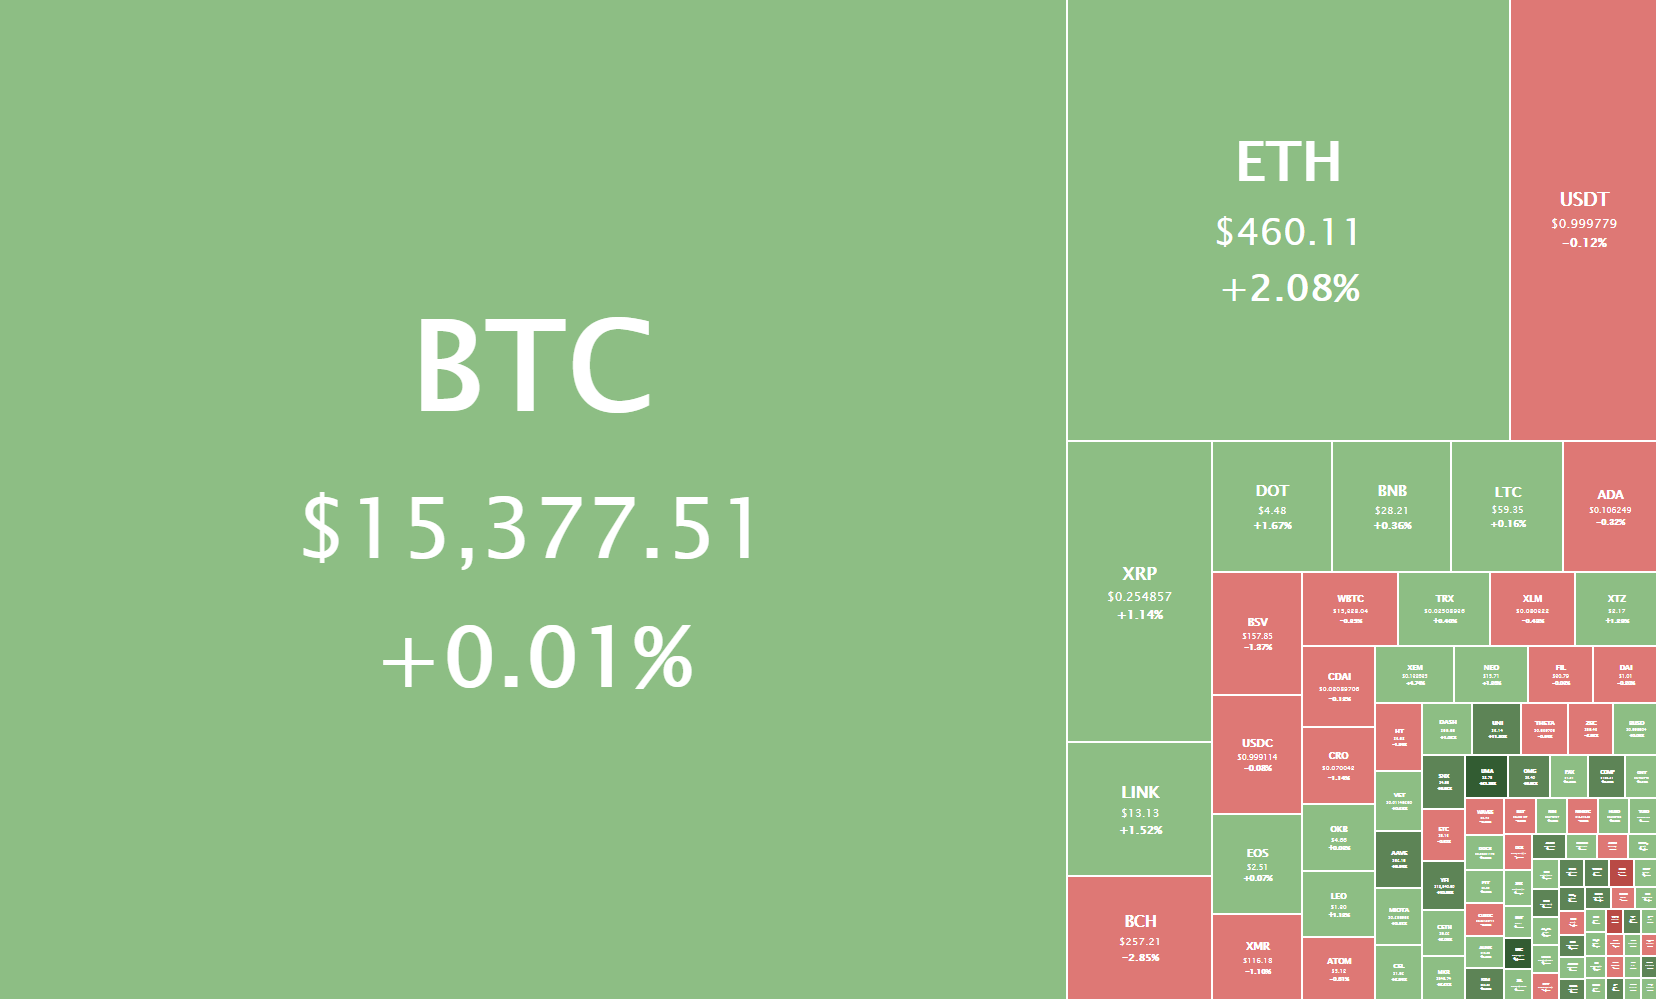
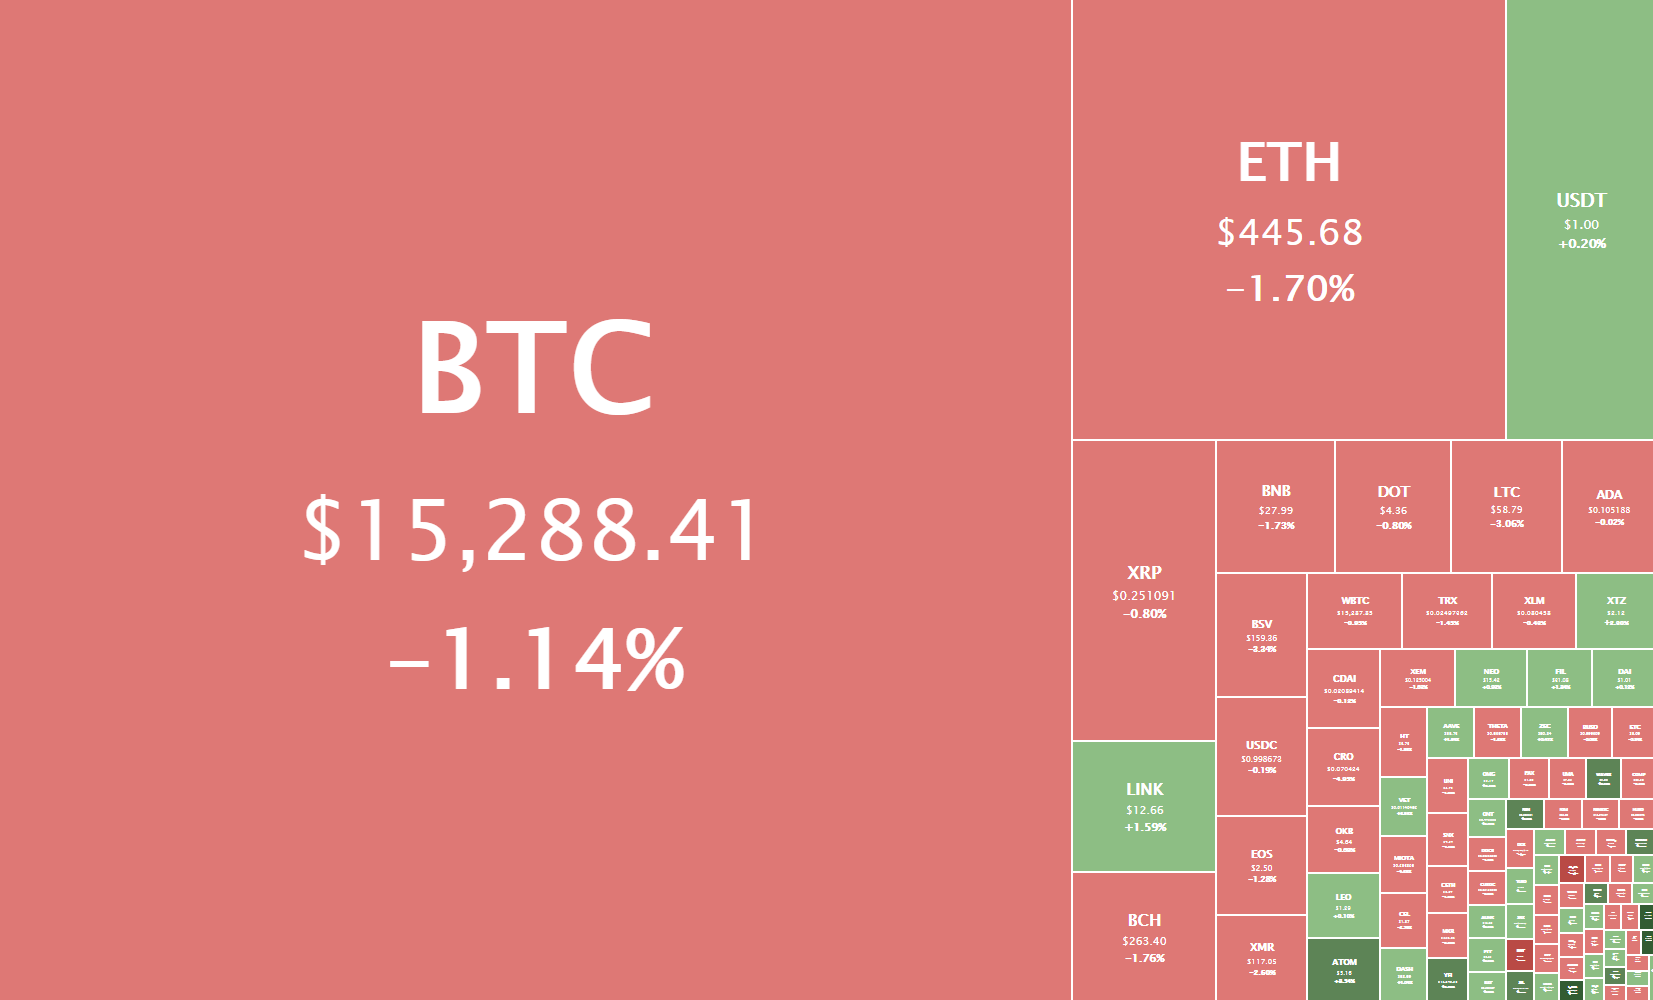
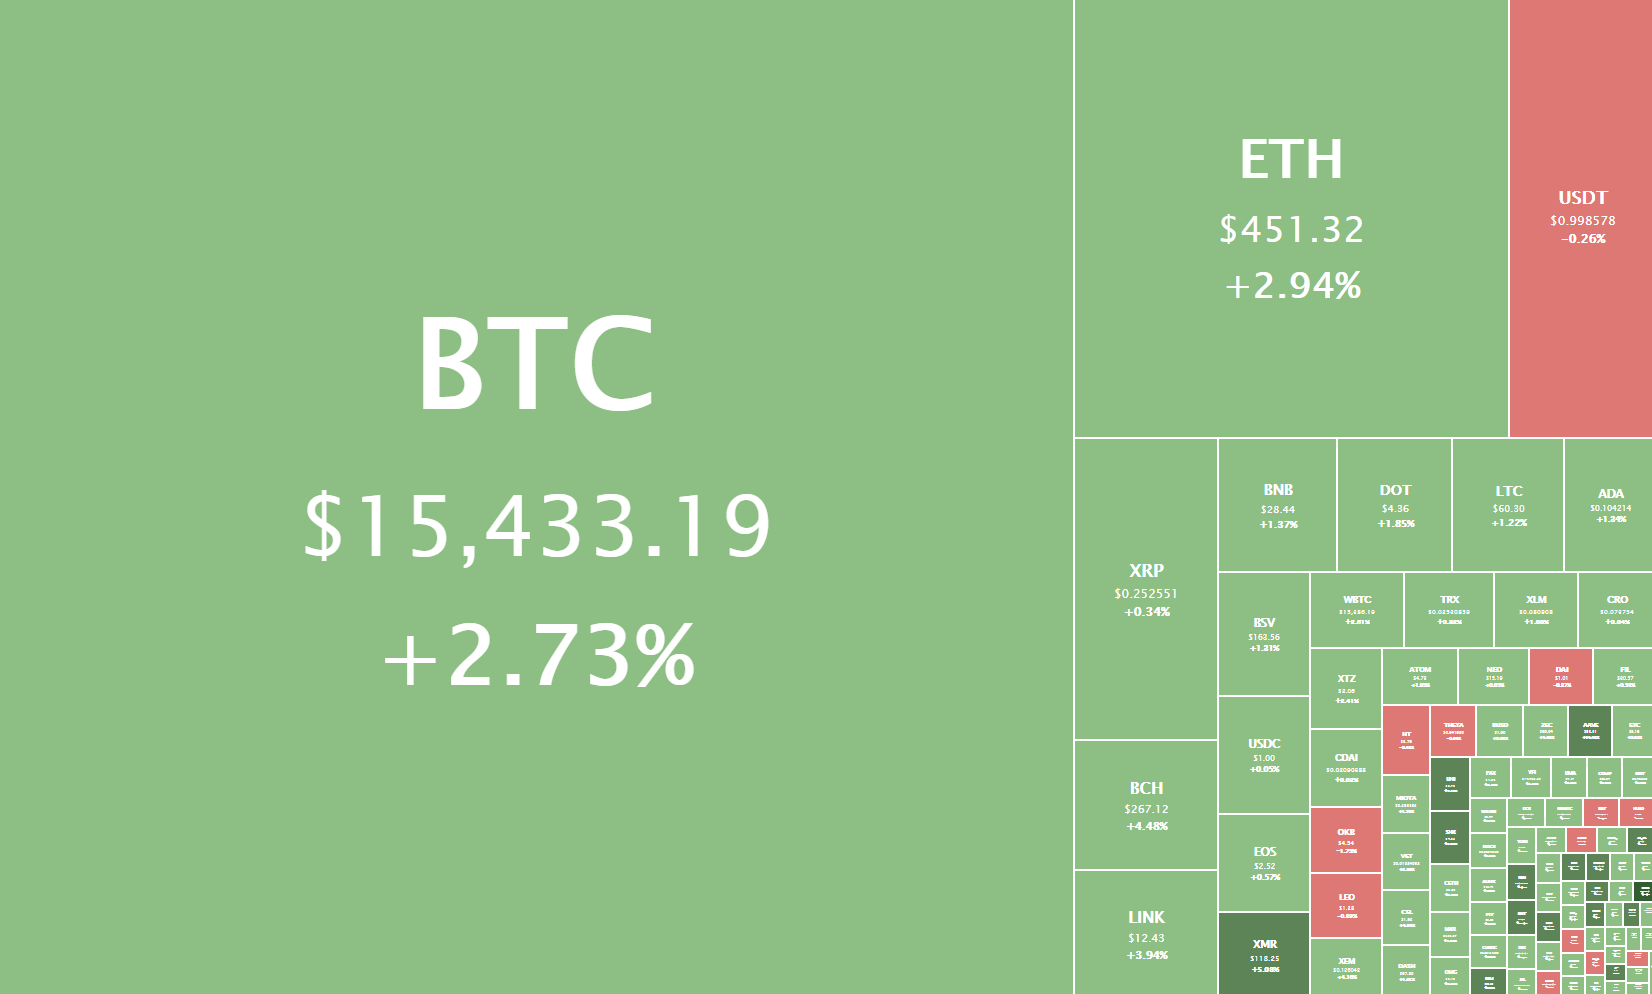
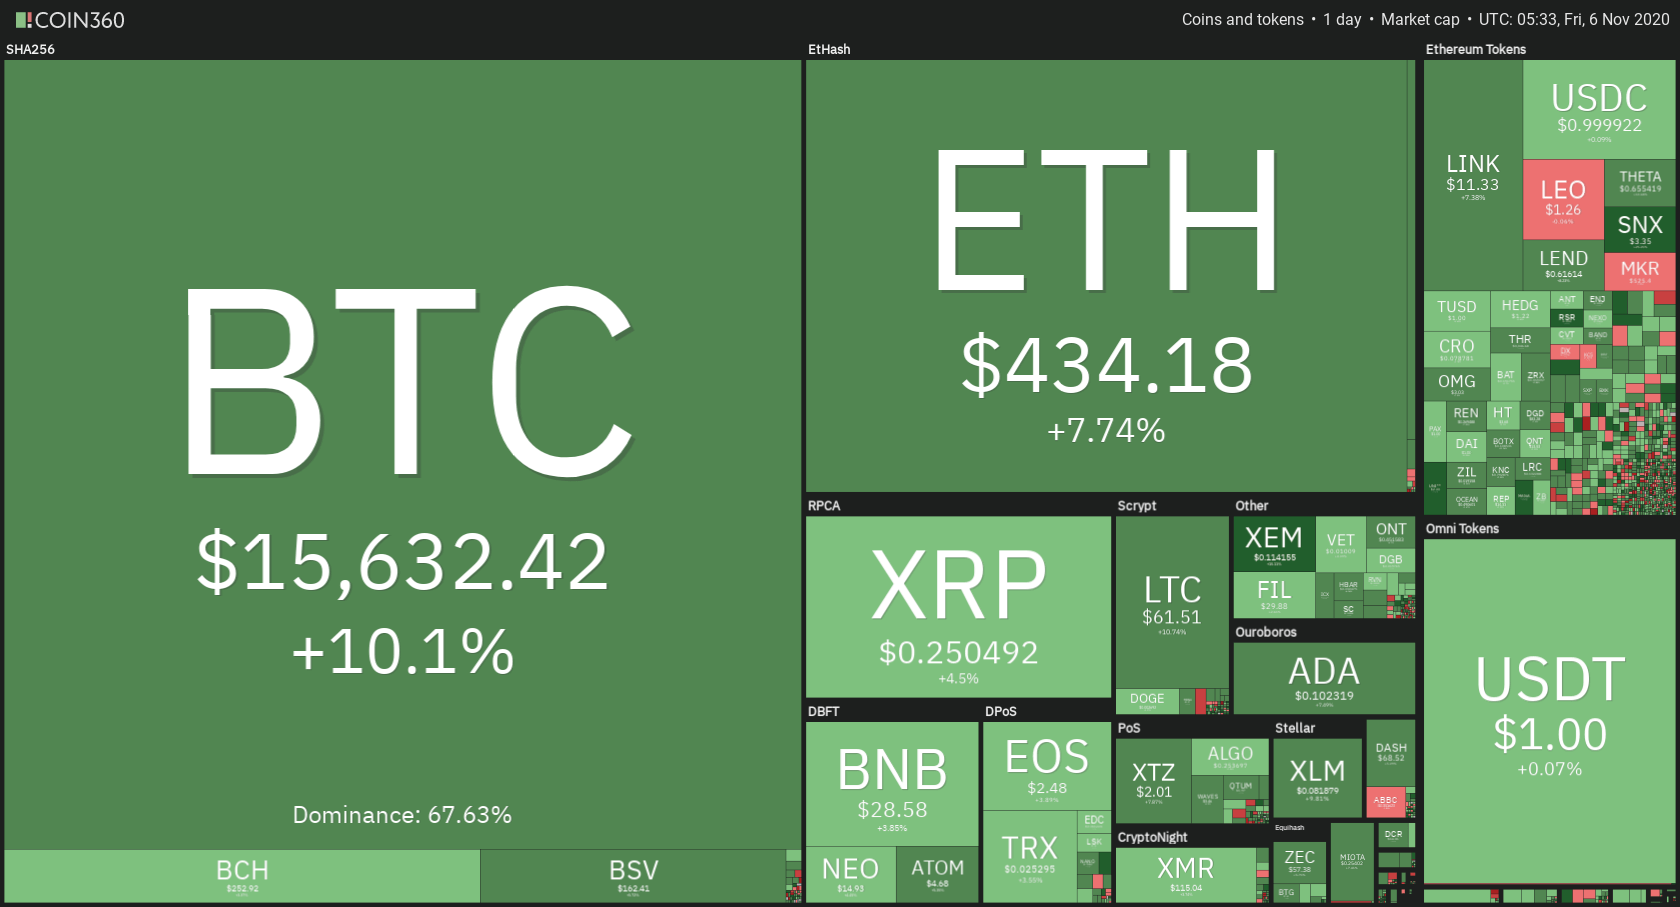
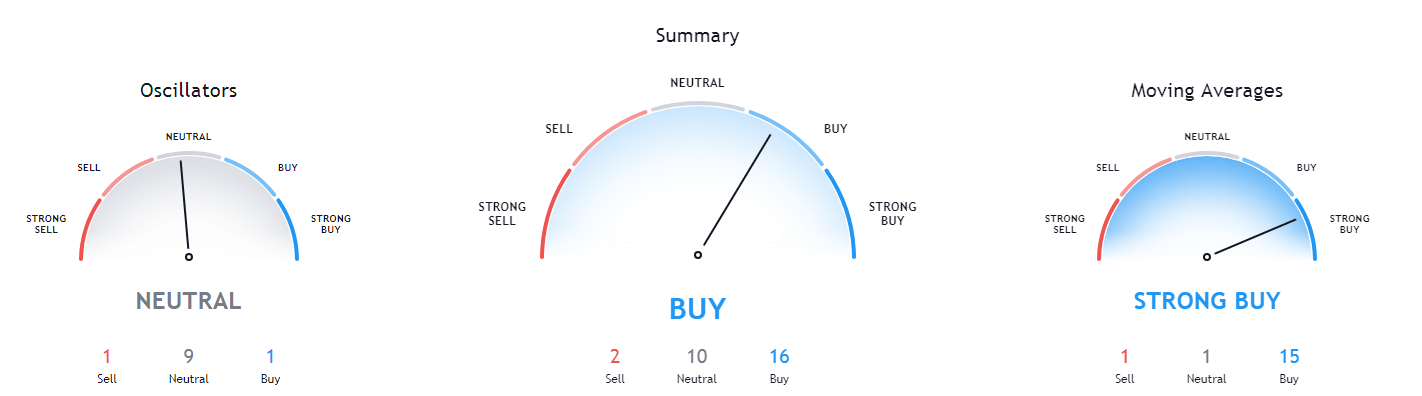
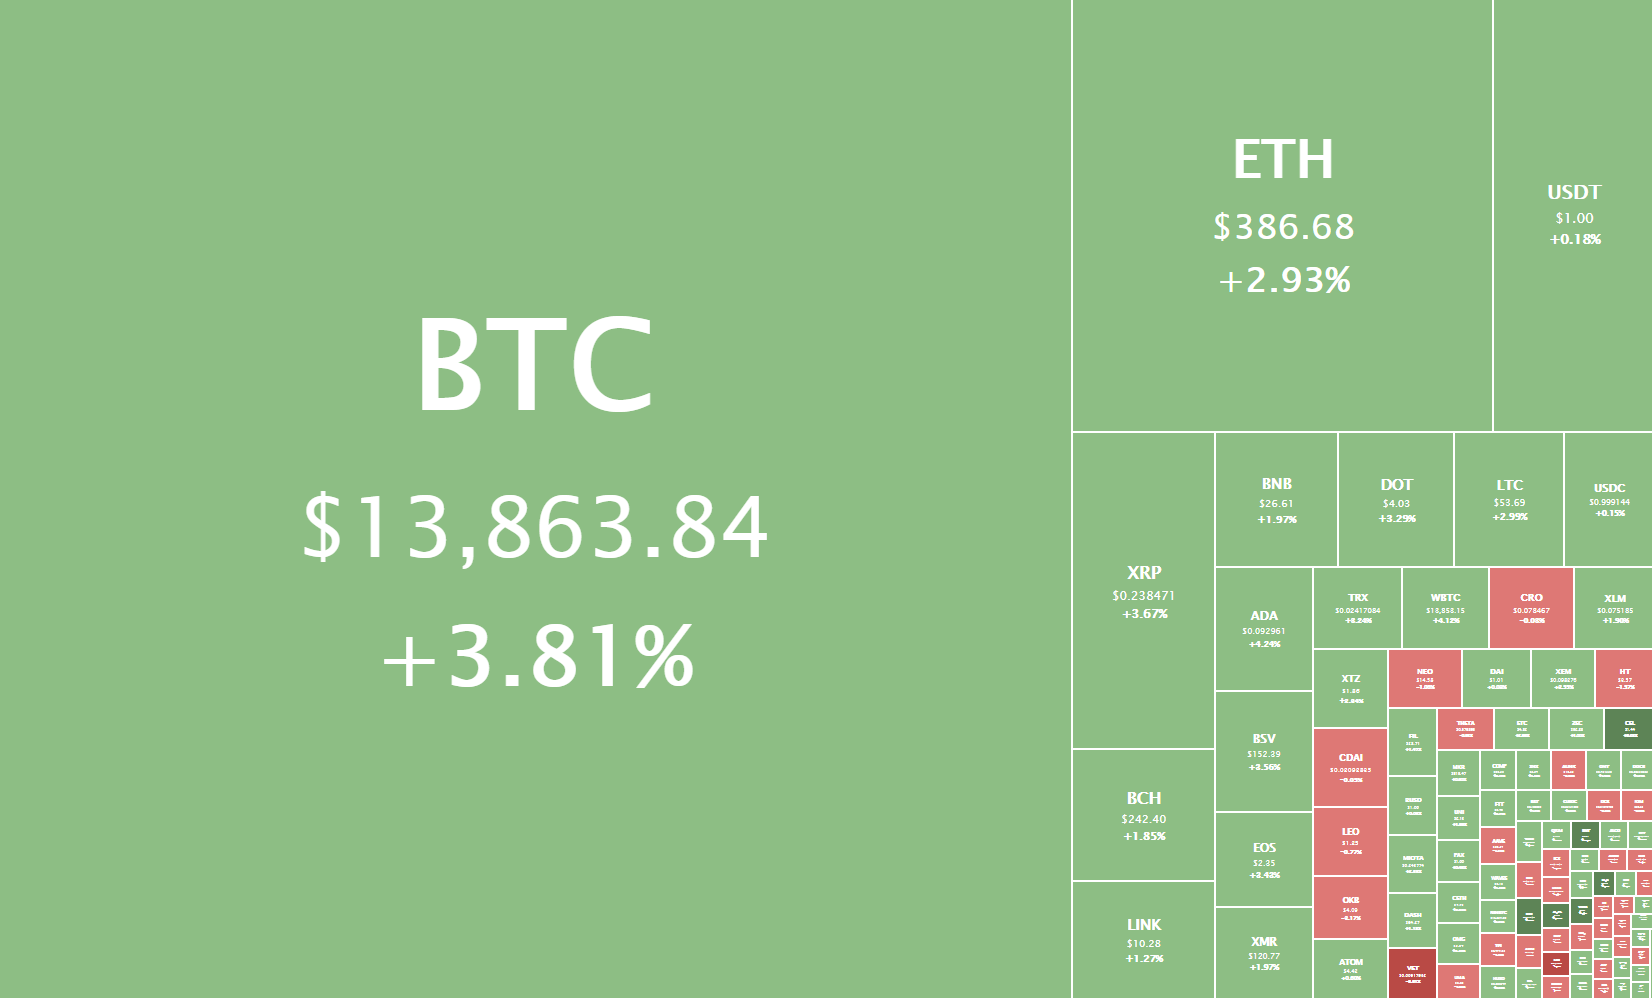
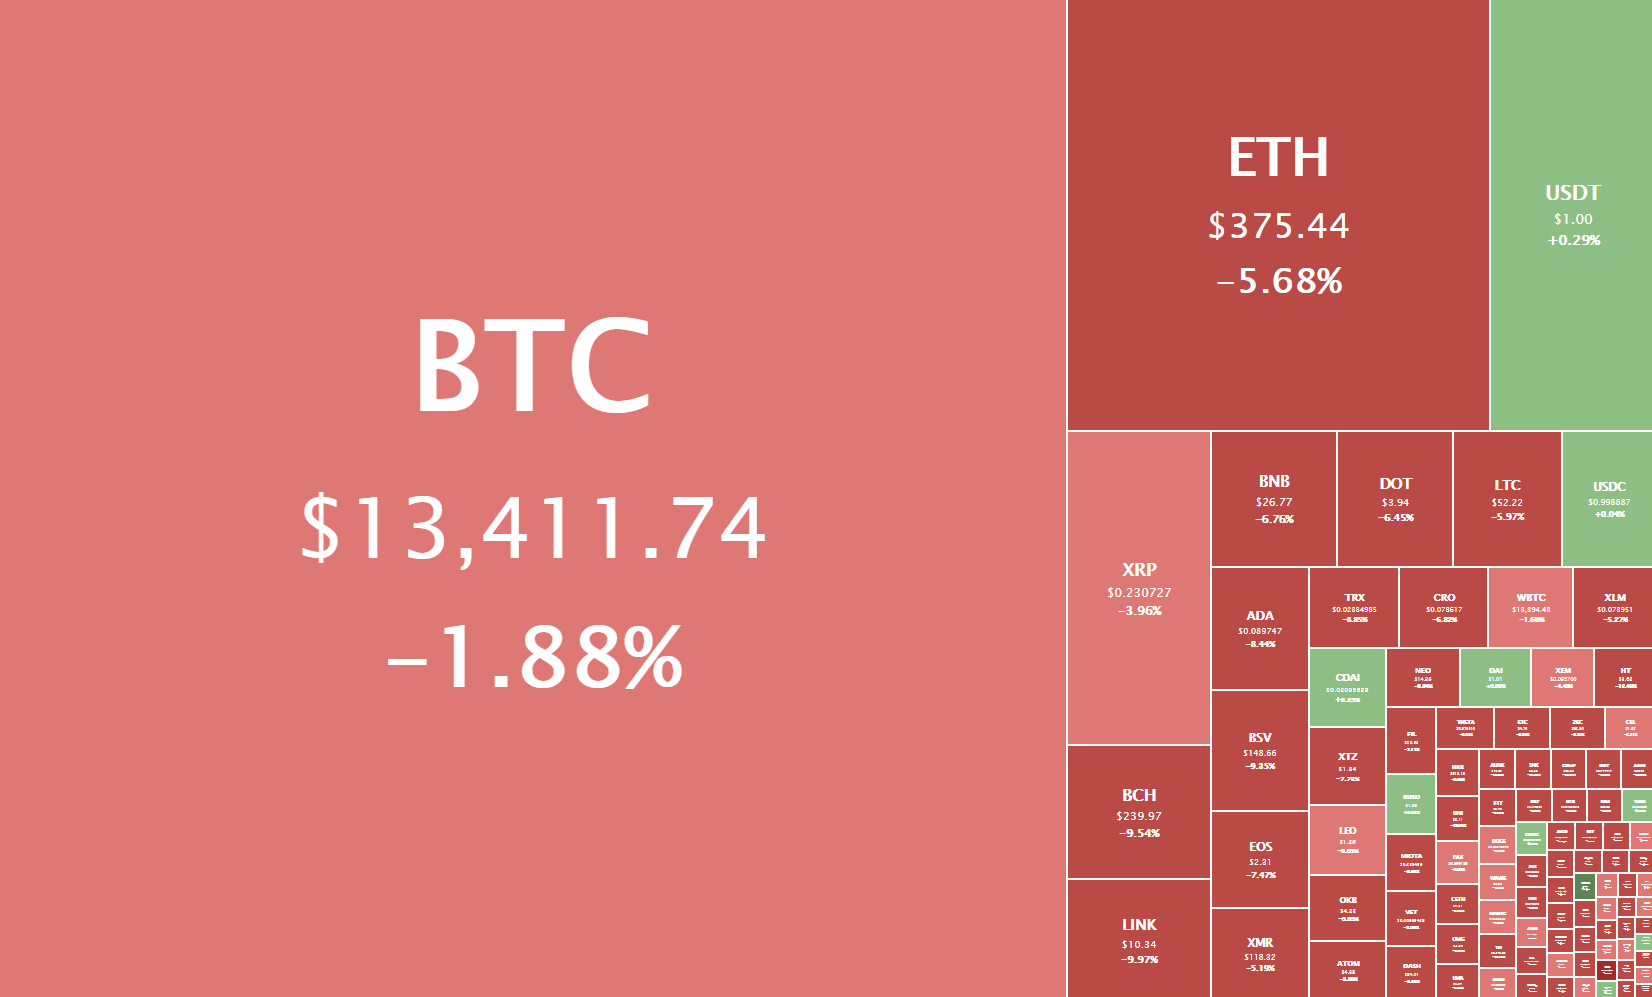
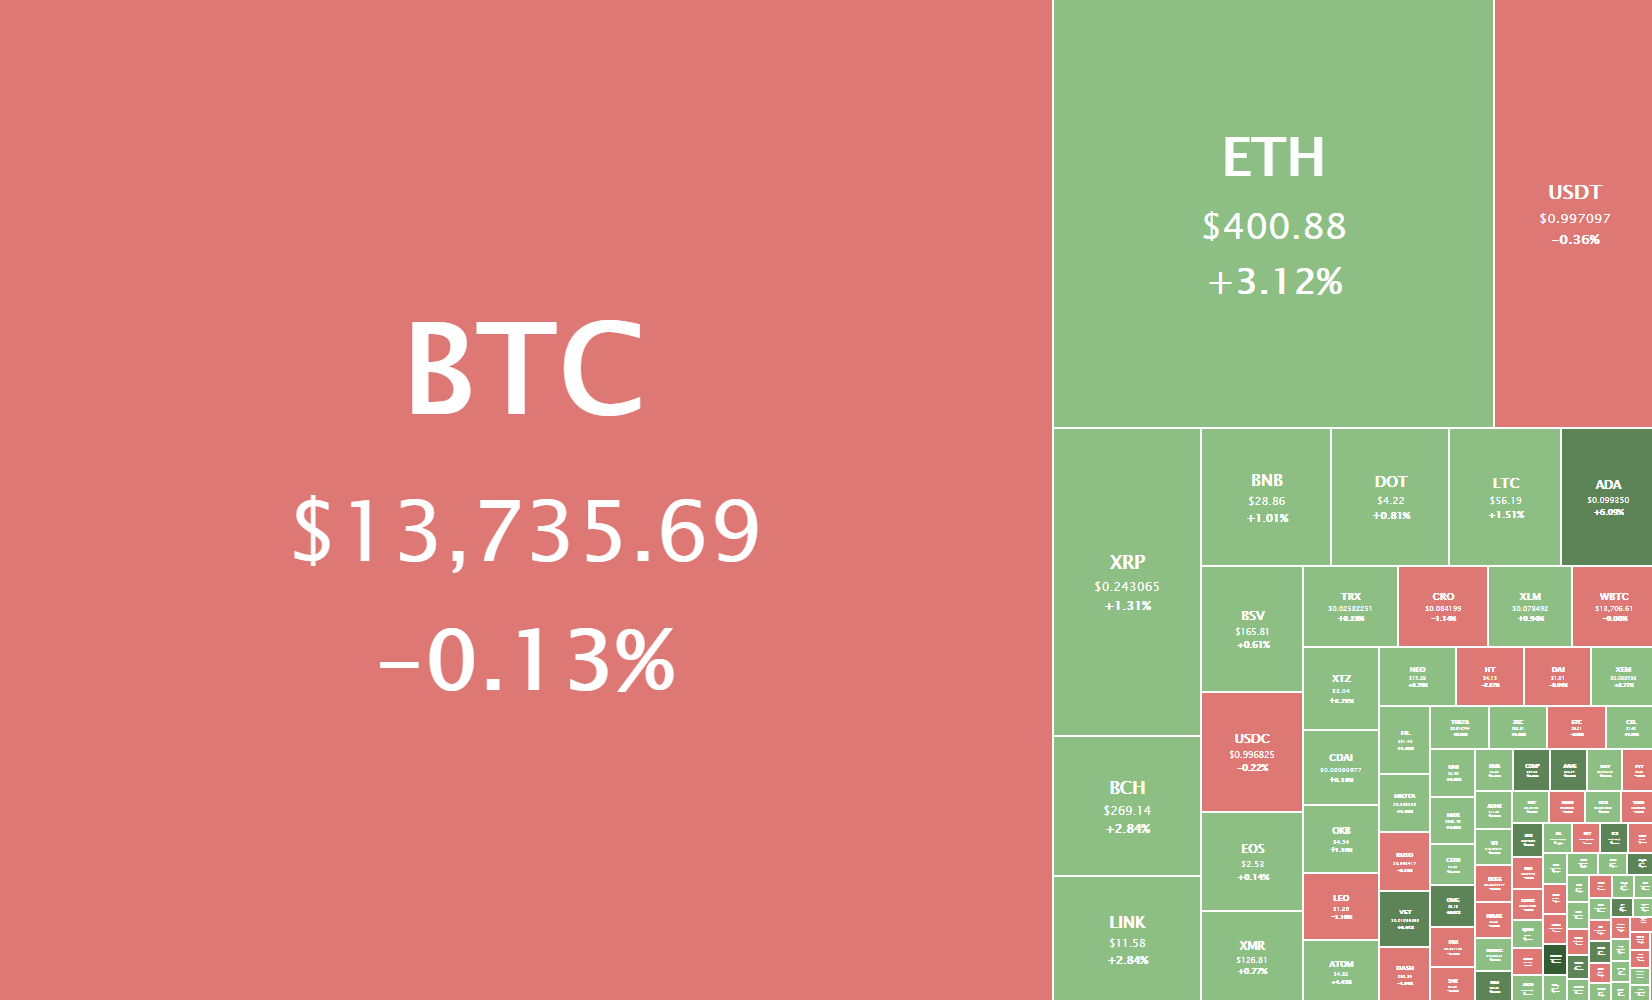
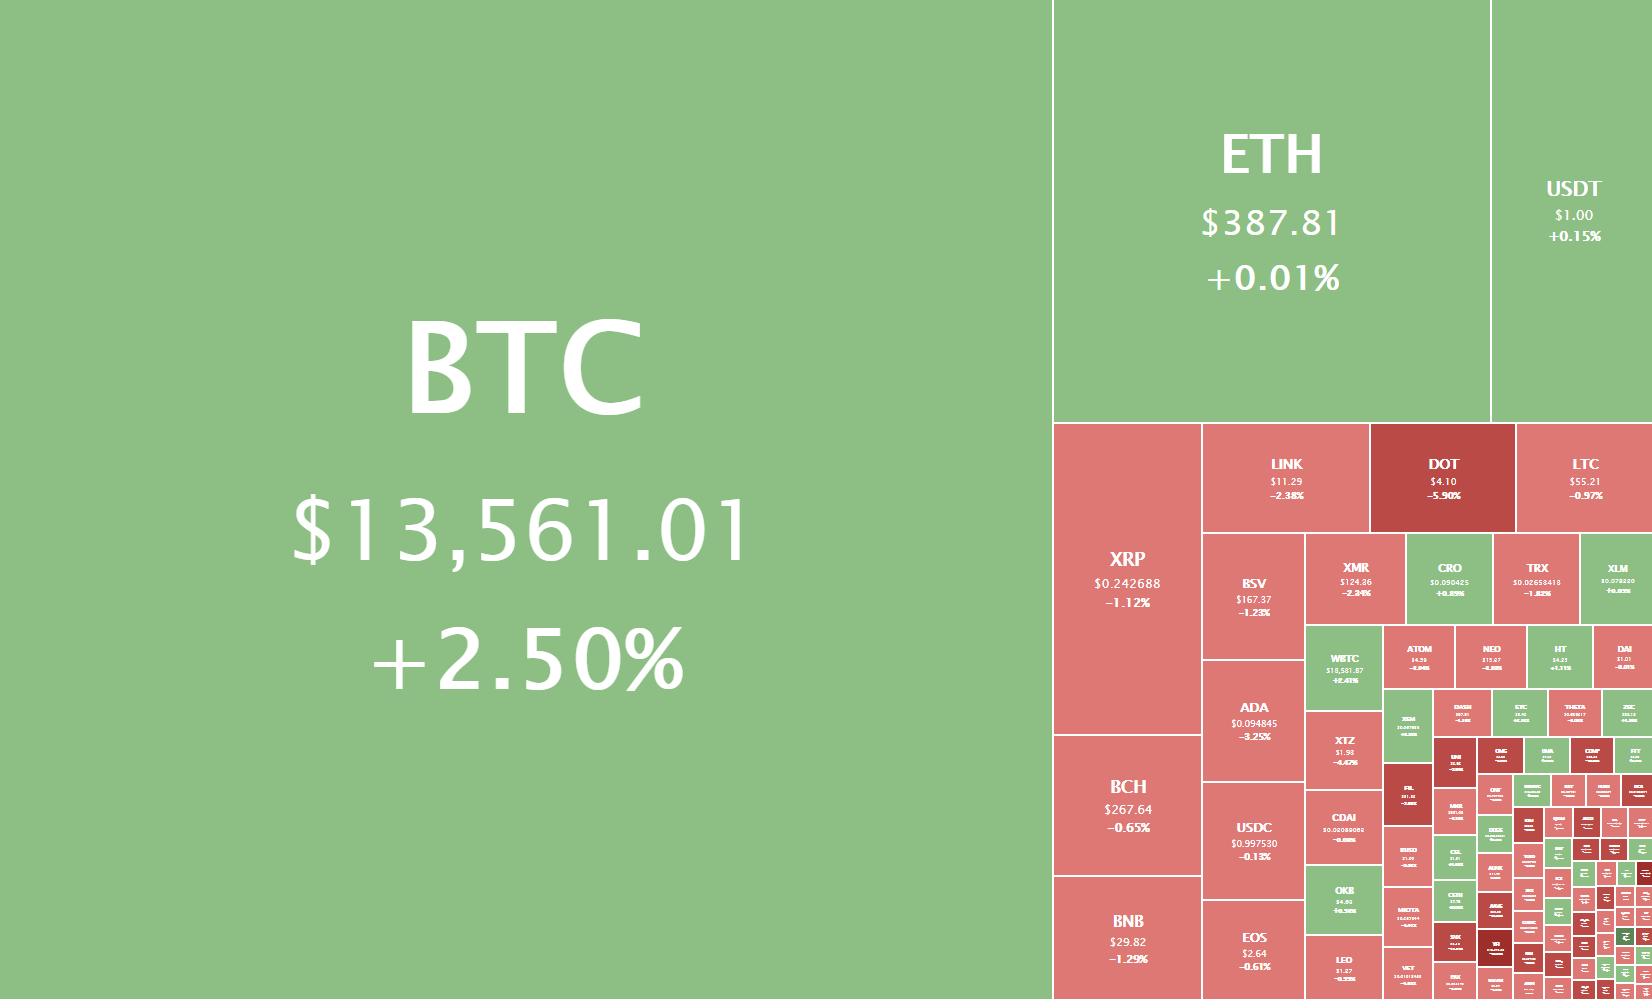
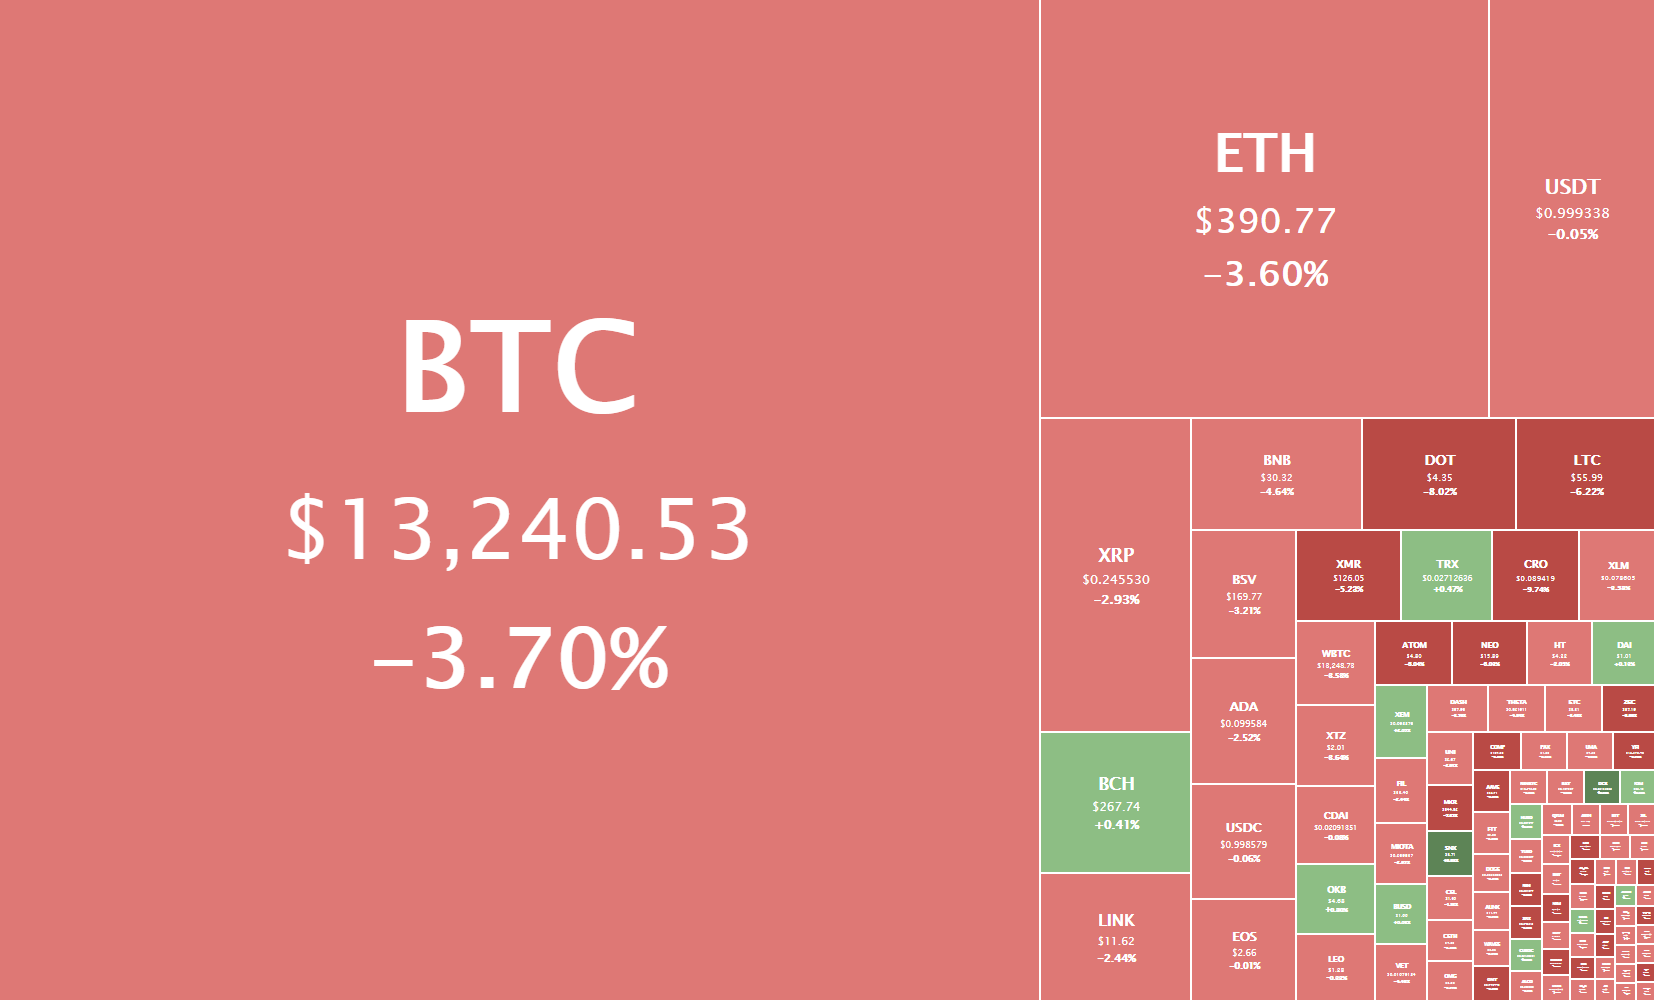
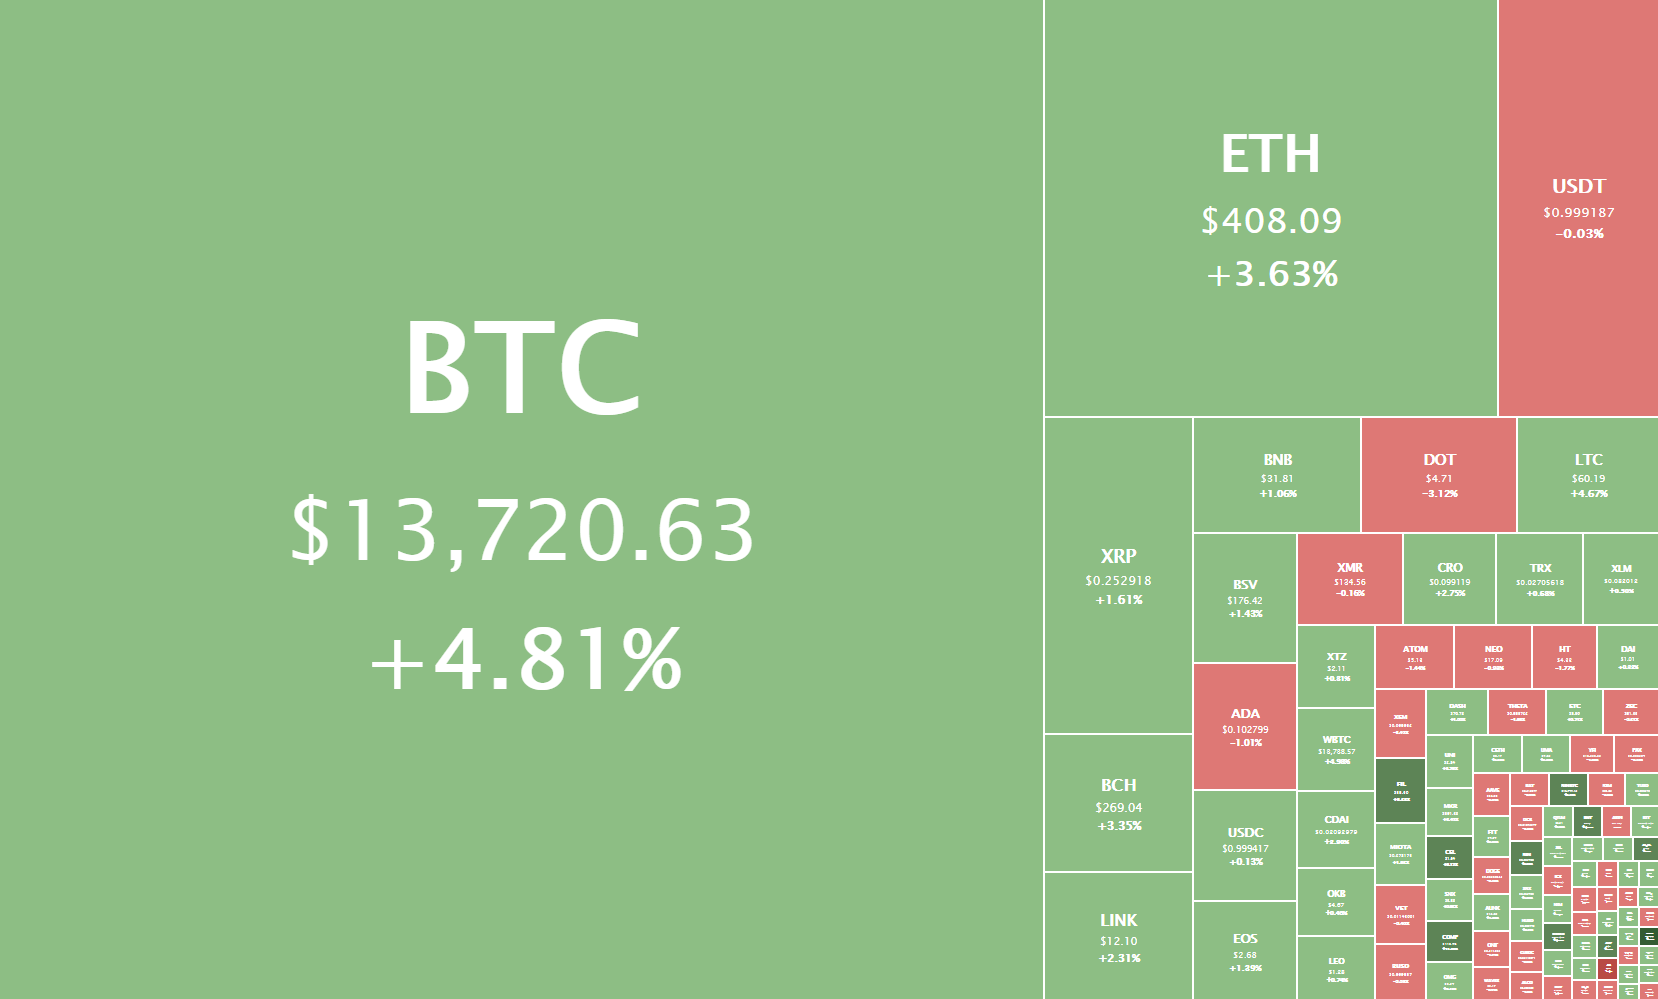
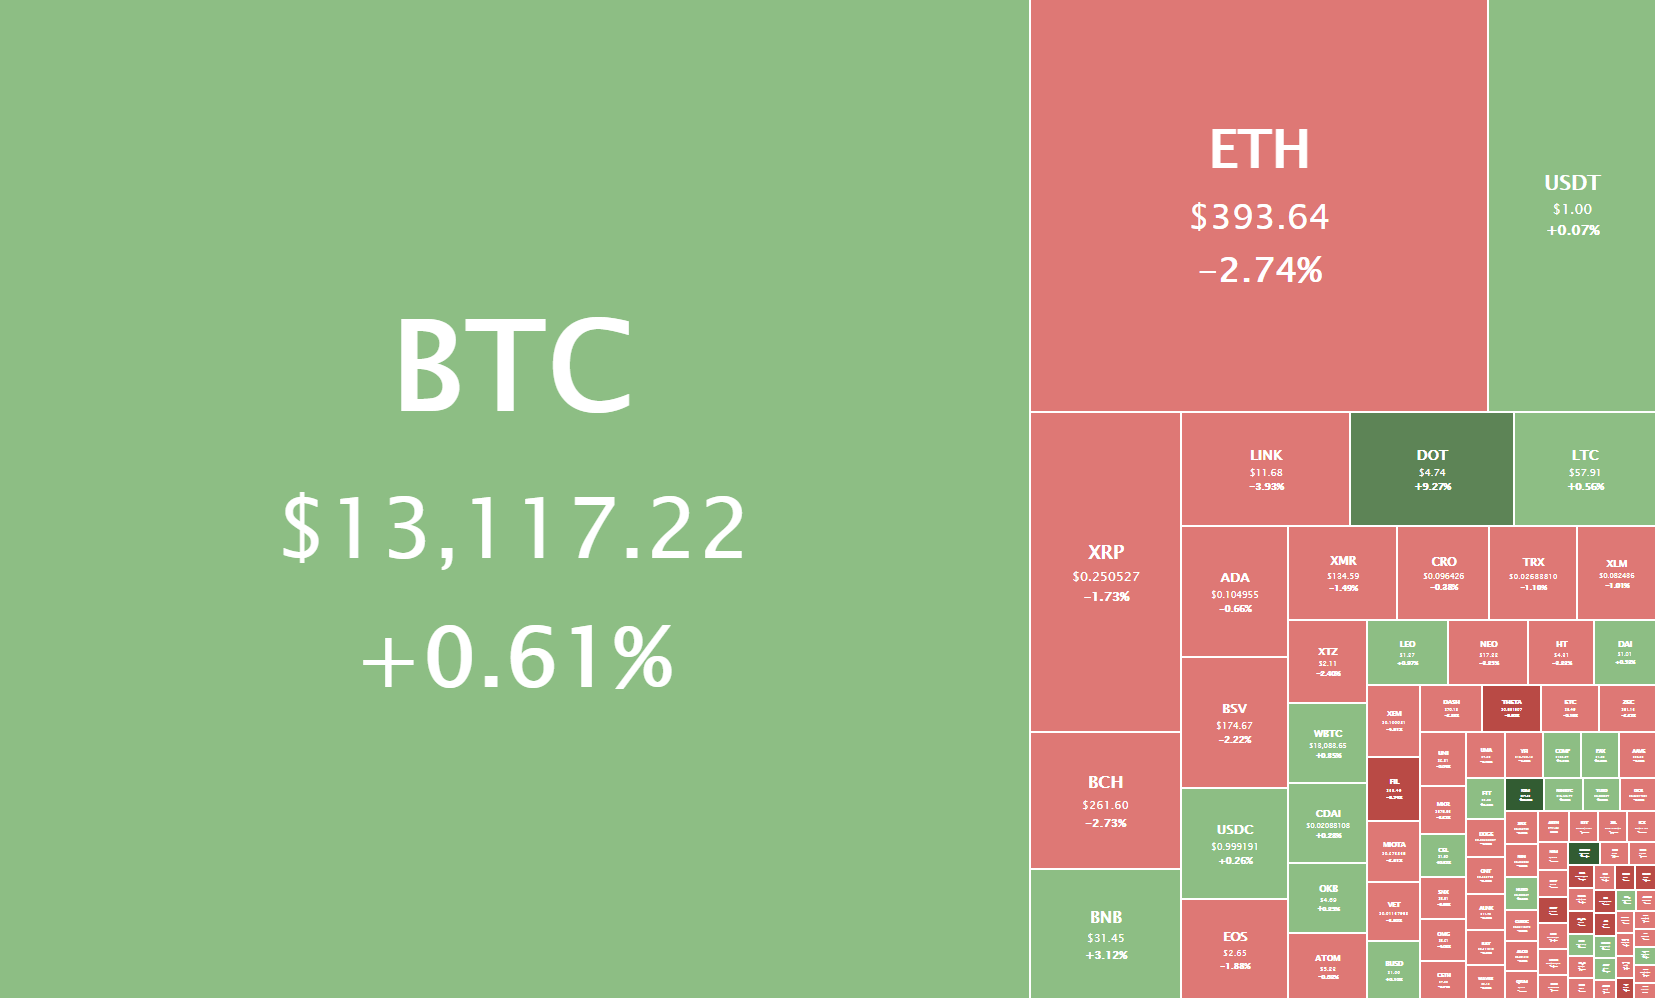
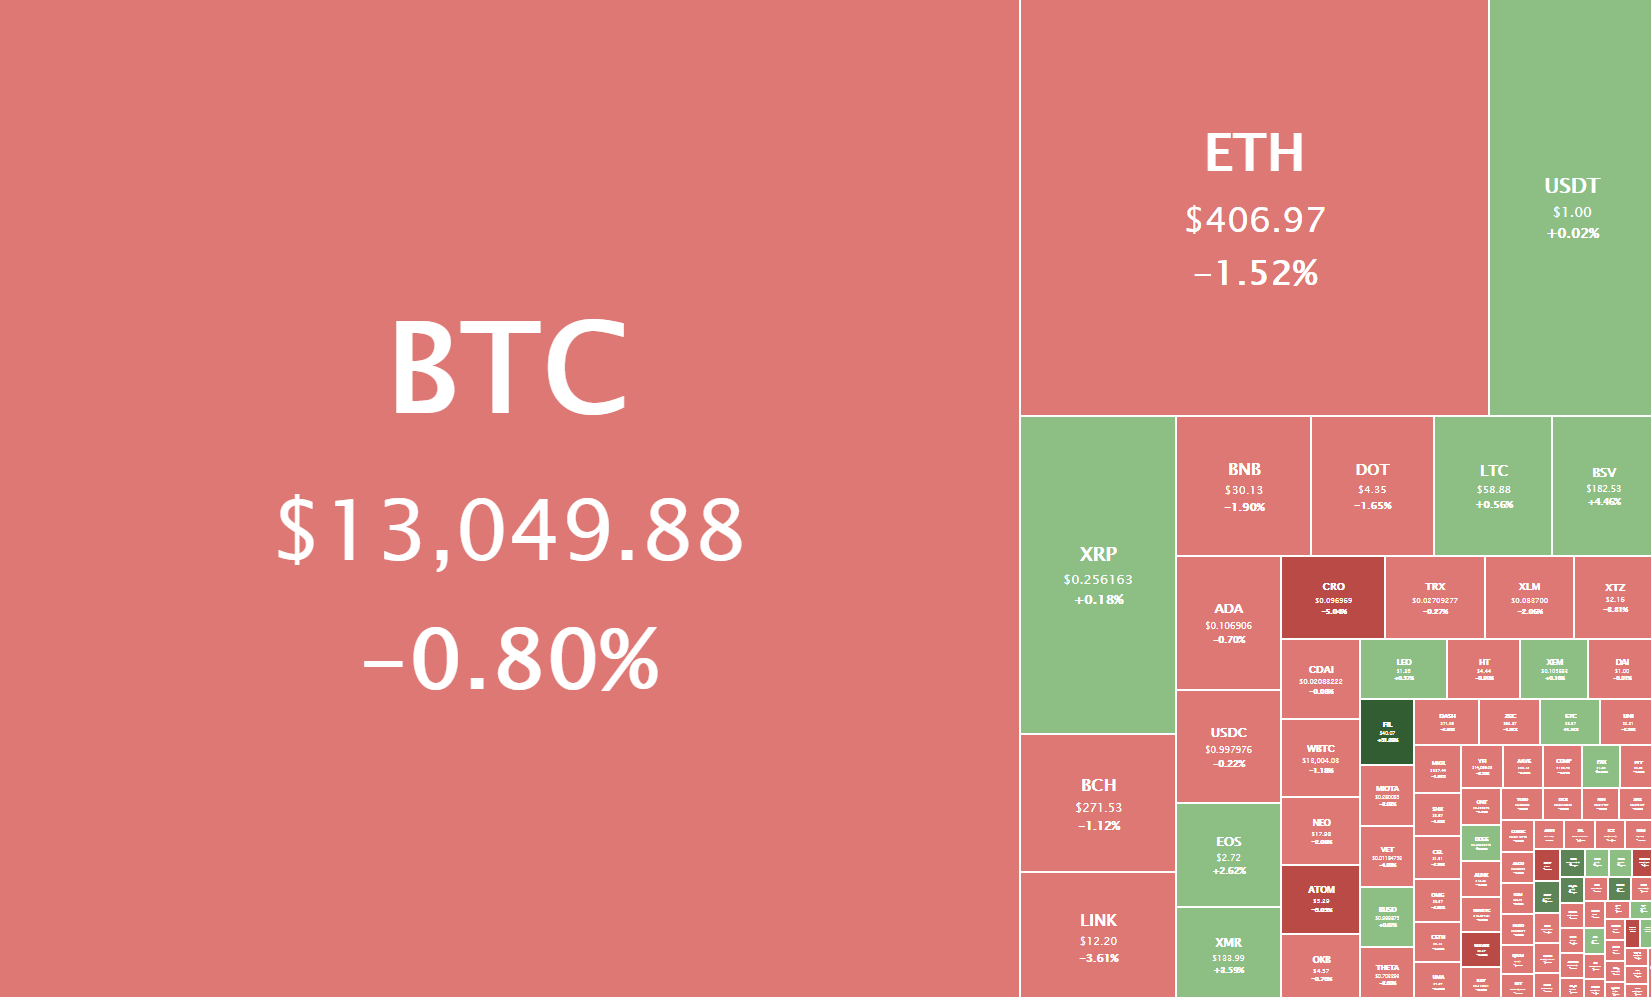
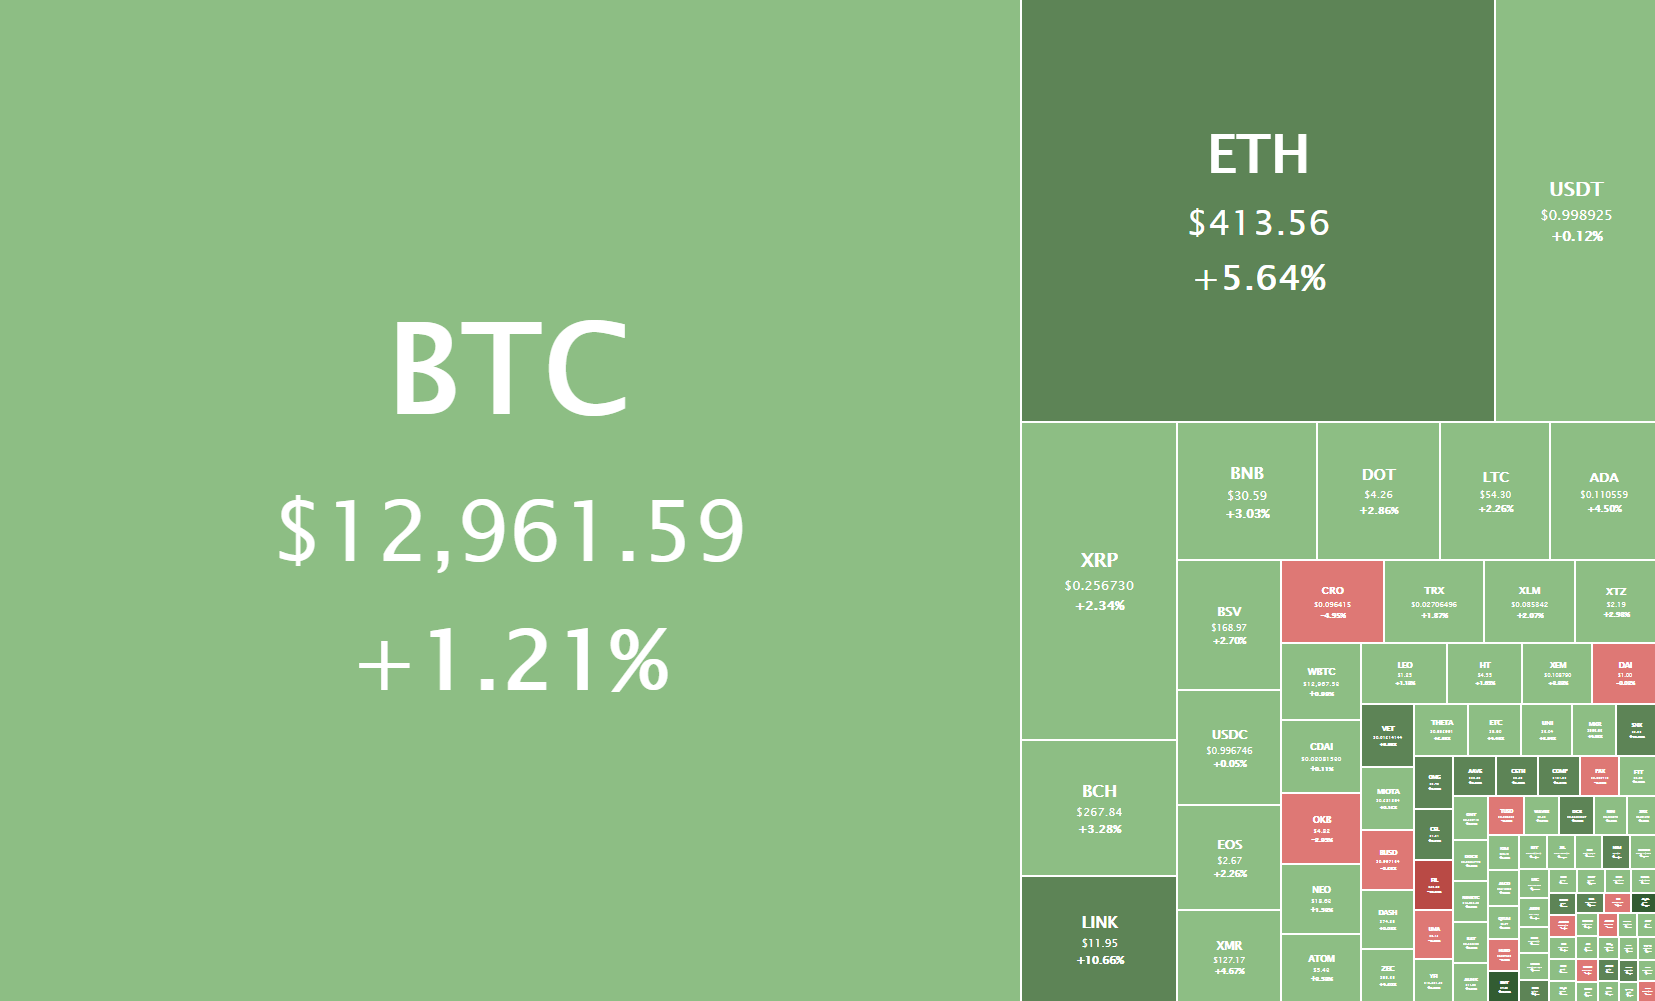
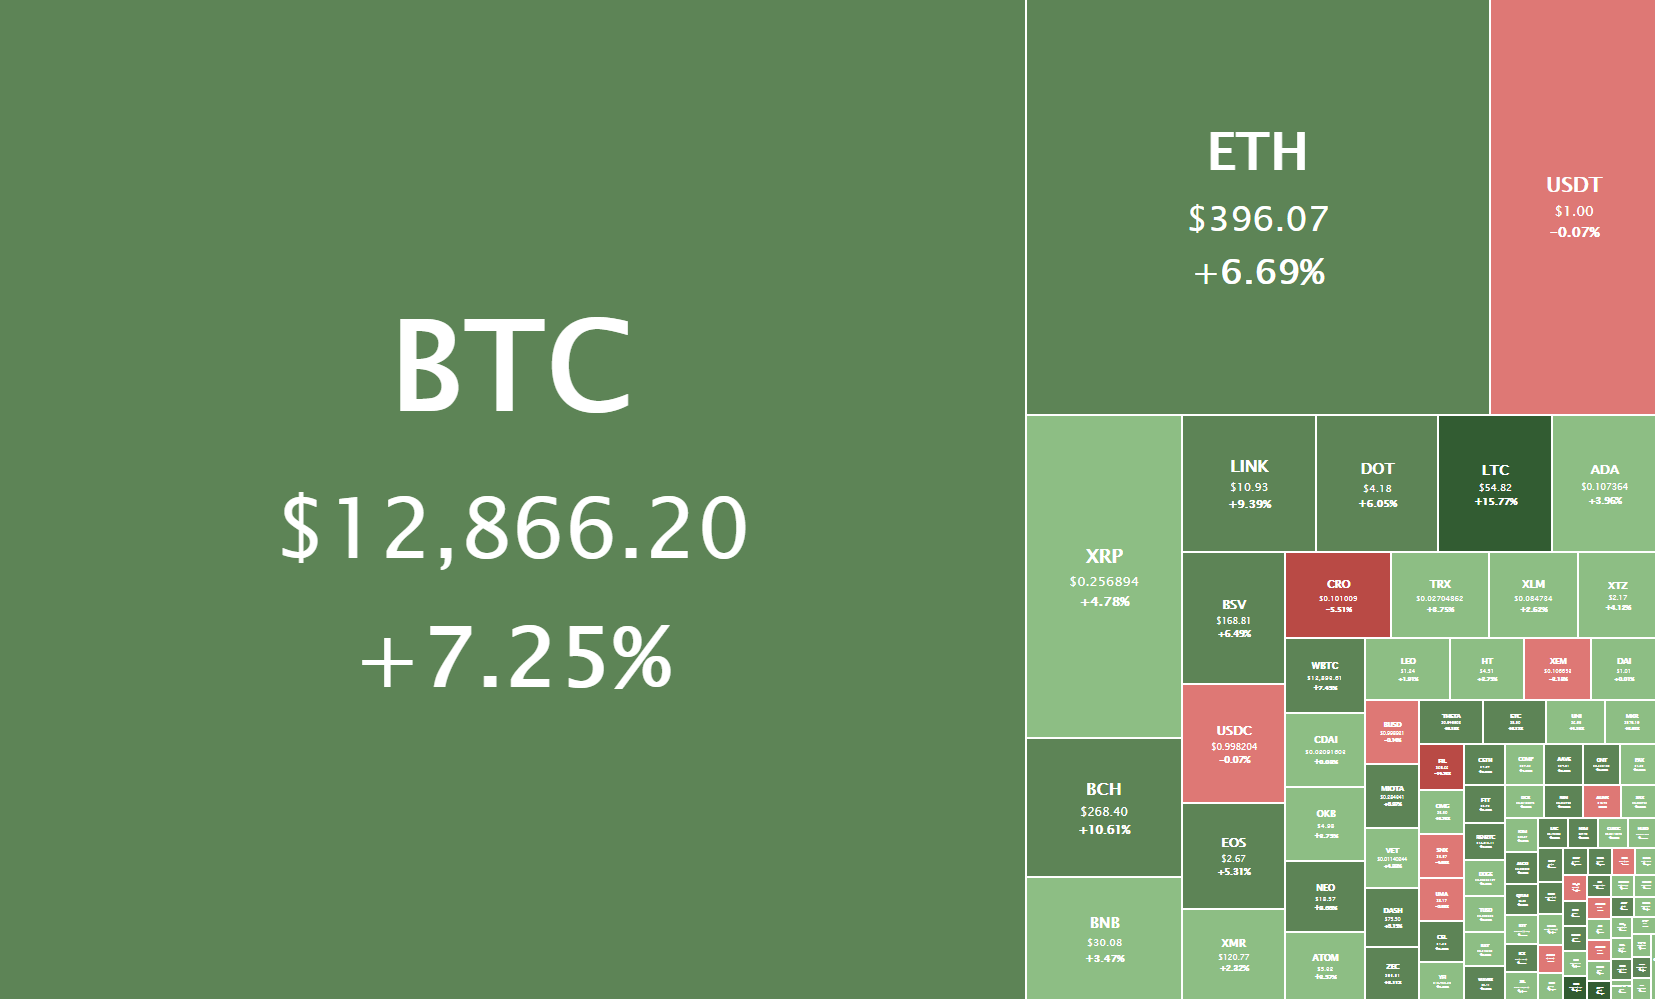
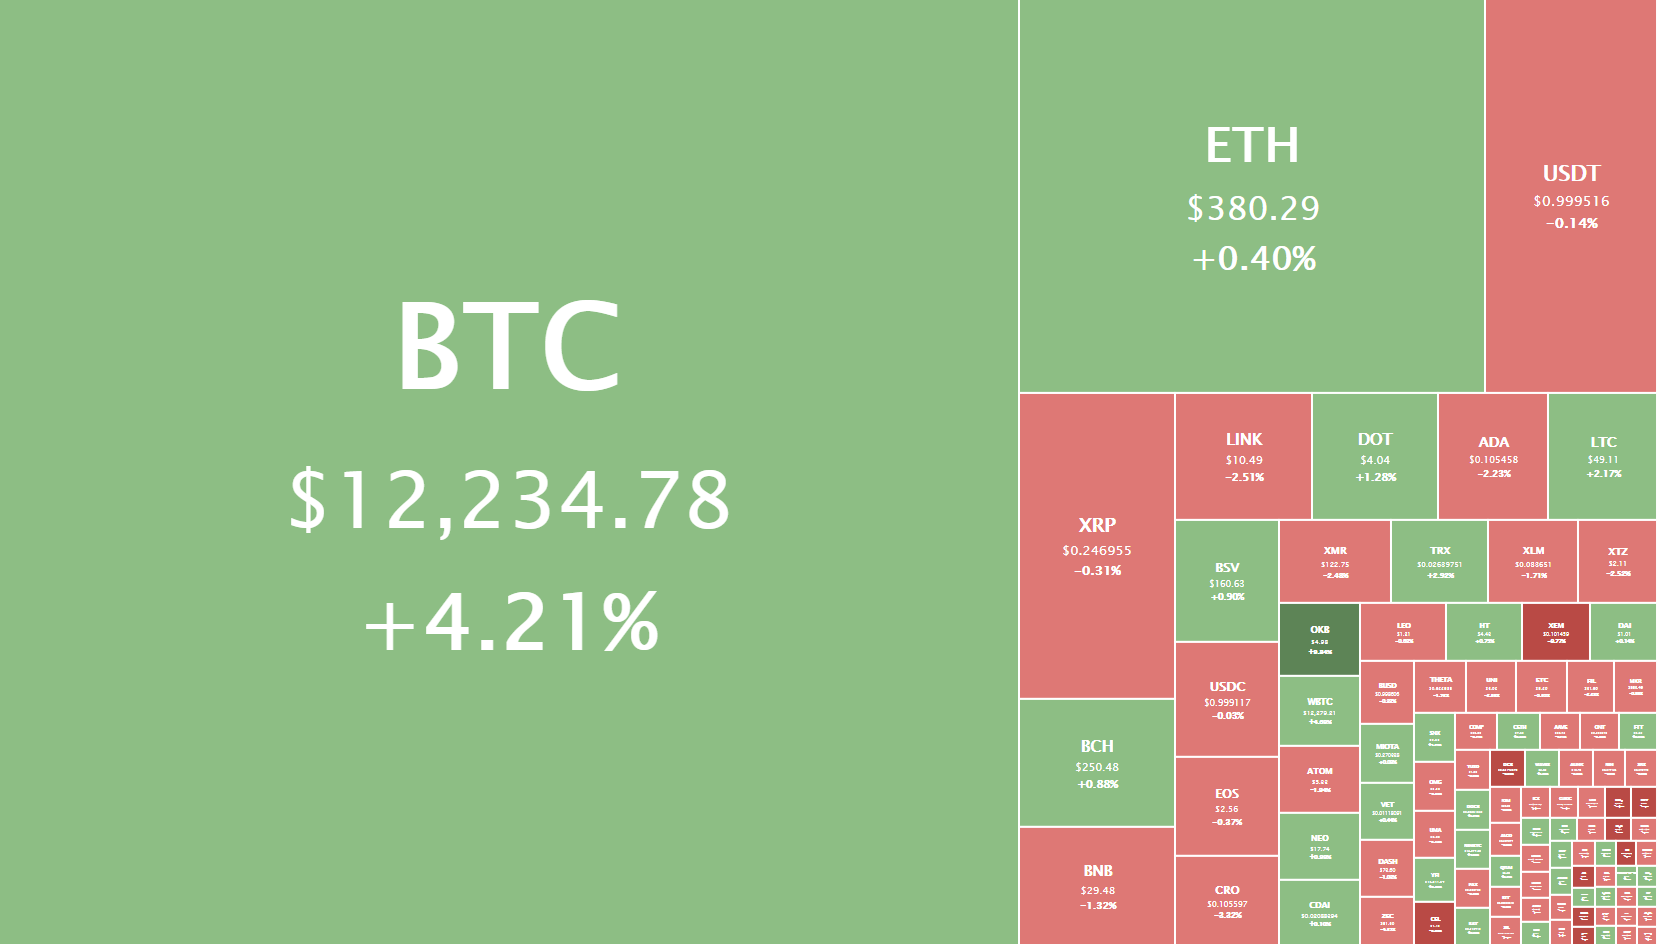
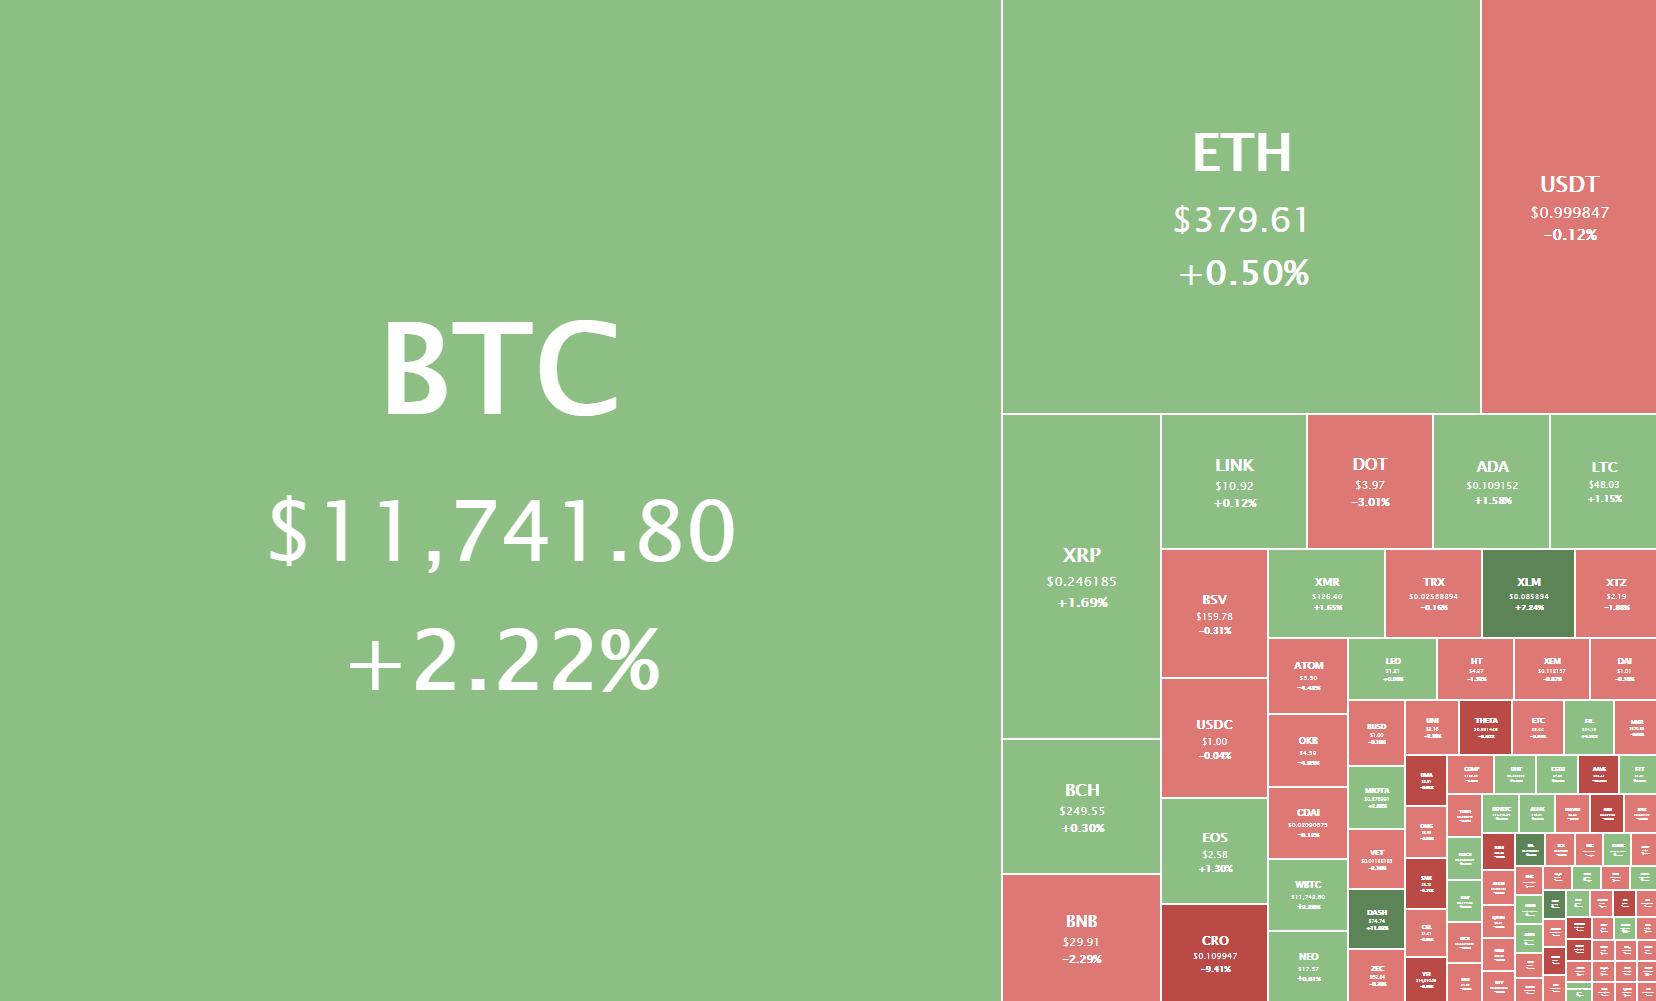
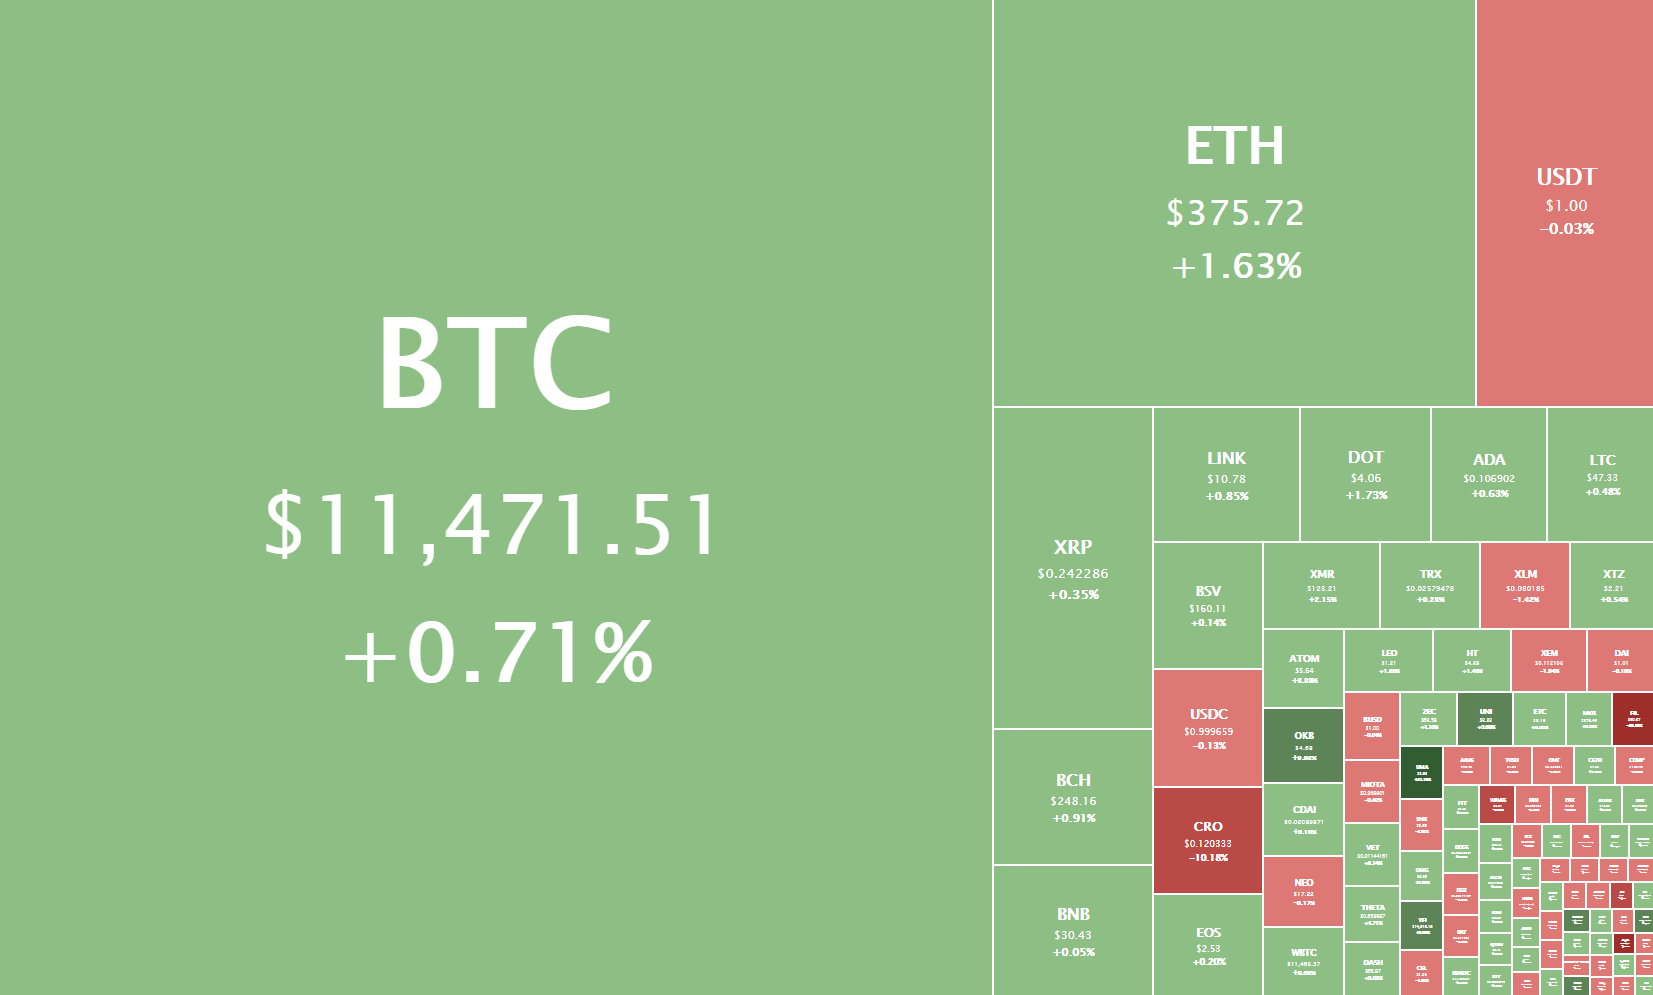
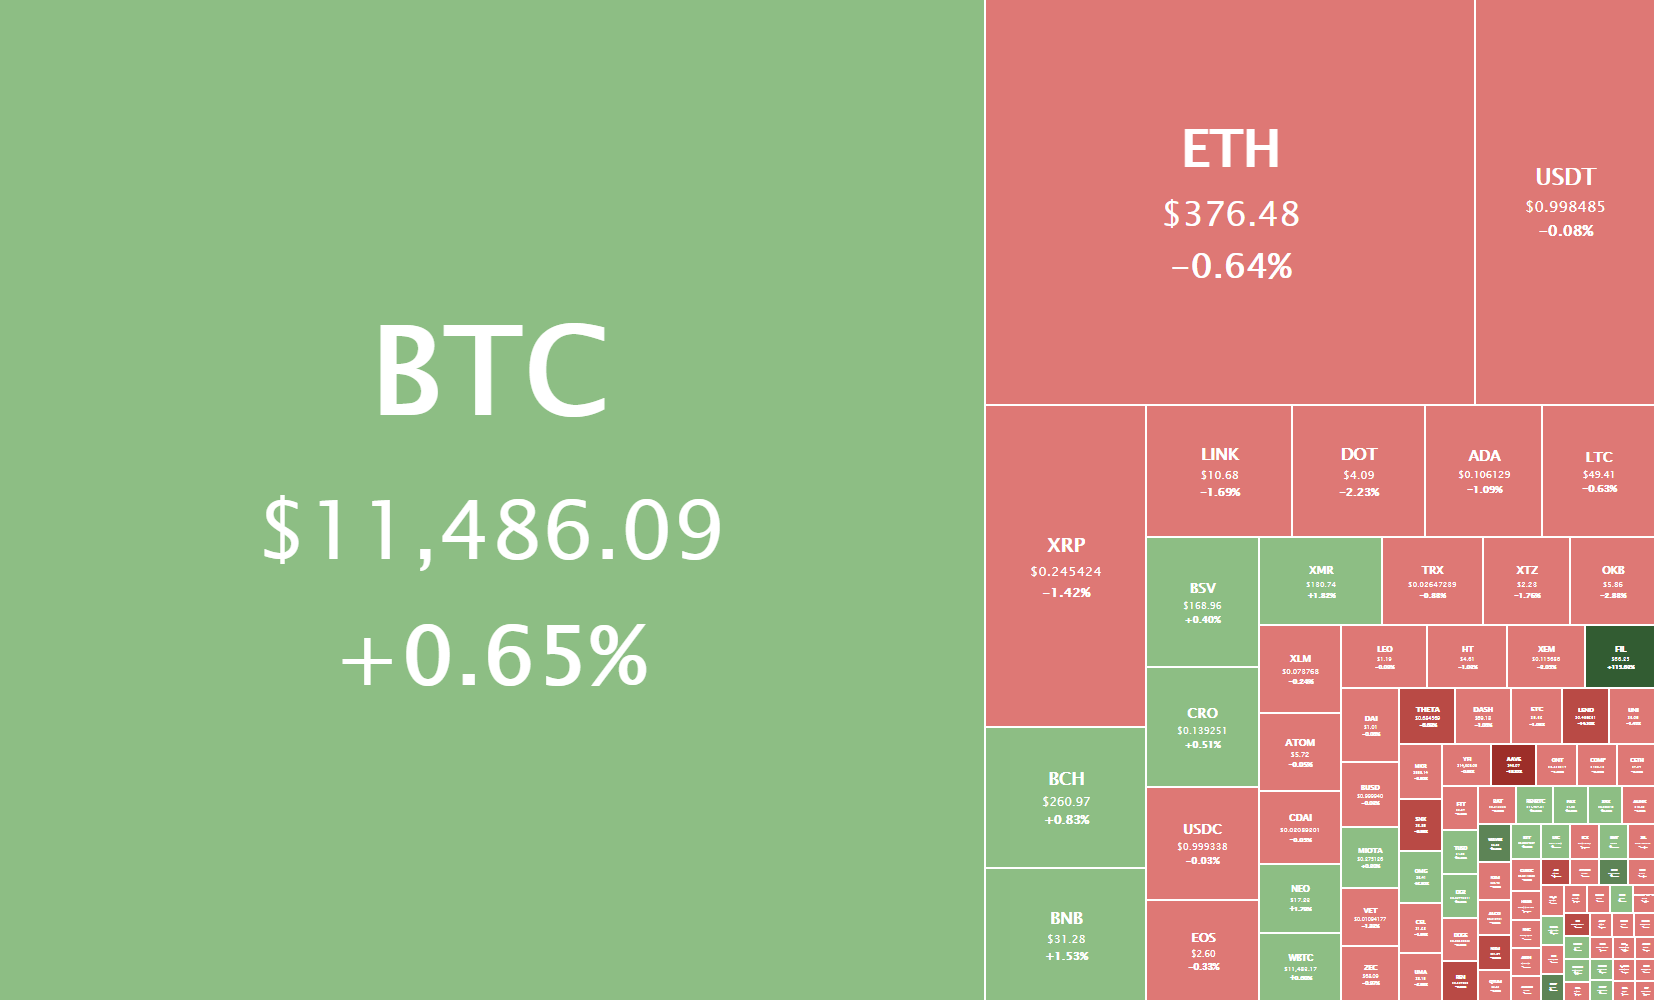
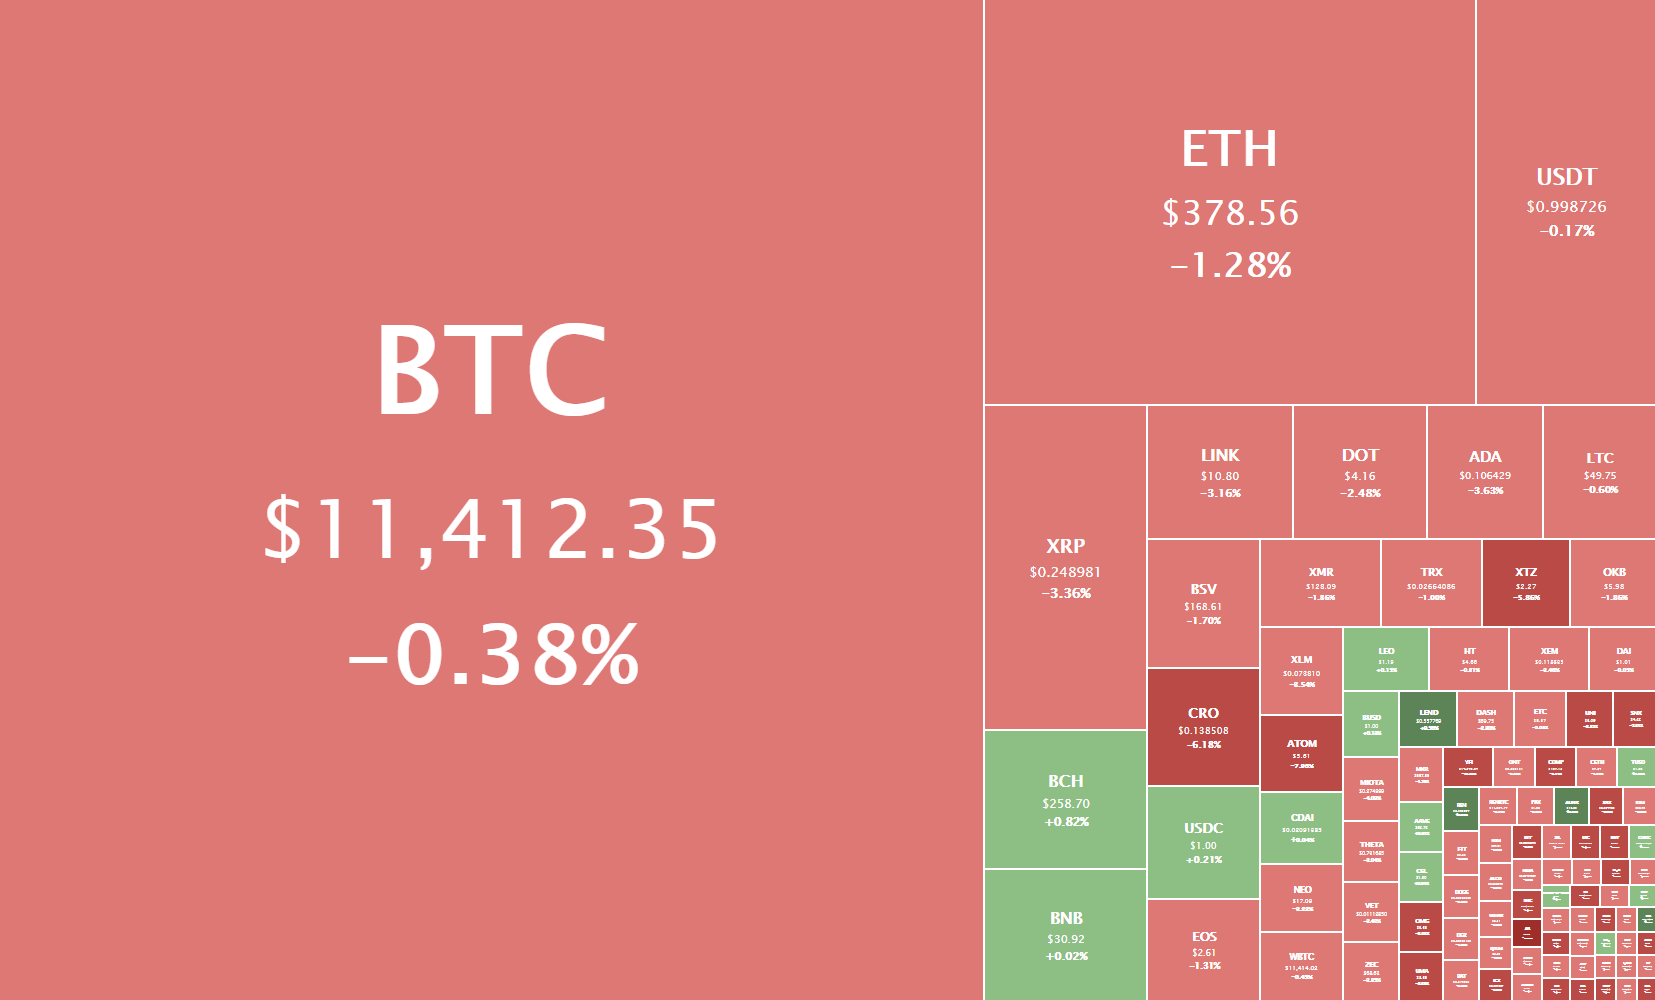
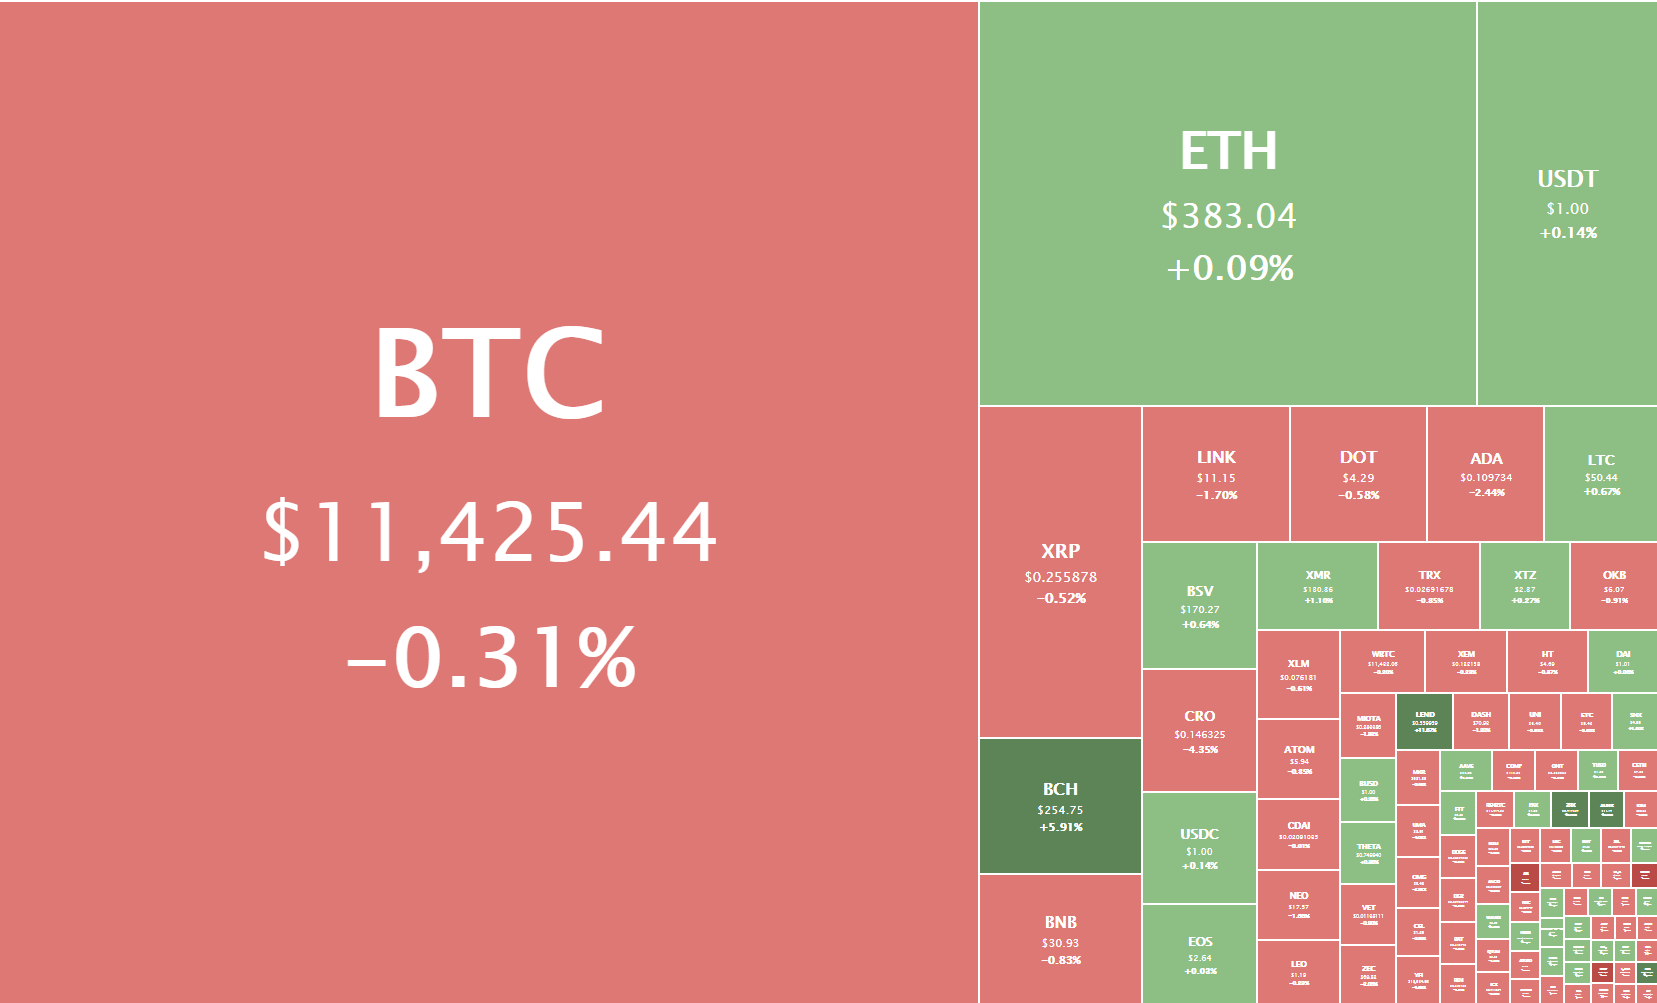
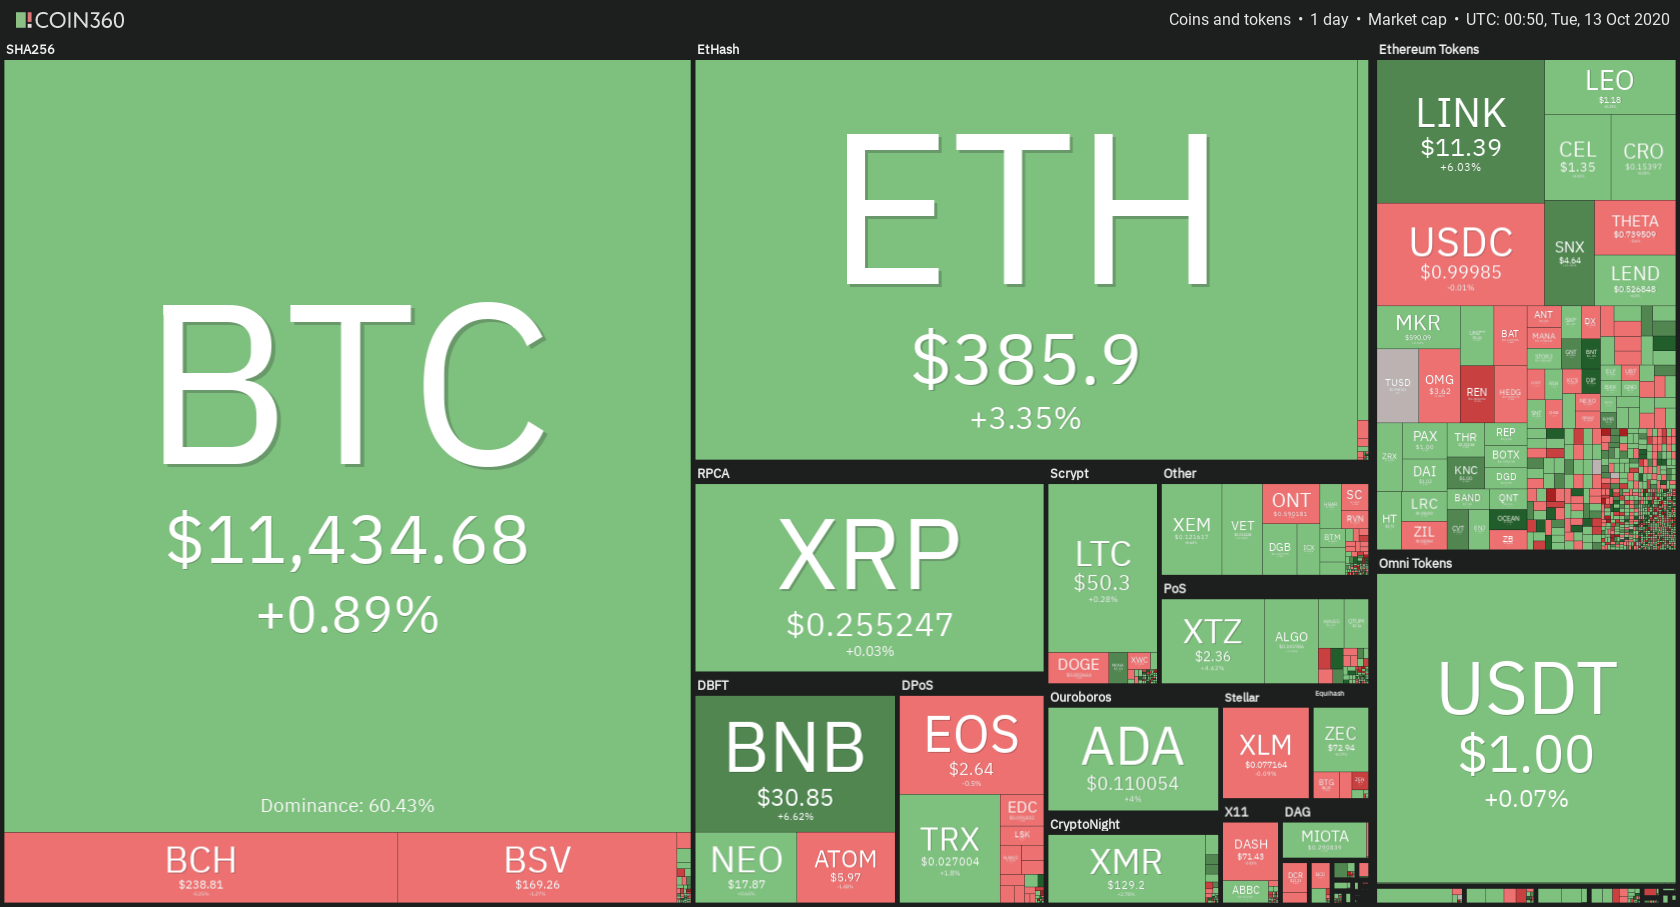
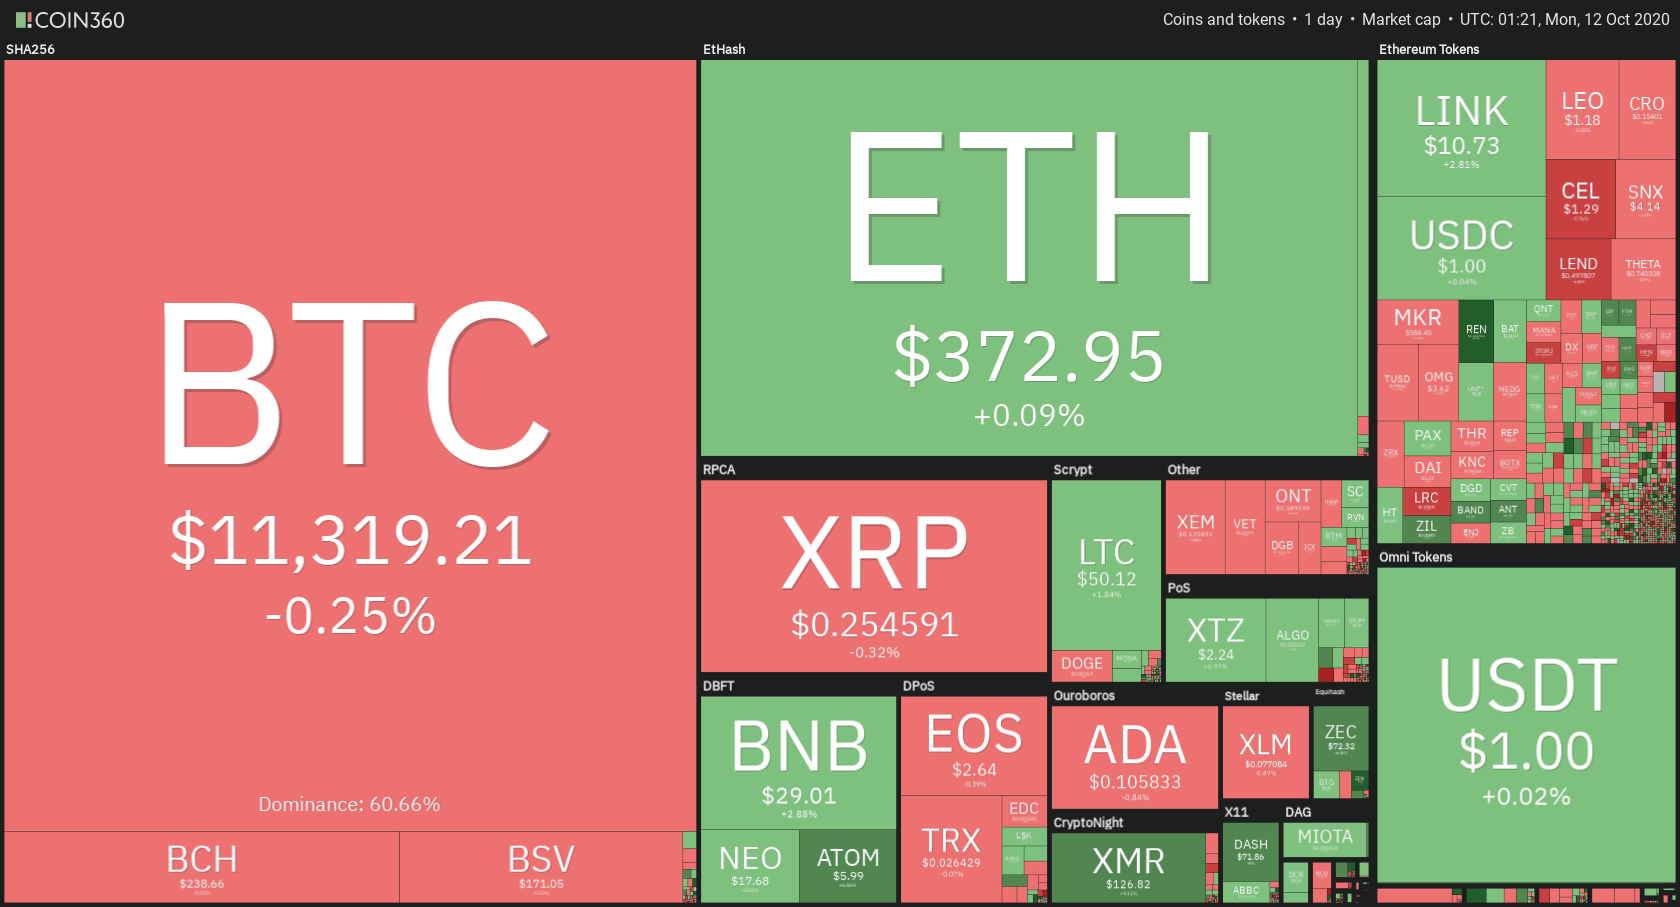
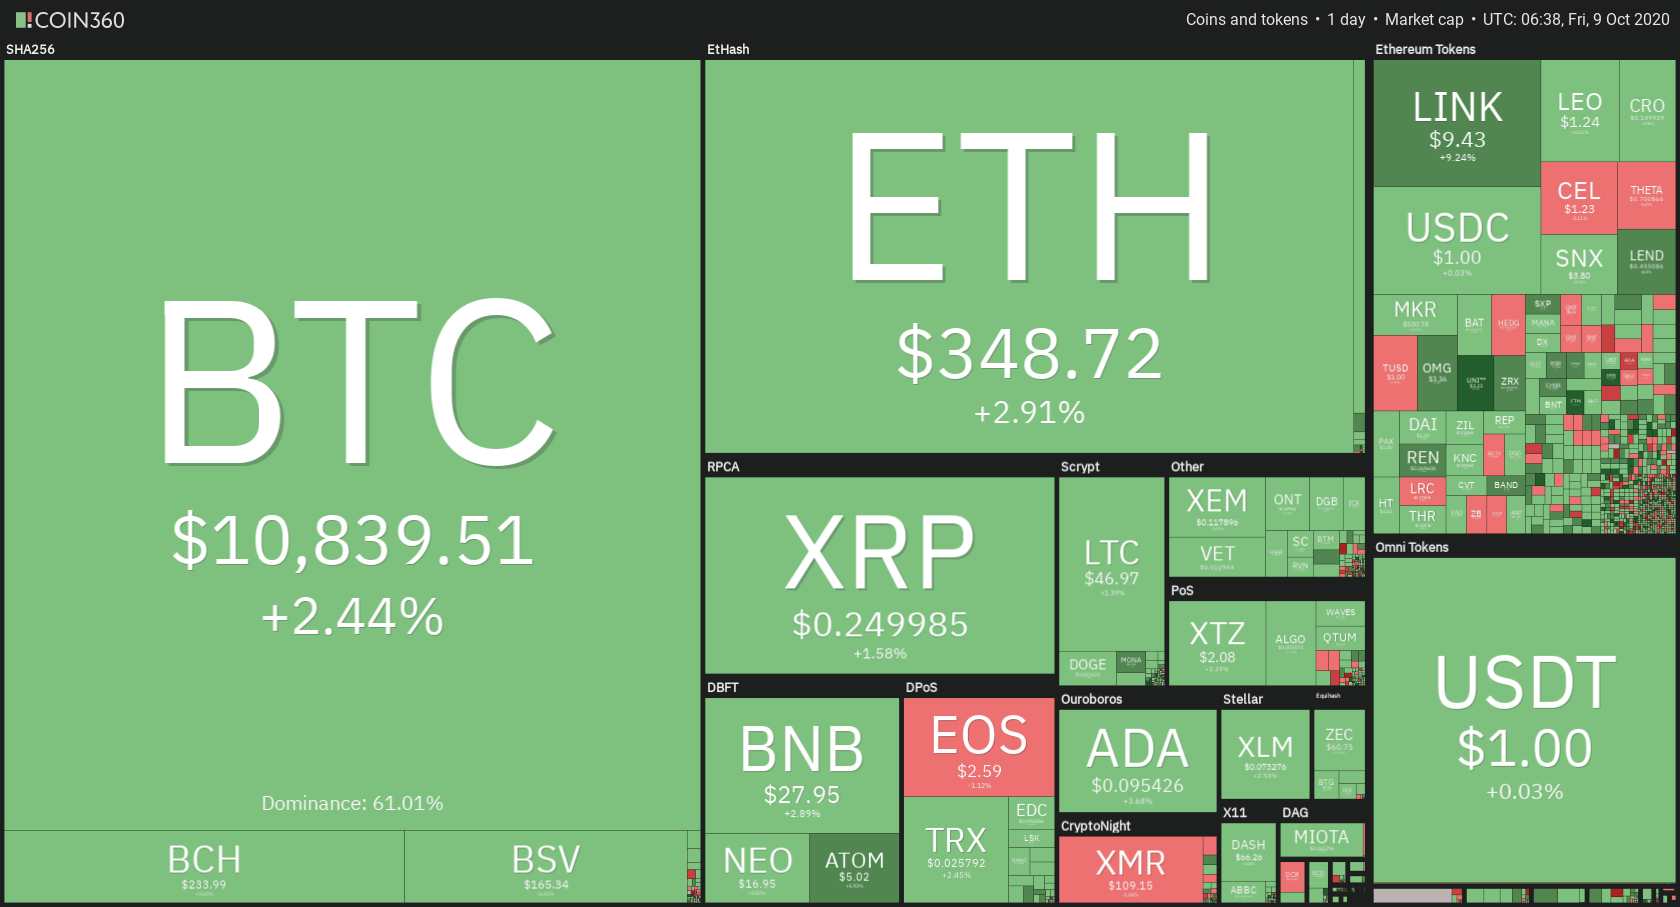
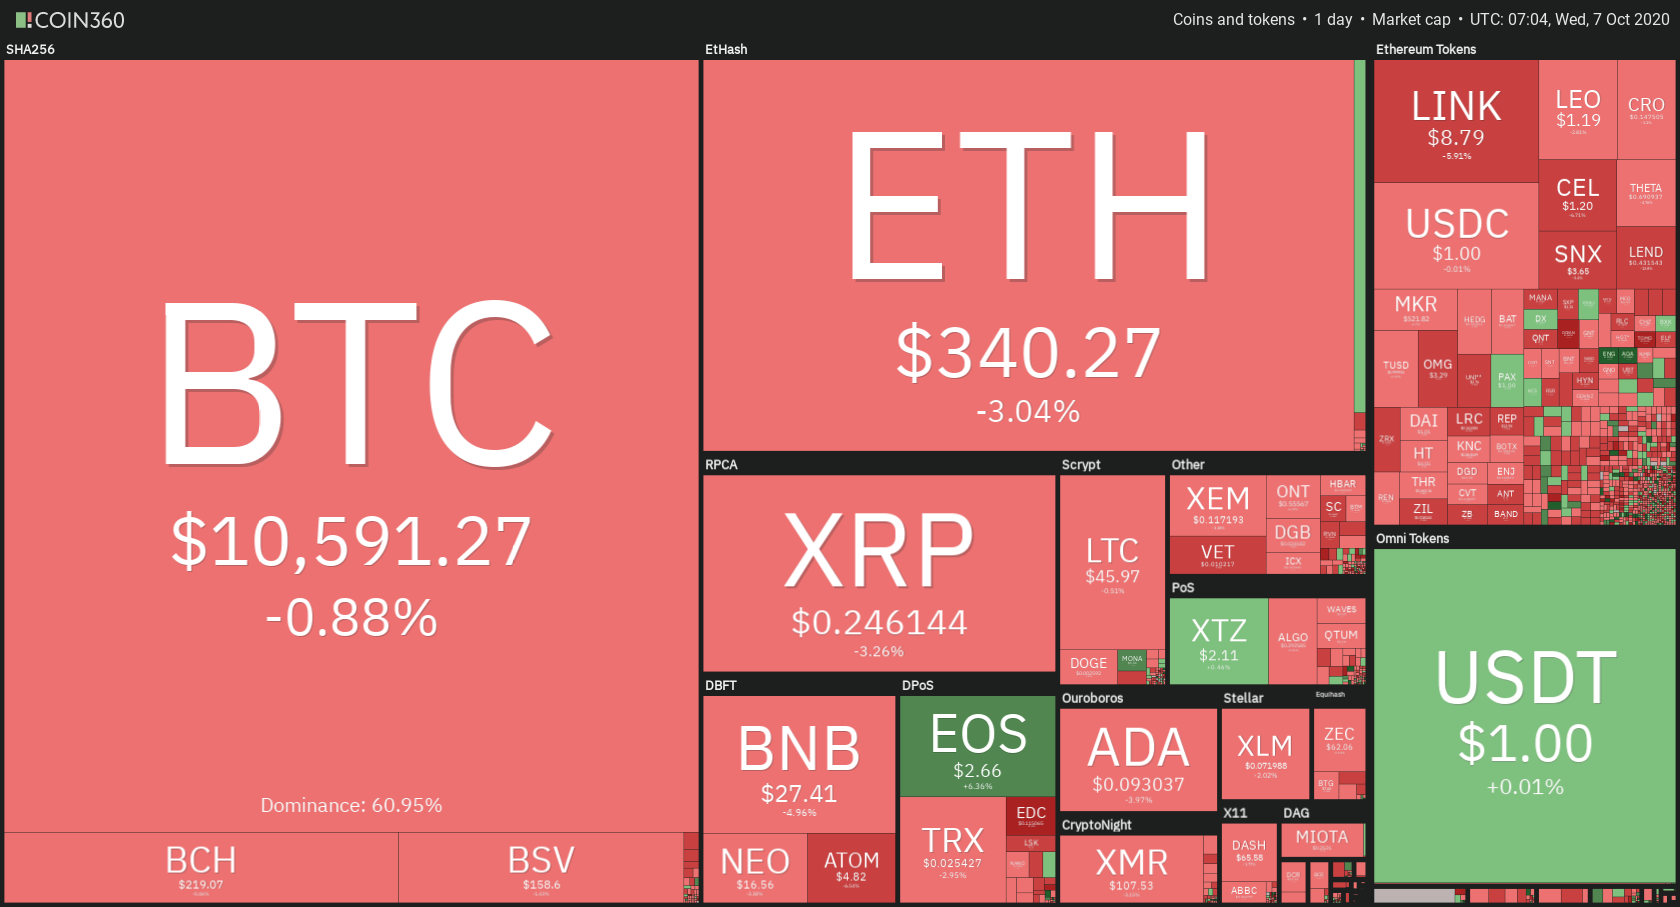
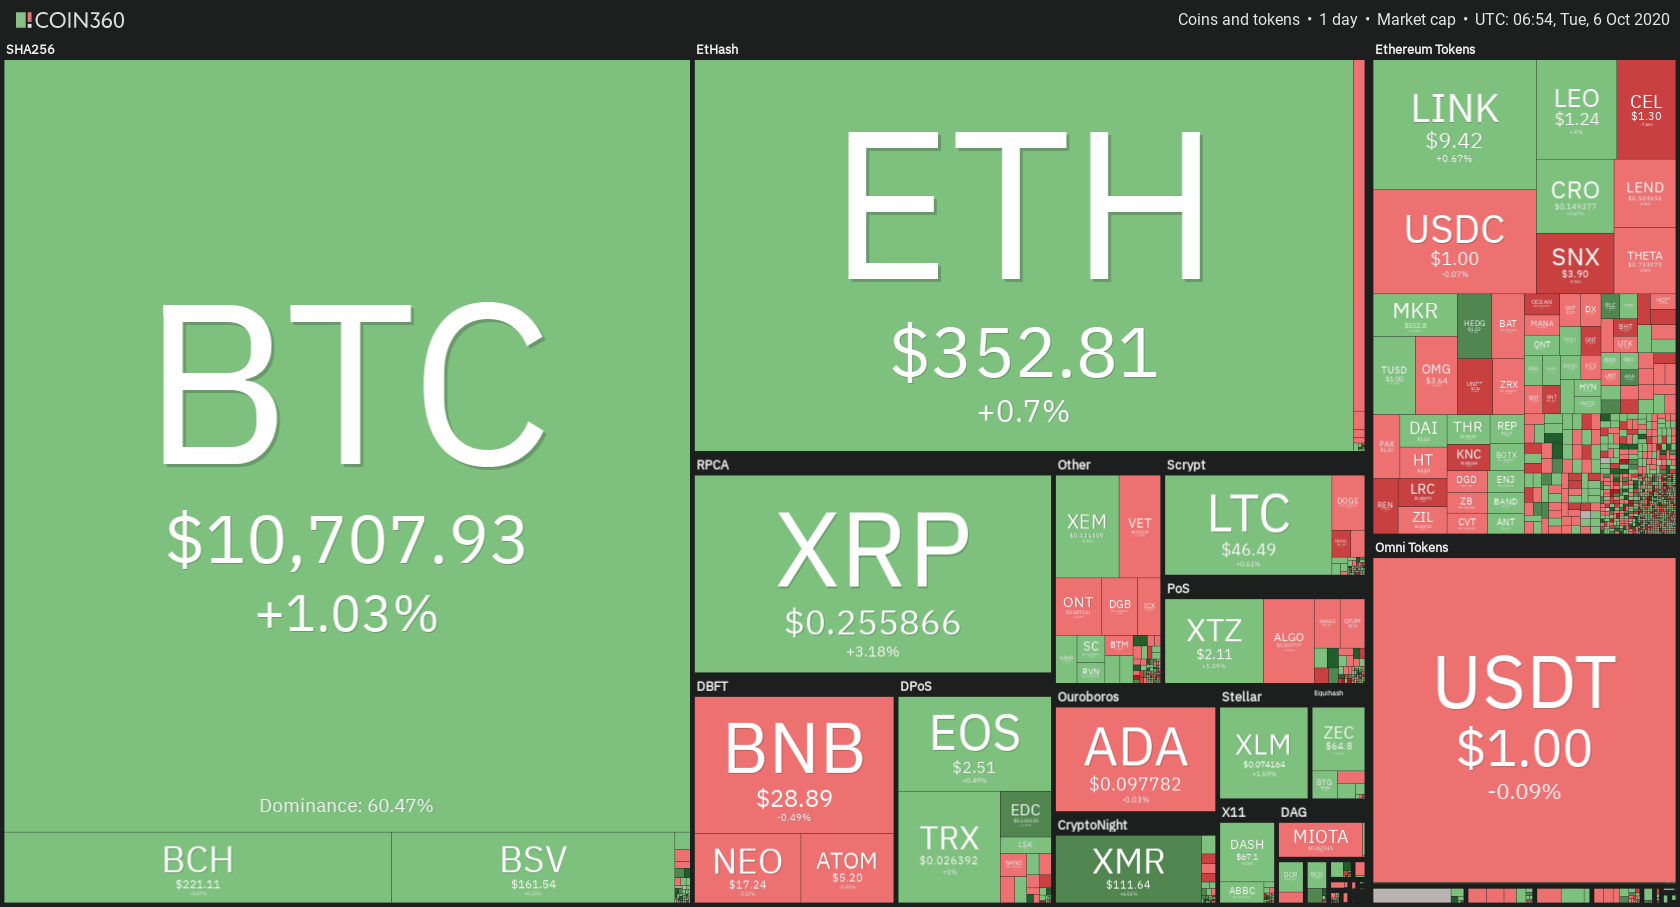
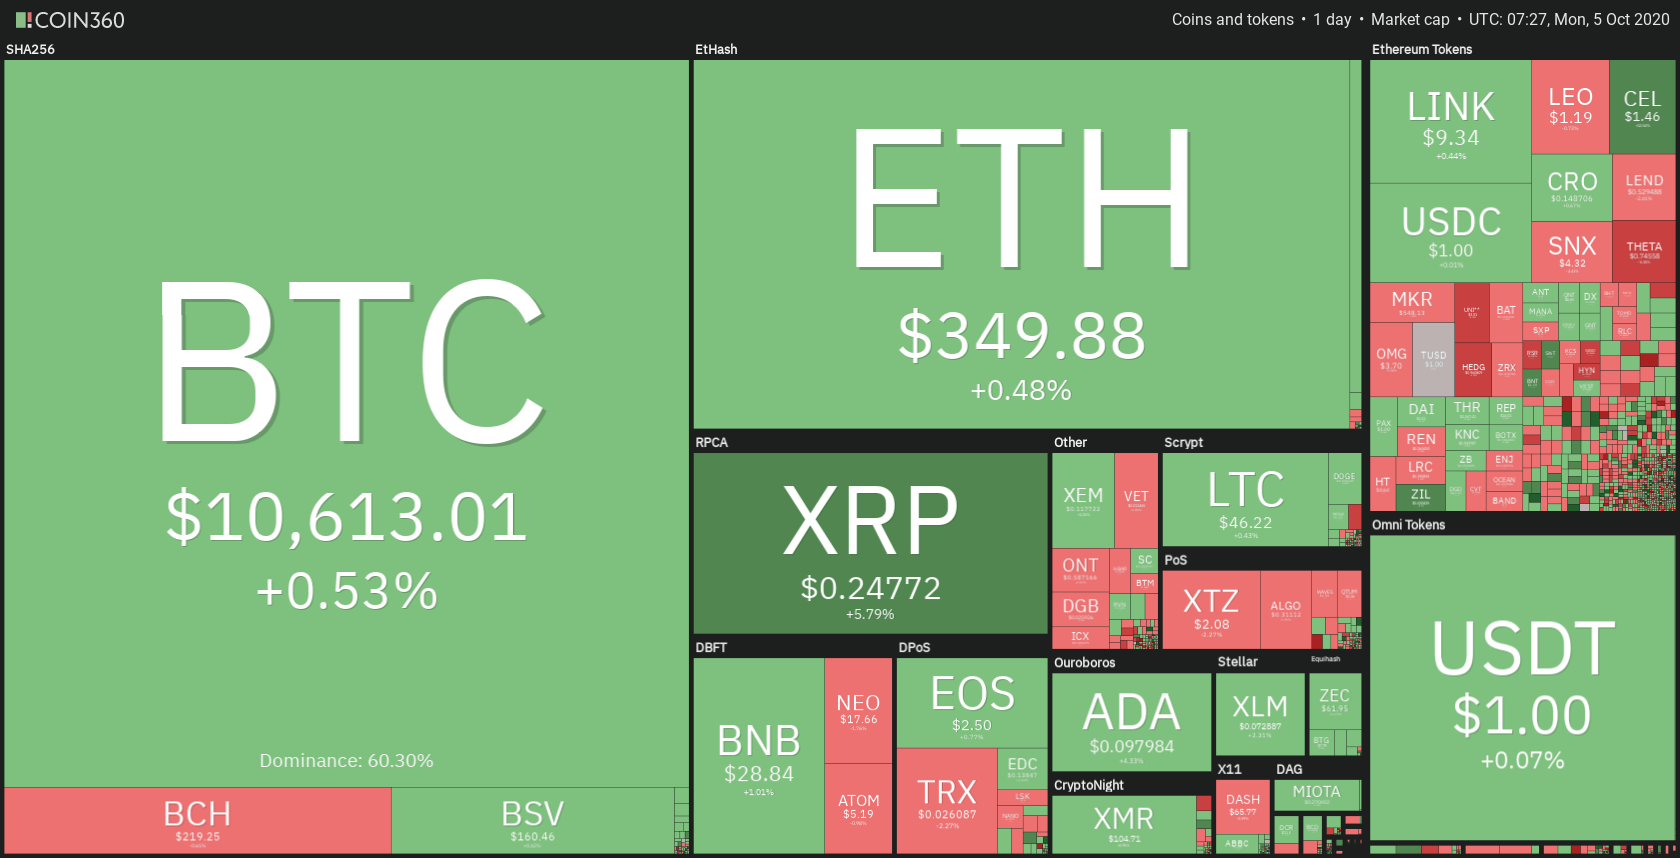
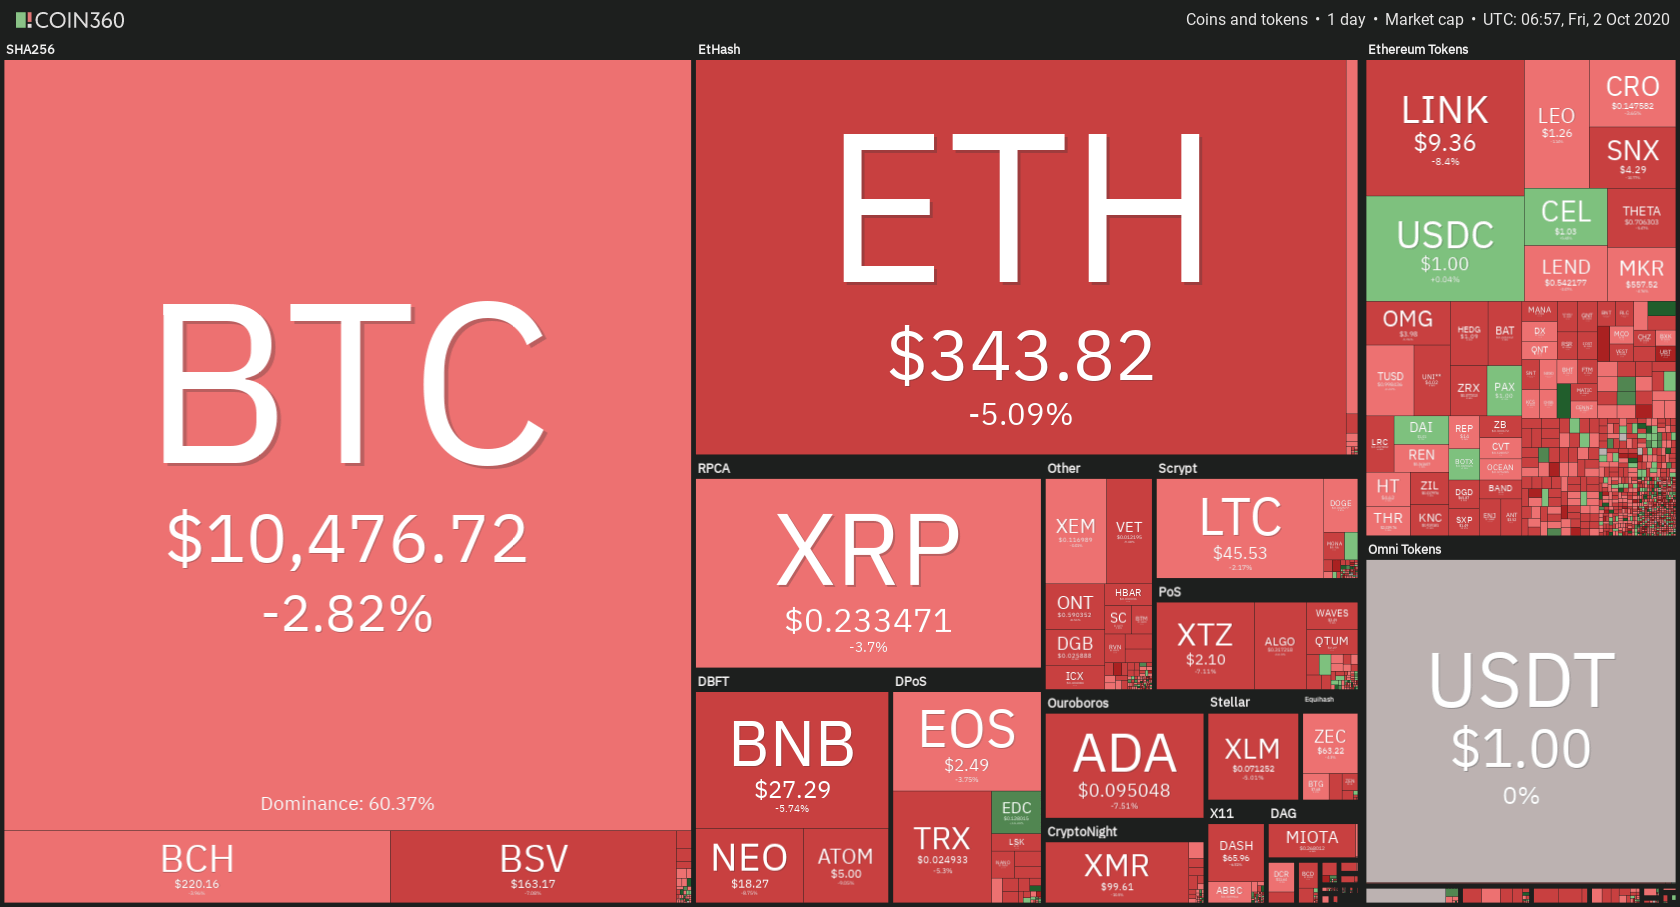
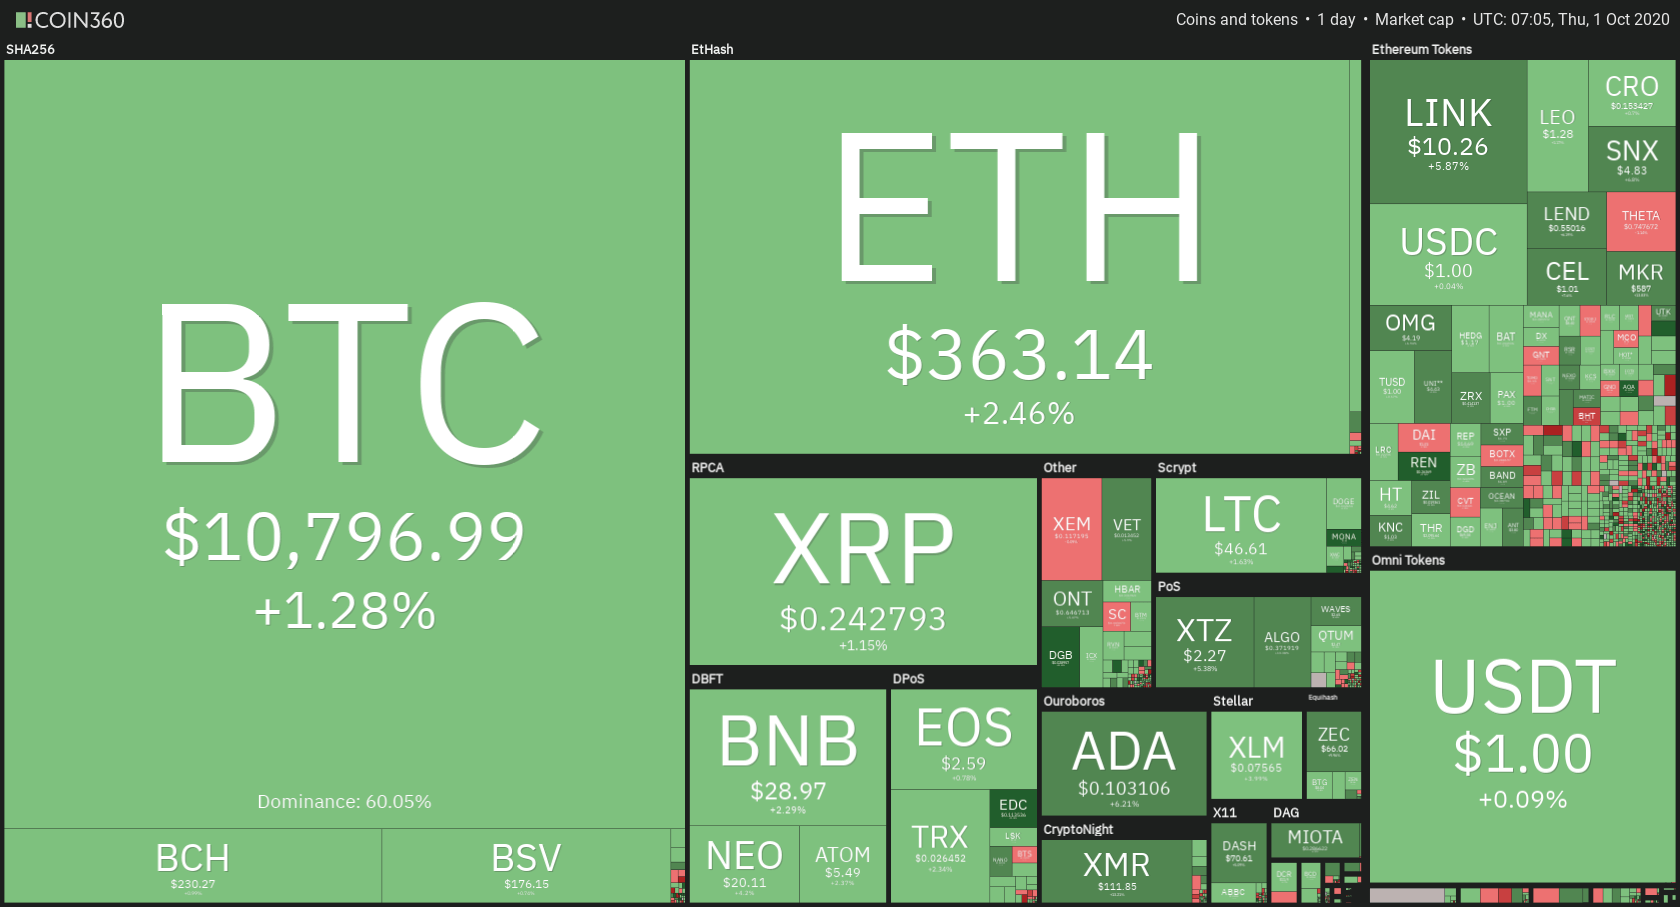
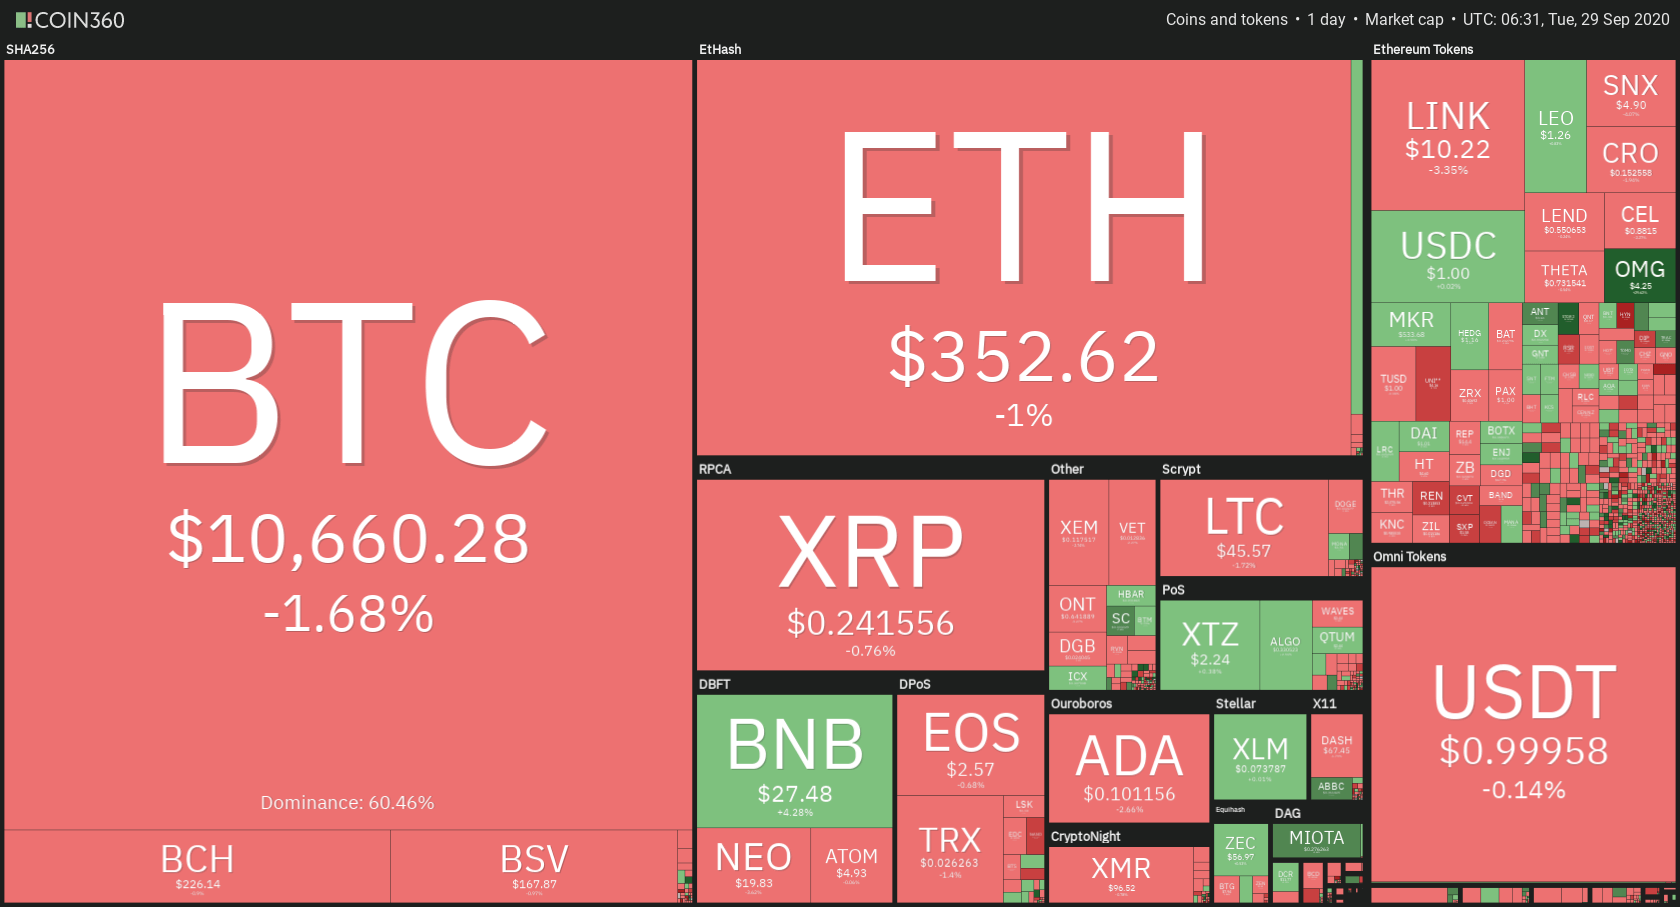
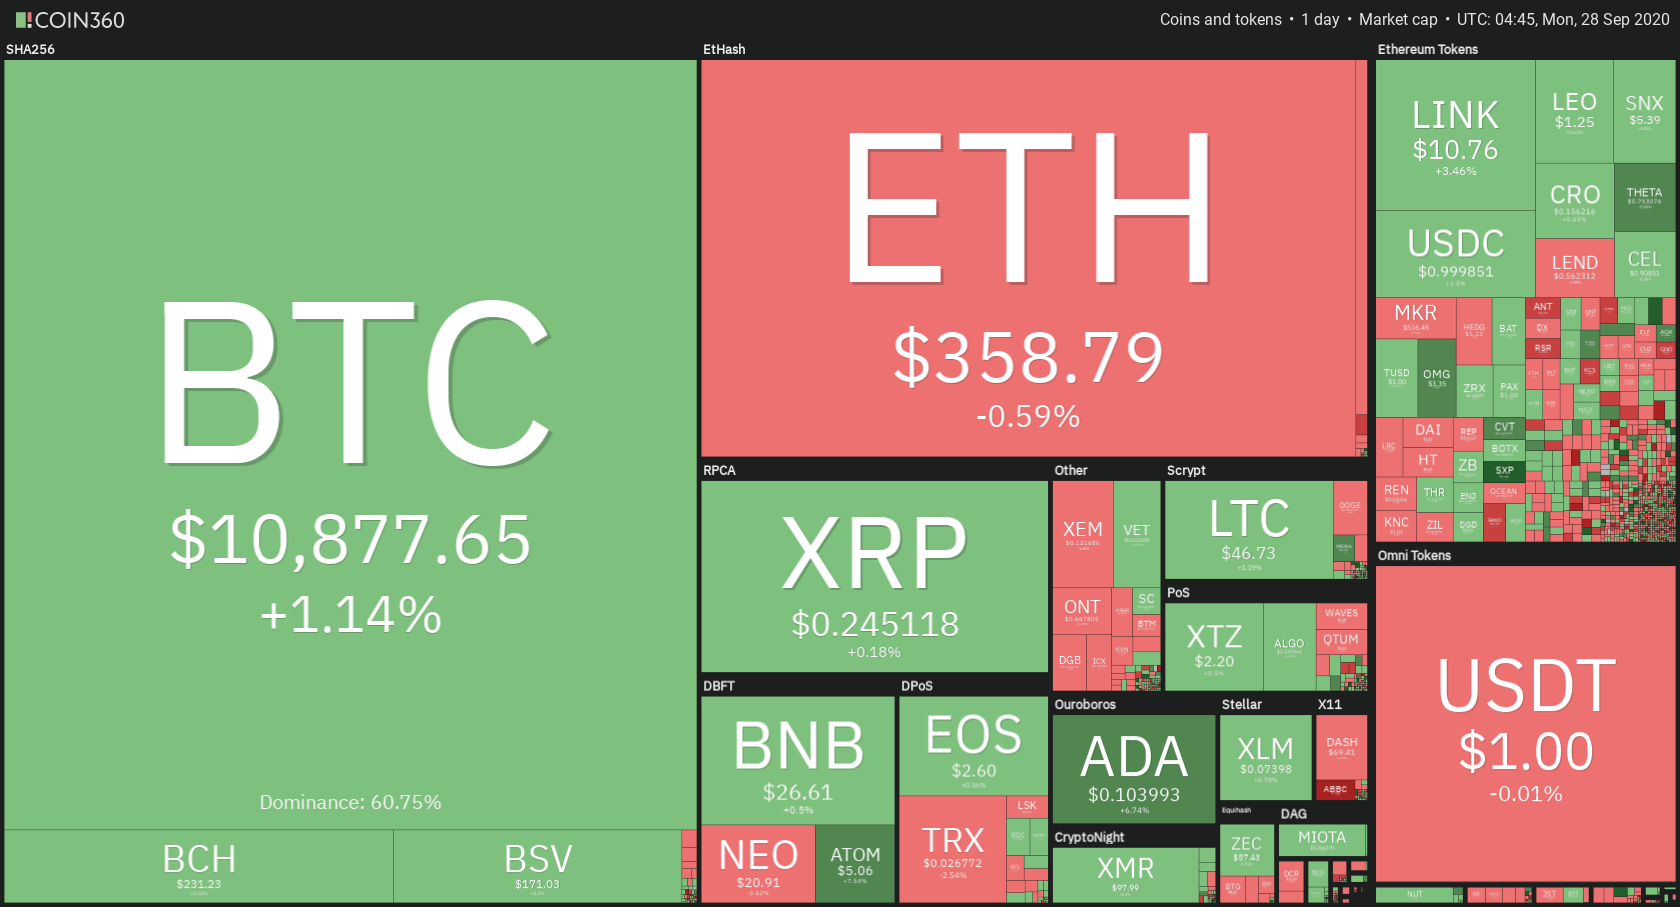
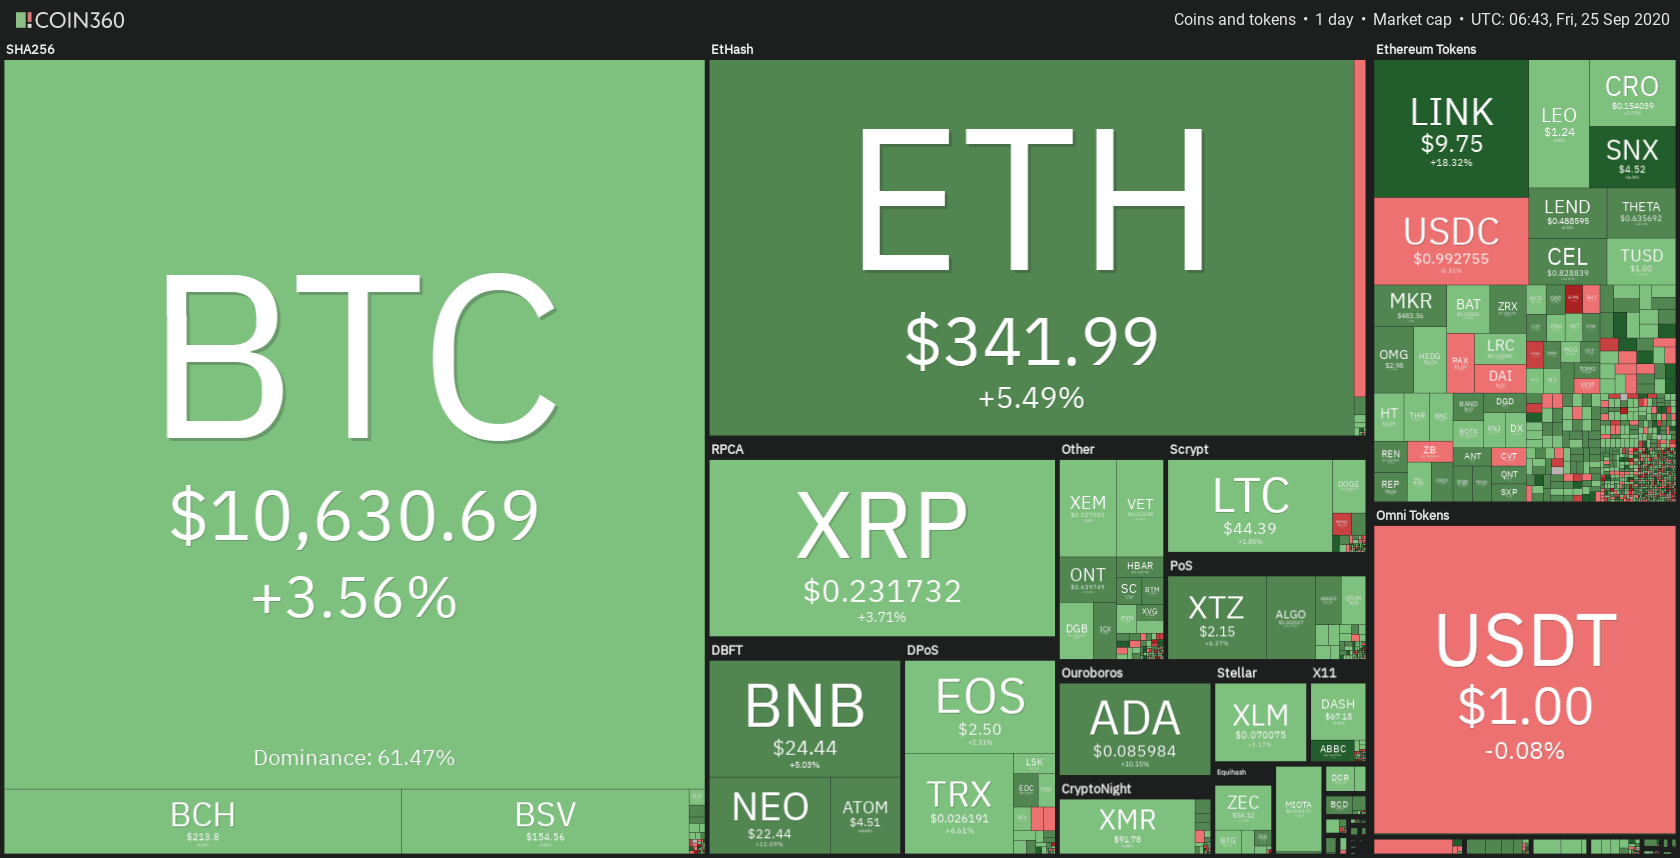
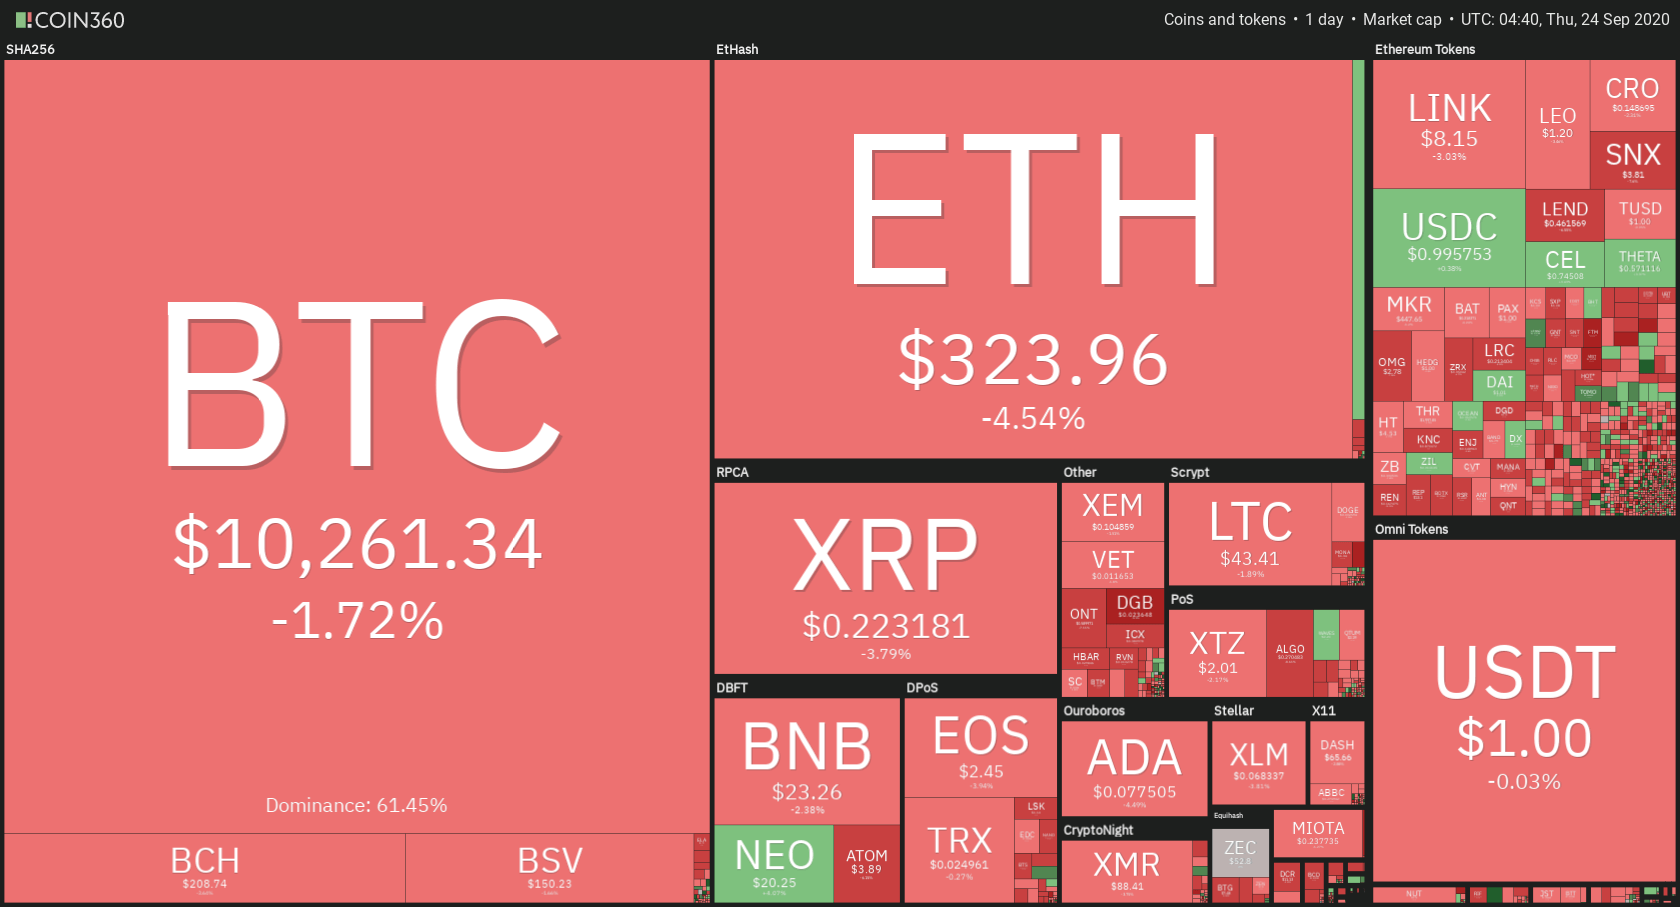
Daily Crypto Sector Heat Map
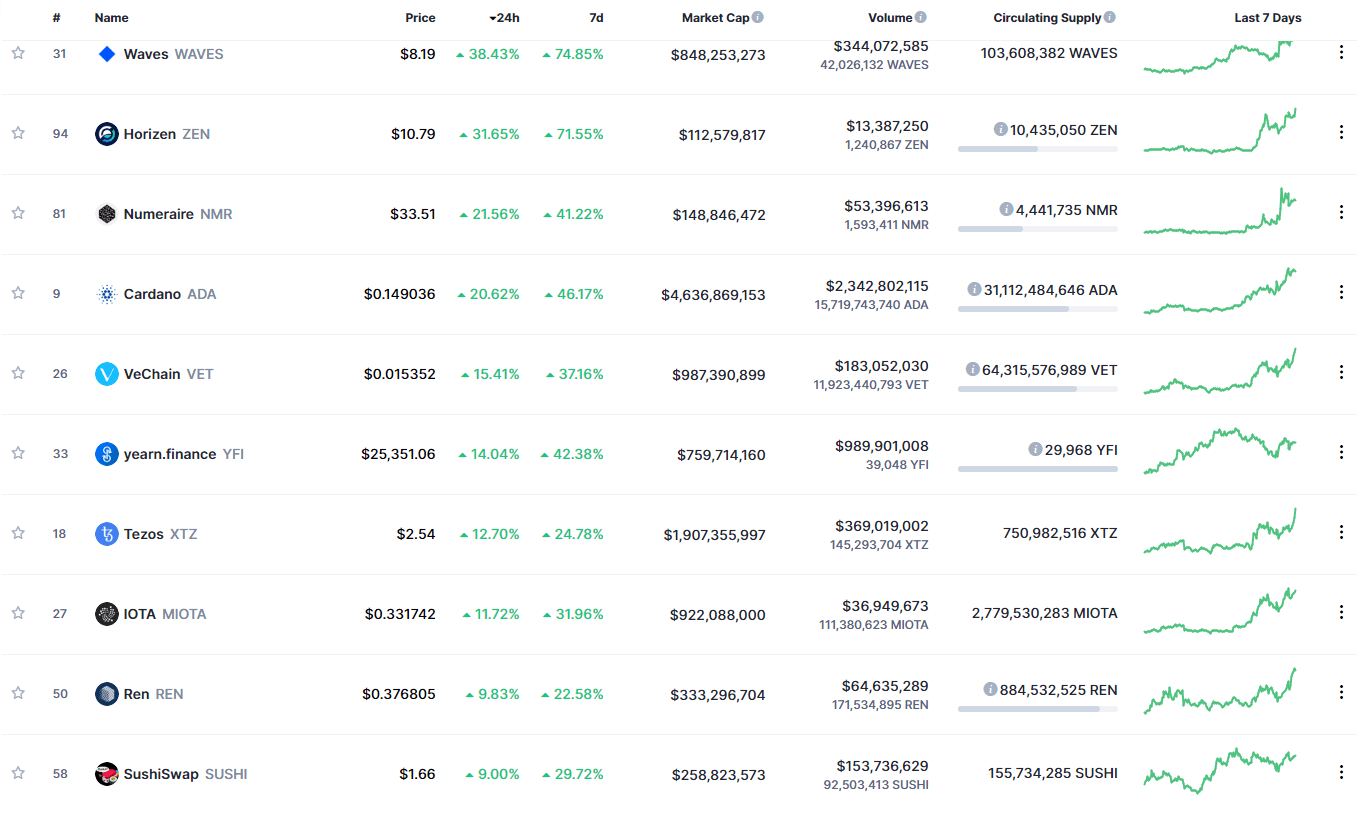
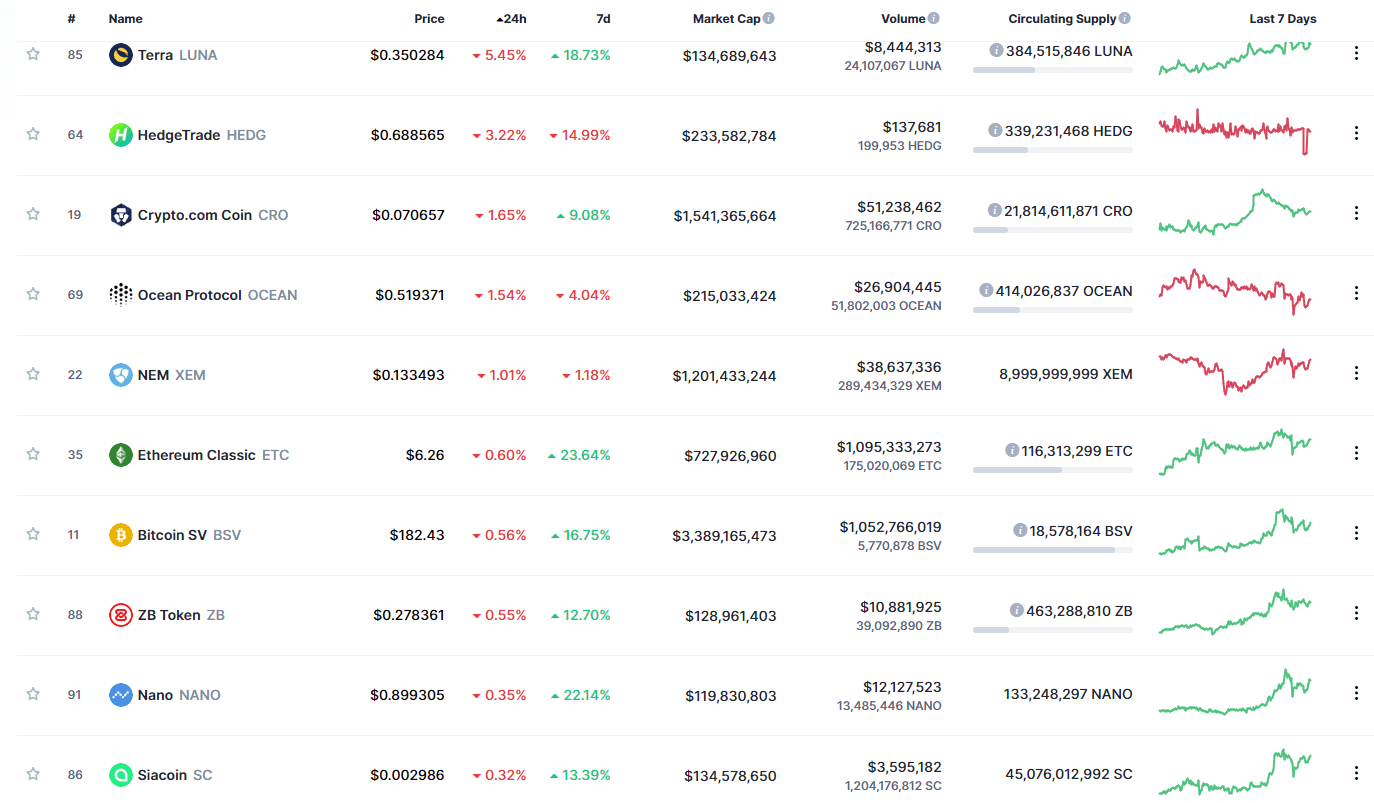
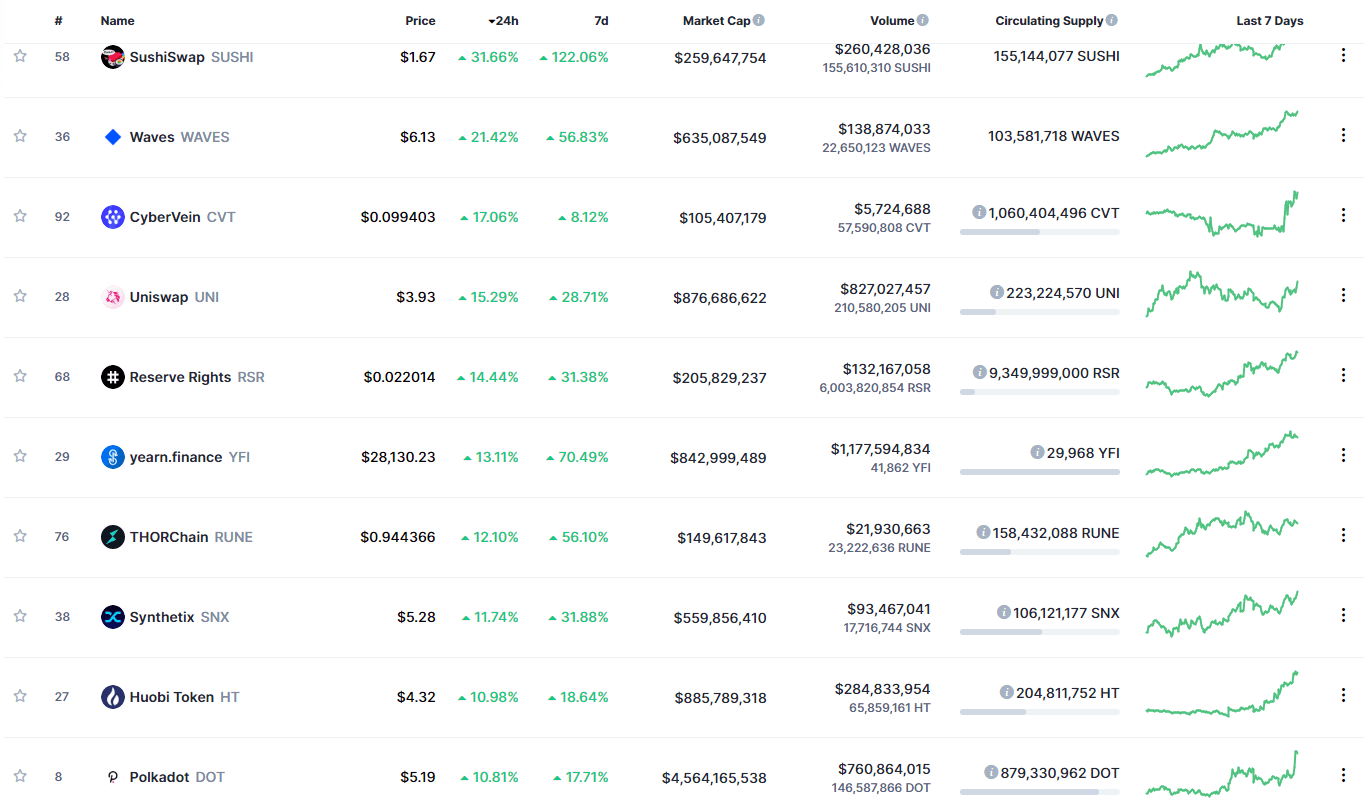
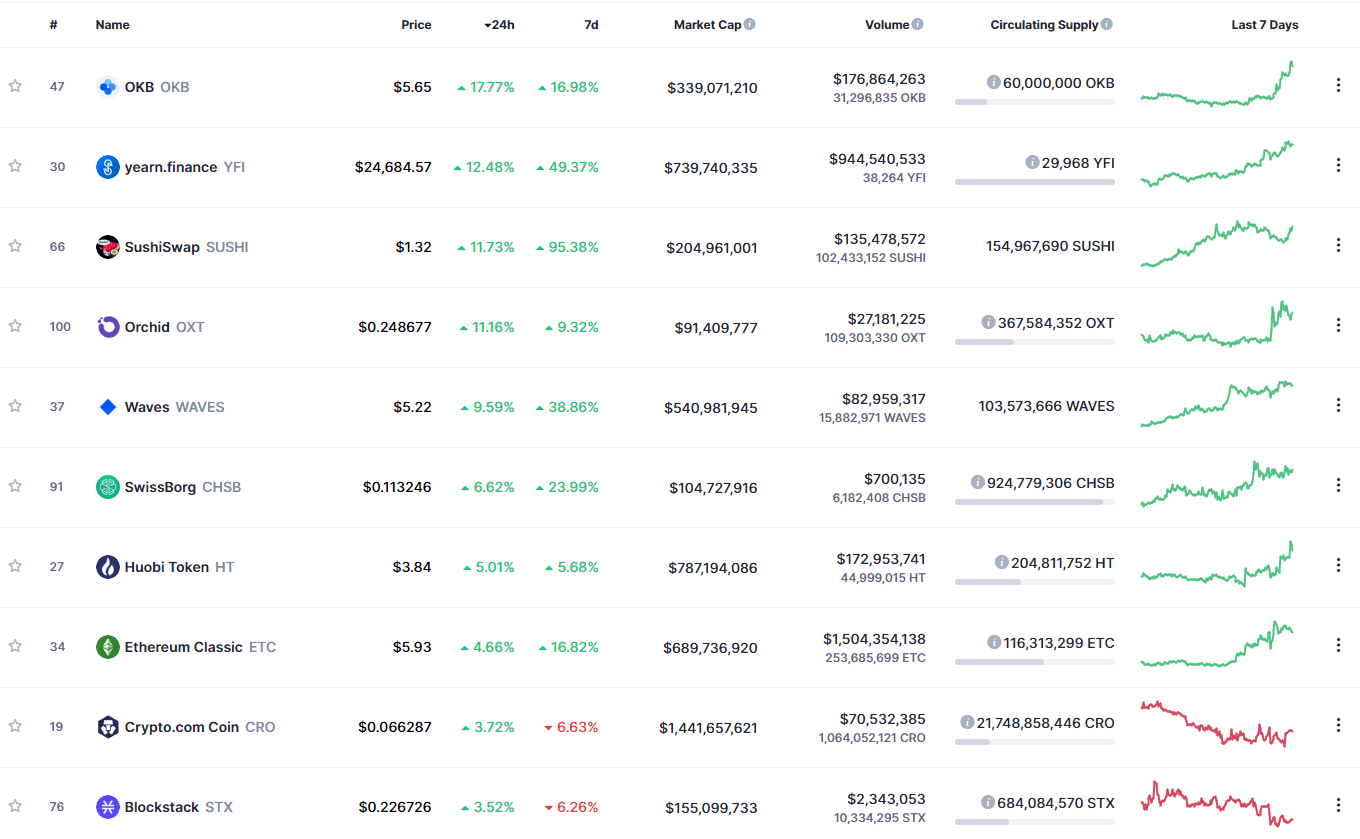
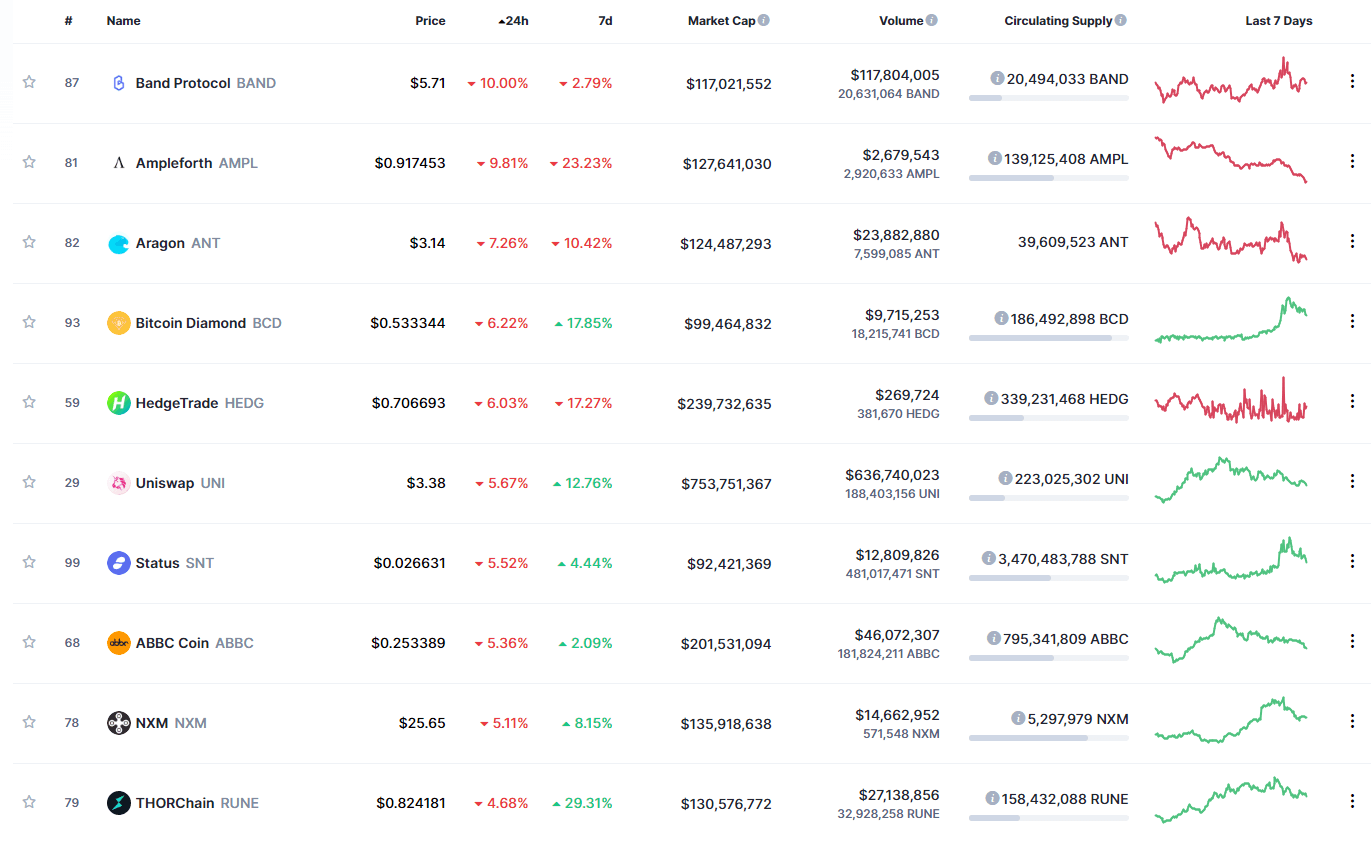
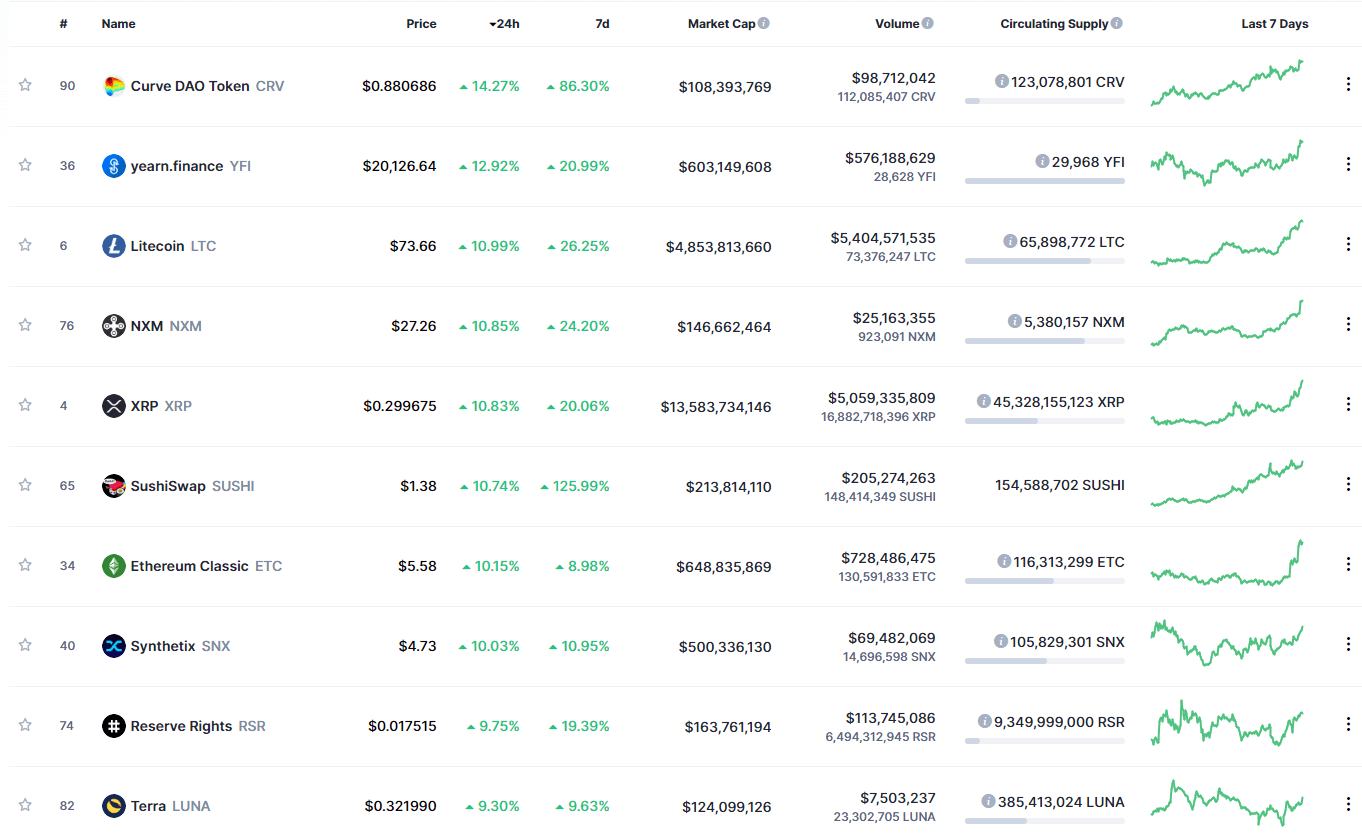
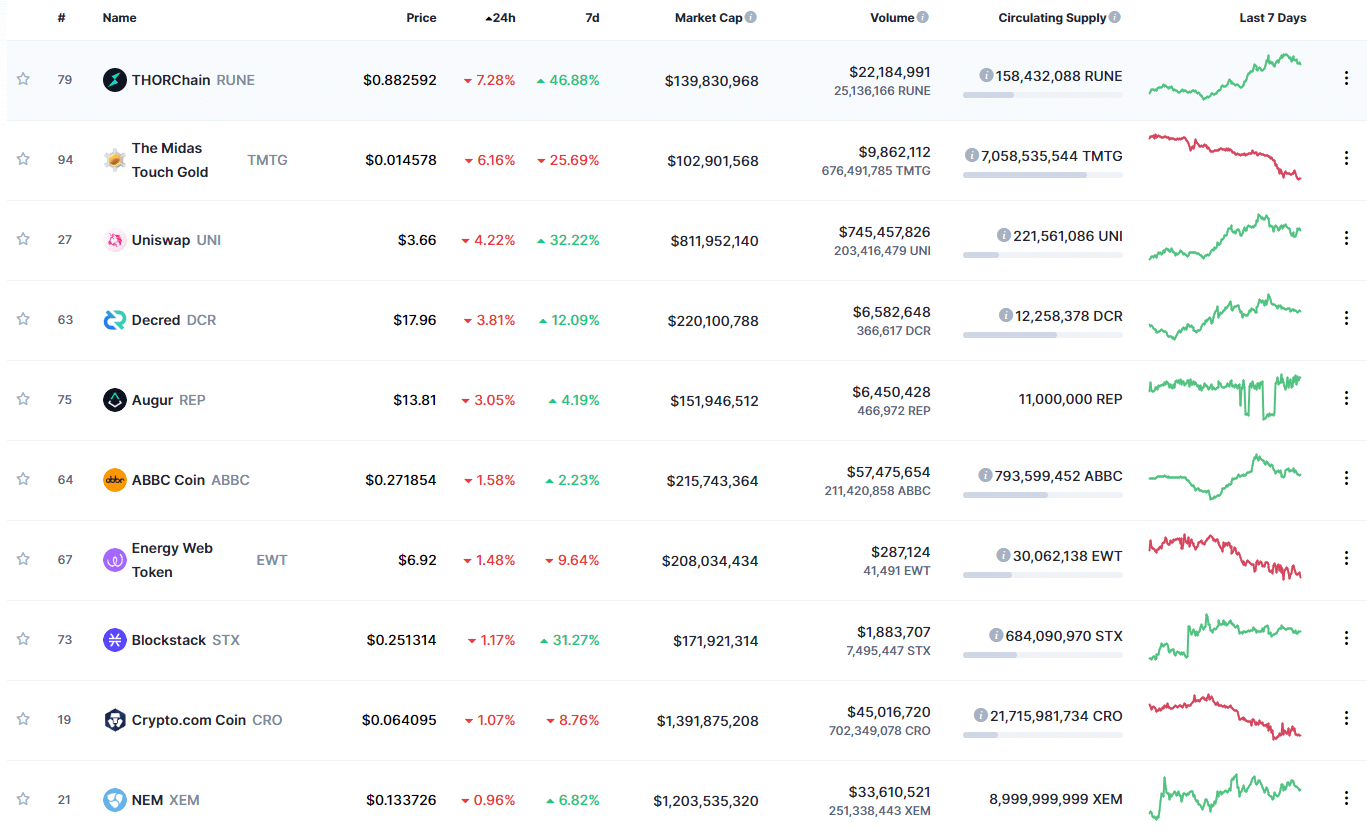
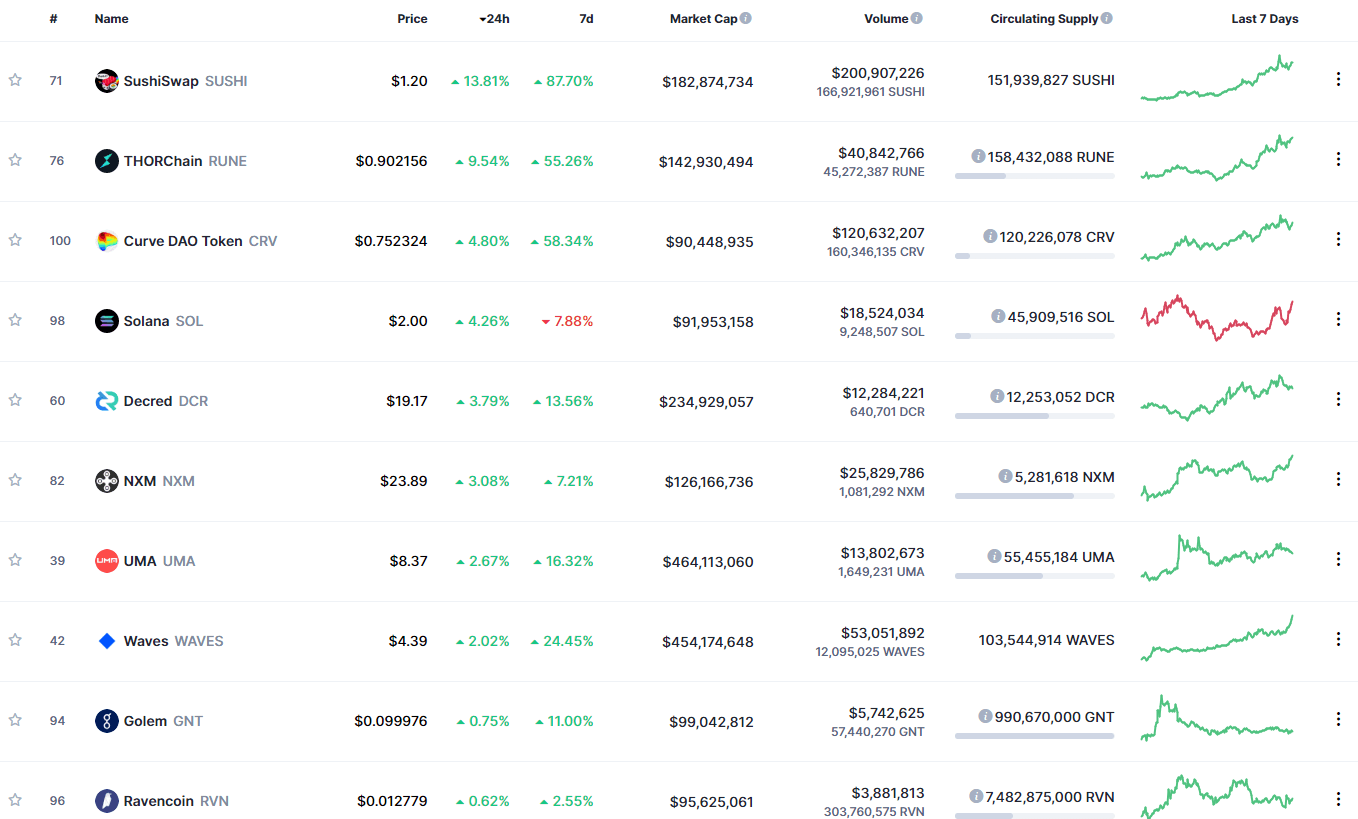
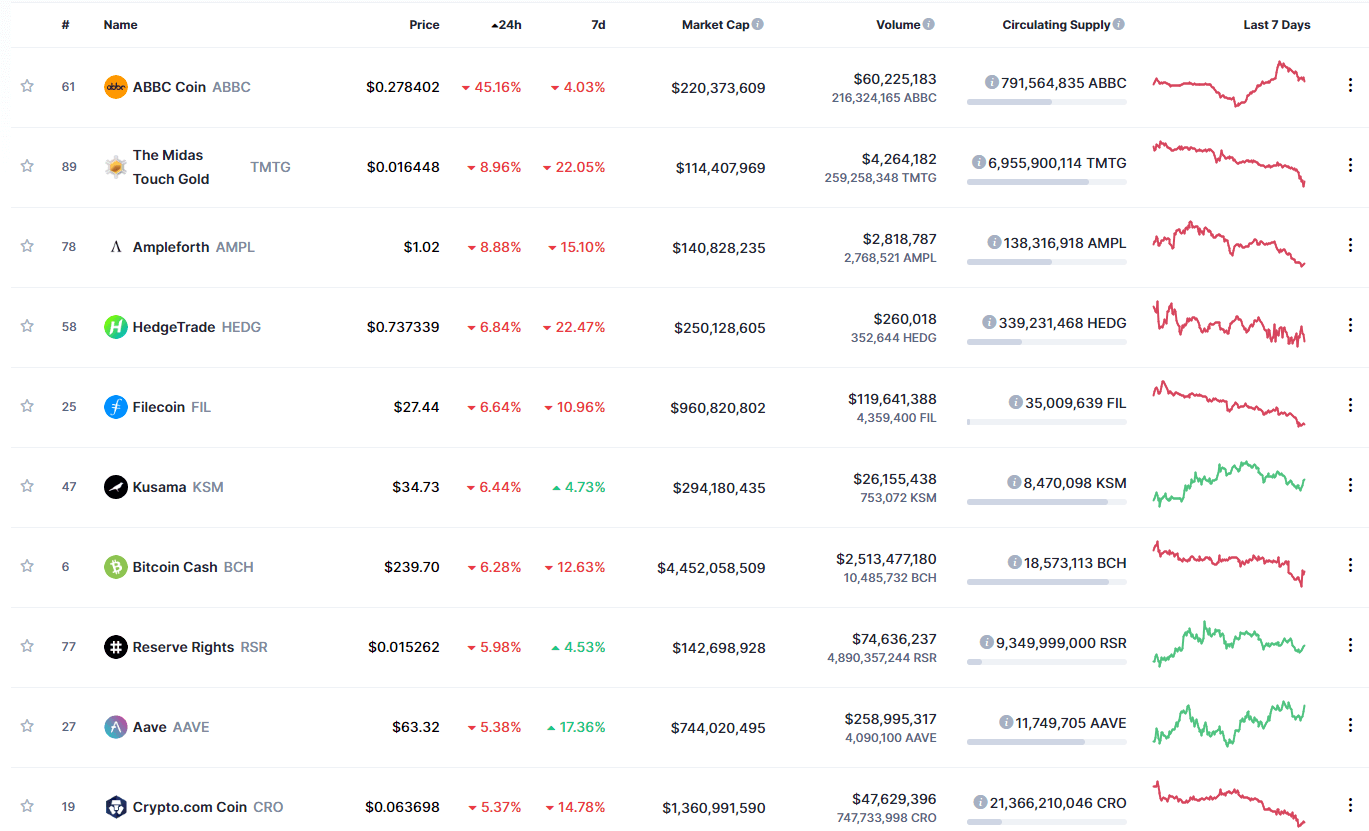
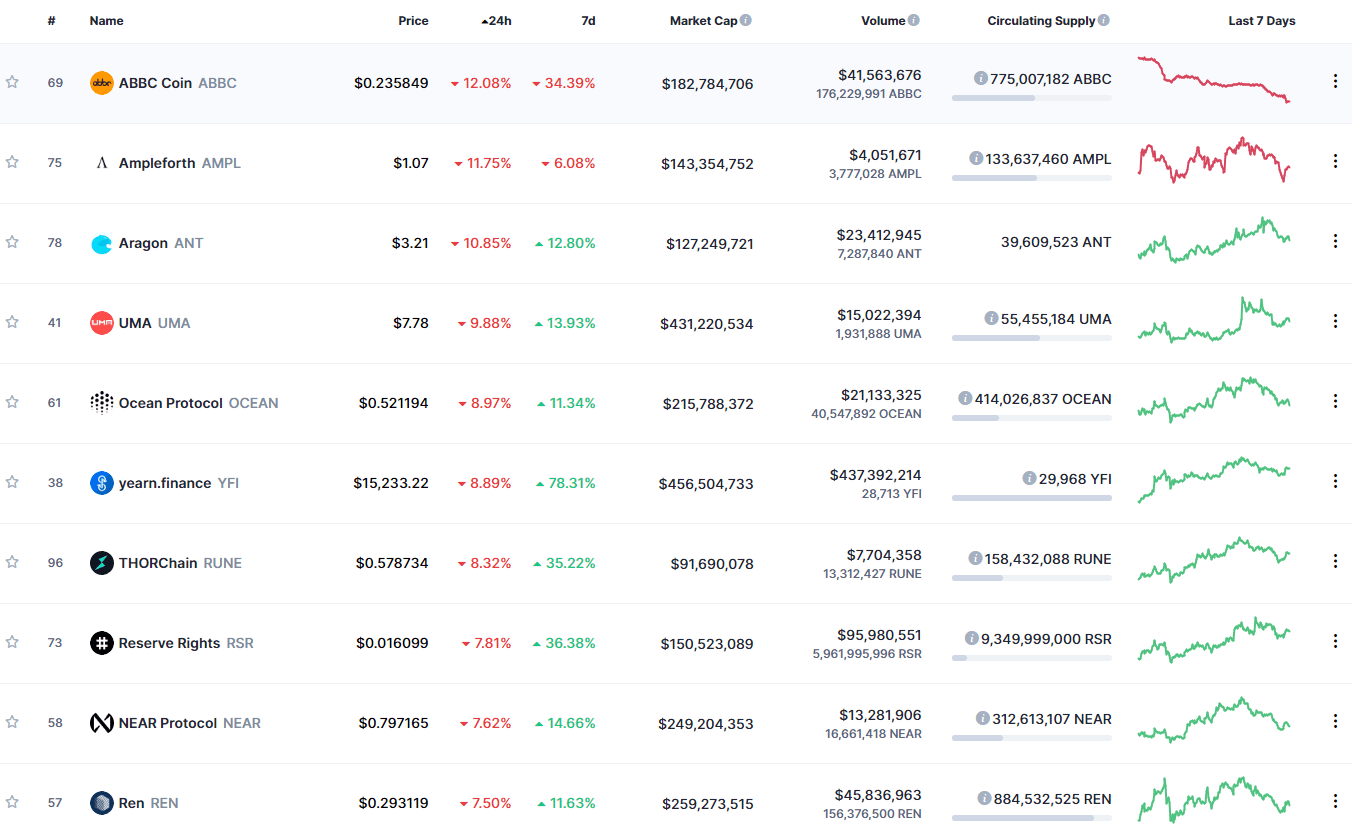
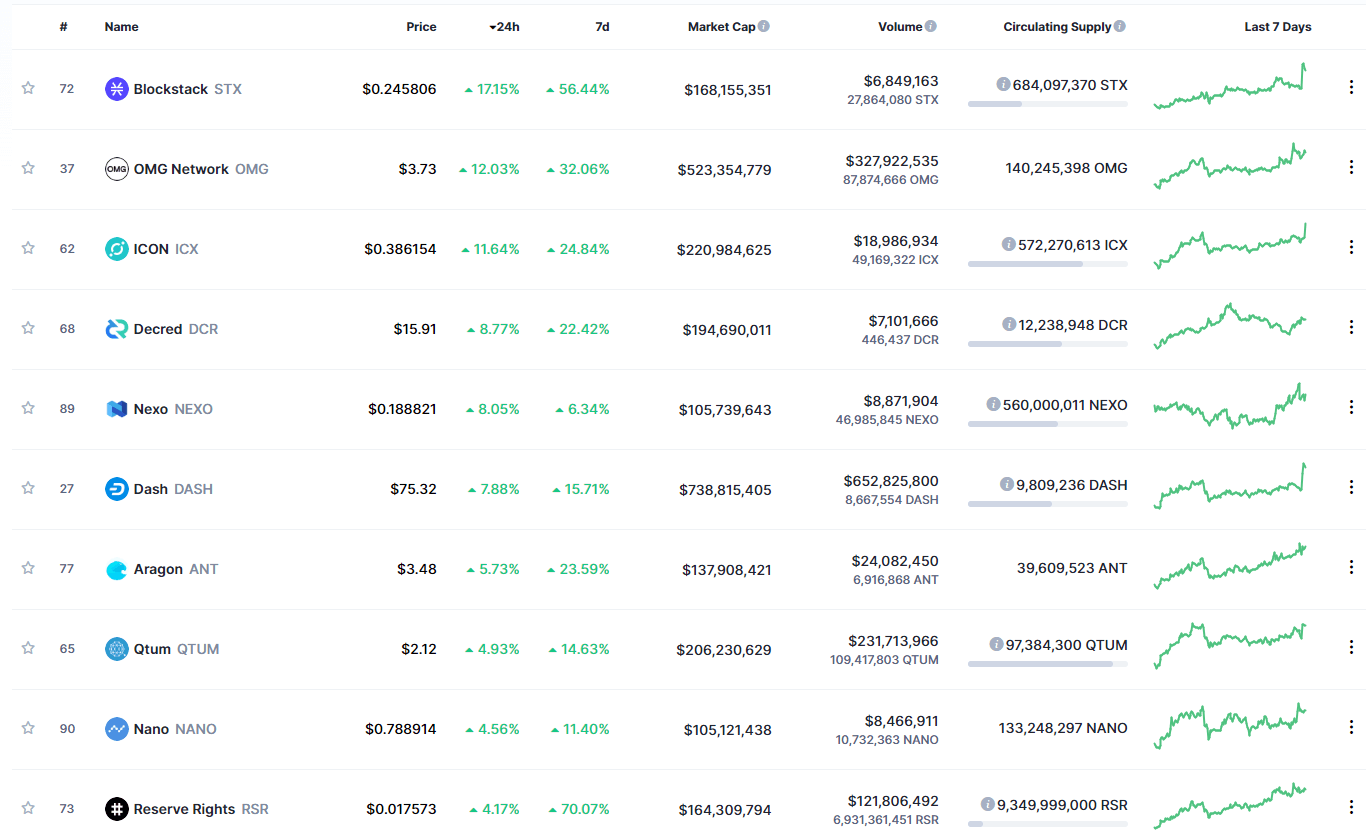
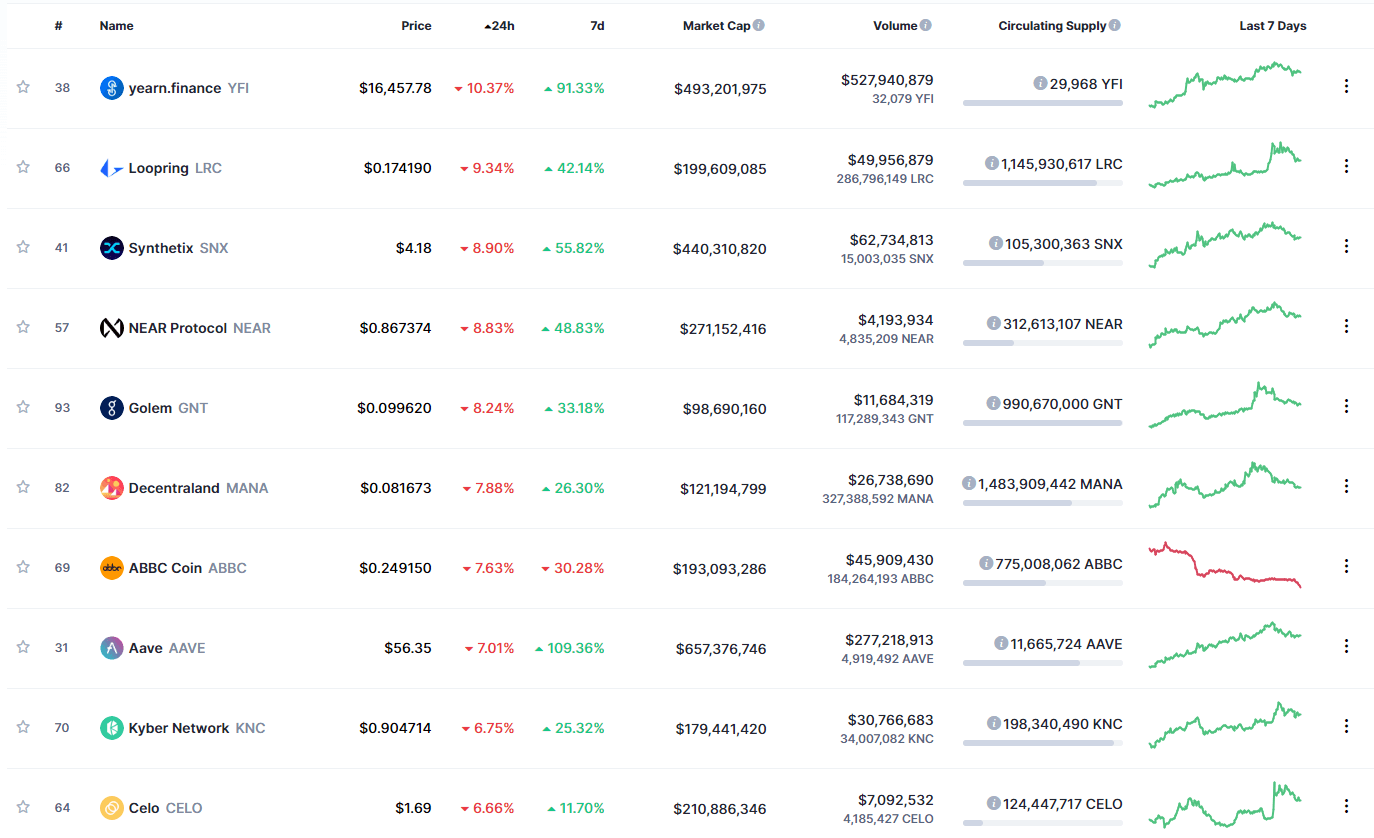
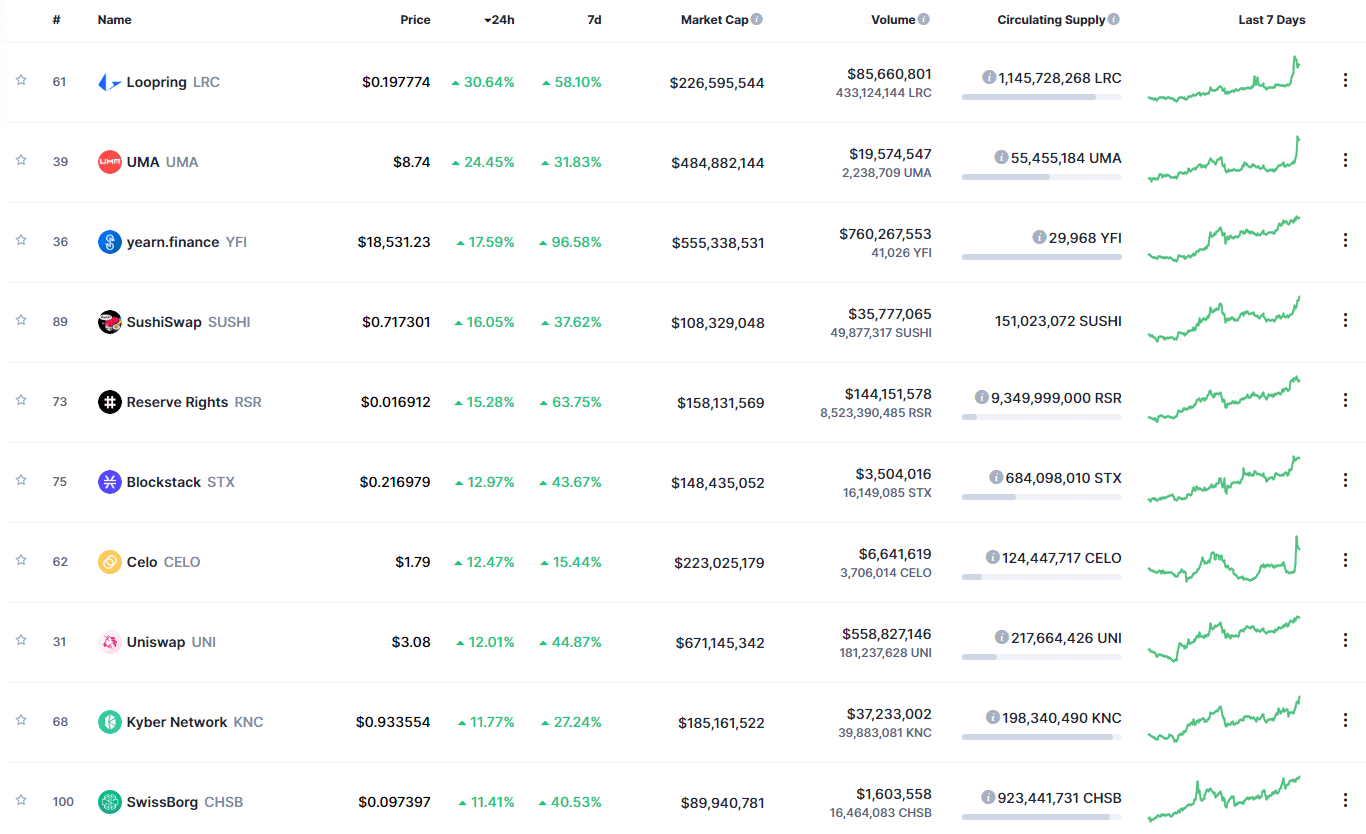
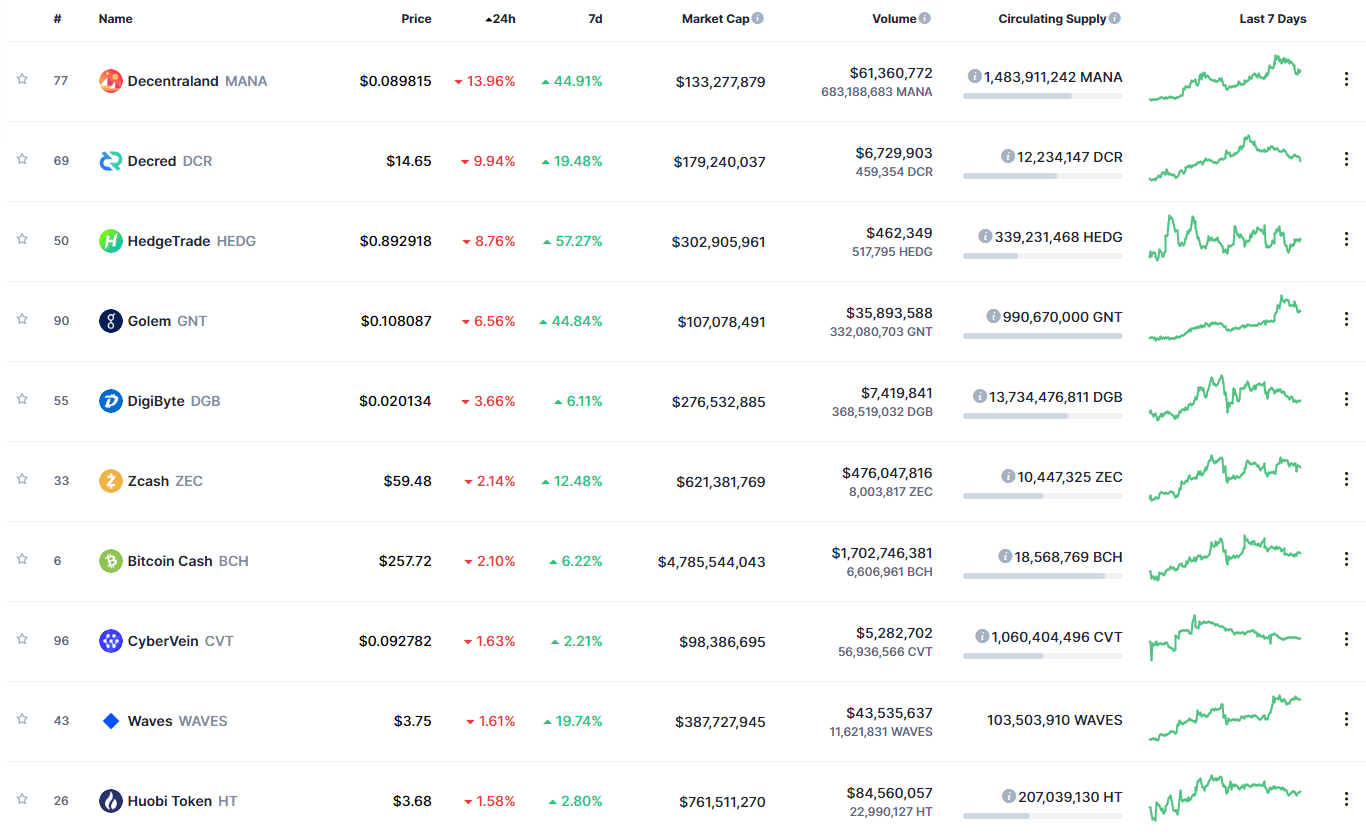
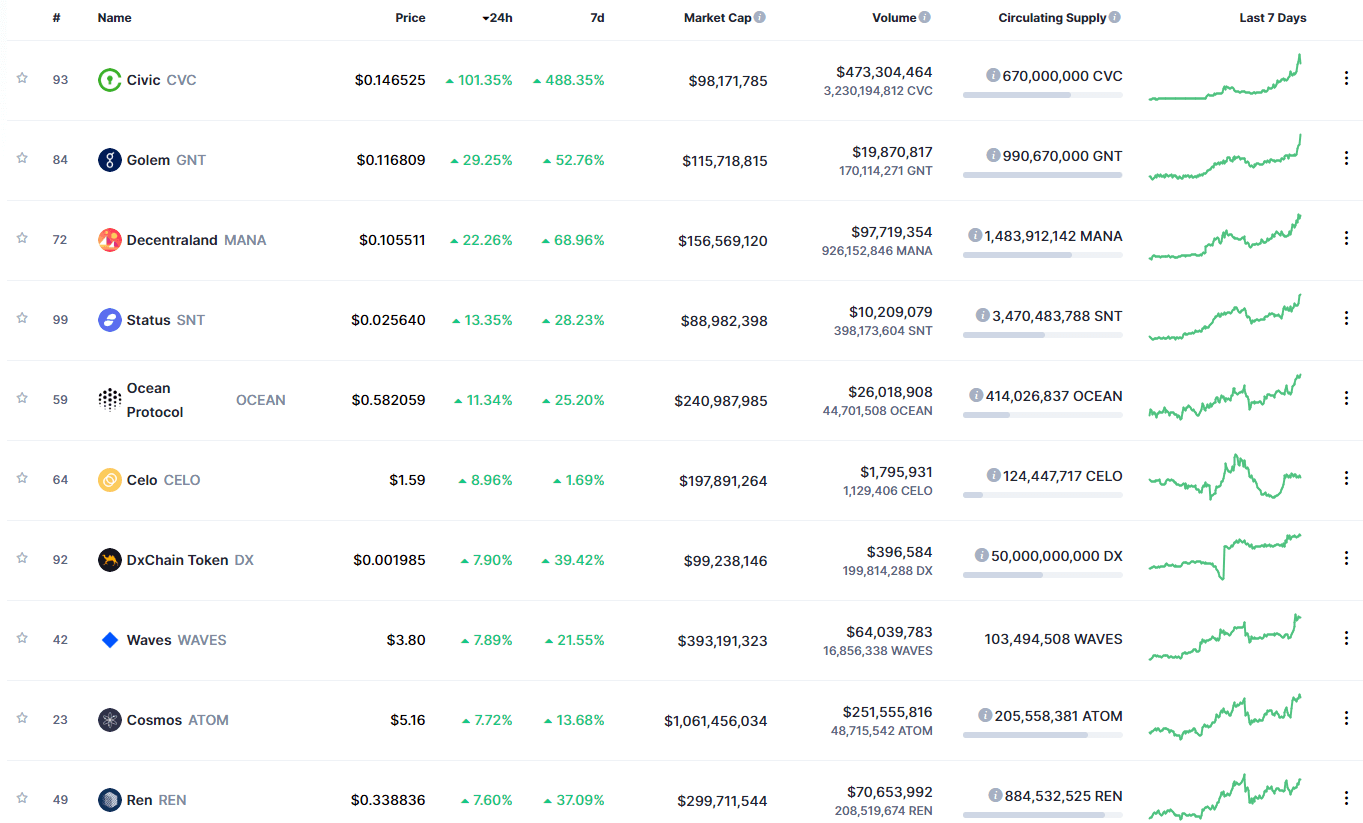
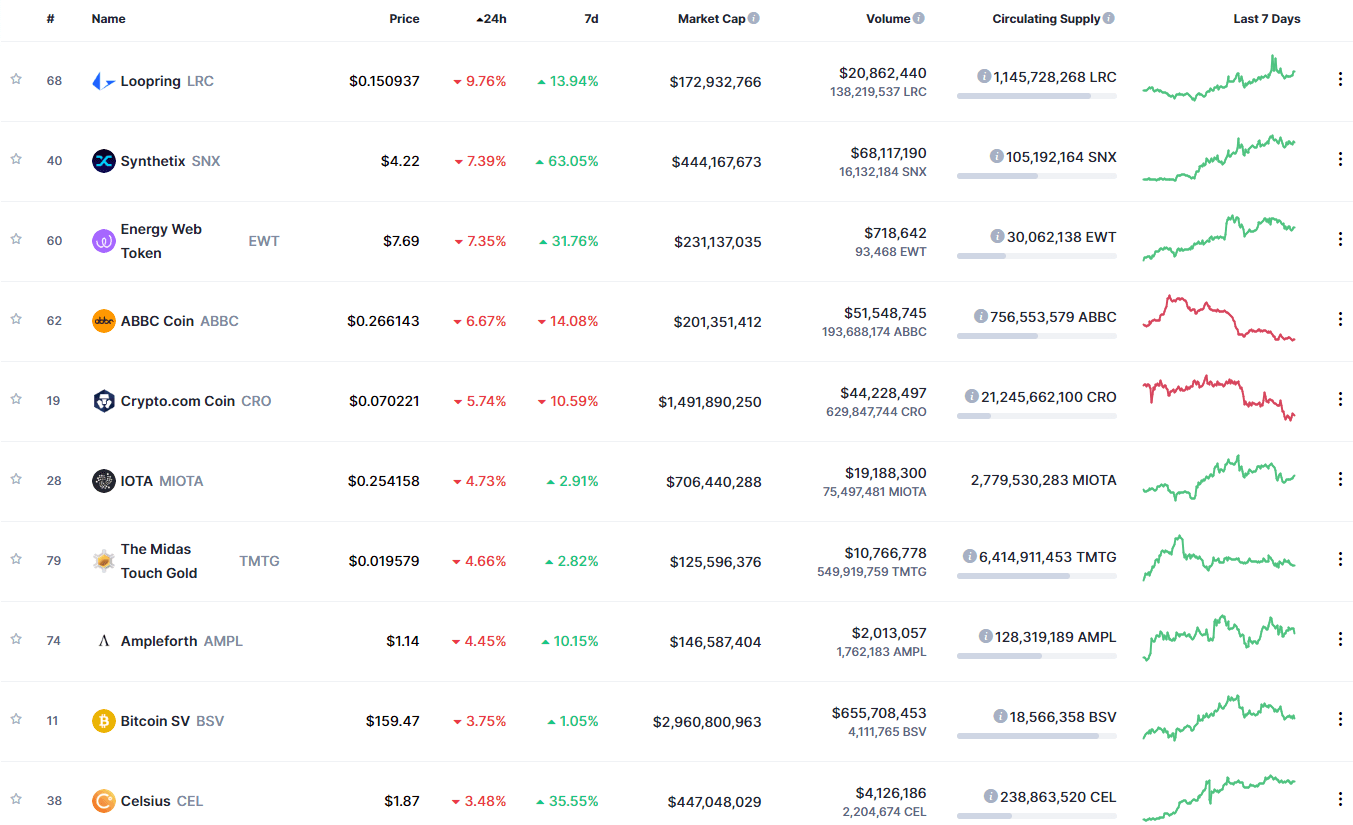
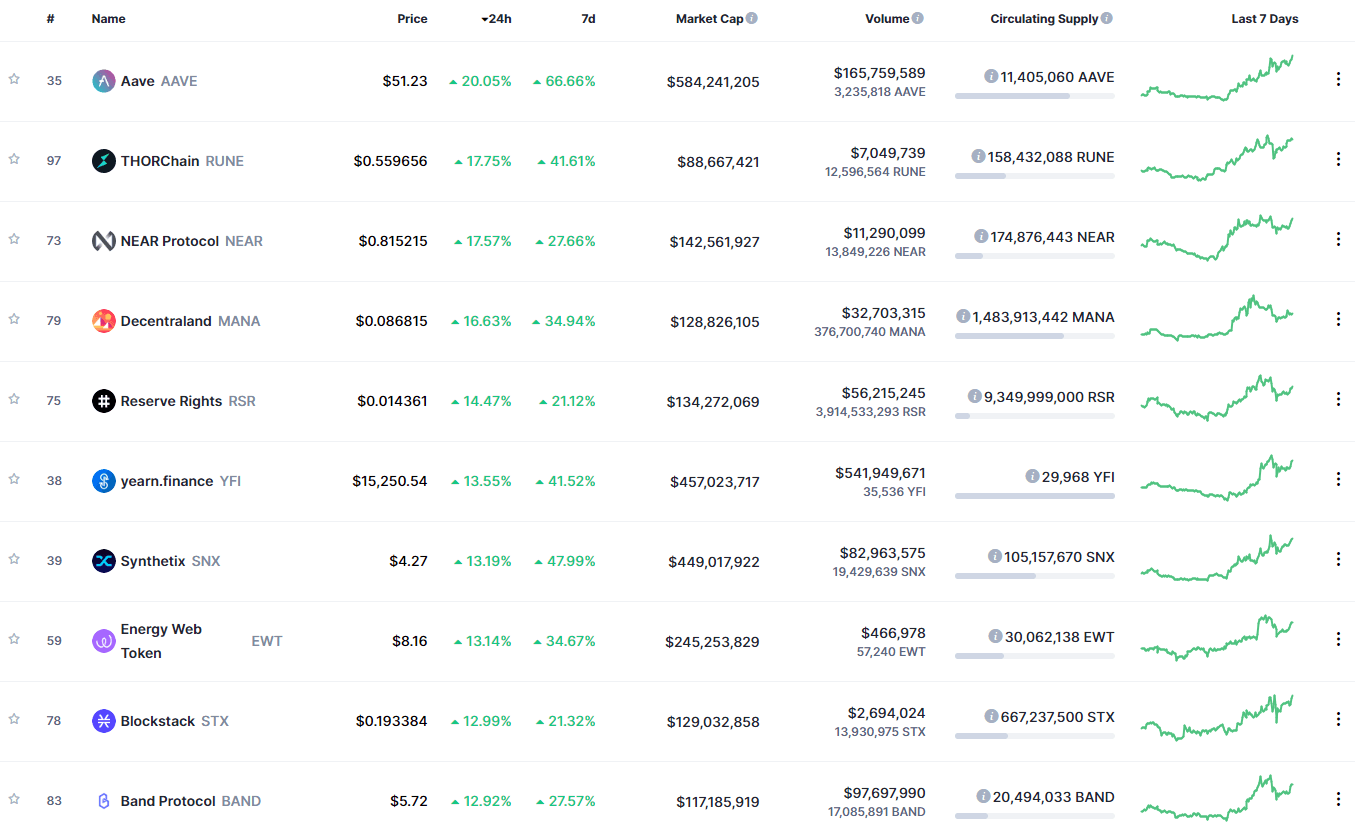
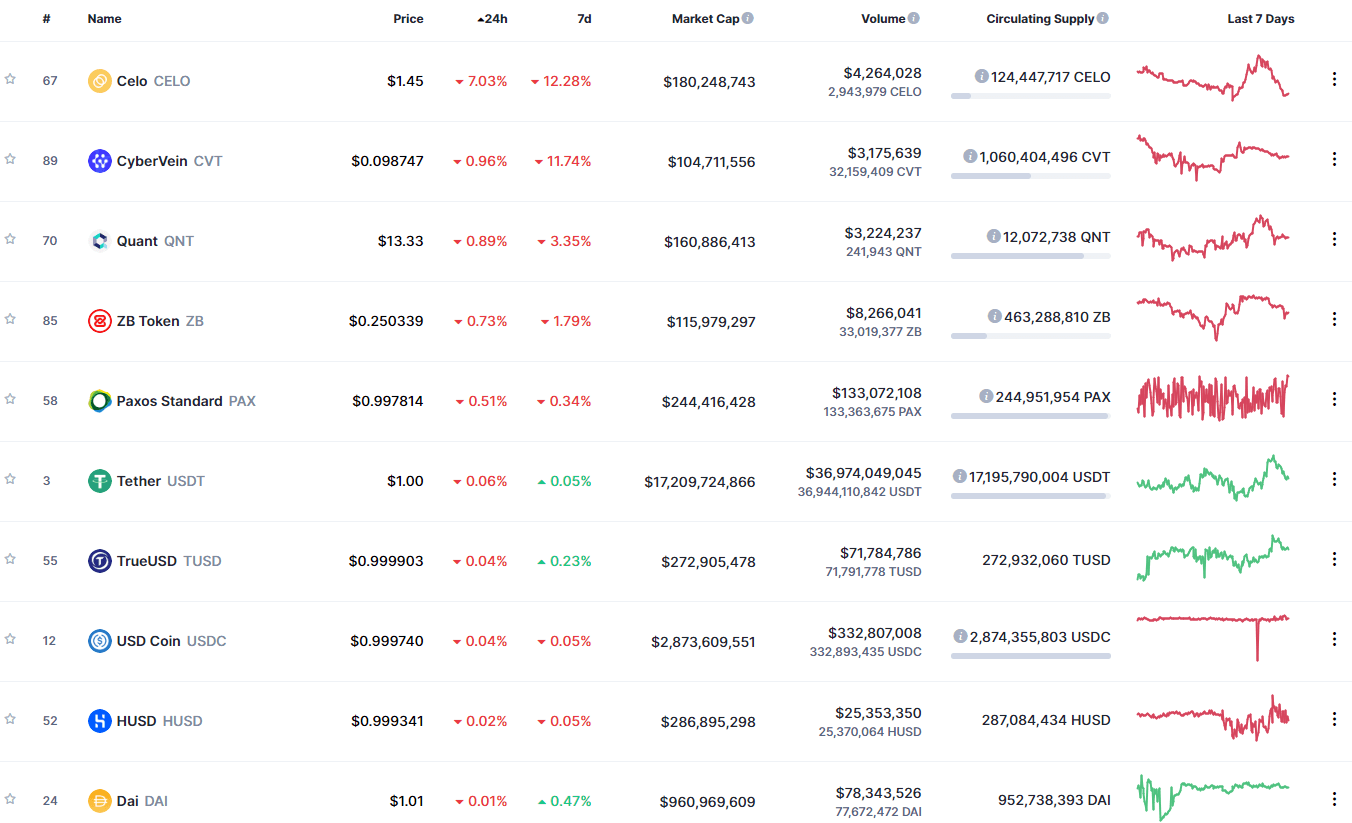
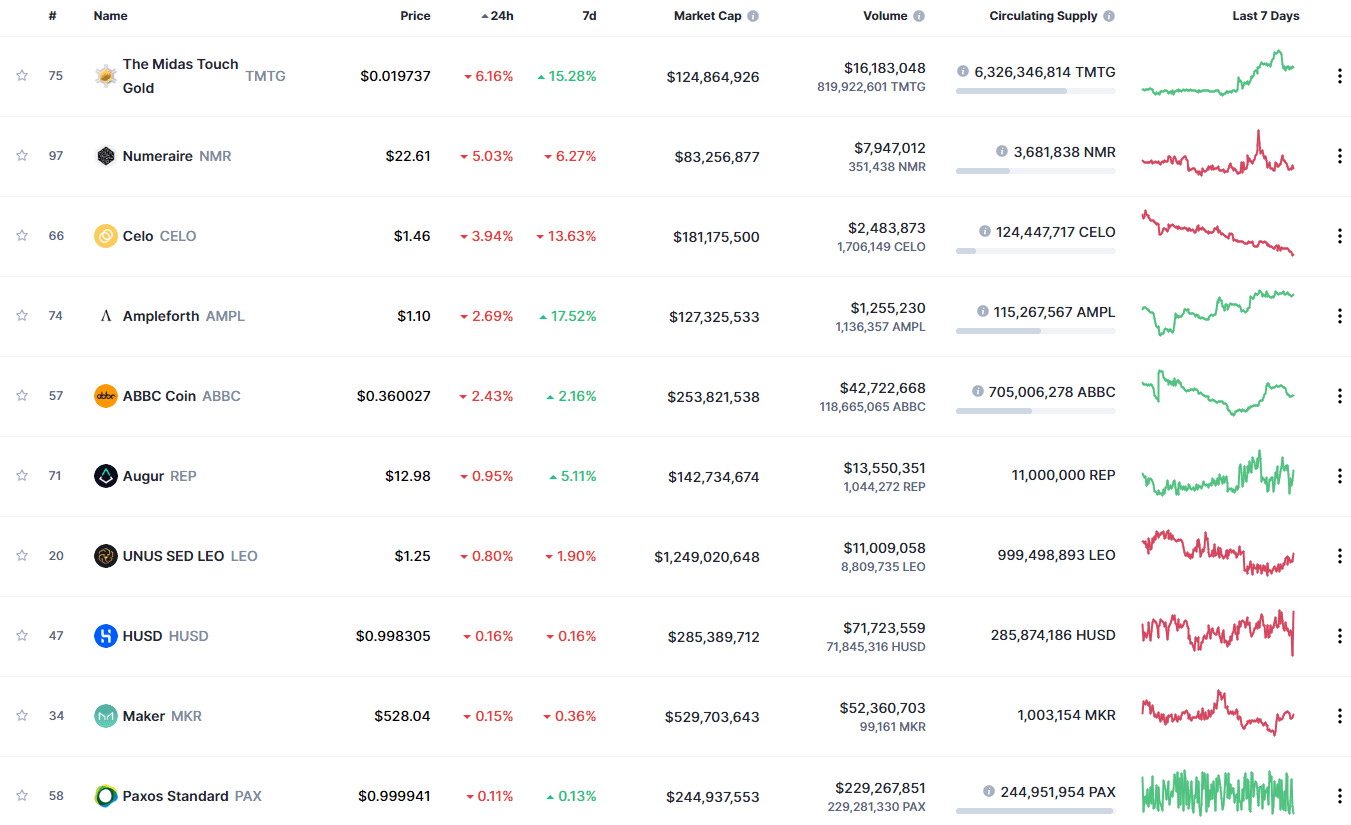
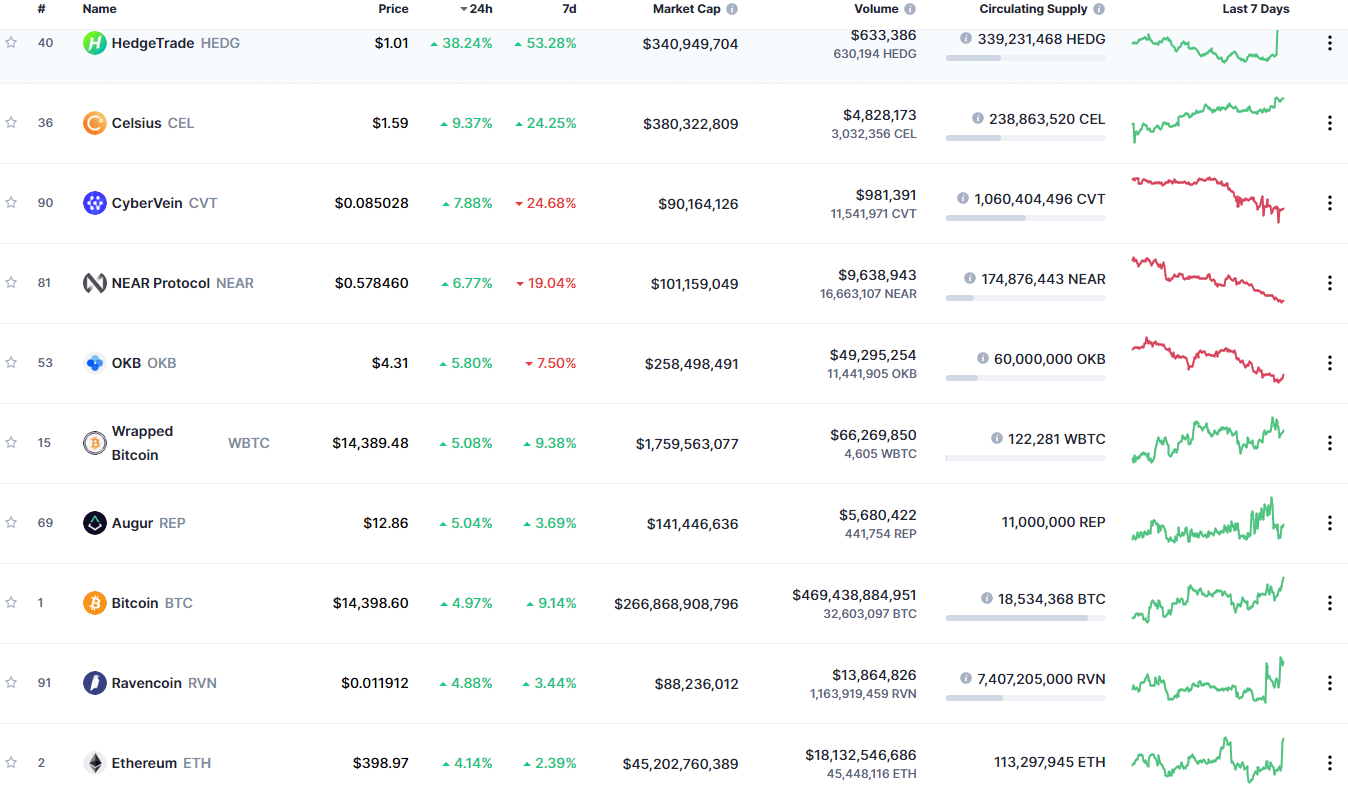
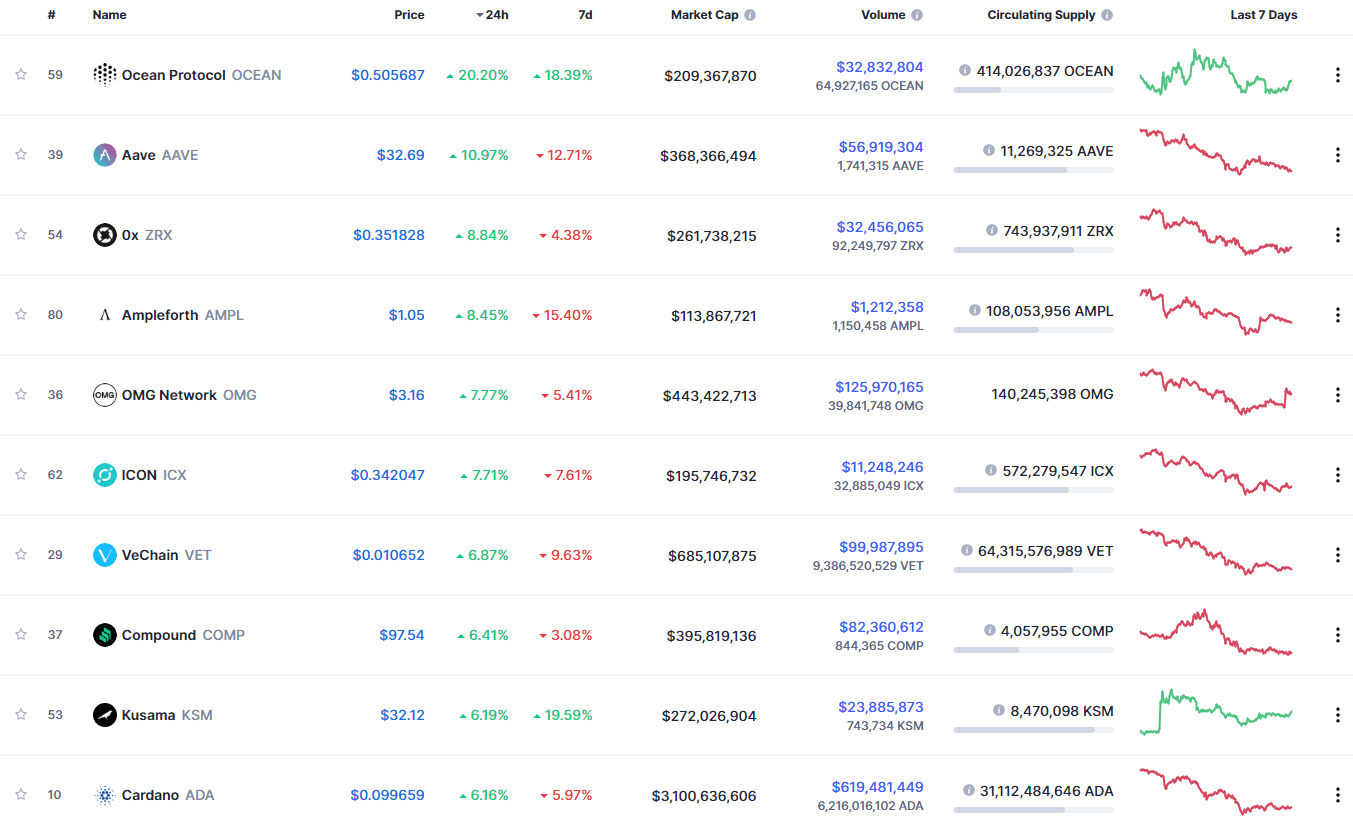
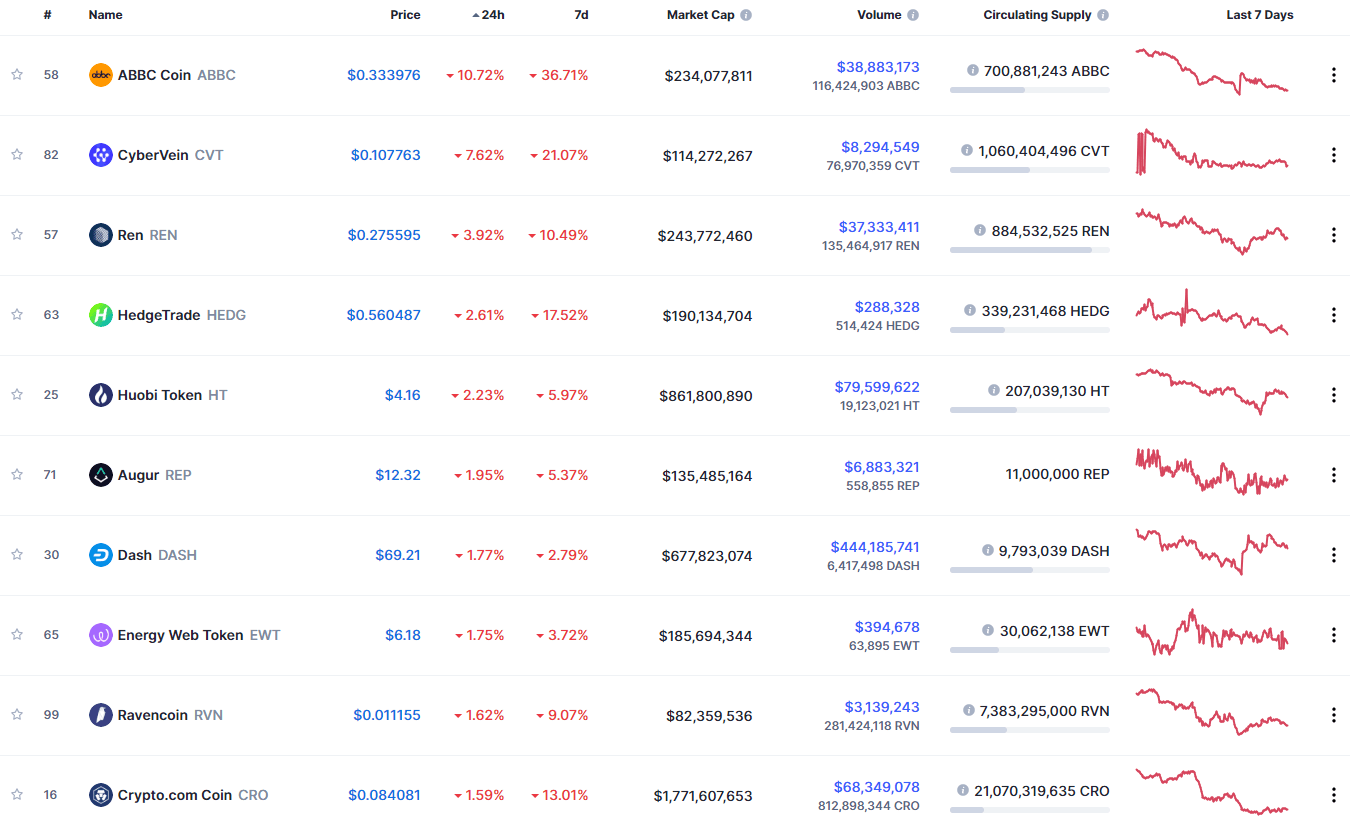
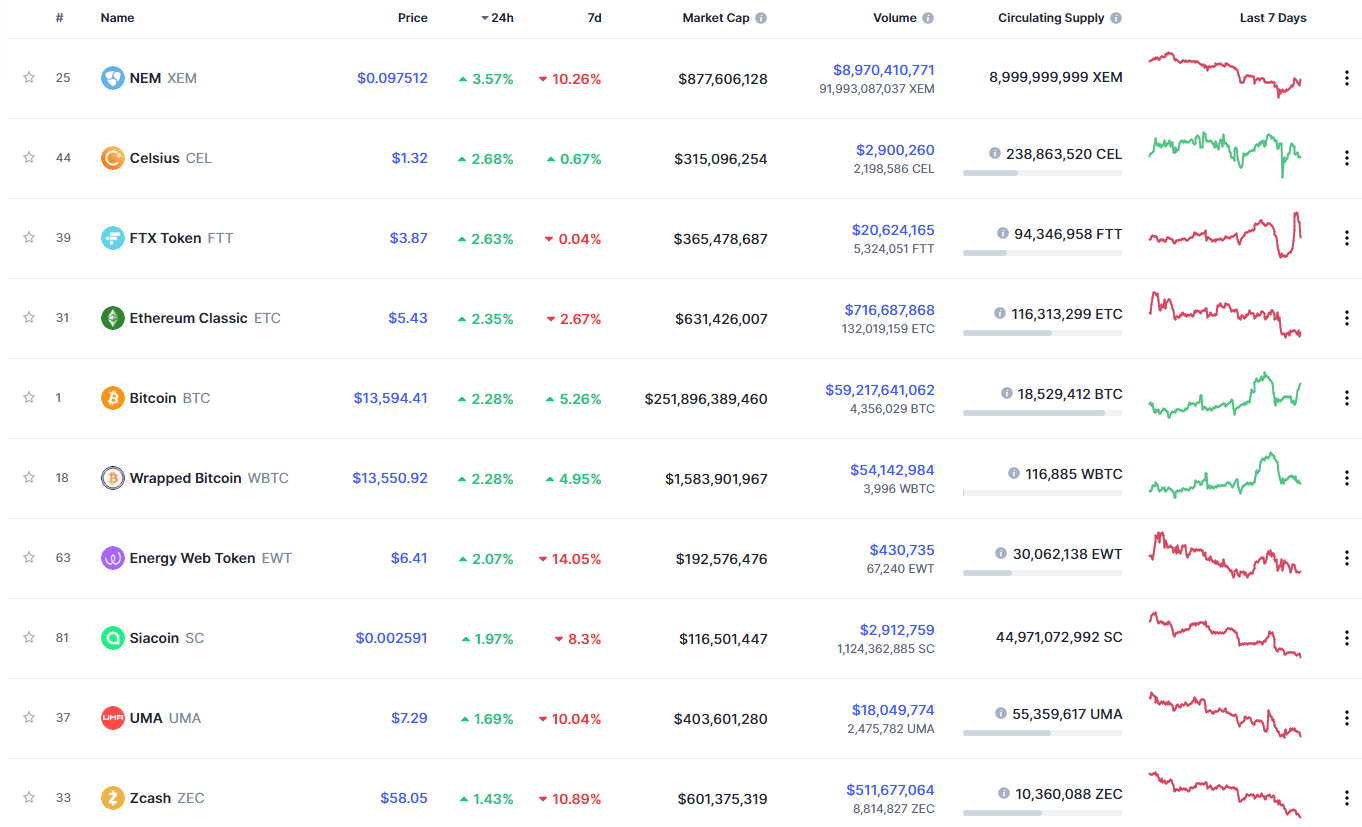
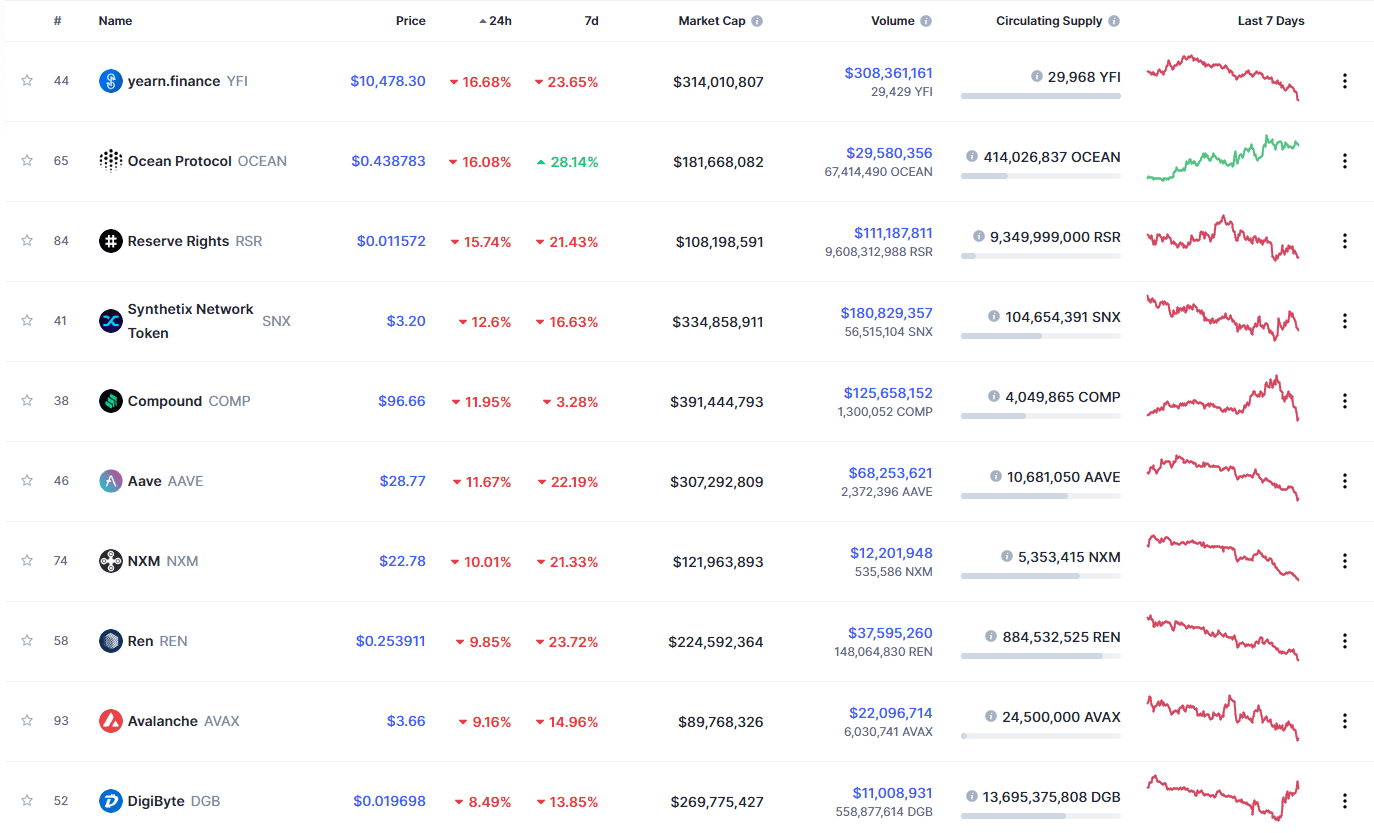
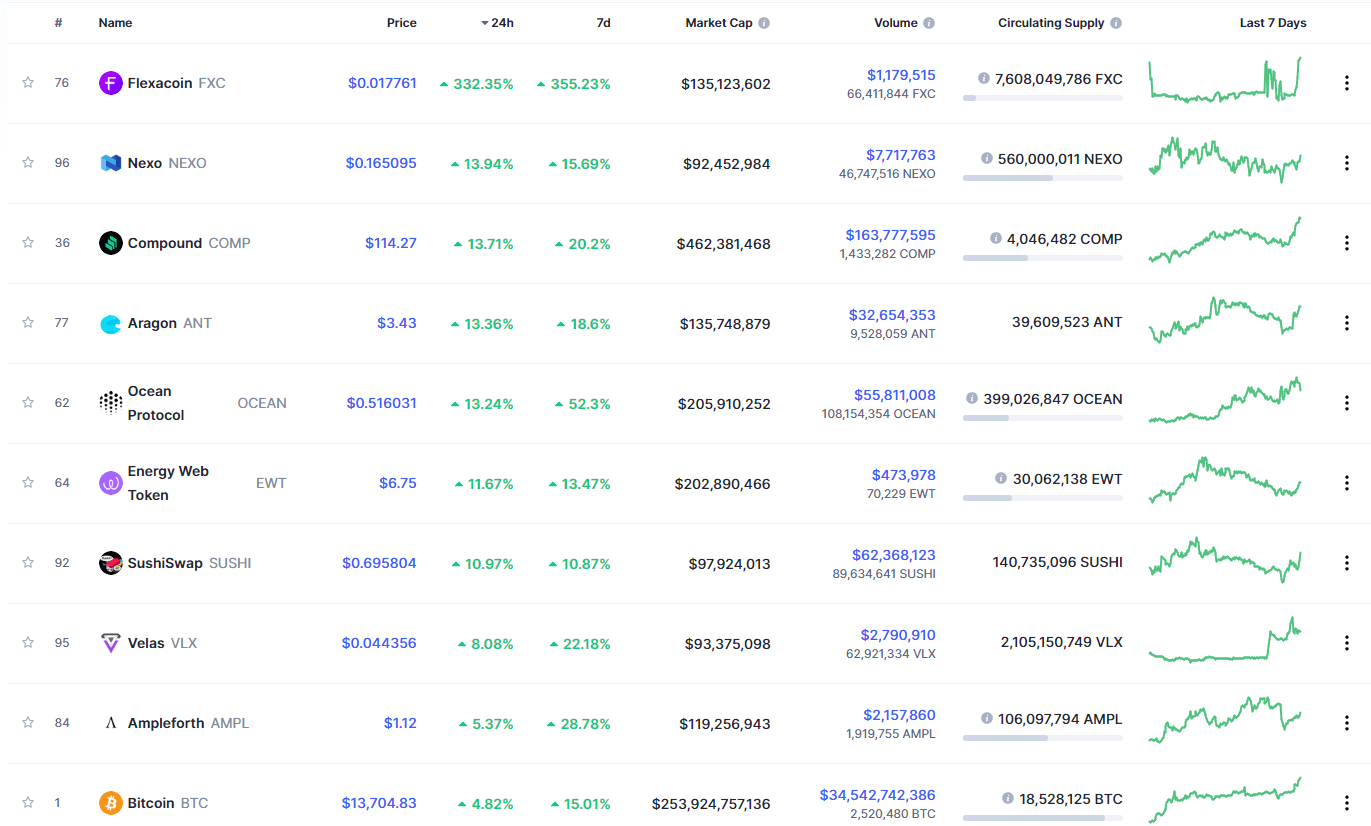
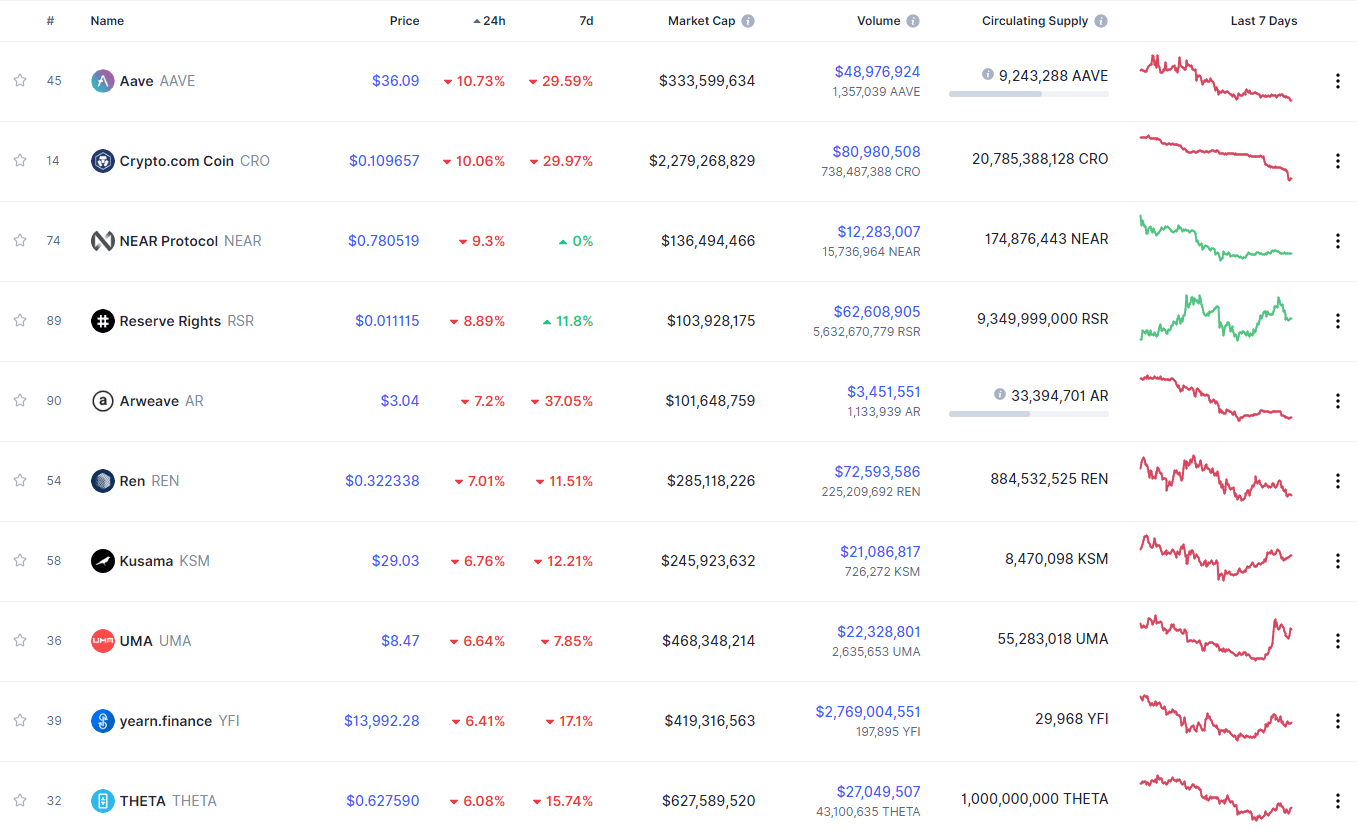
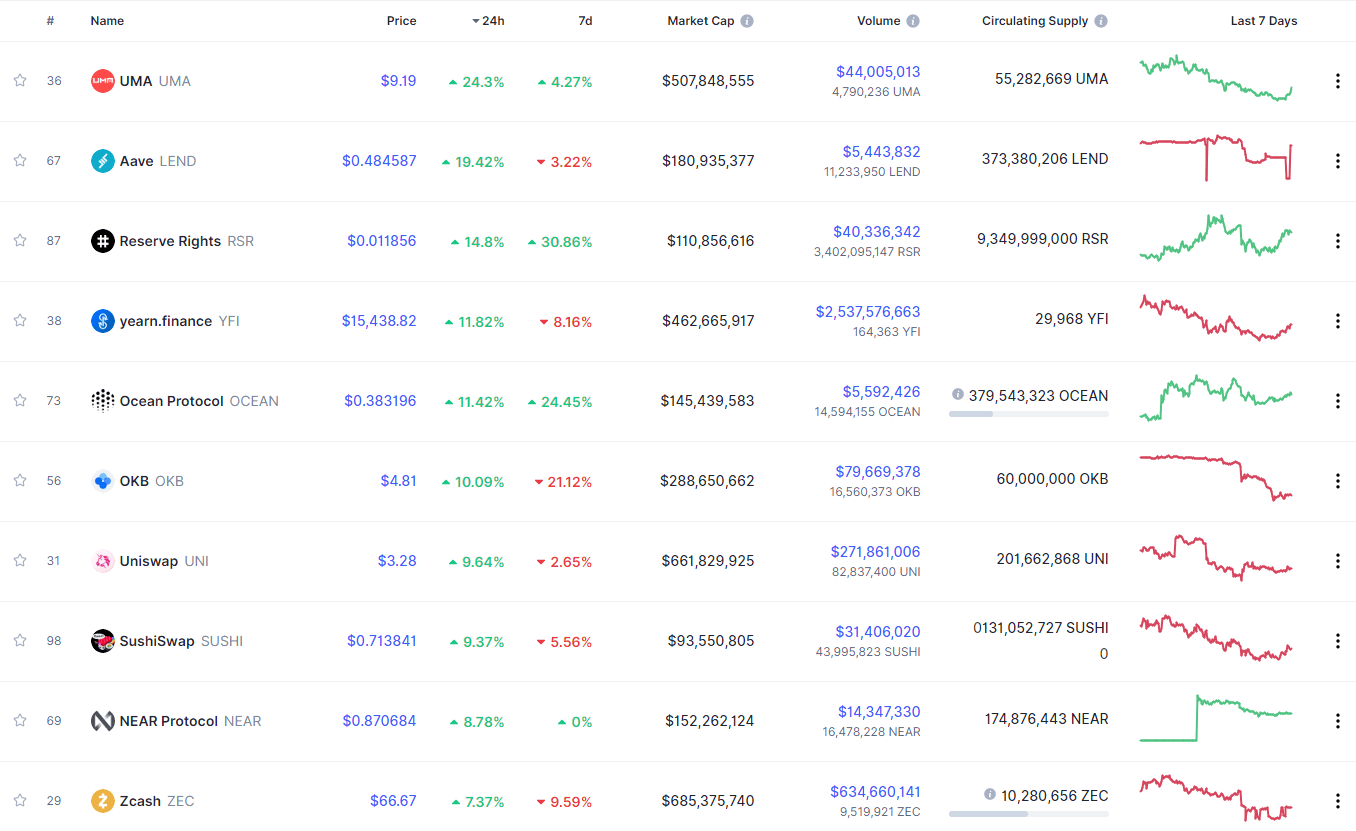
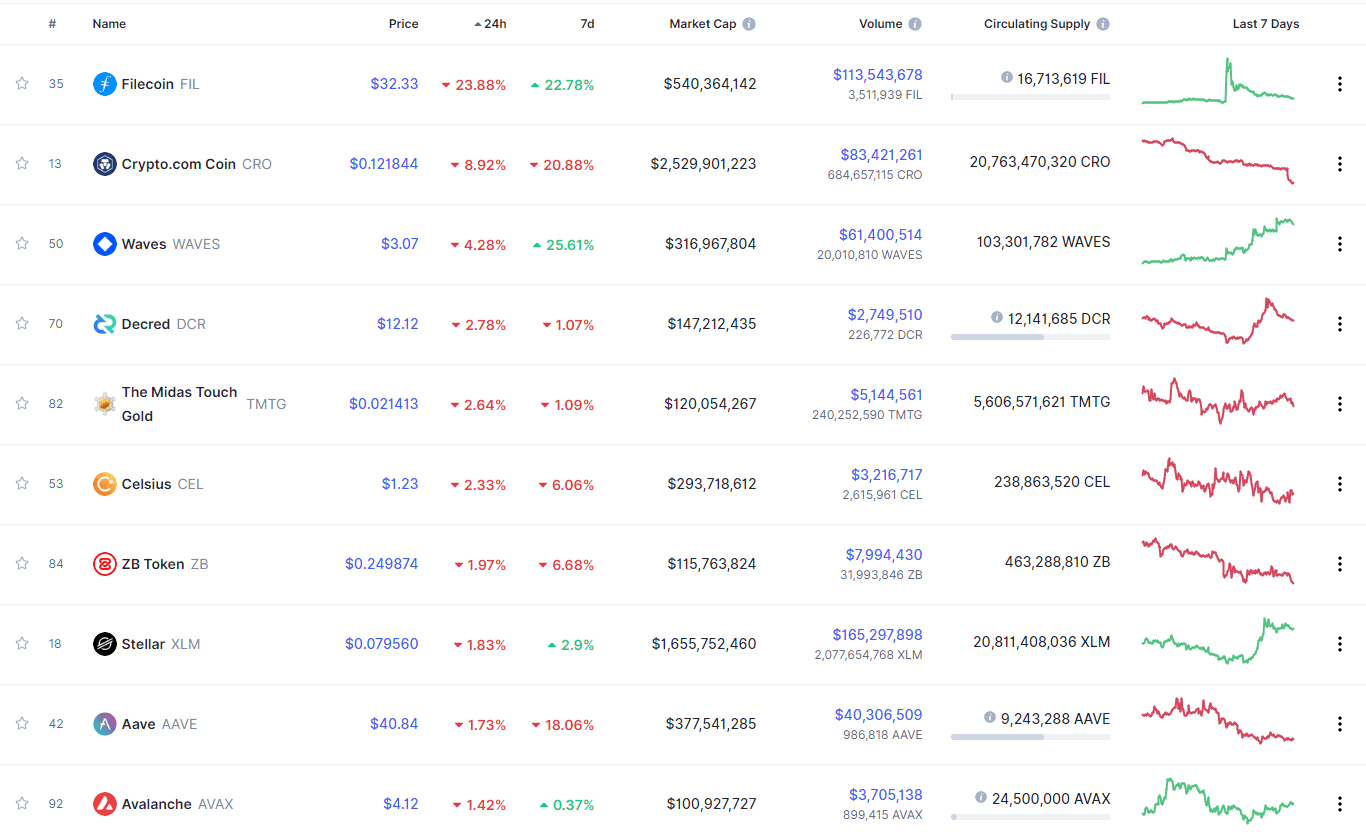
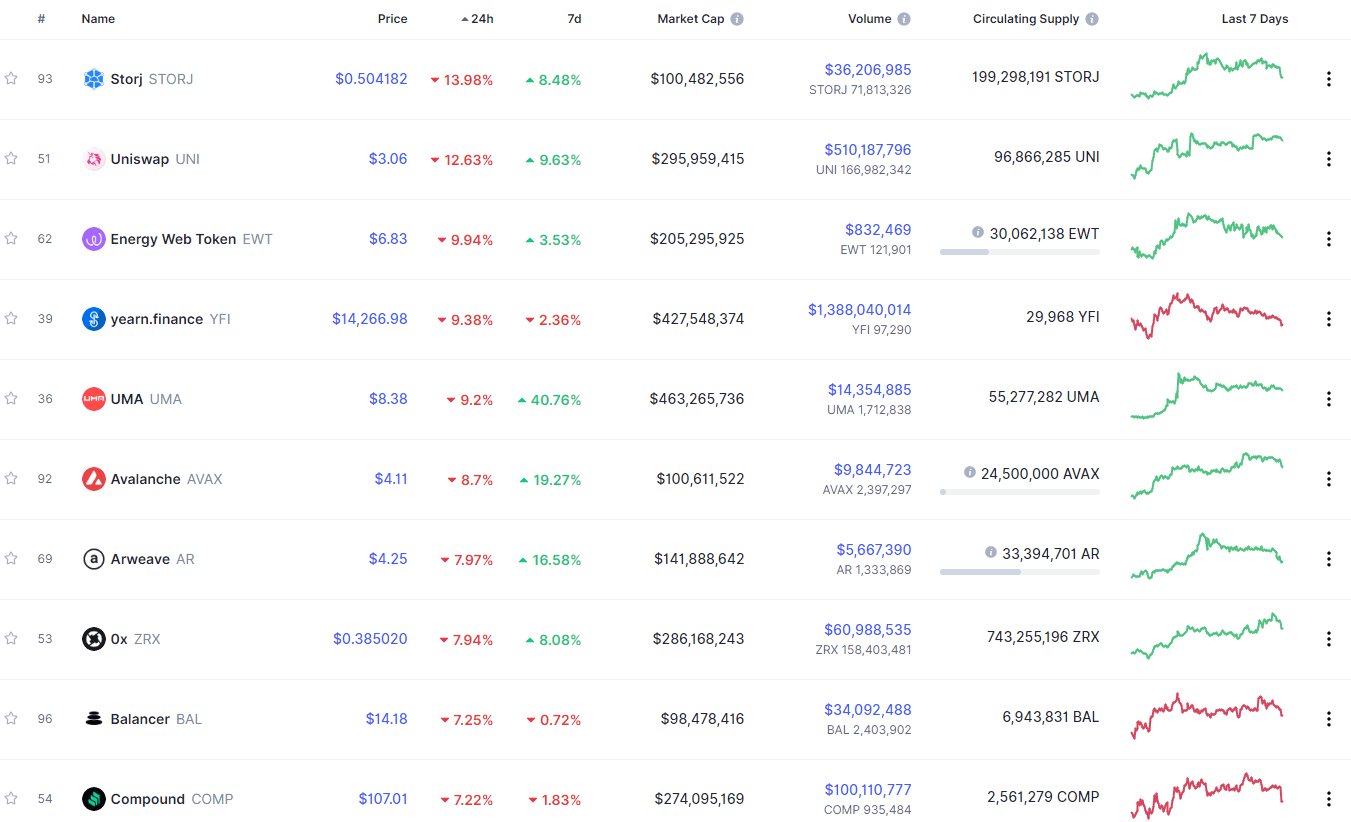
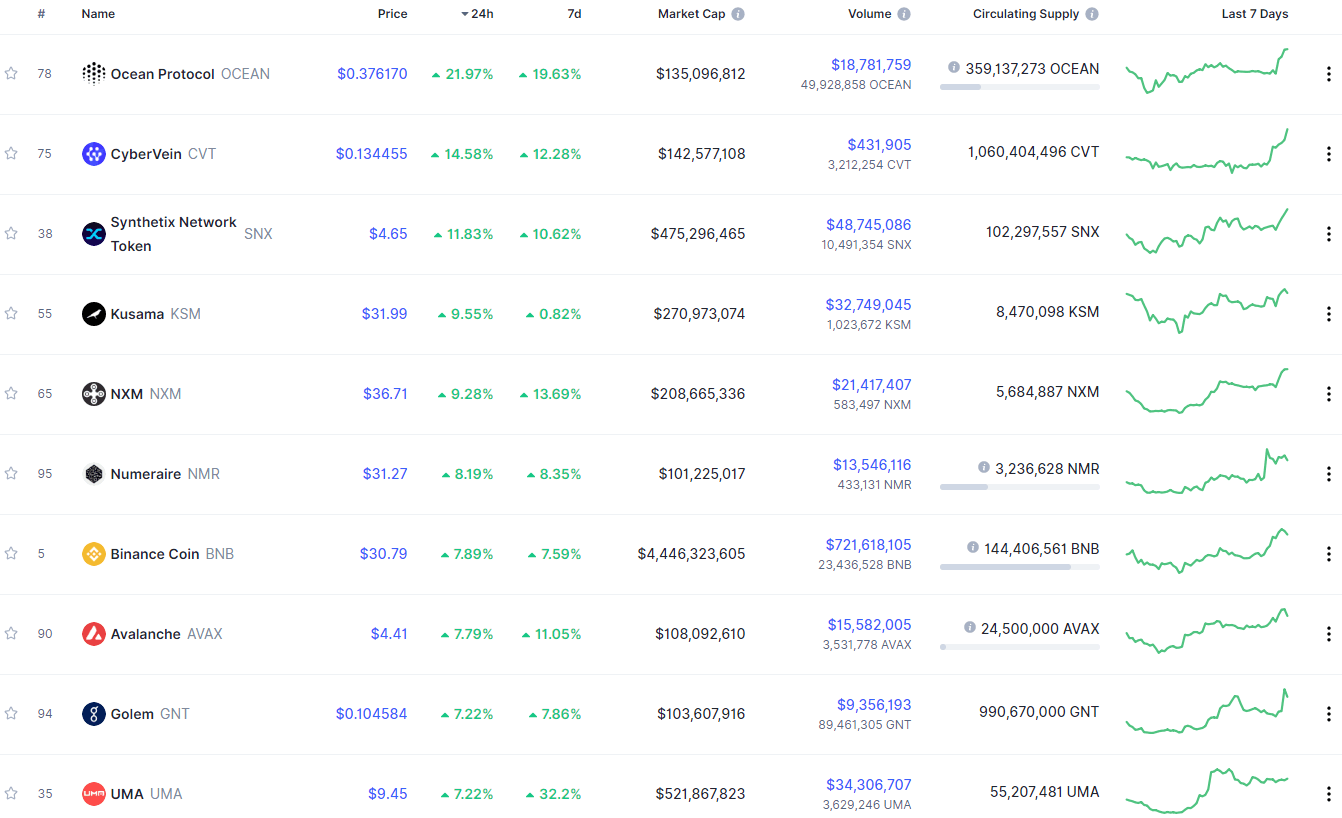
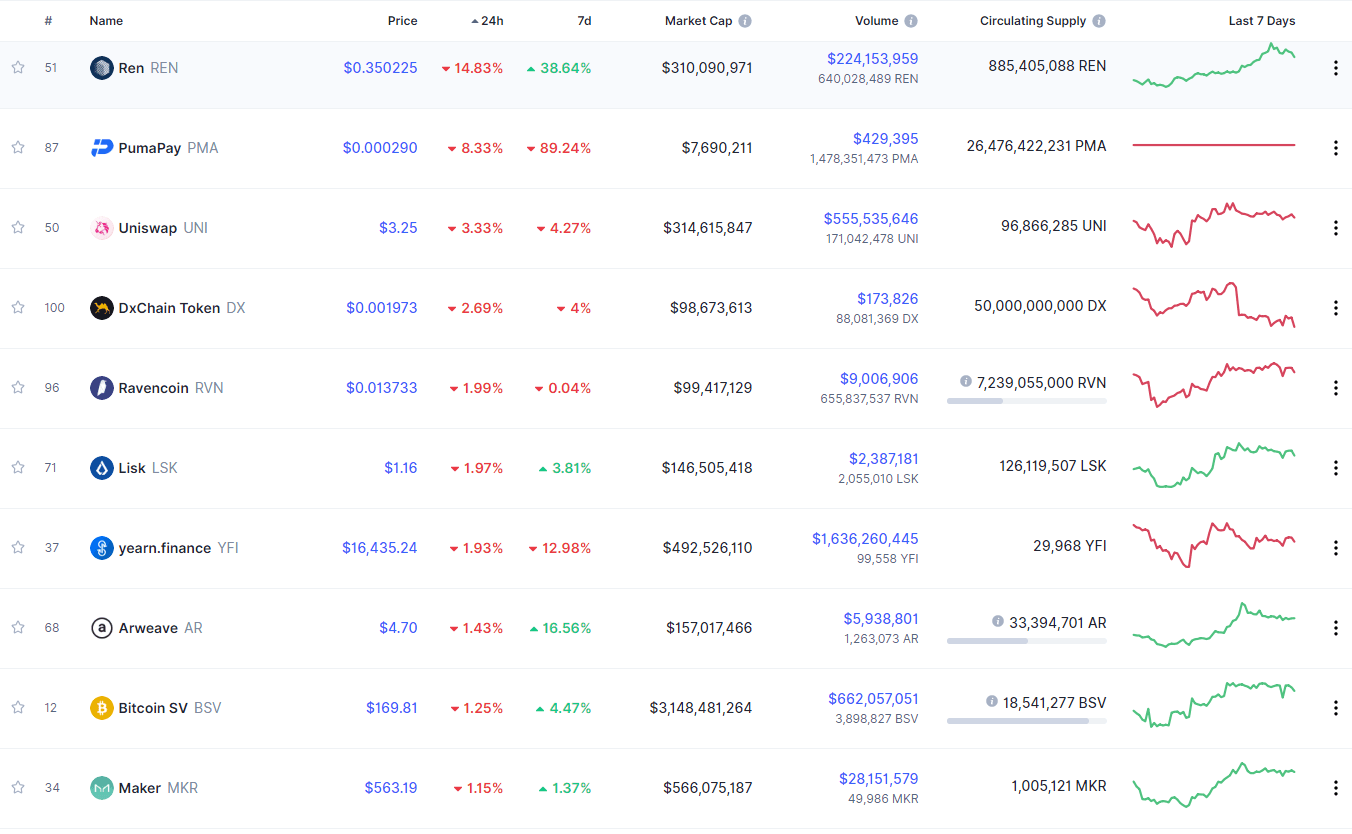
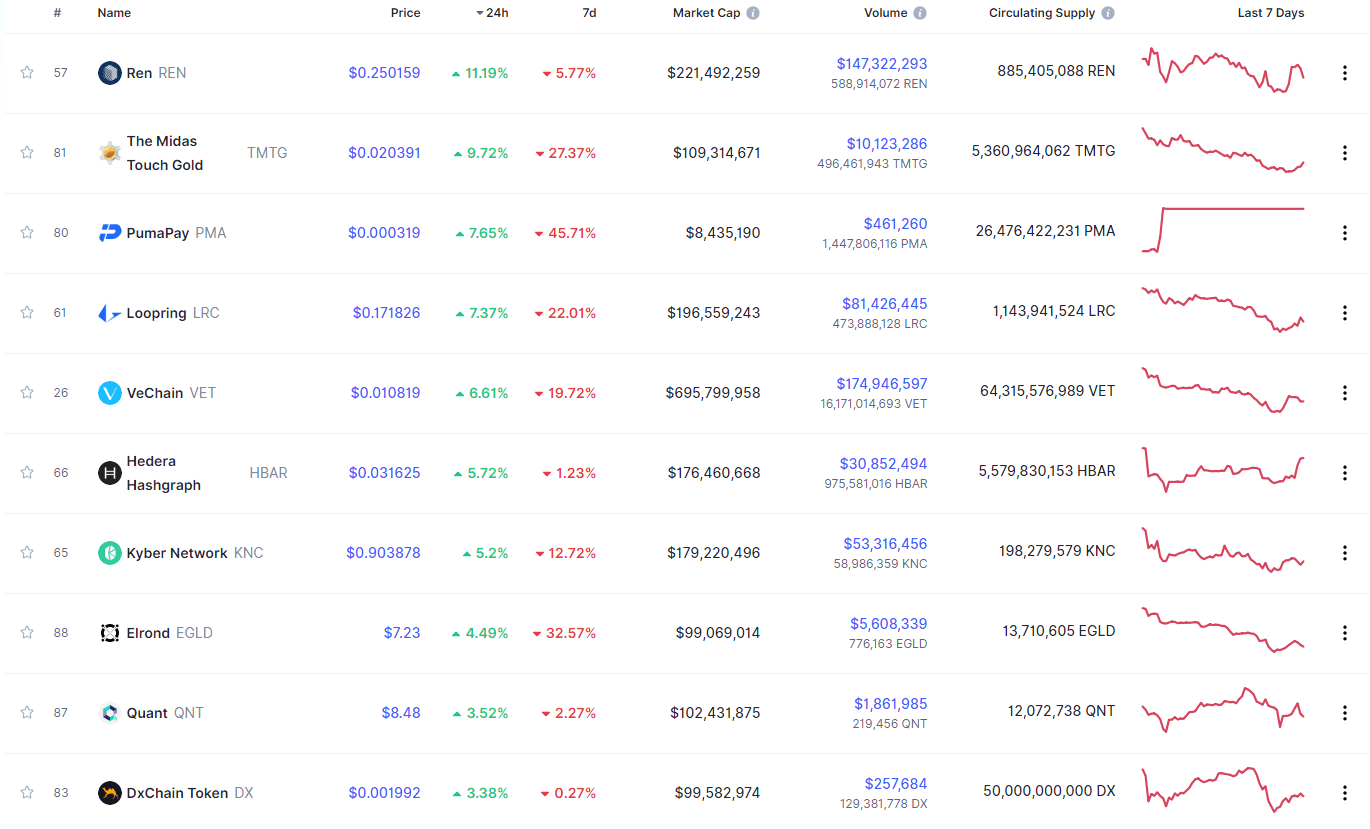
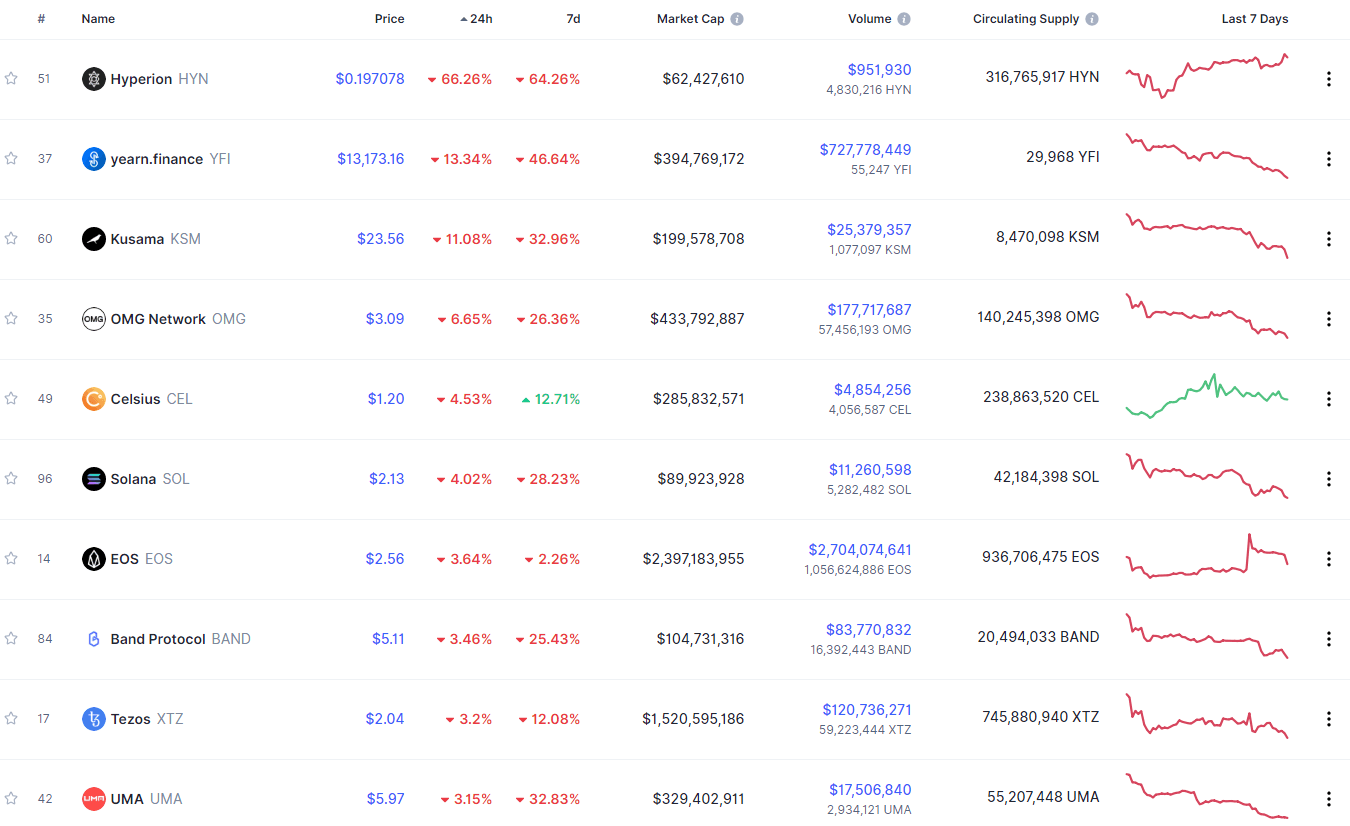
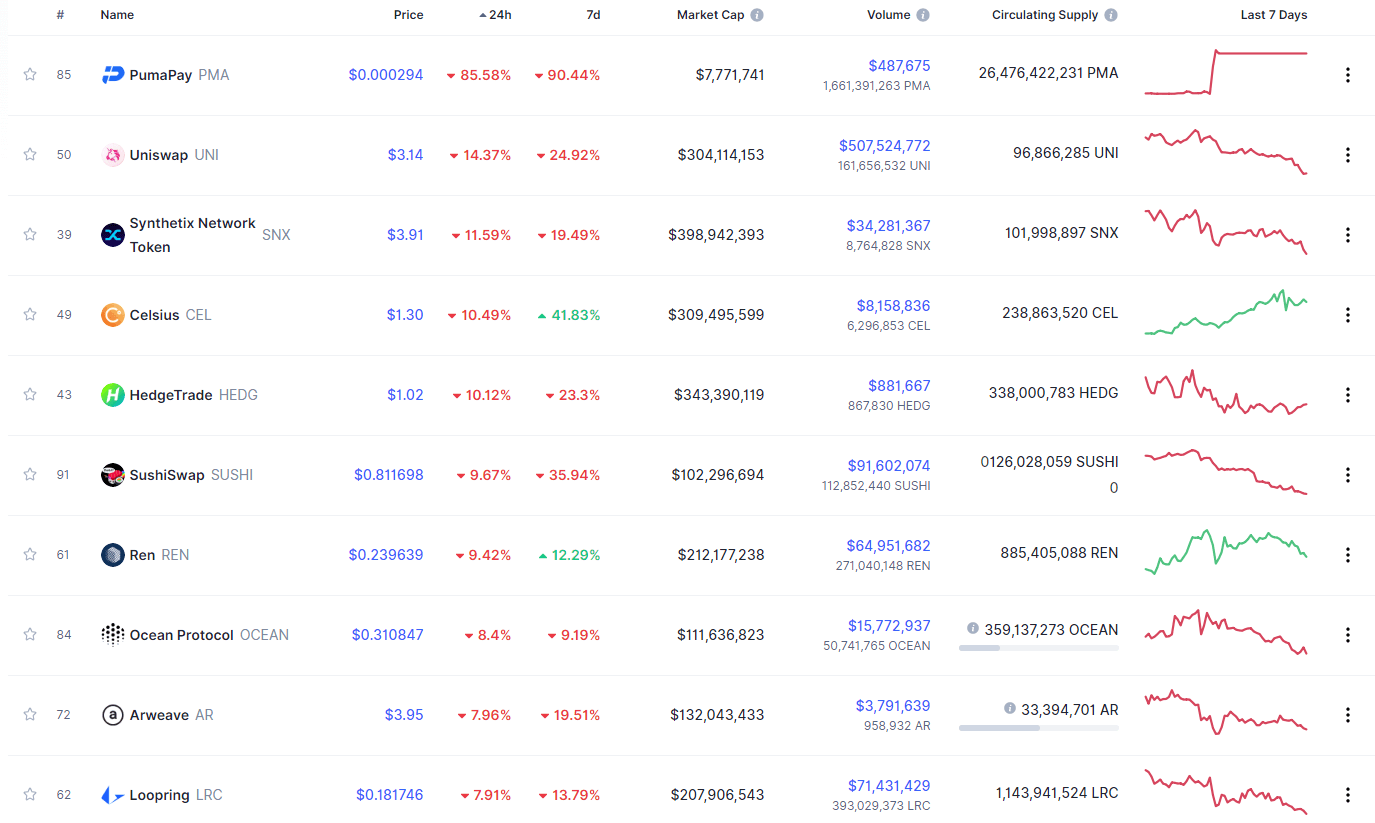
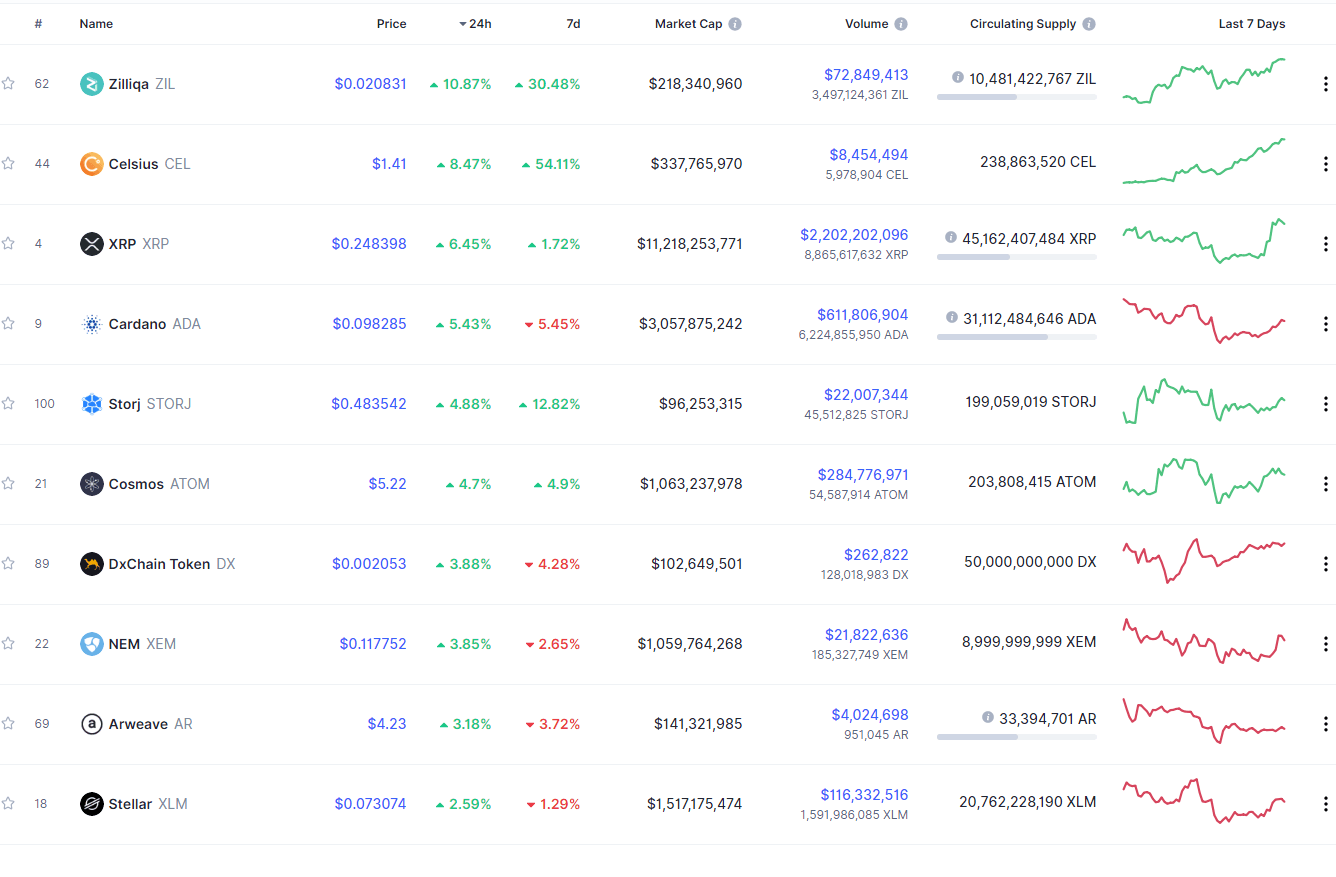
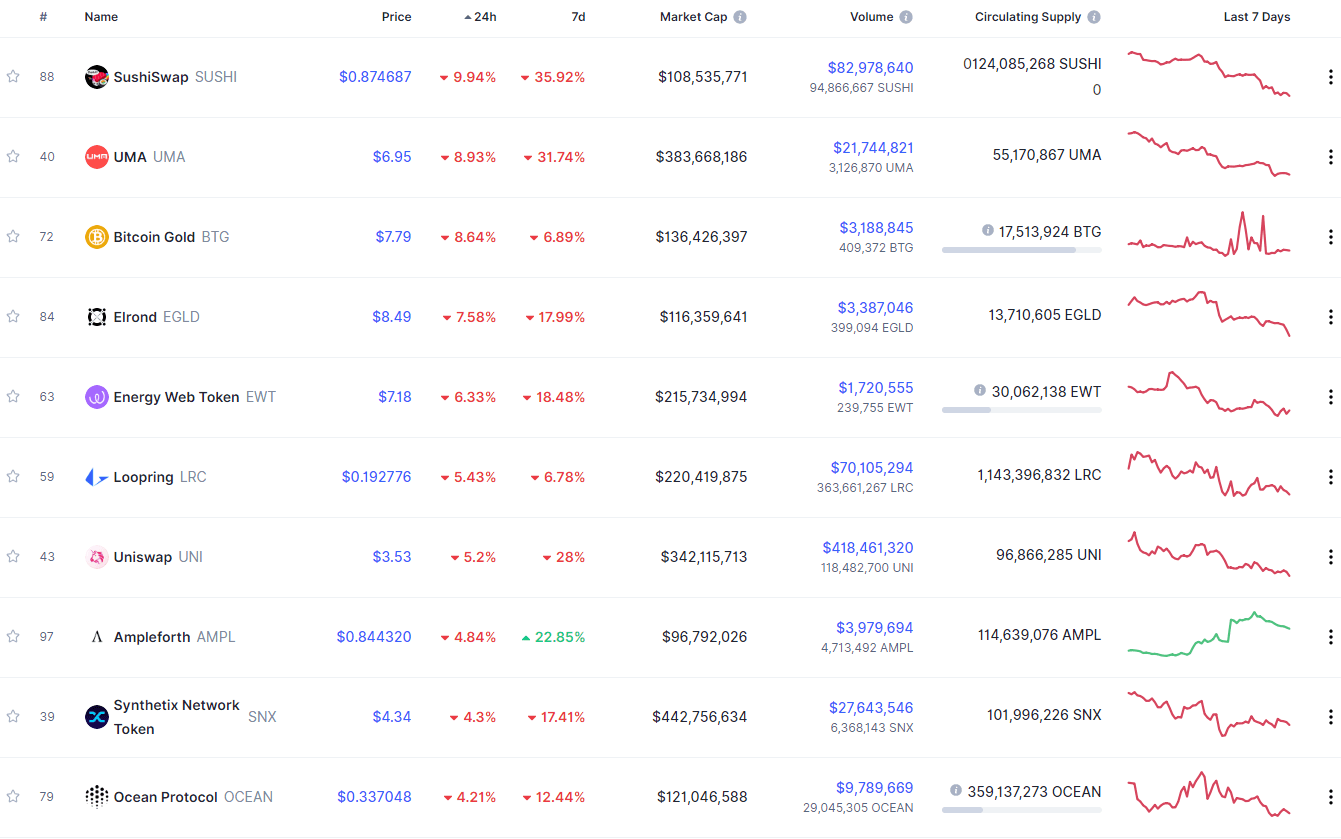
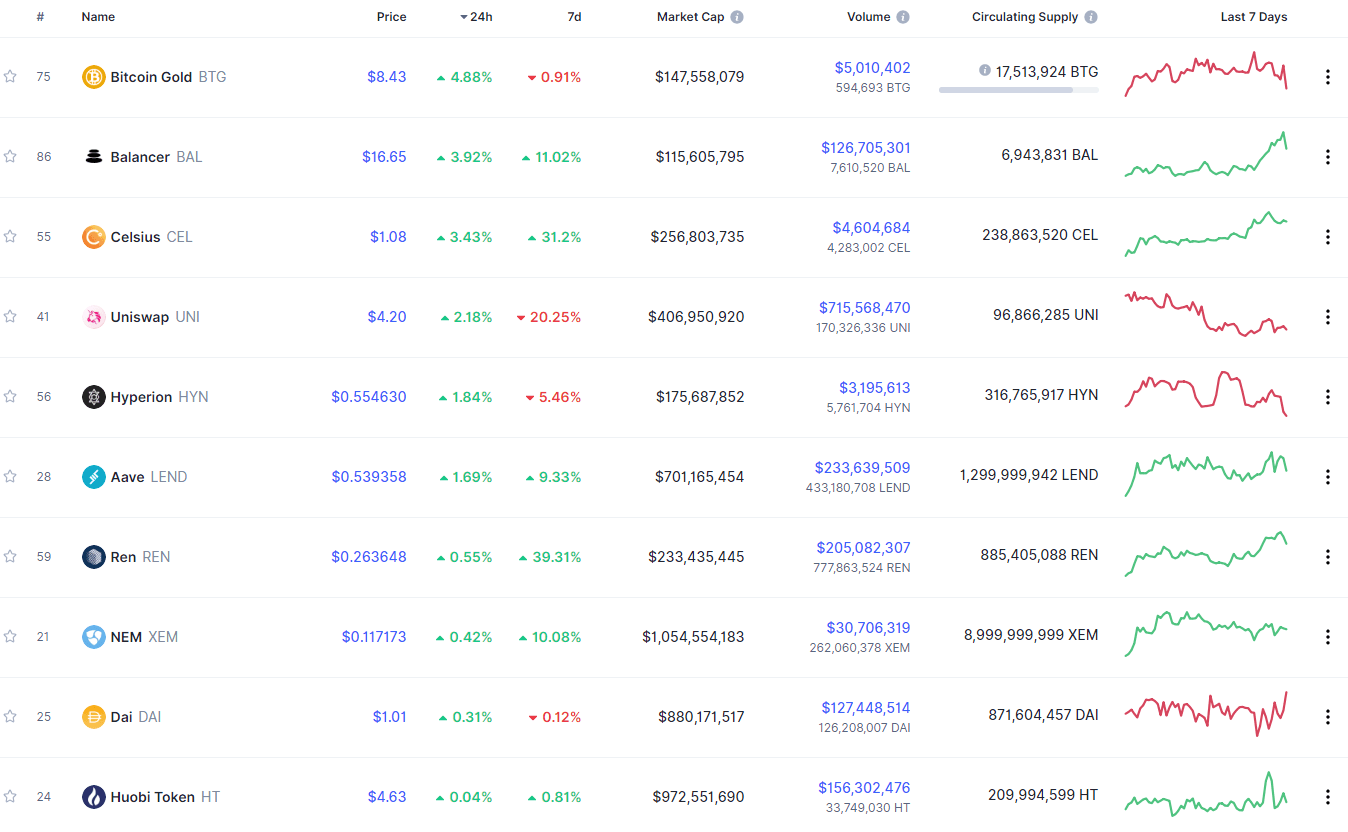
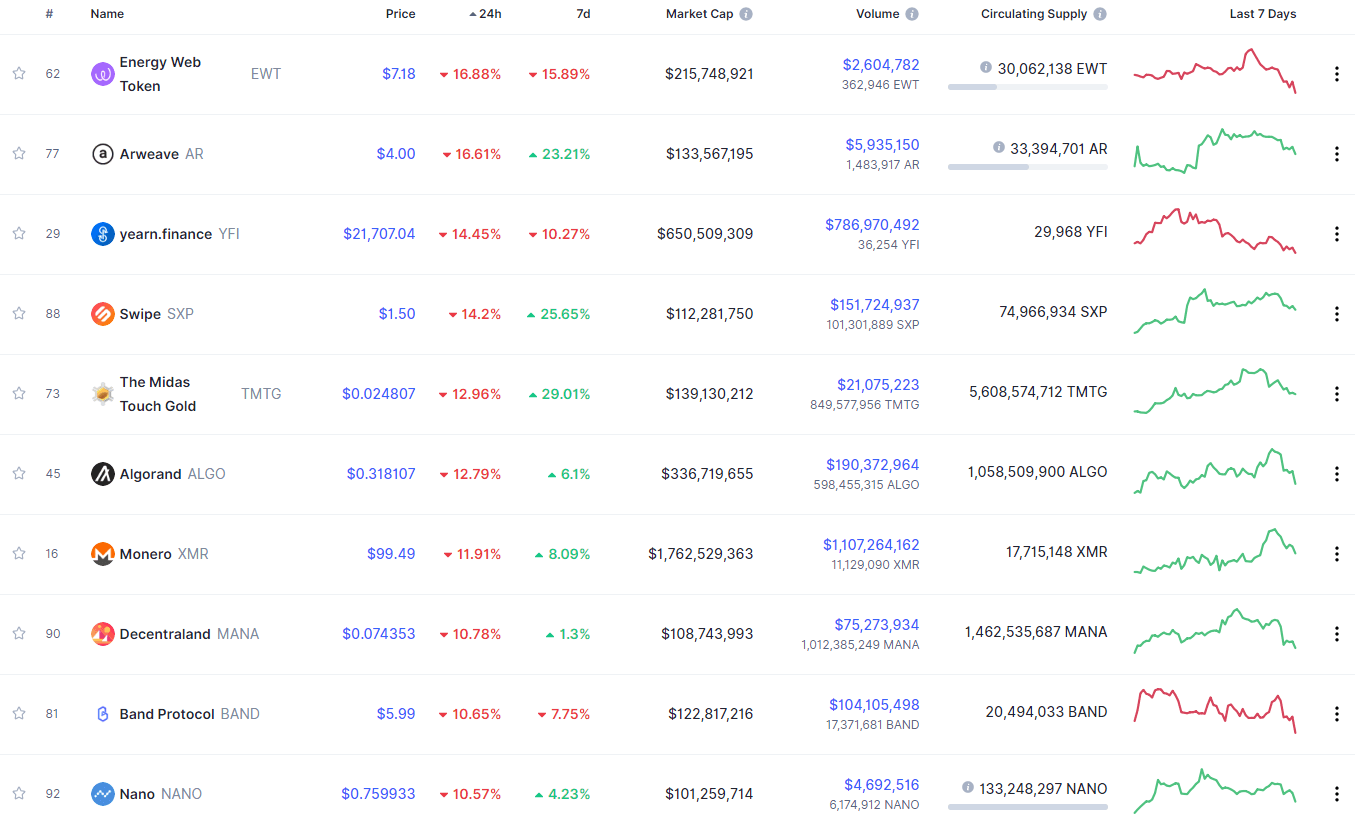
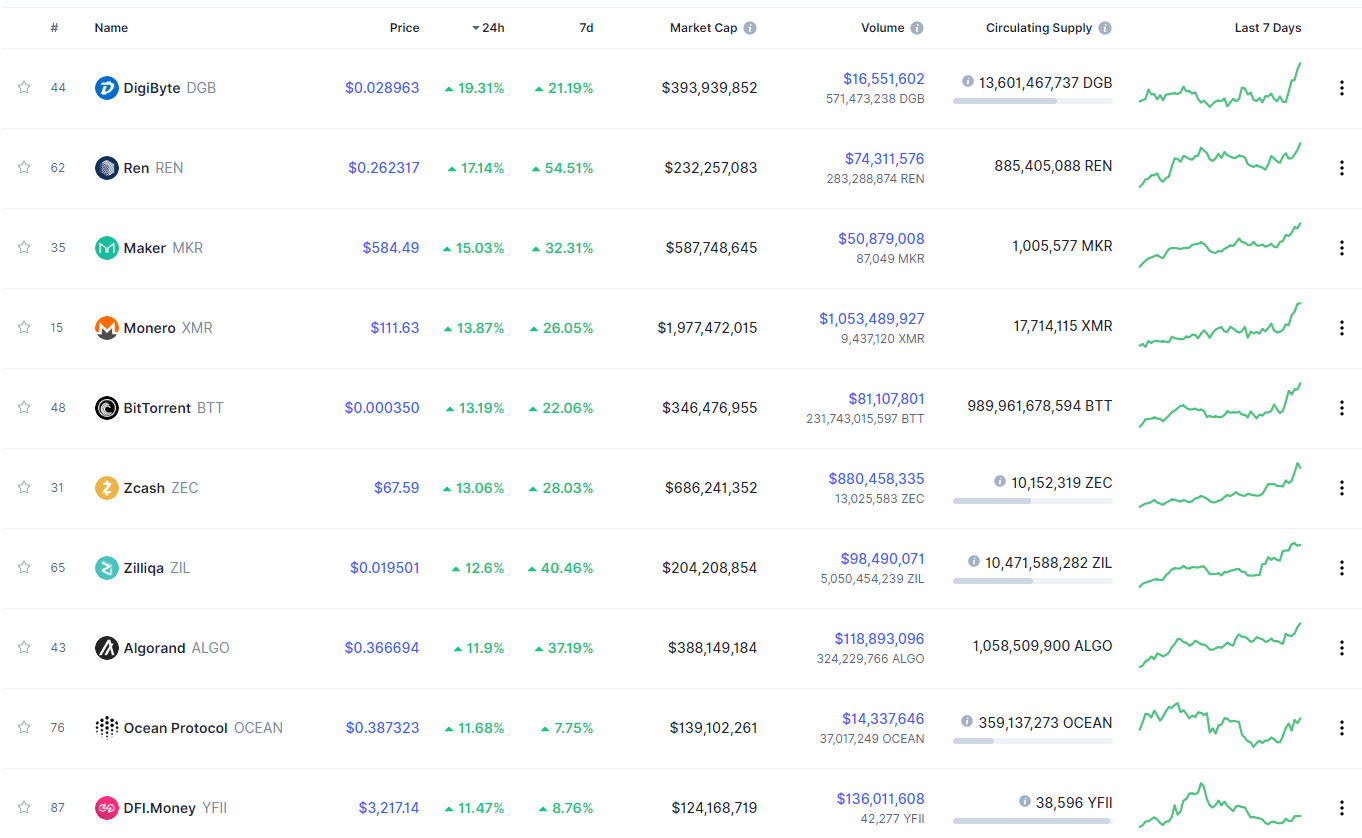
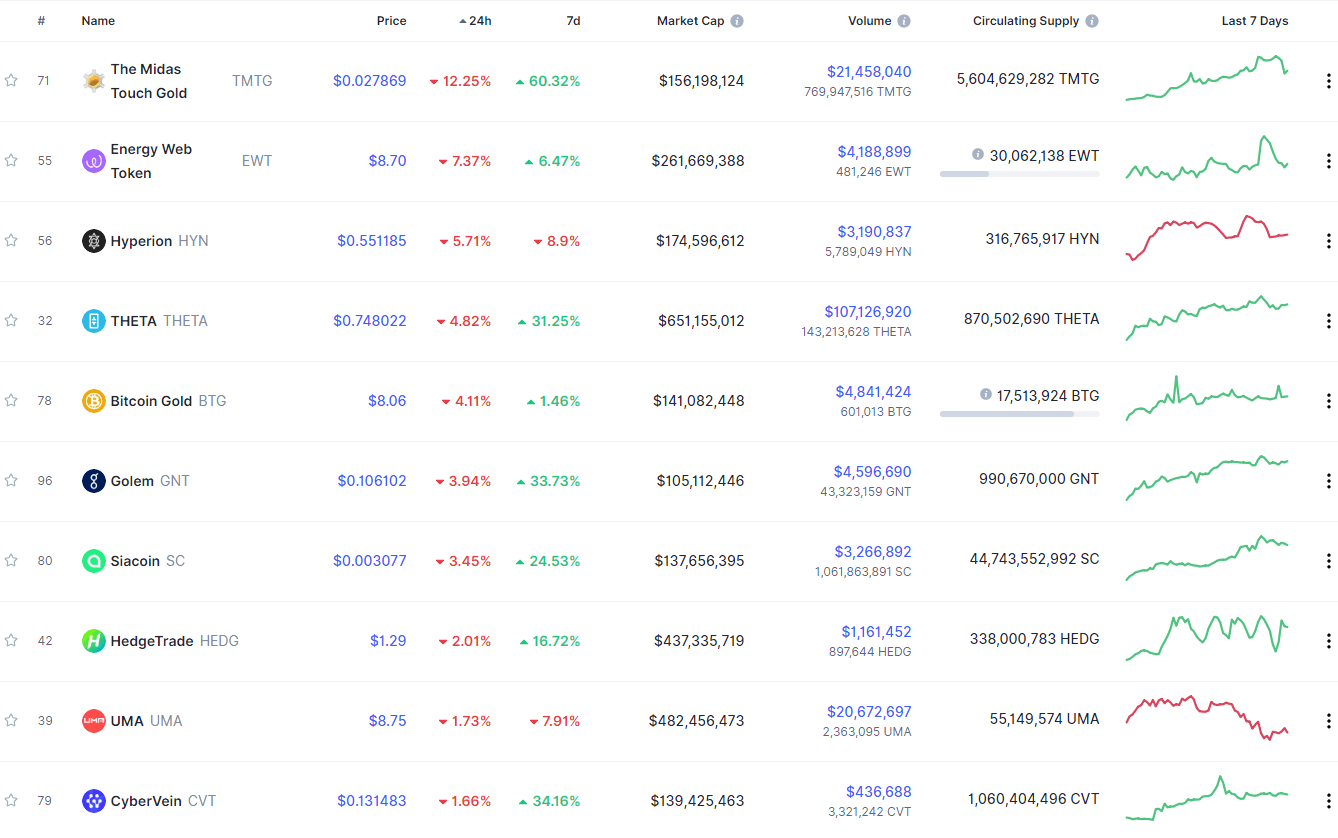
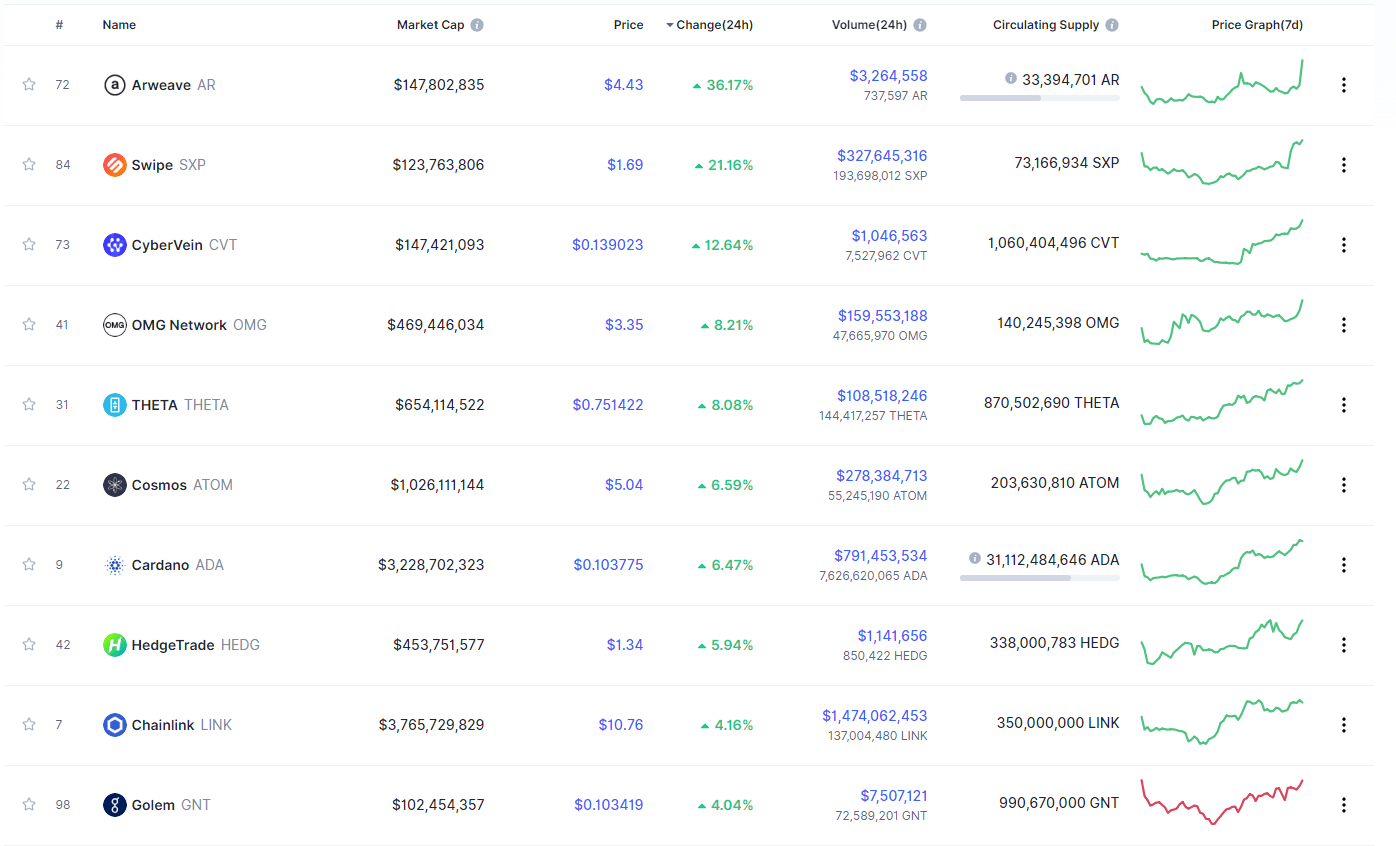
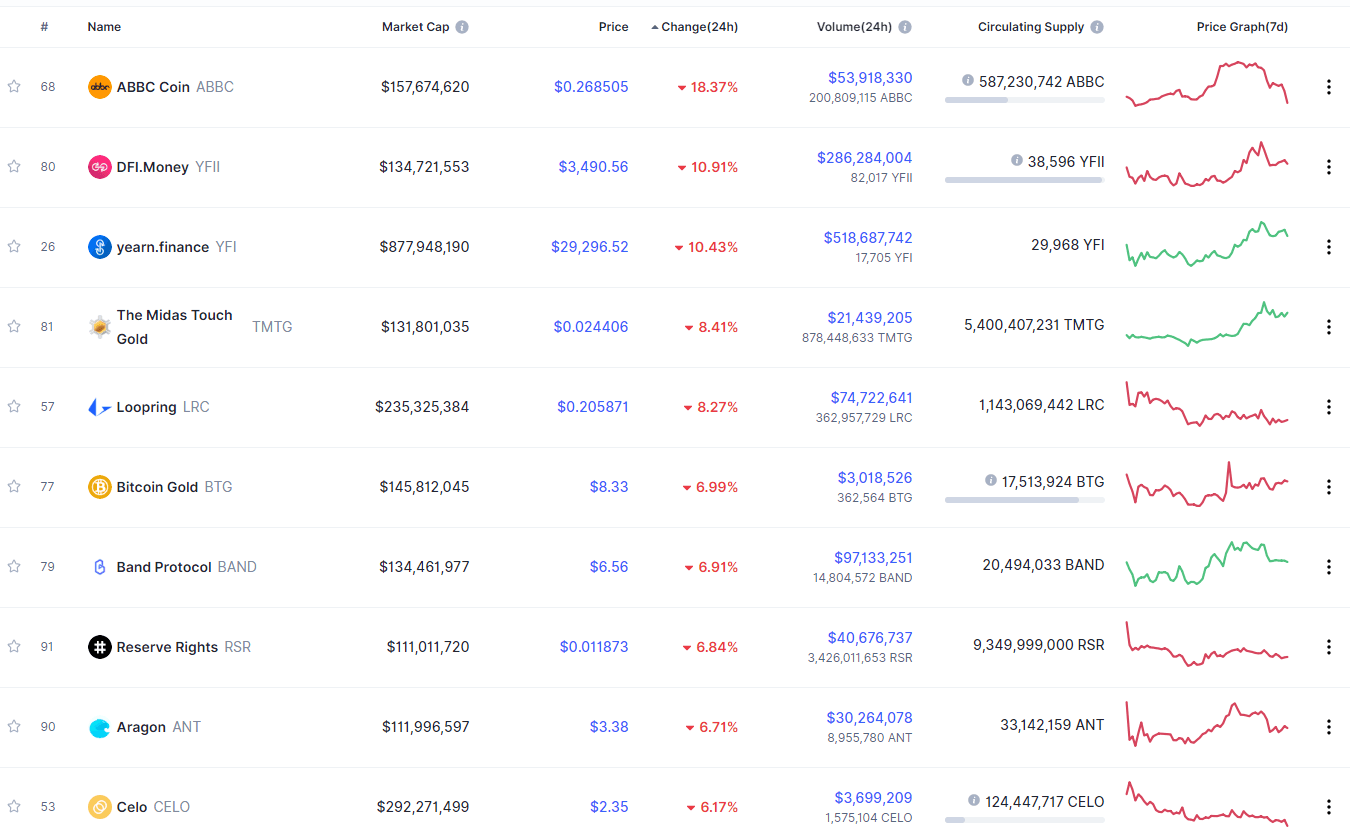
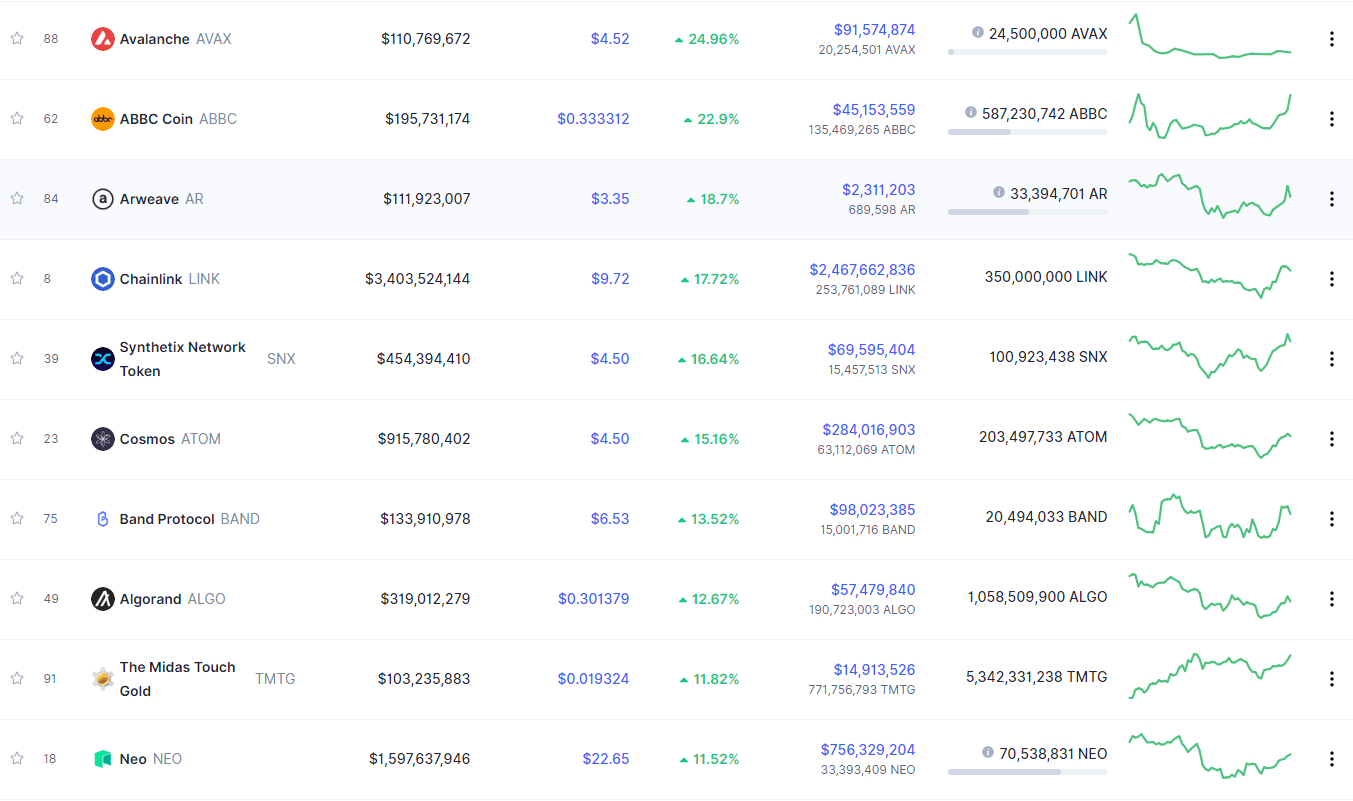
SushiSwap gained 31.44% in the past 24 hours, making it the most prominent daily gainer in the top100. It is closely followed by Aave’s gain of 15.05% and Nano’s 14.68% gain. On the other hand, Crypto.com Coin lost 10.20%, making it the most prominent daily loser. NEM lost 9.92% while OMG Network lost 9.43%, making them the 2nd and 3rd most prominent daily losers.
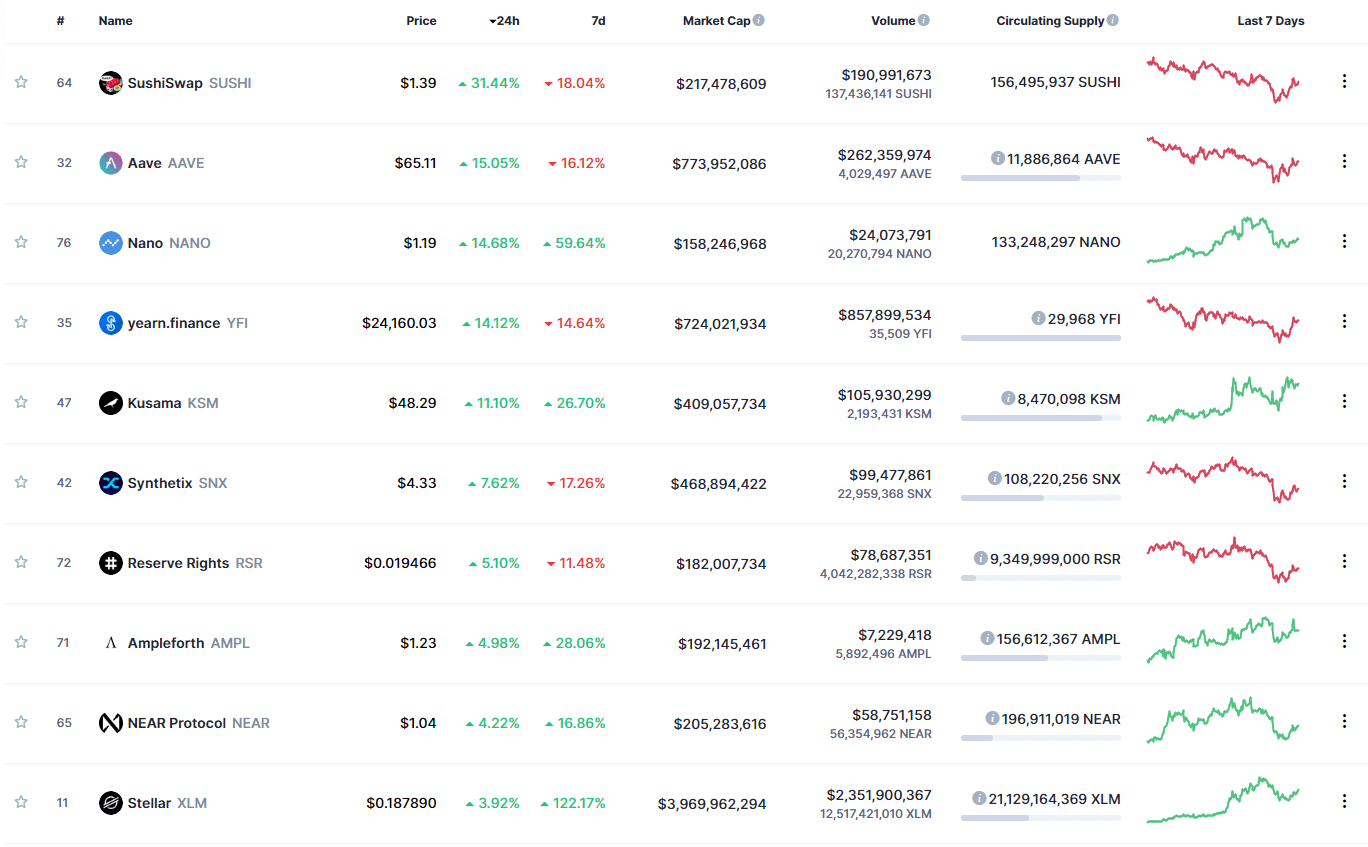
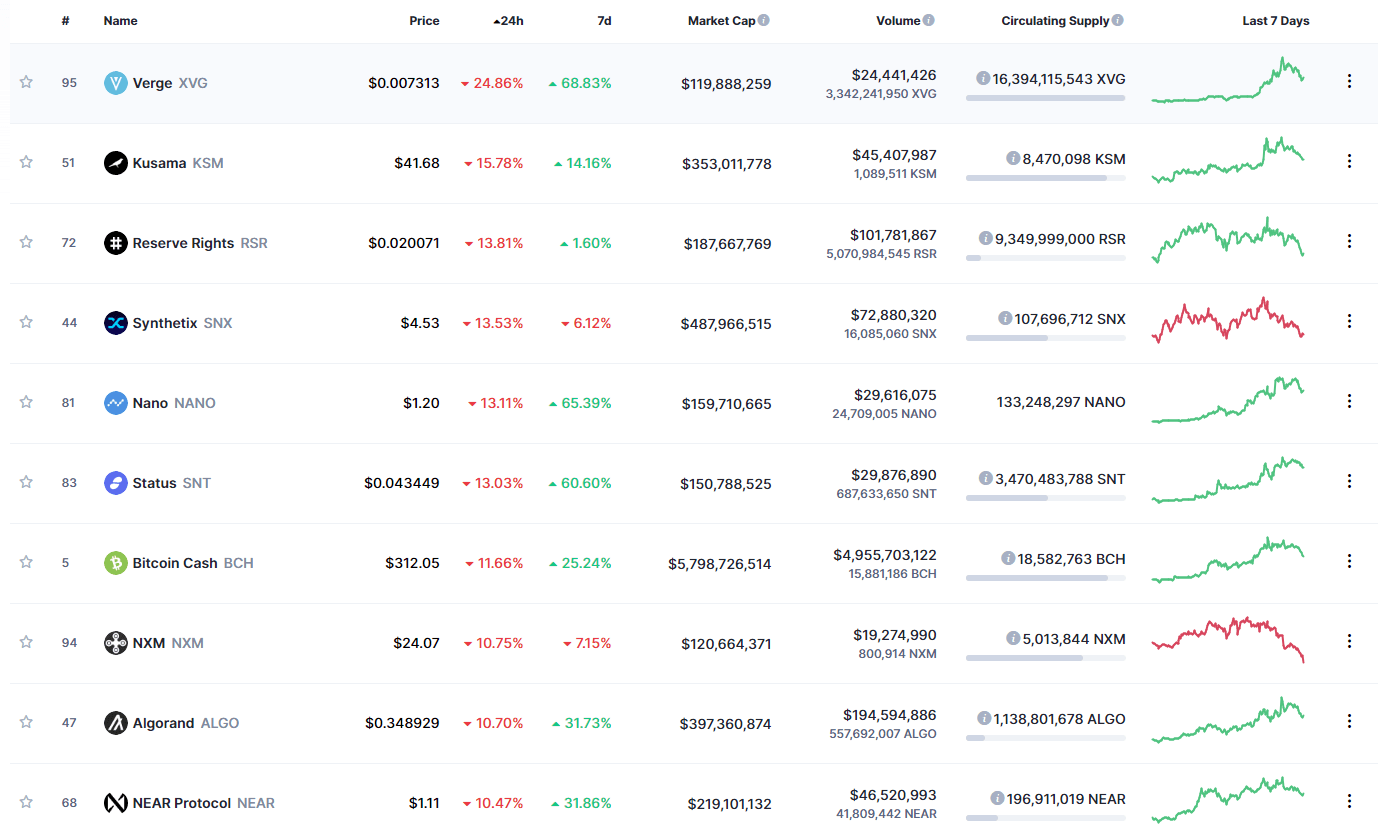
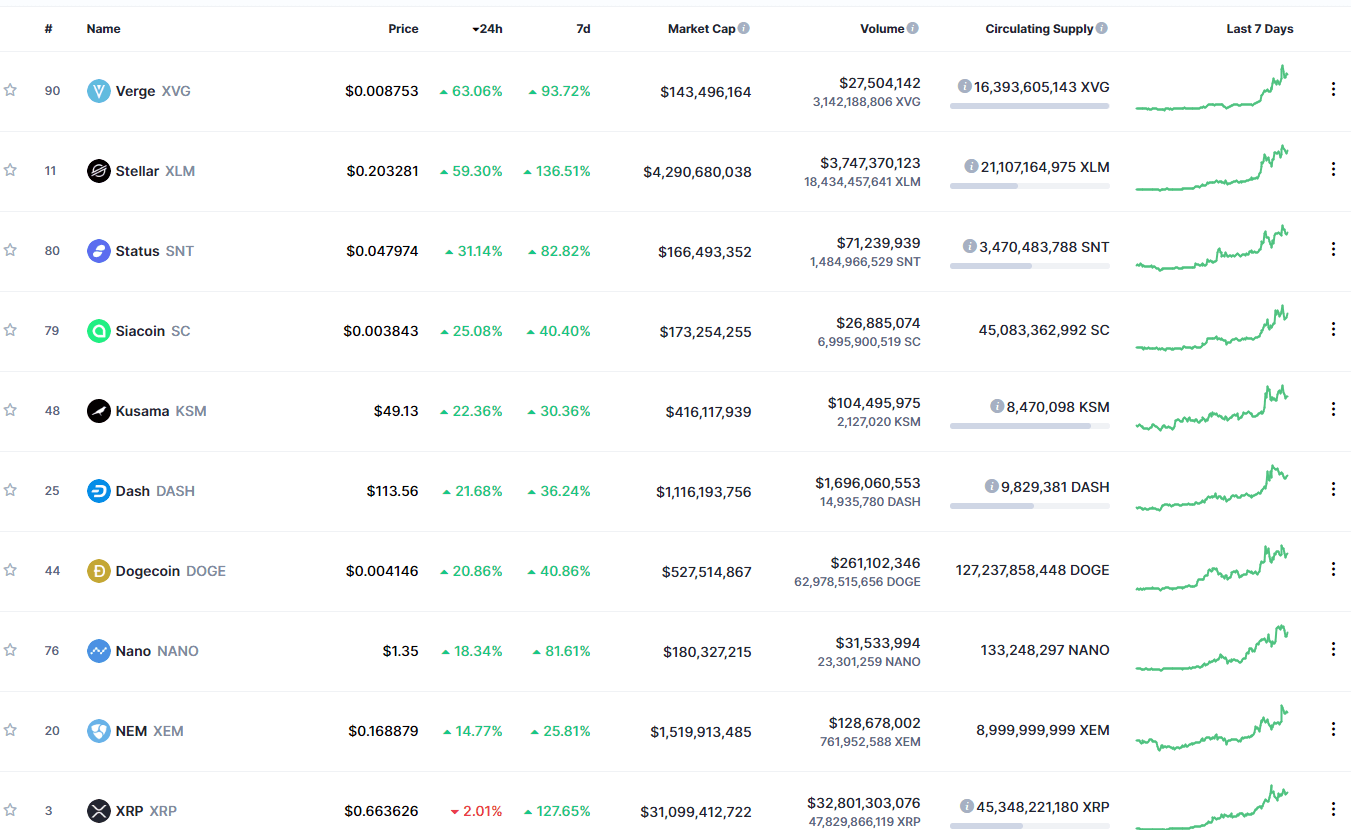
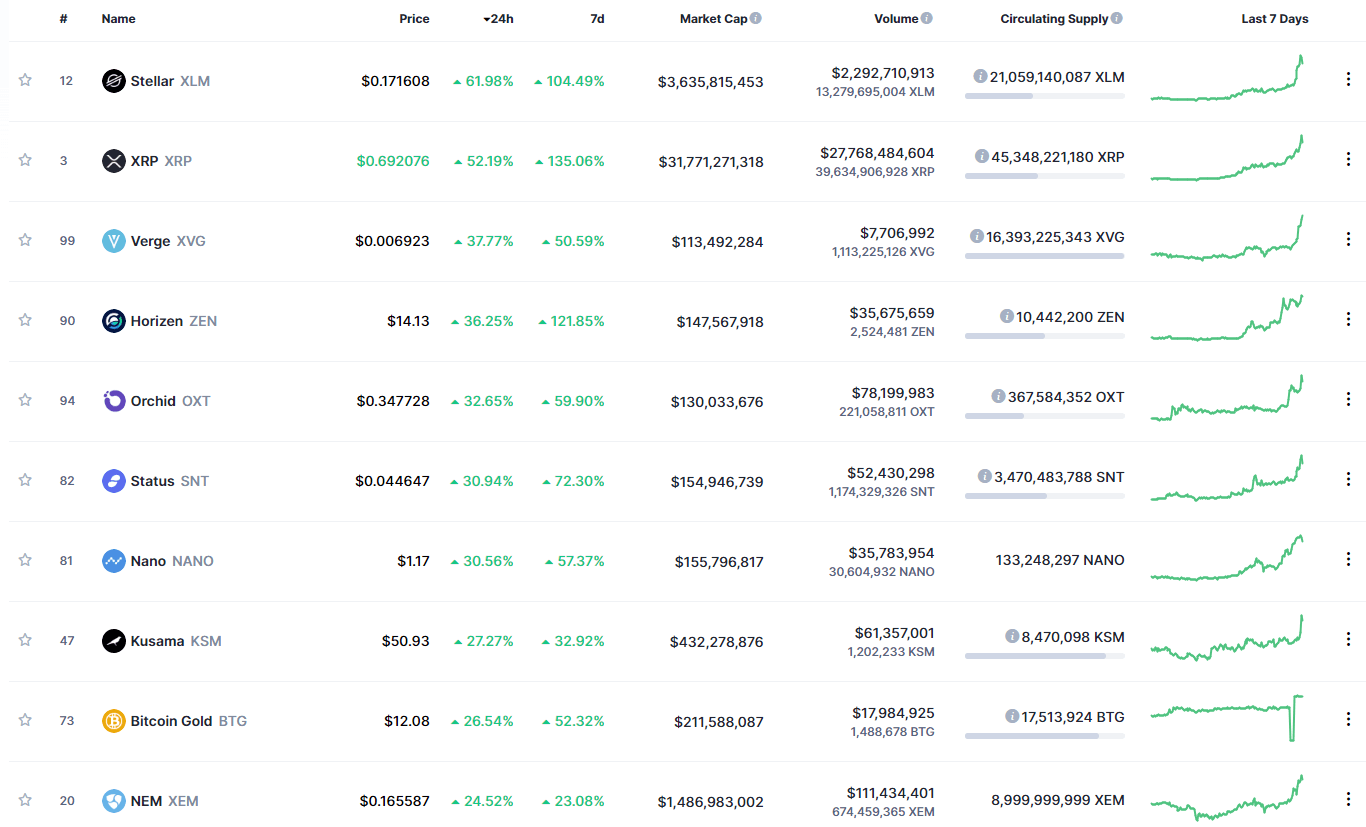
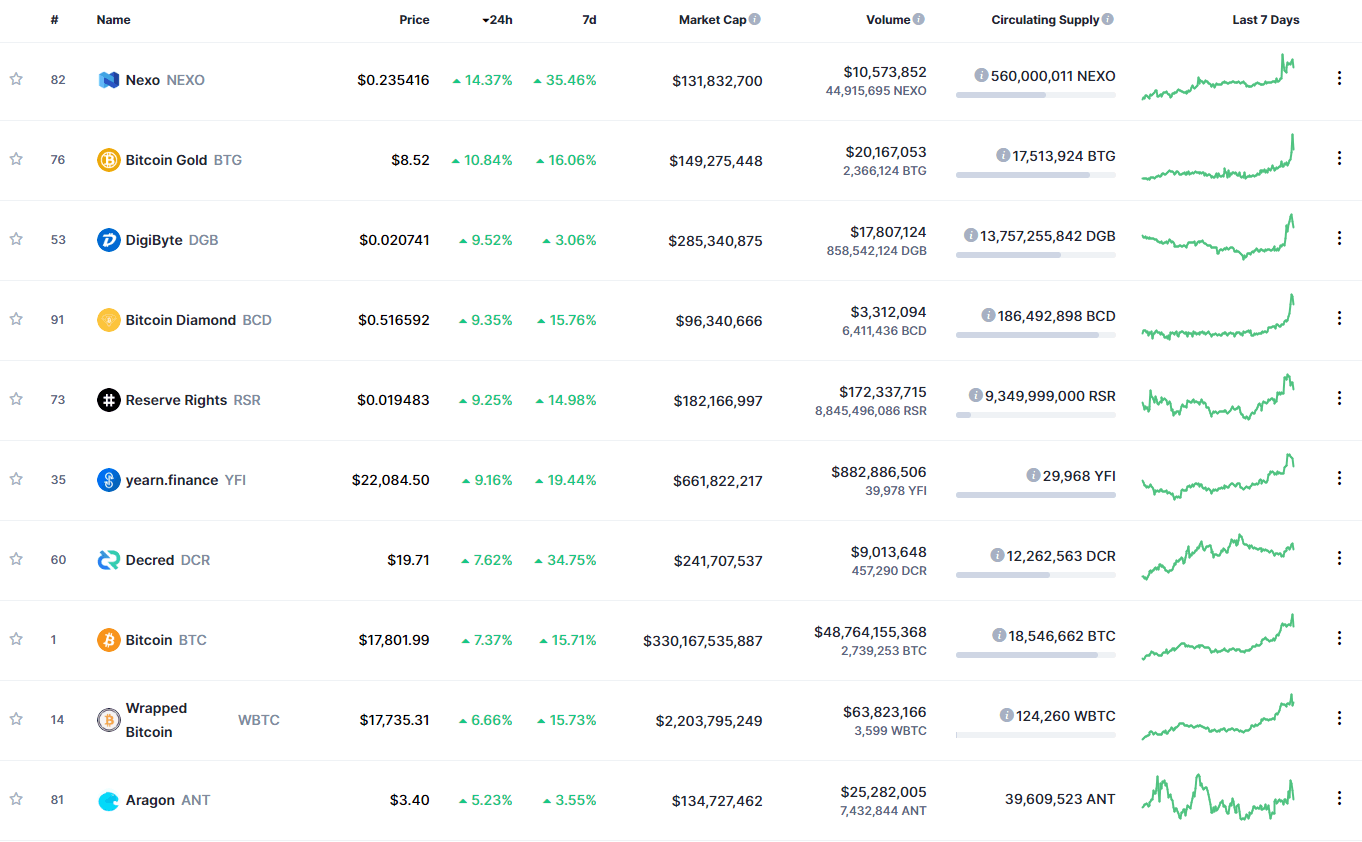
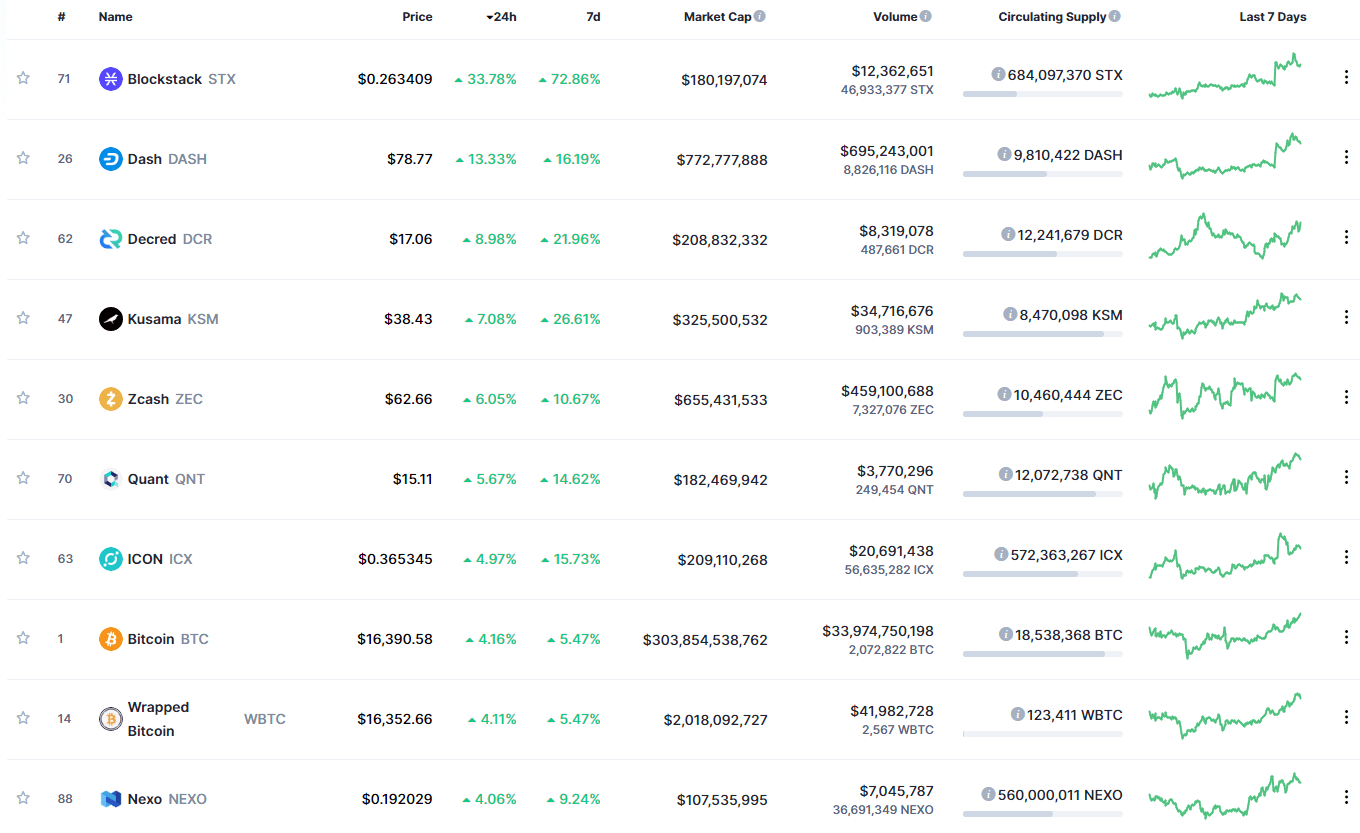
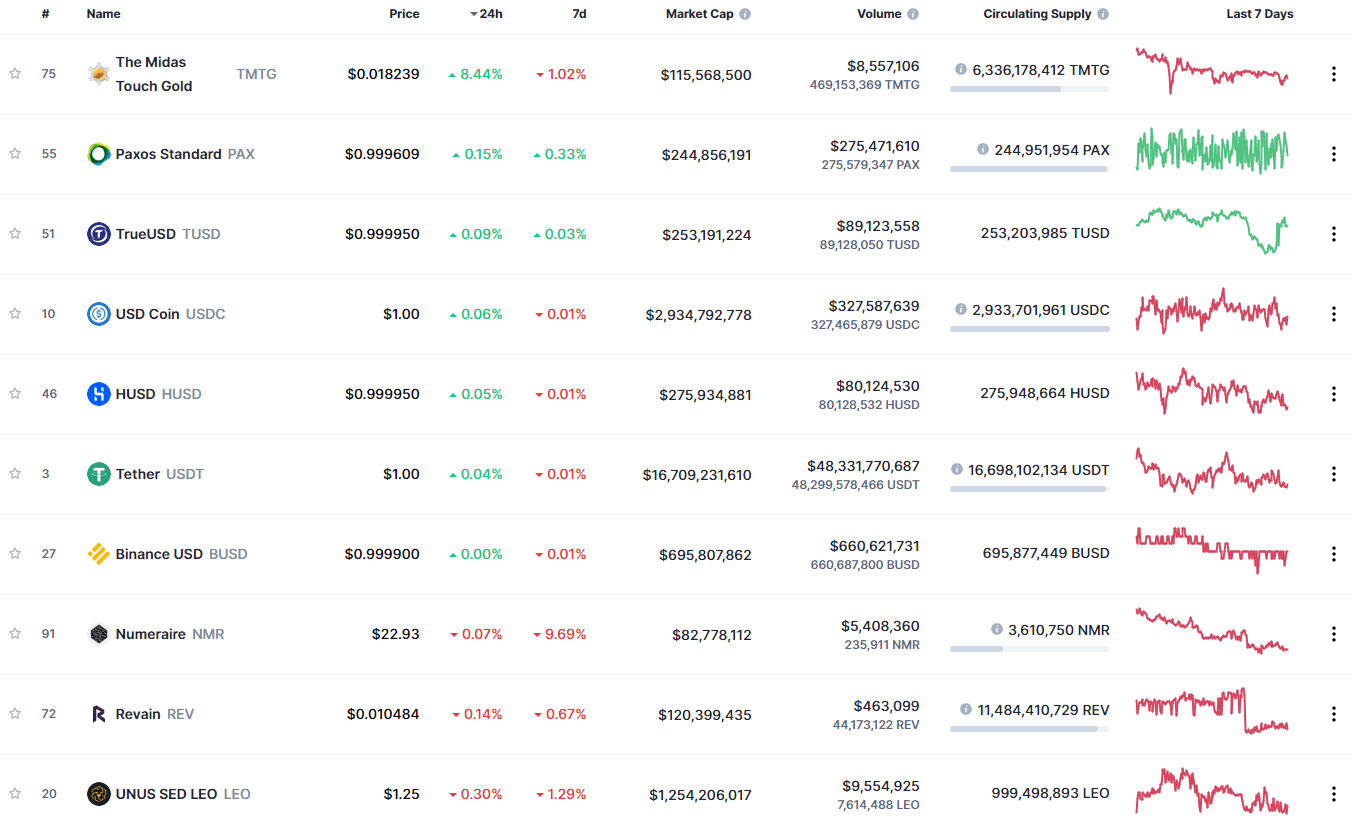
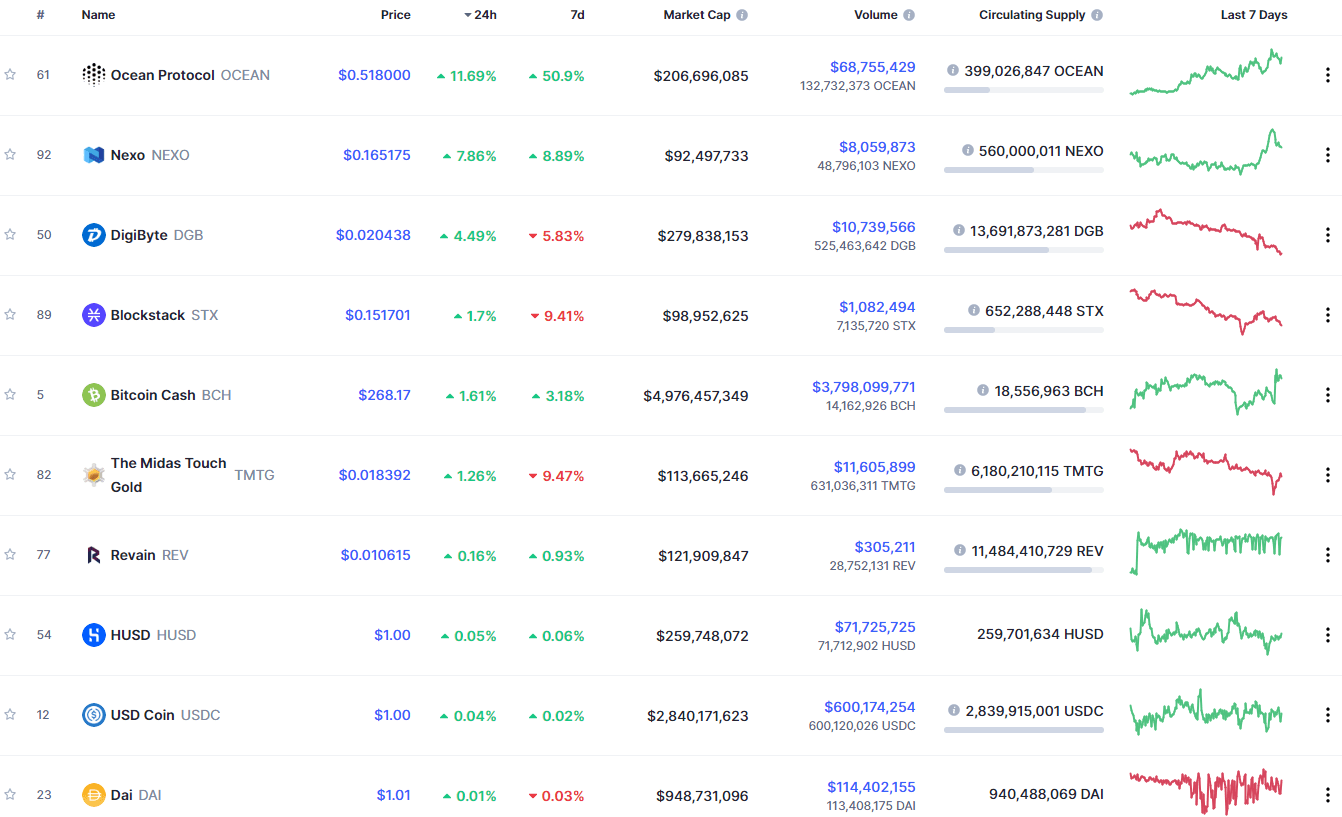
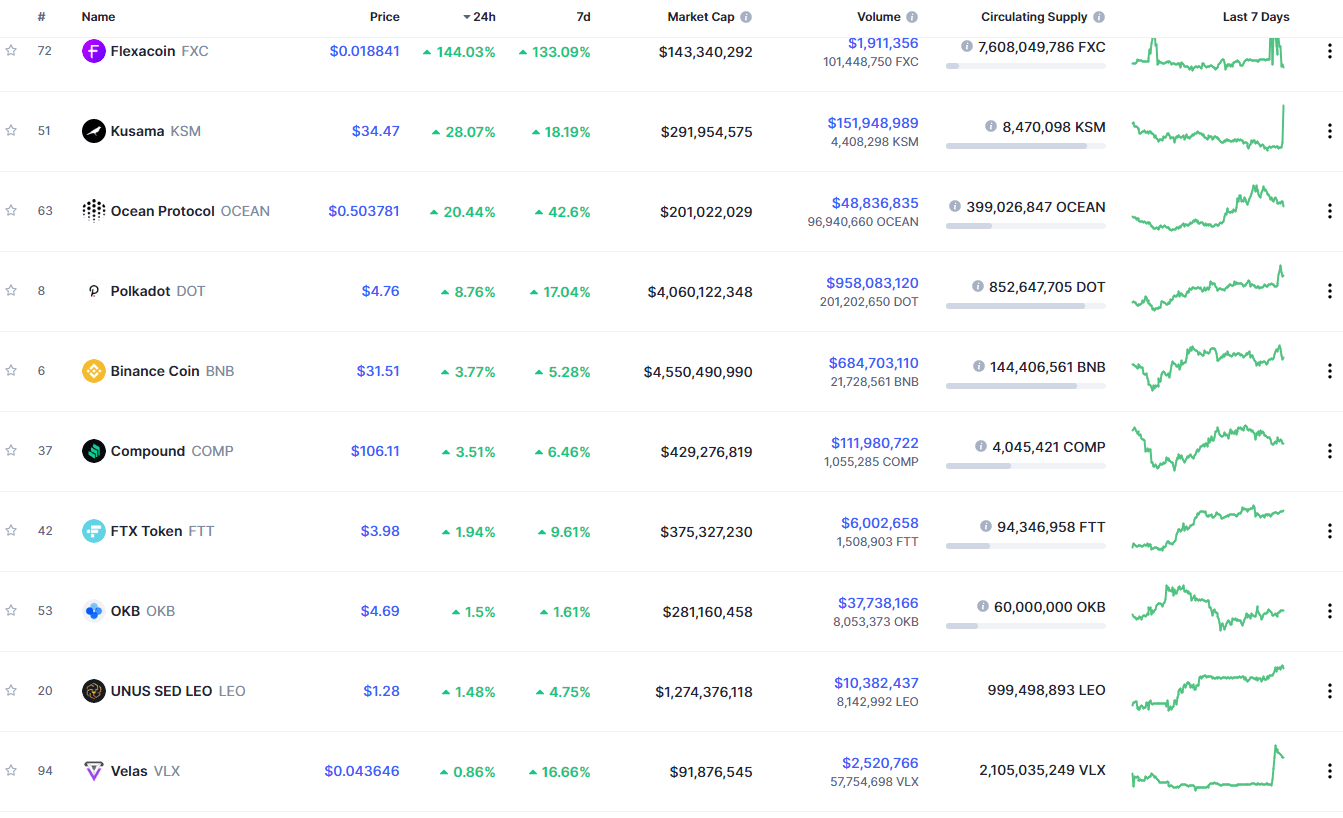
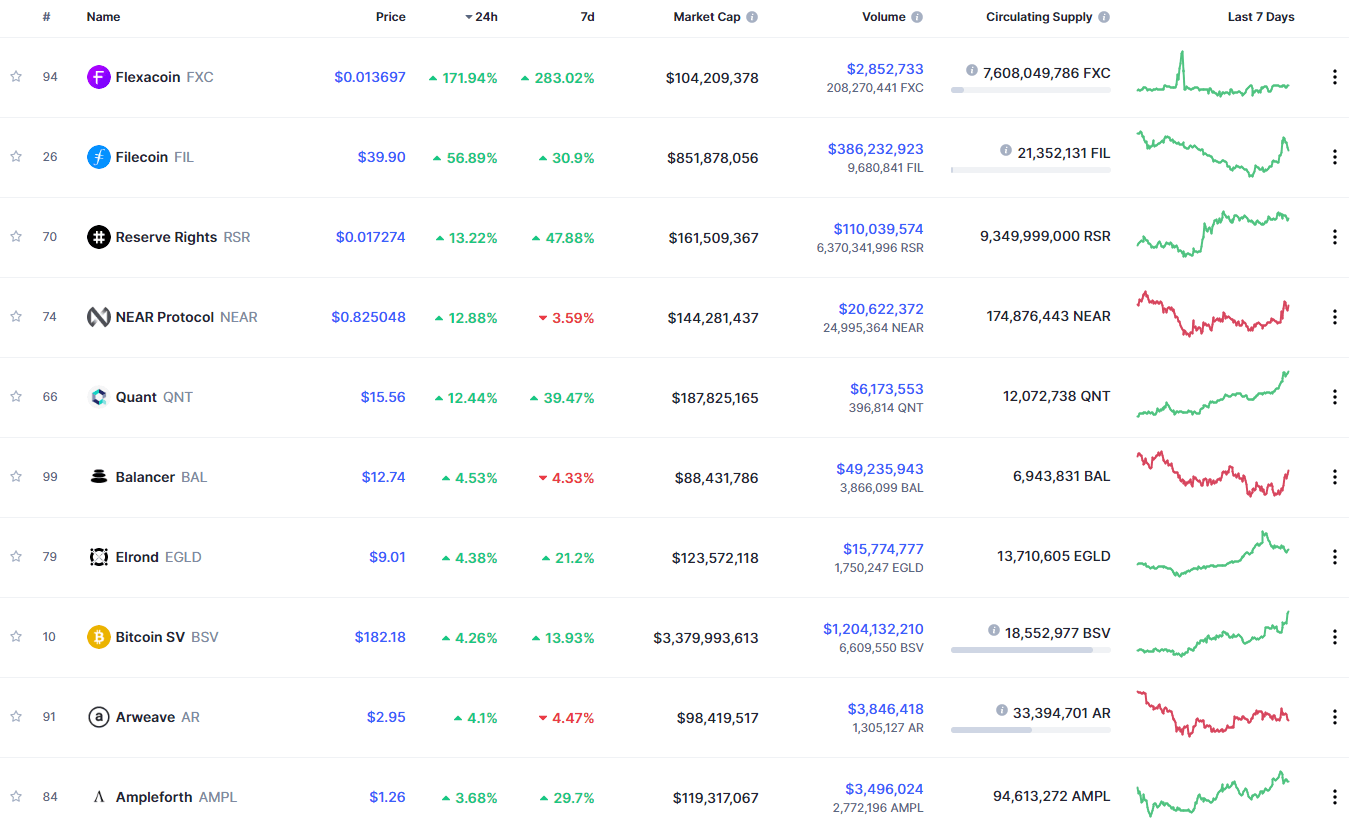
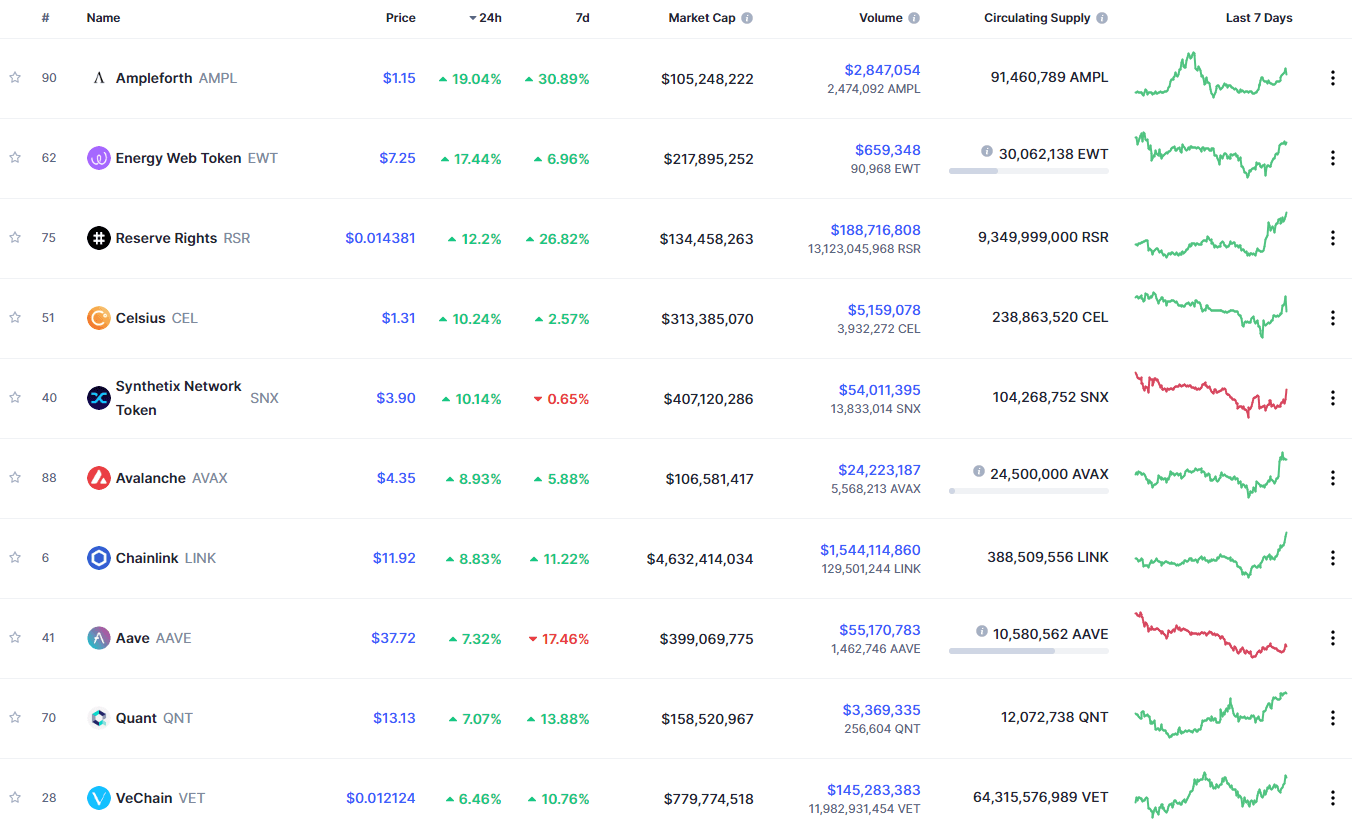
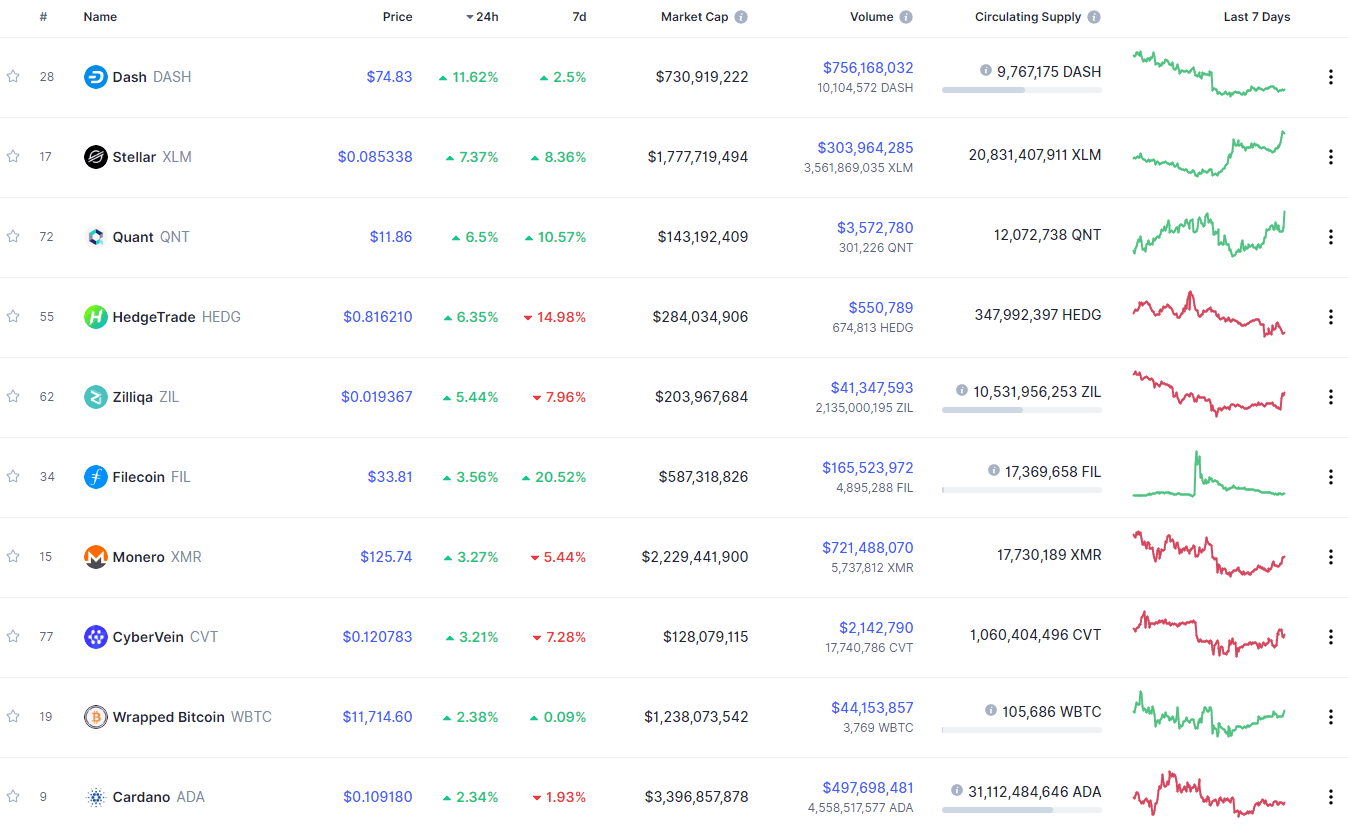
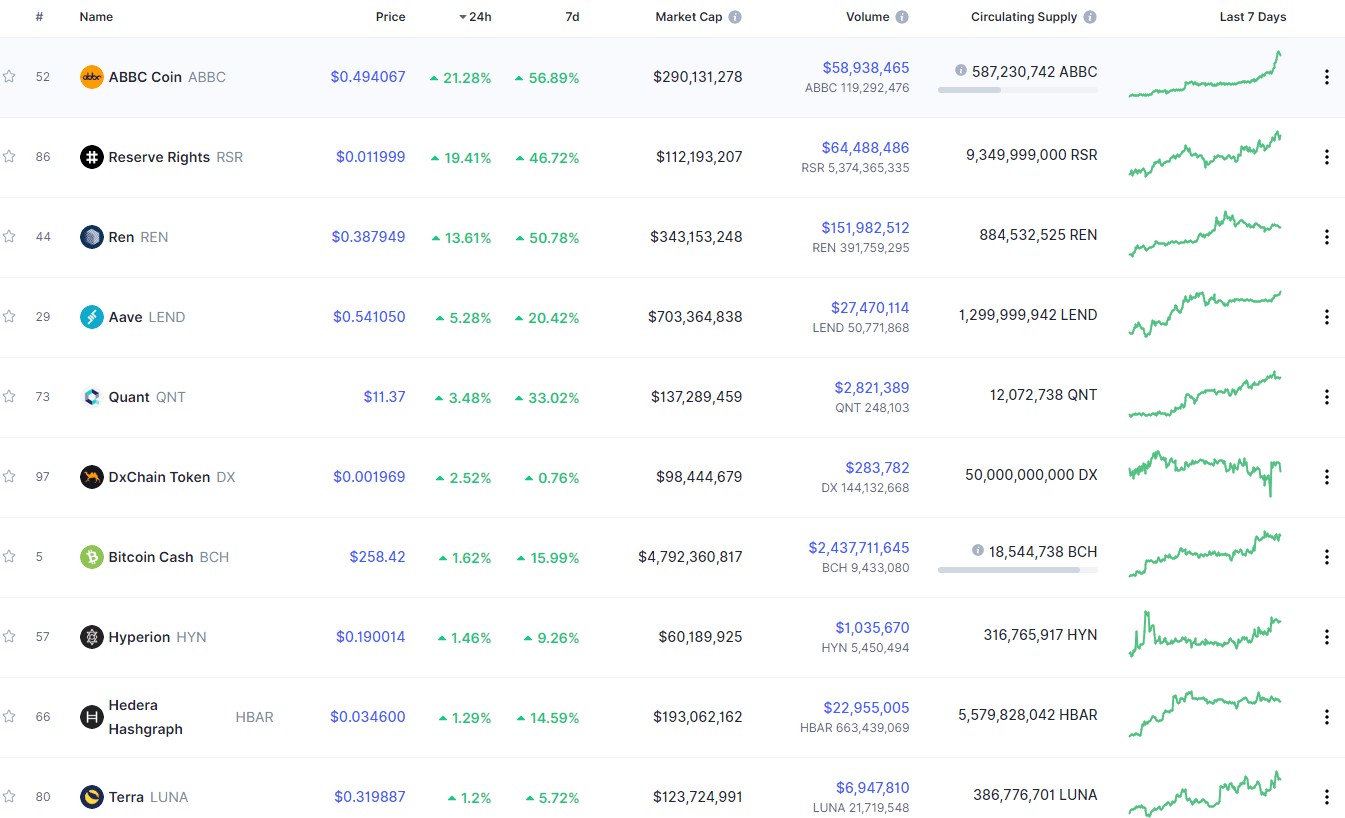
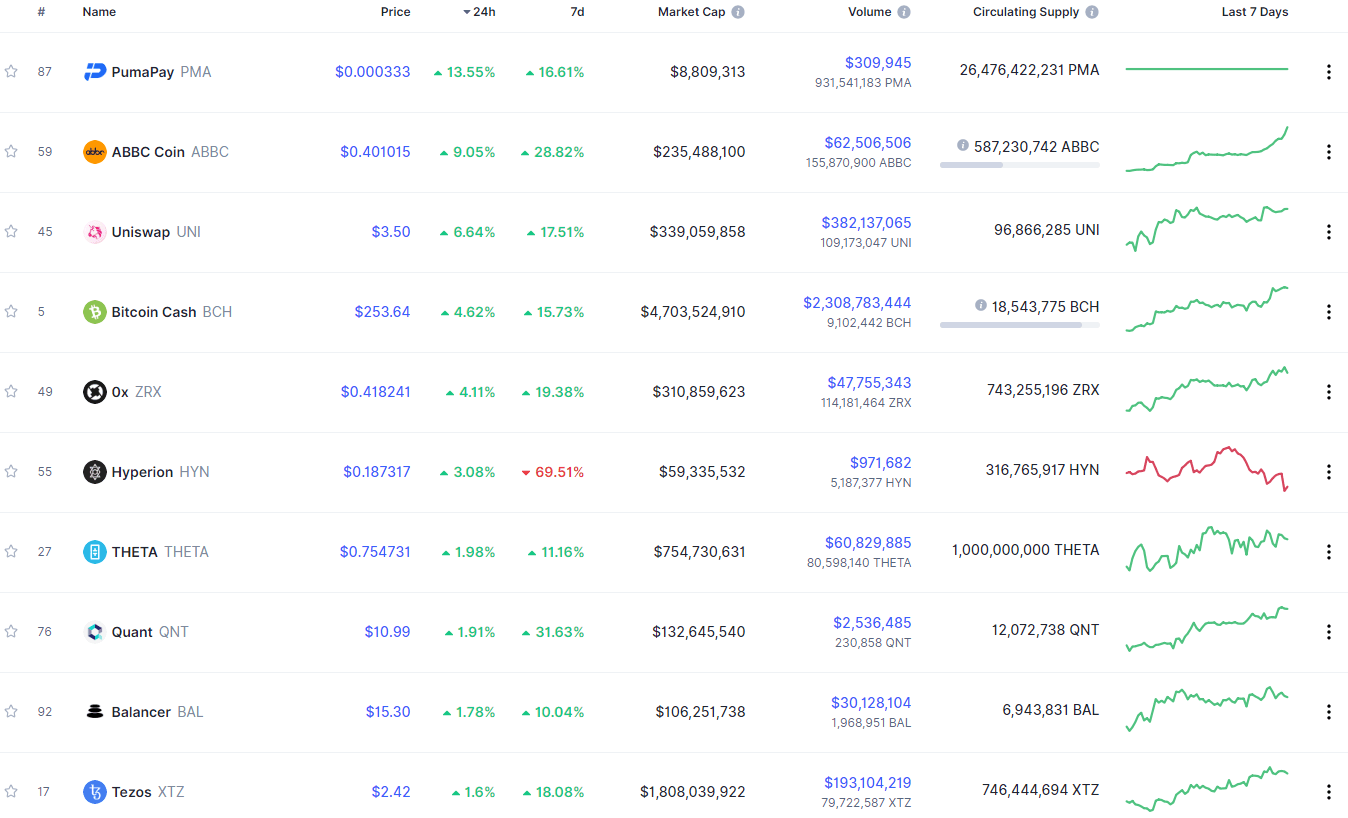
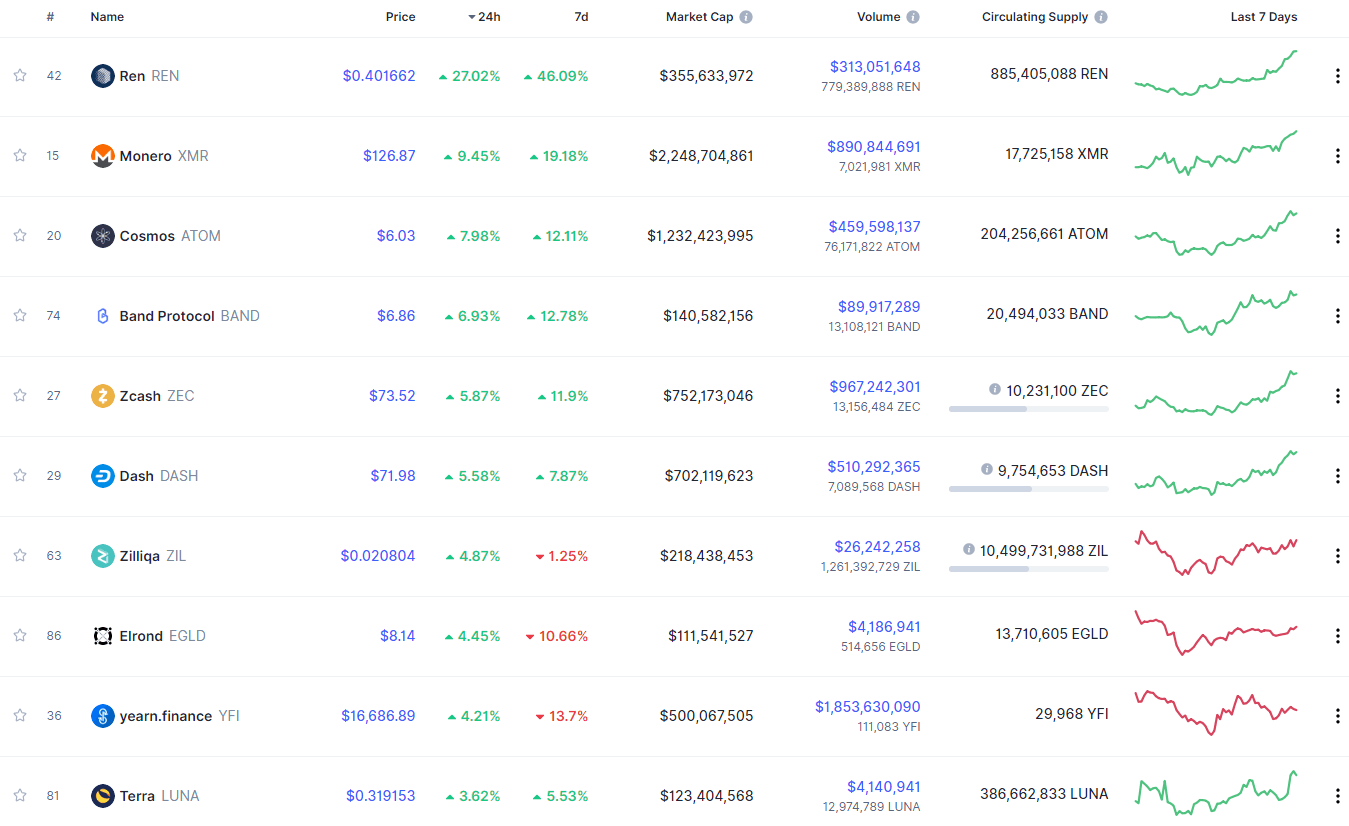
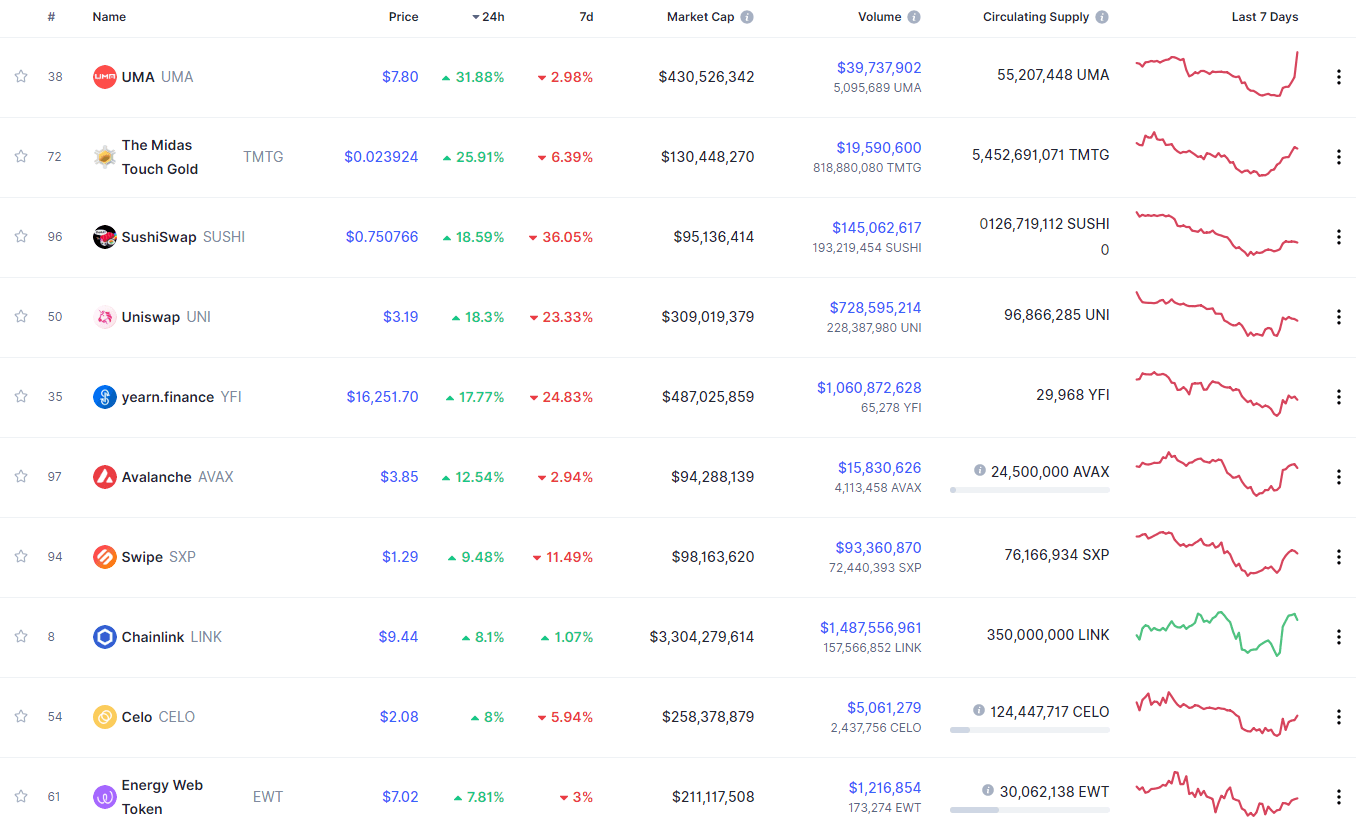
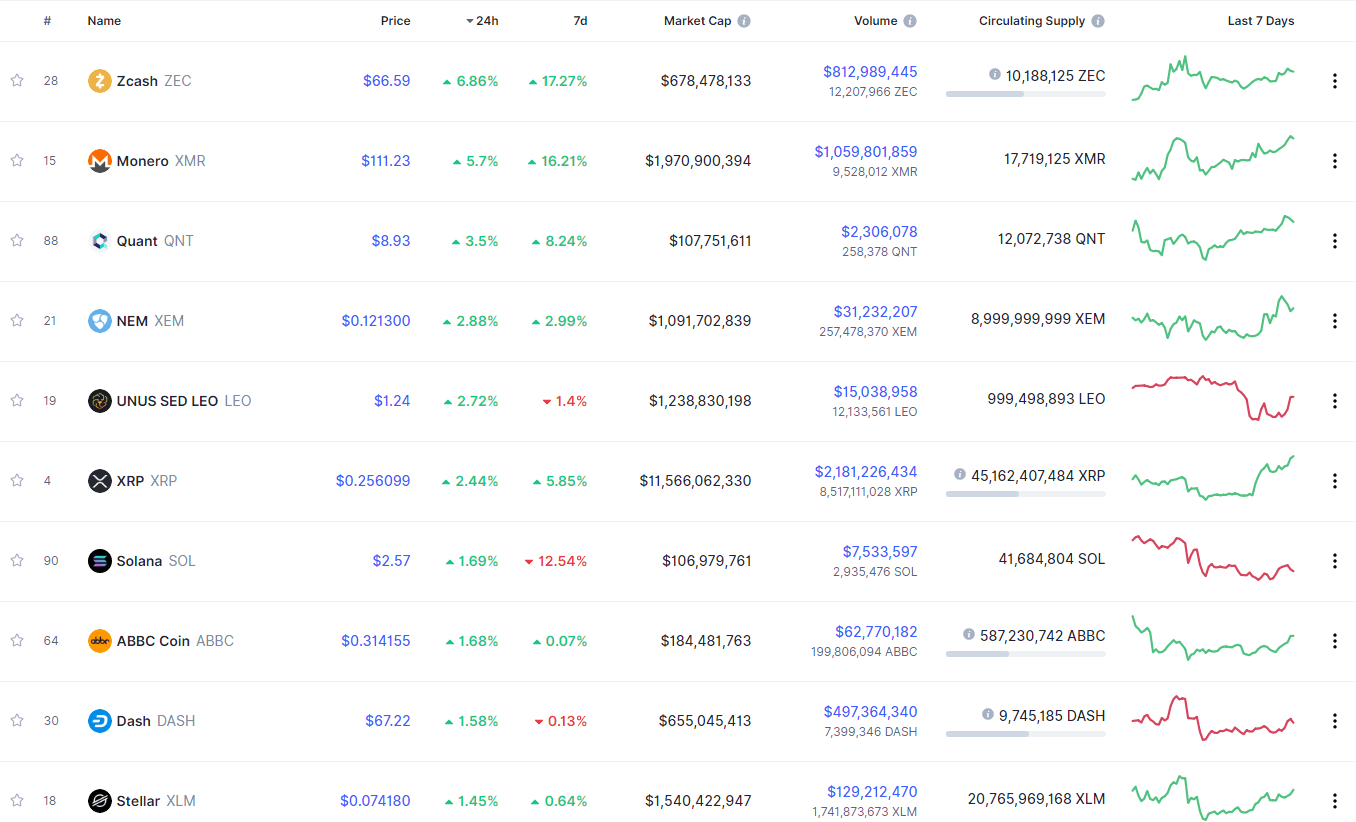
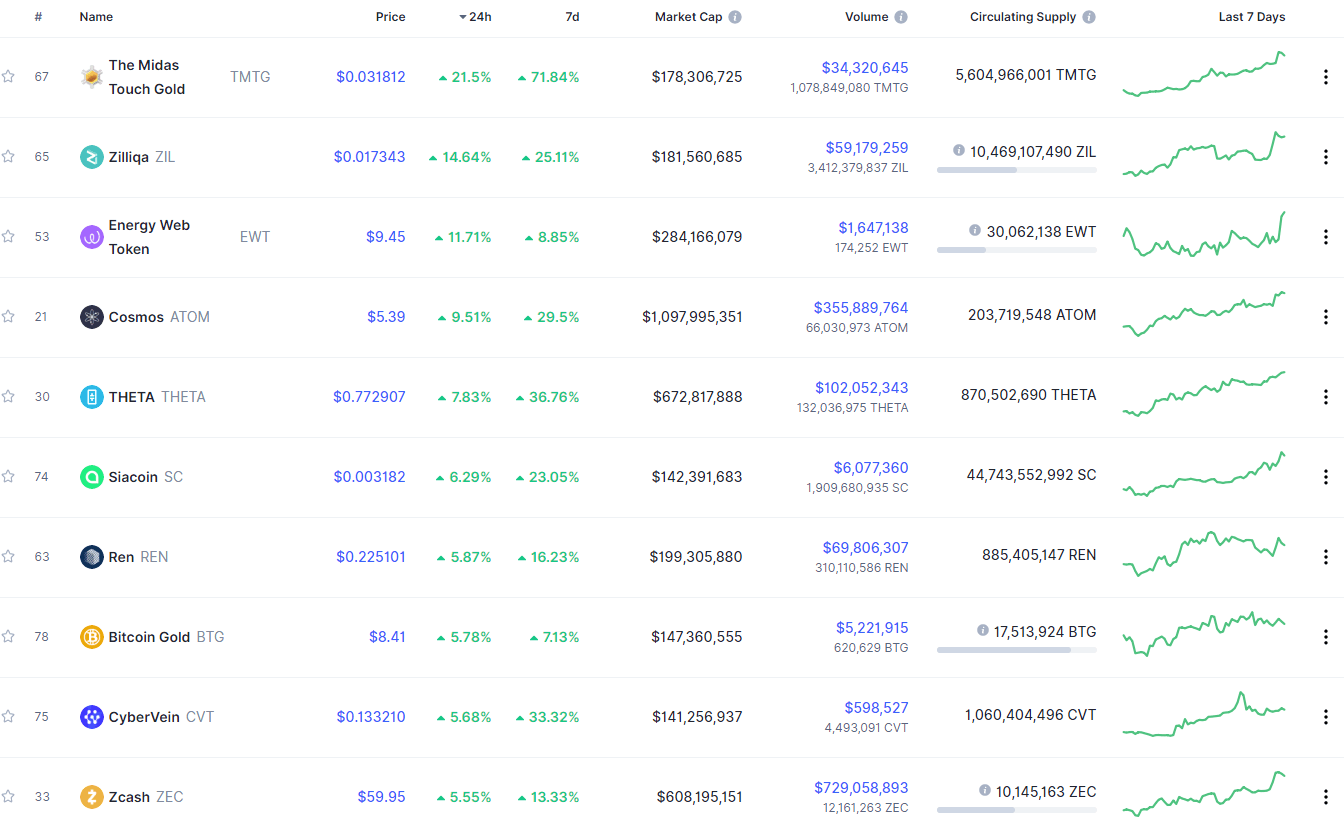
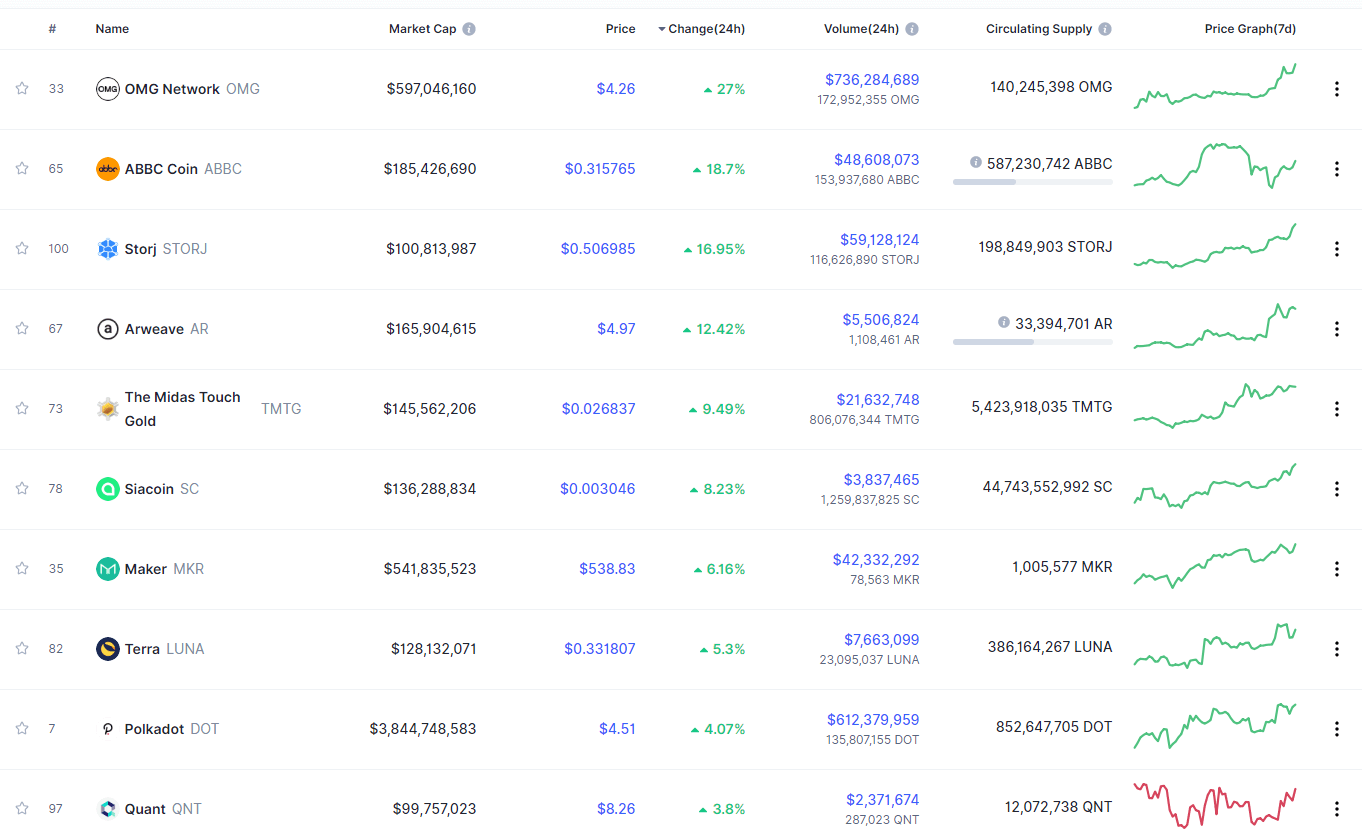
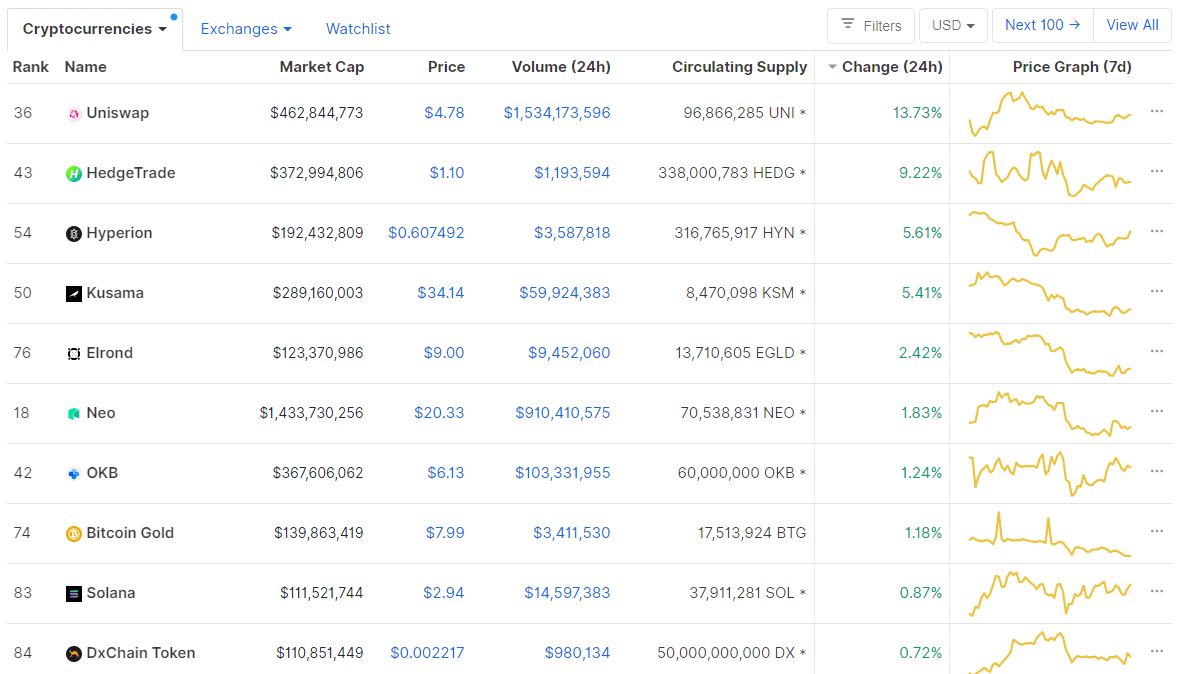
Top 10 24-hour Performers (Click to enlarge)
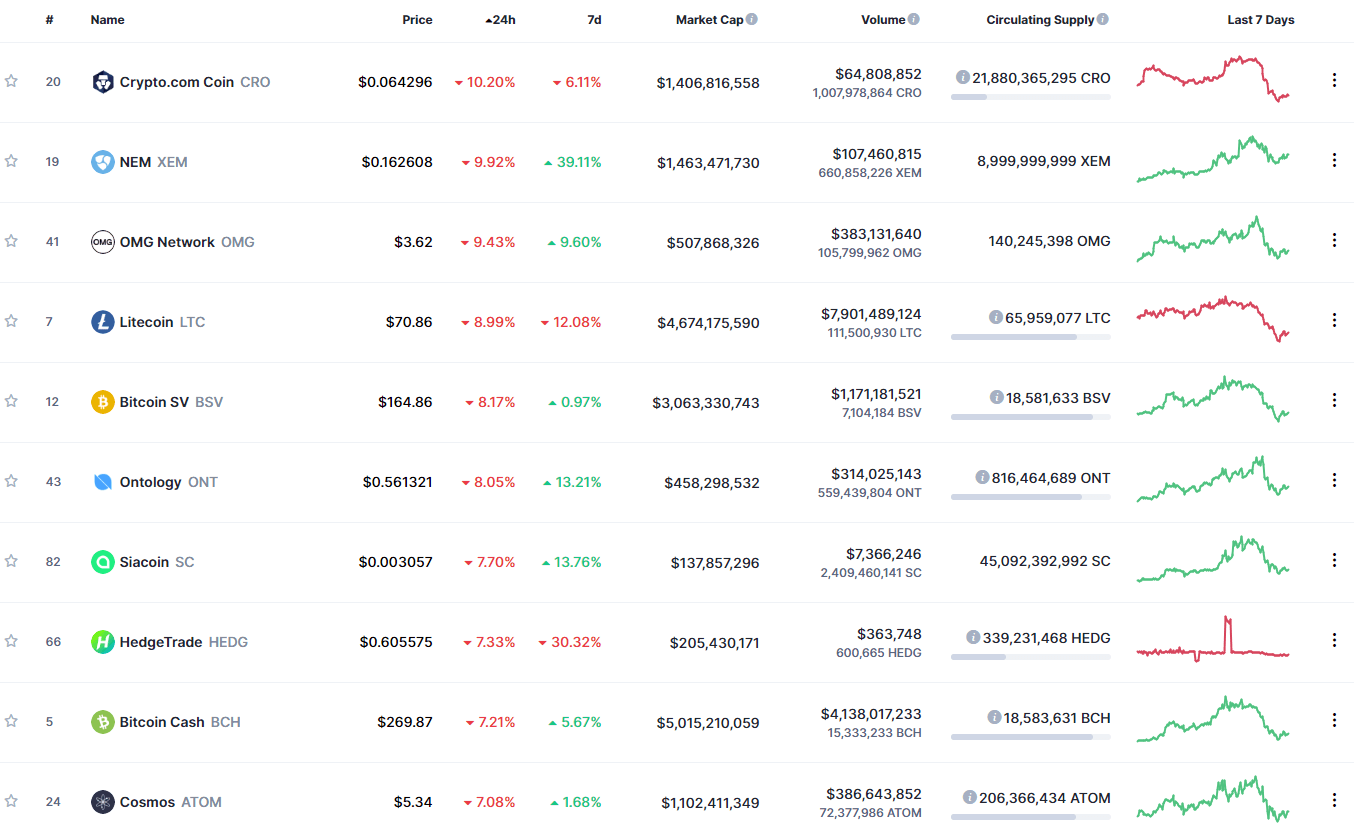
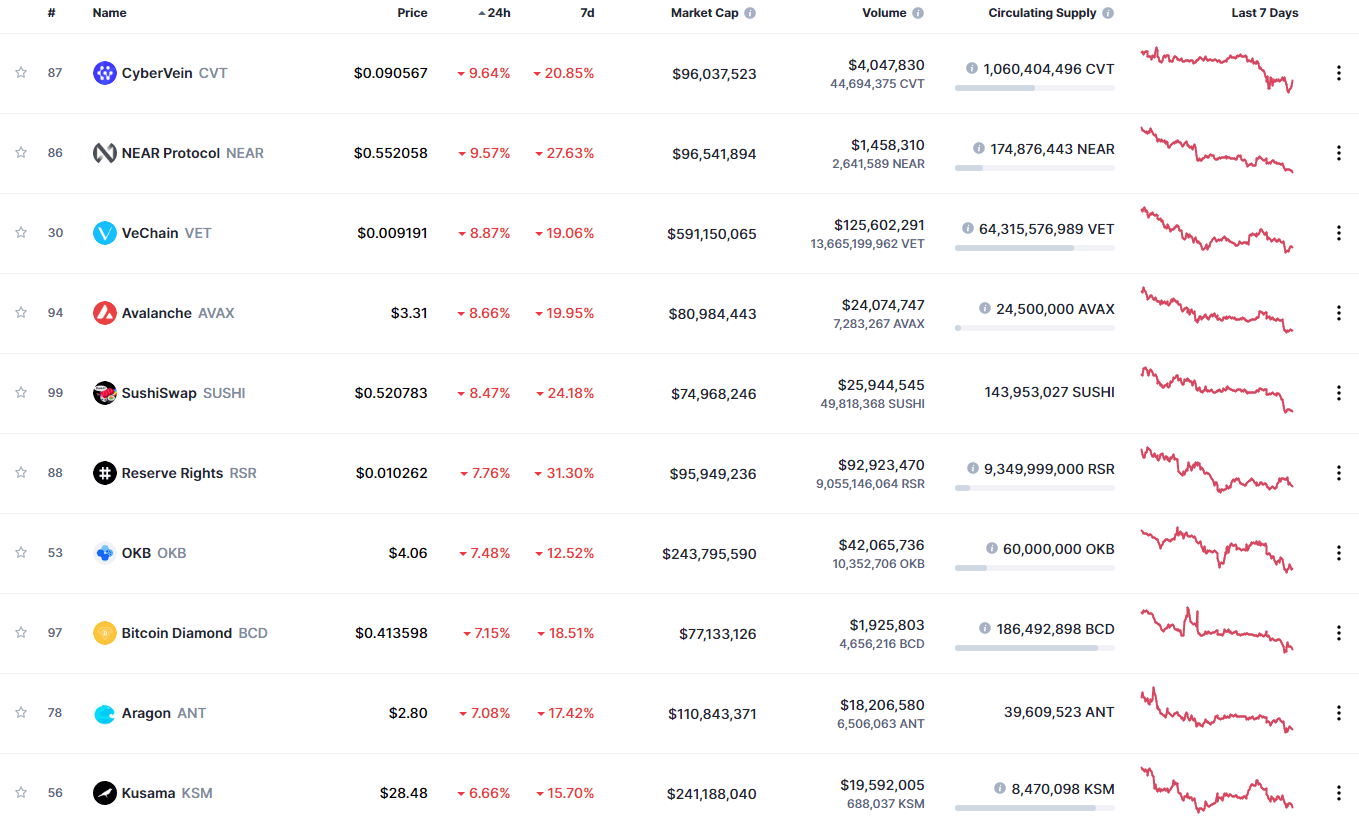
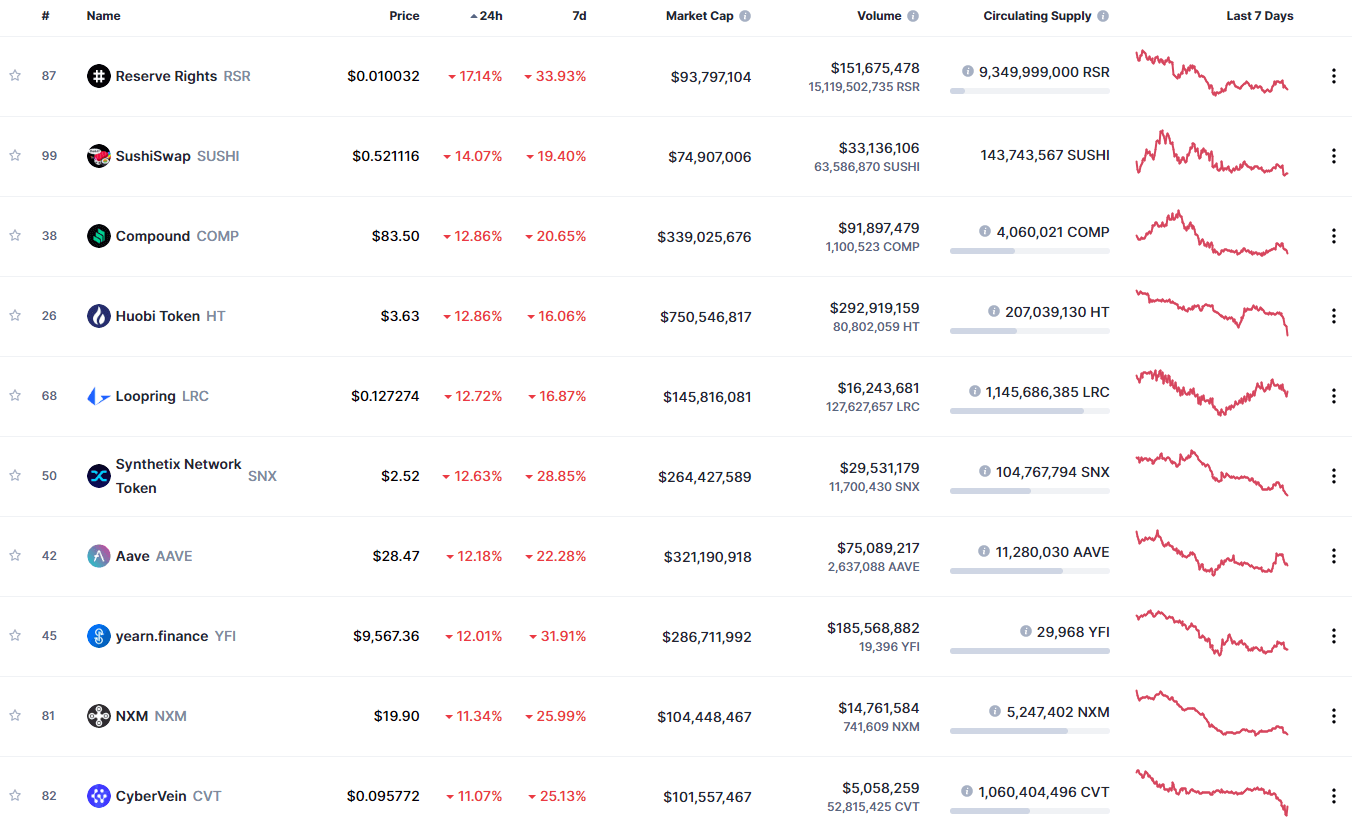
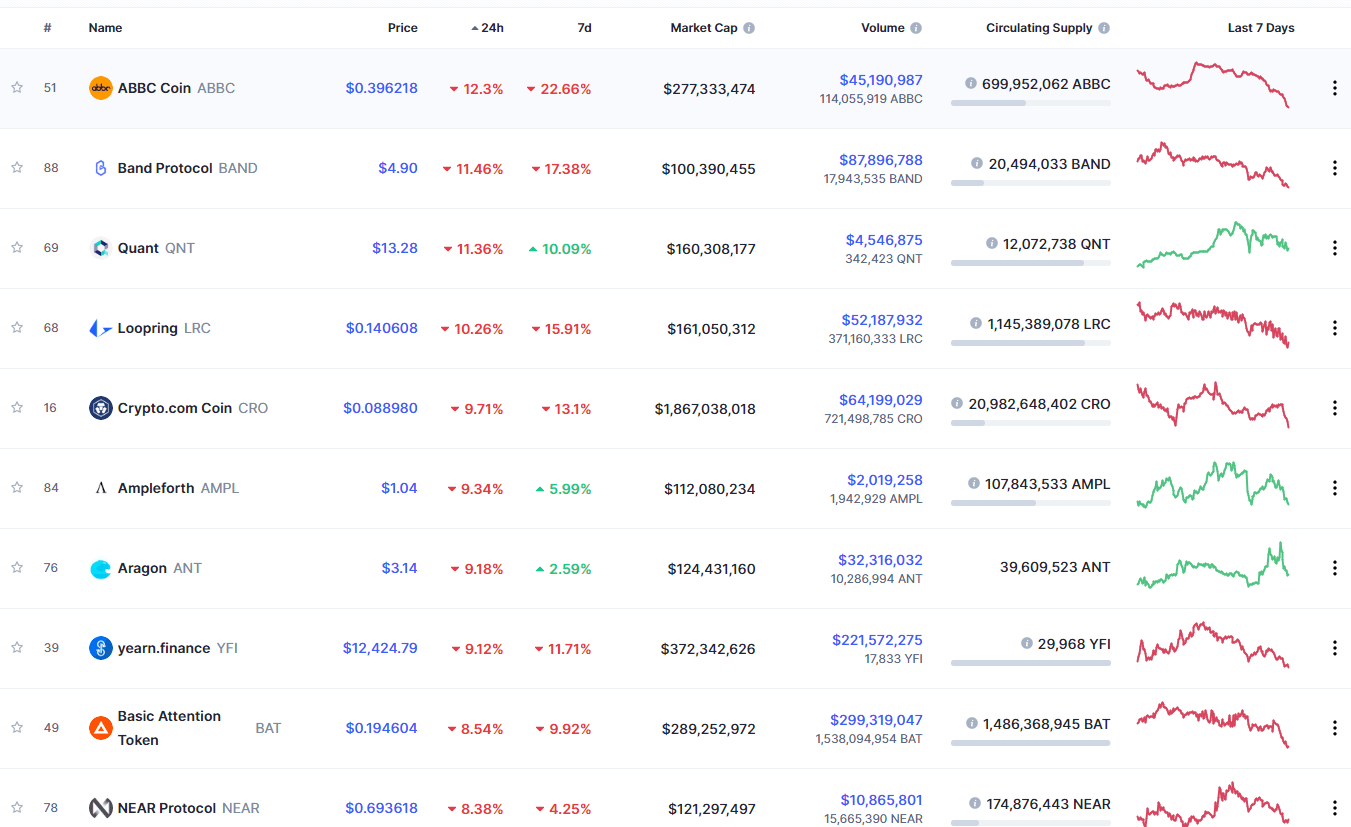
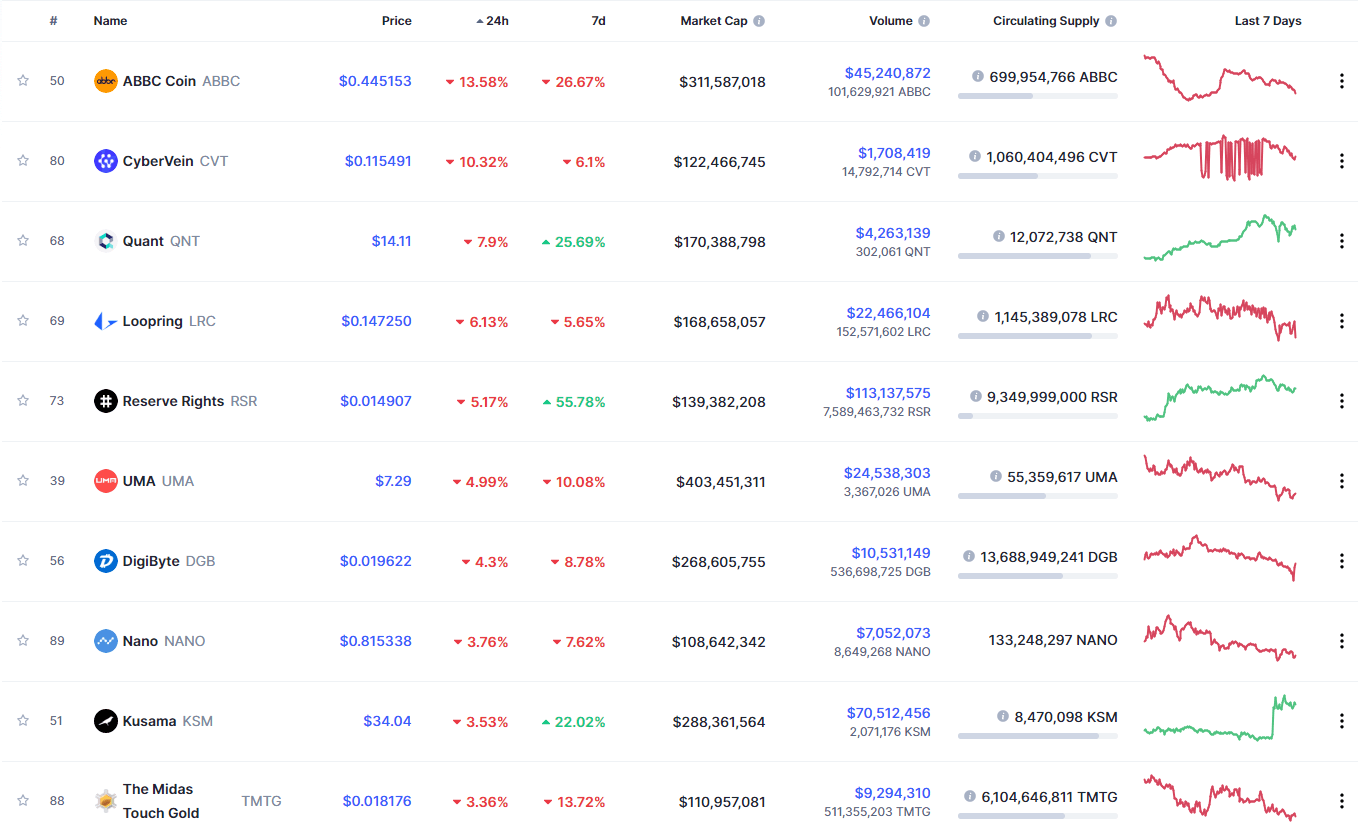
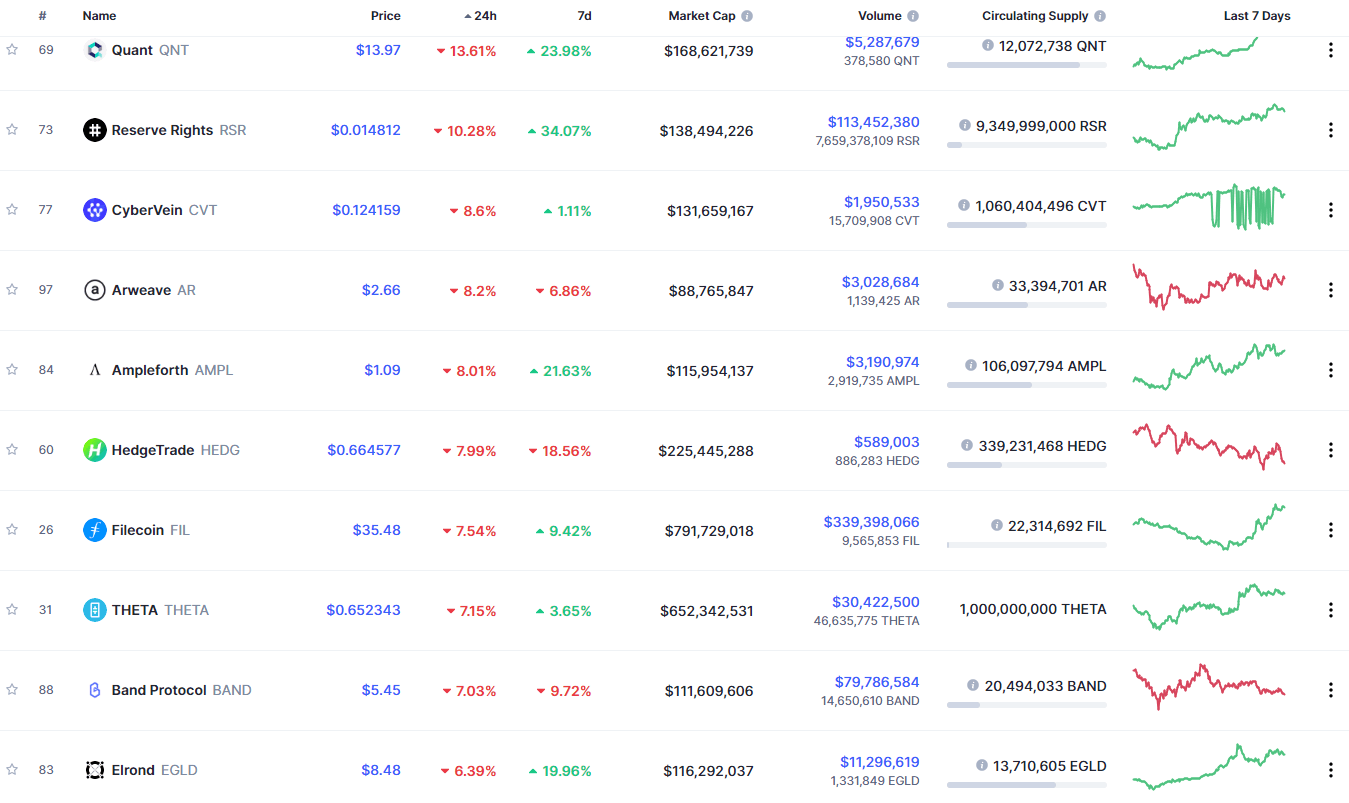
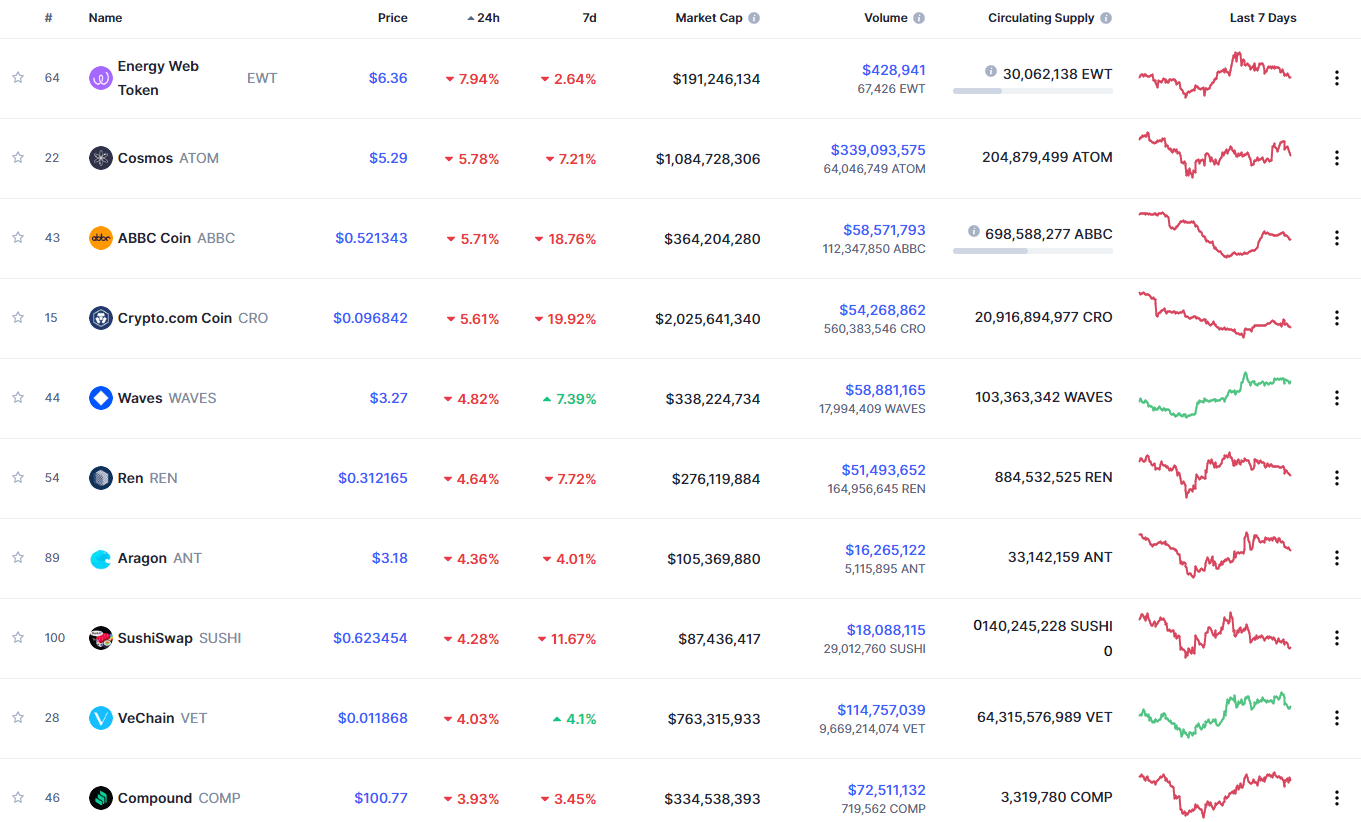
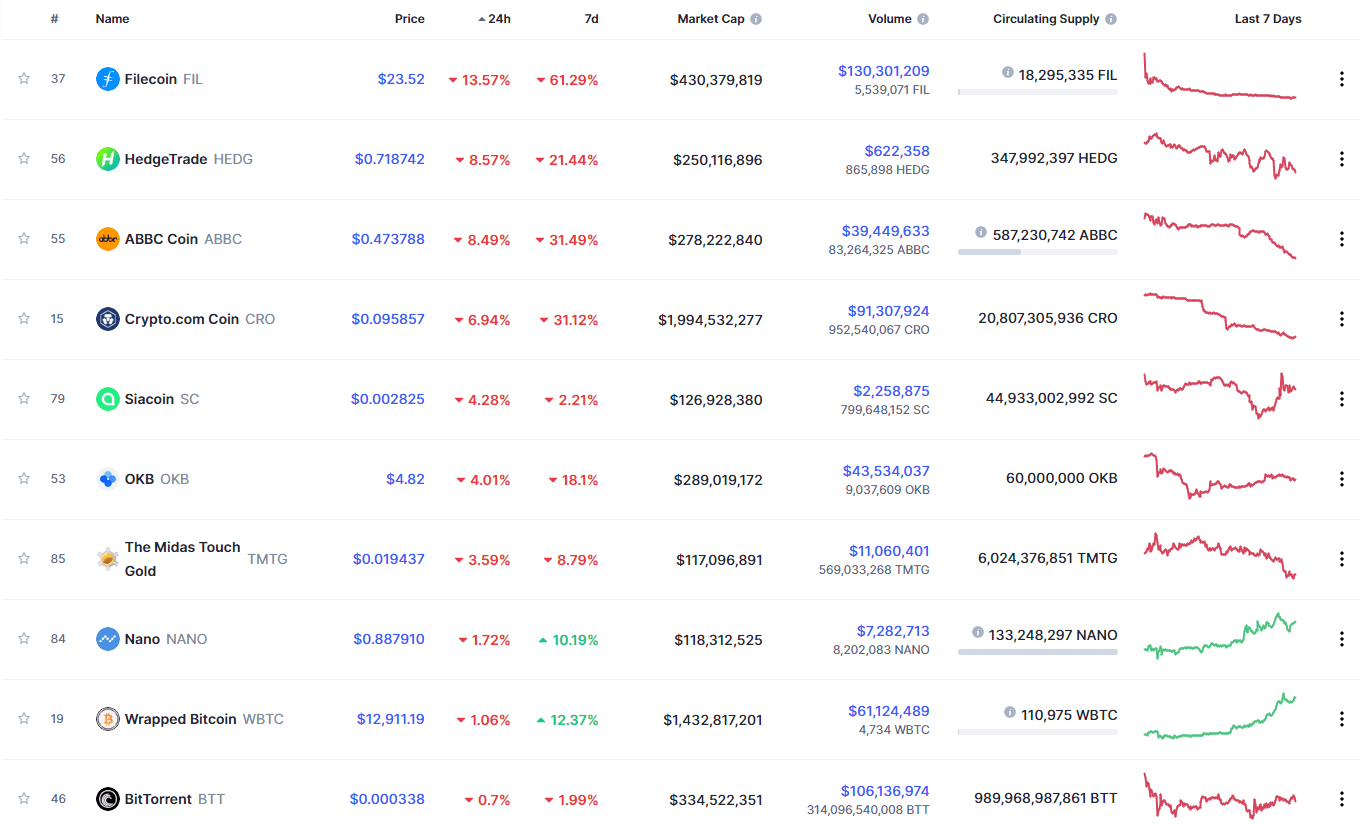
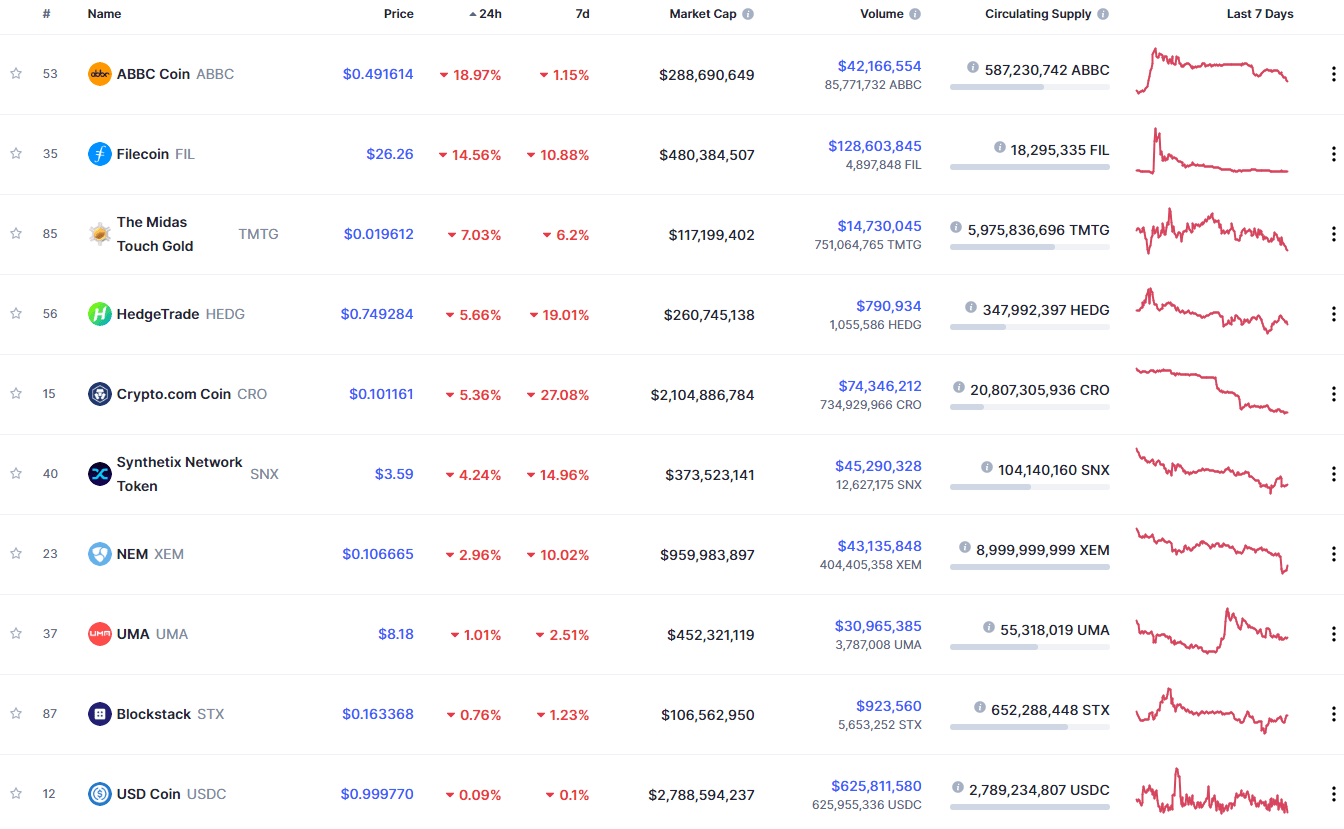
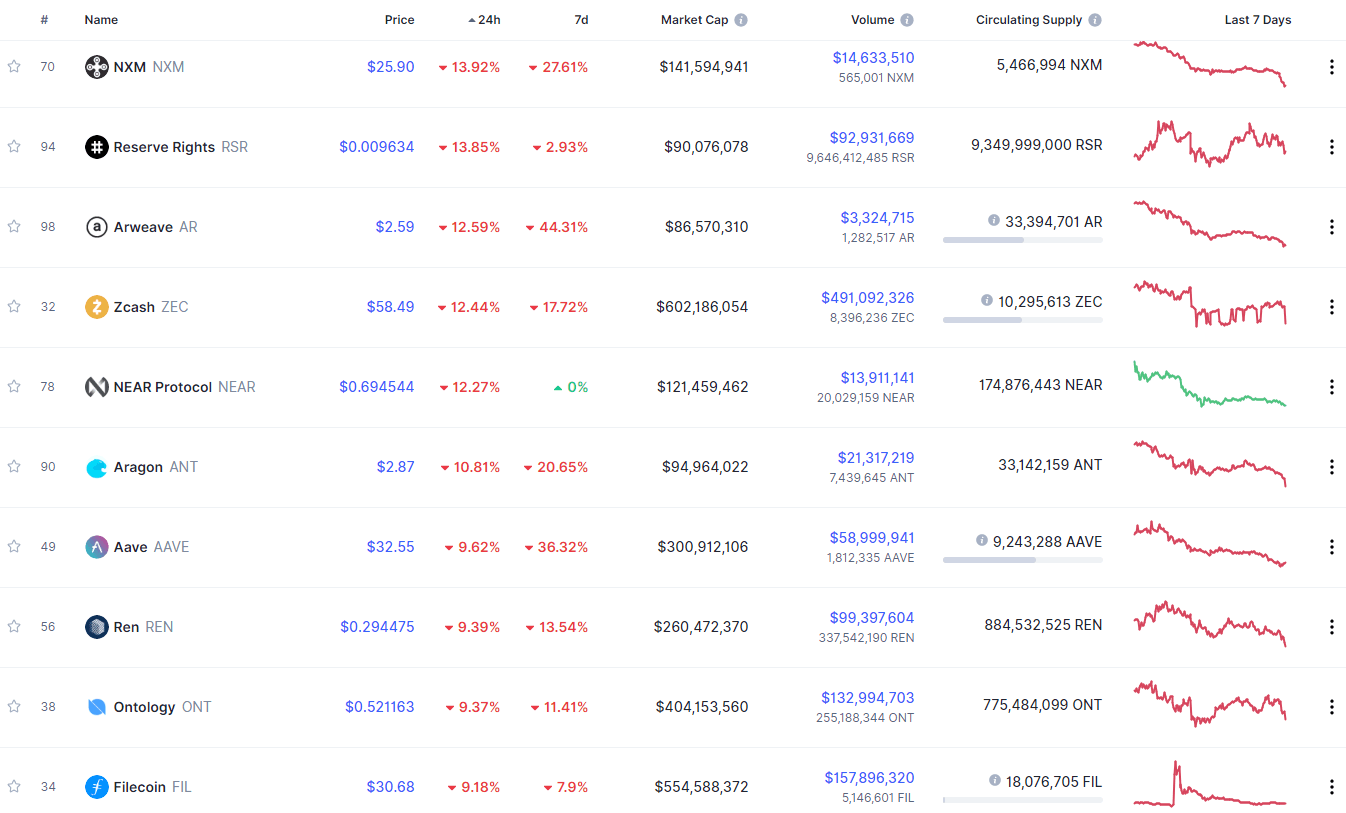
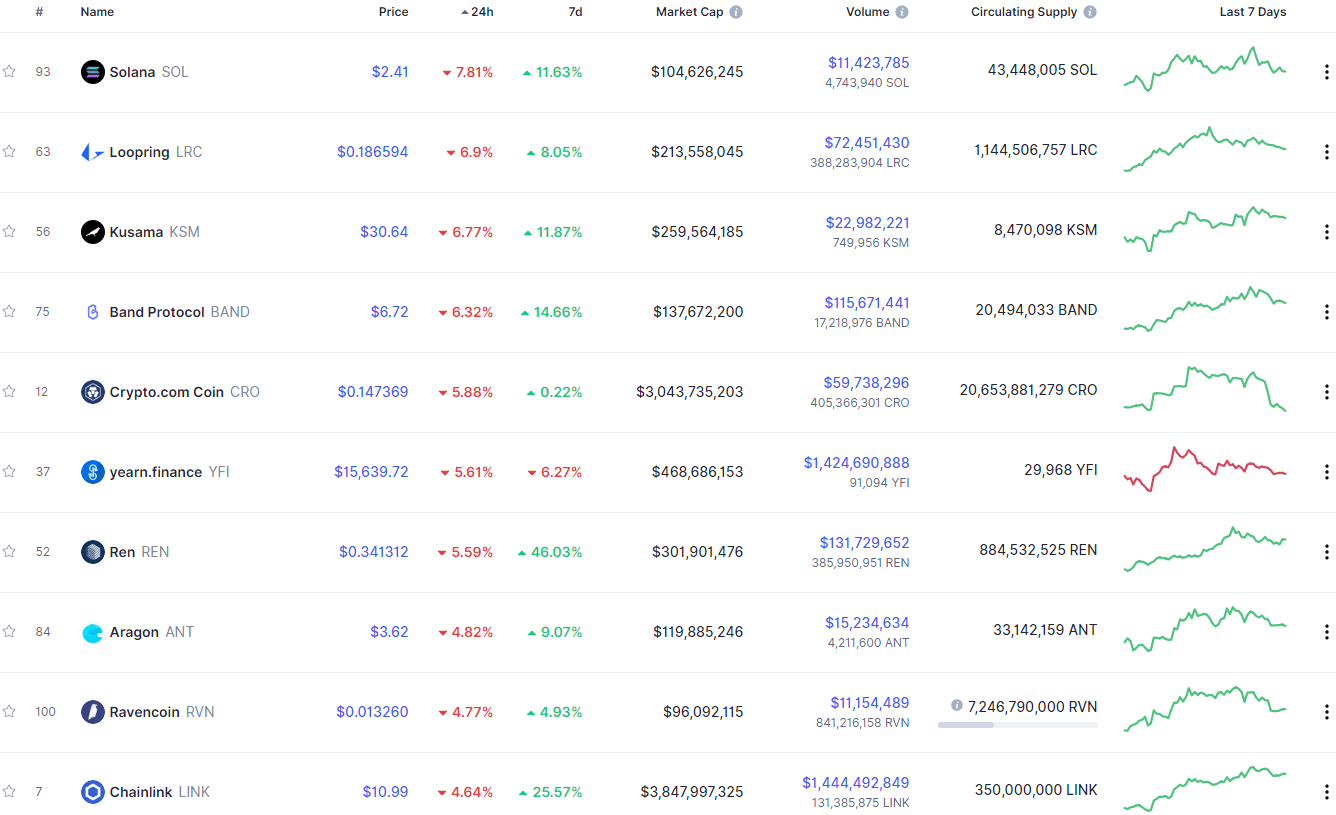
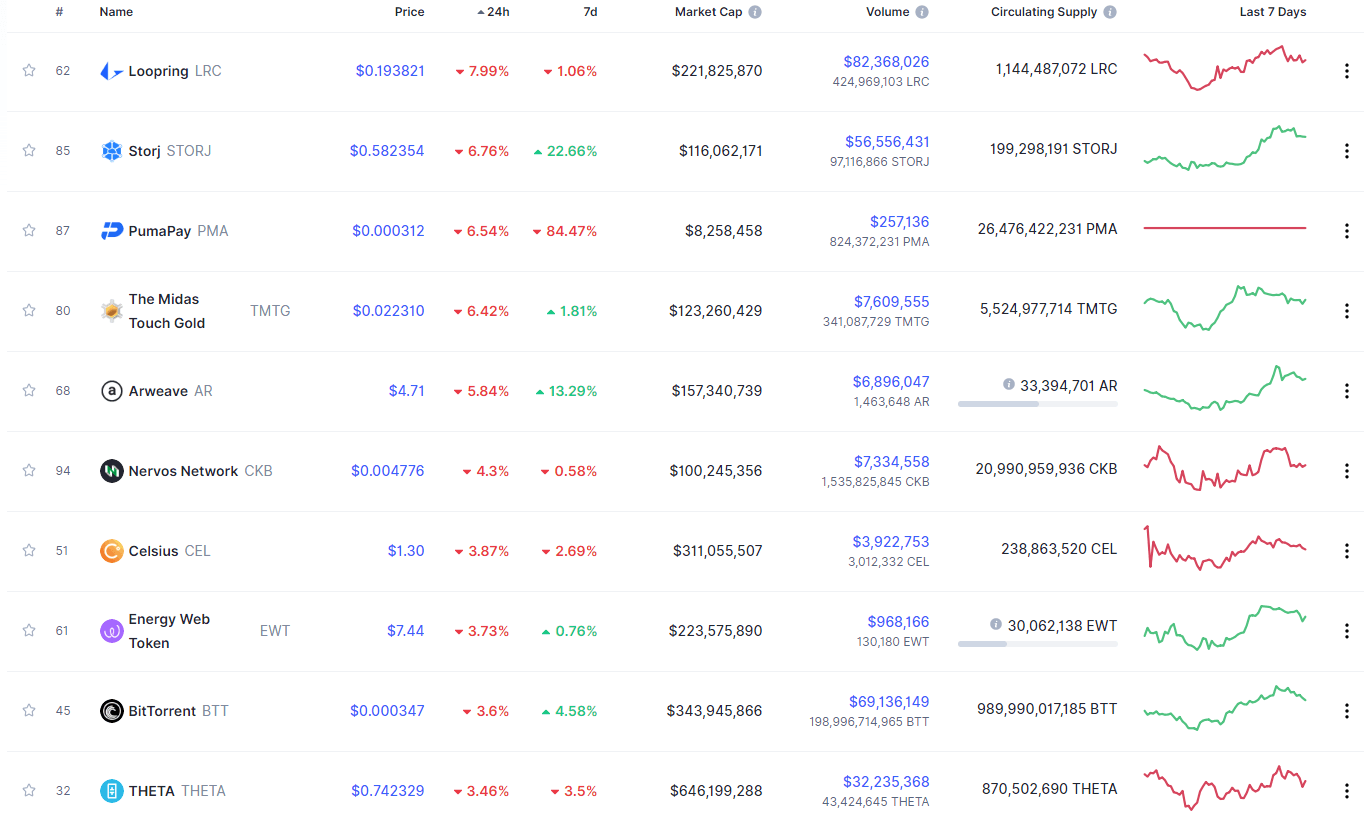
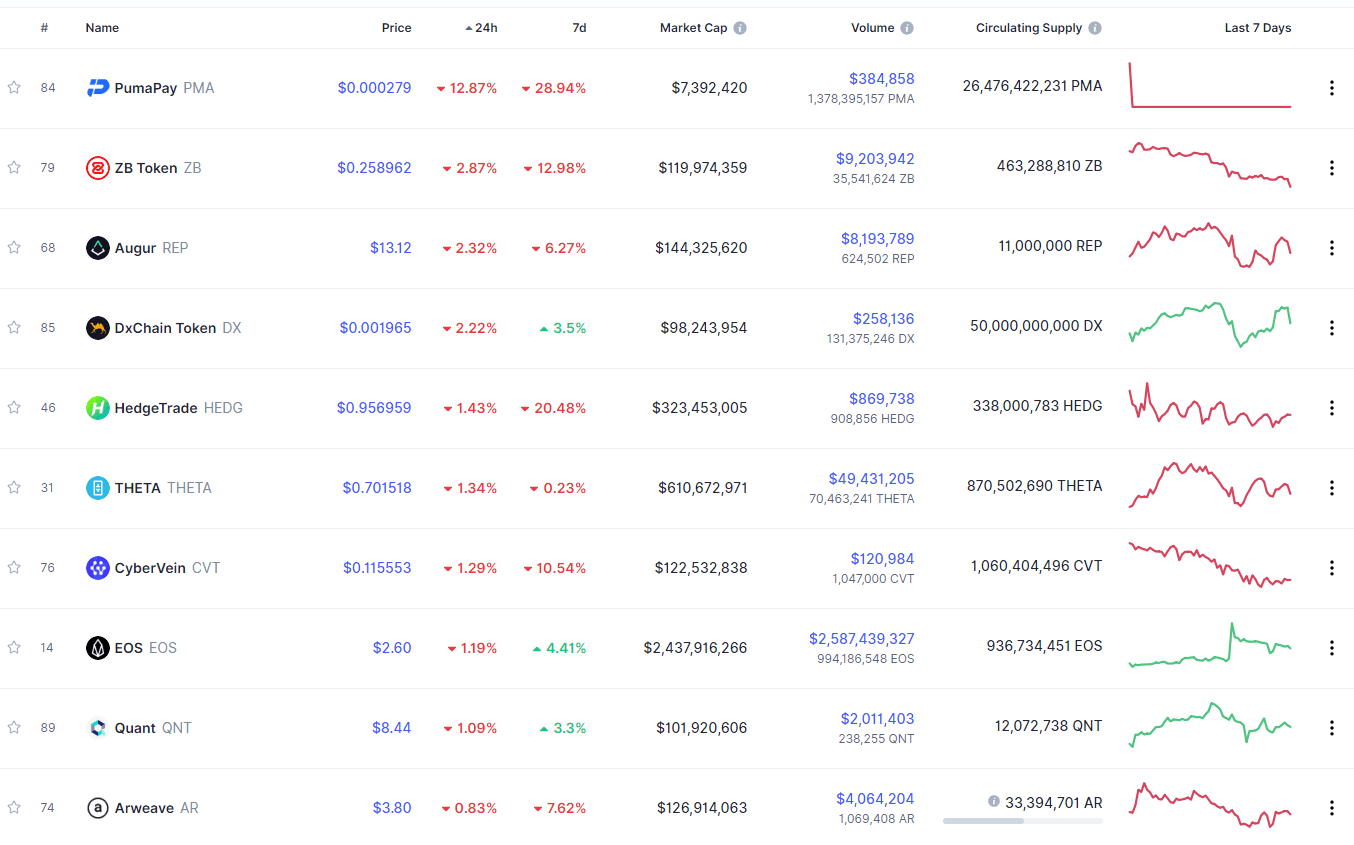
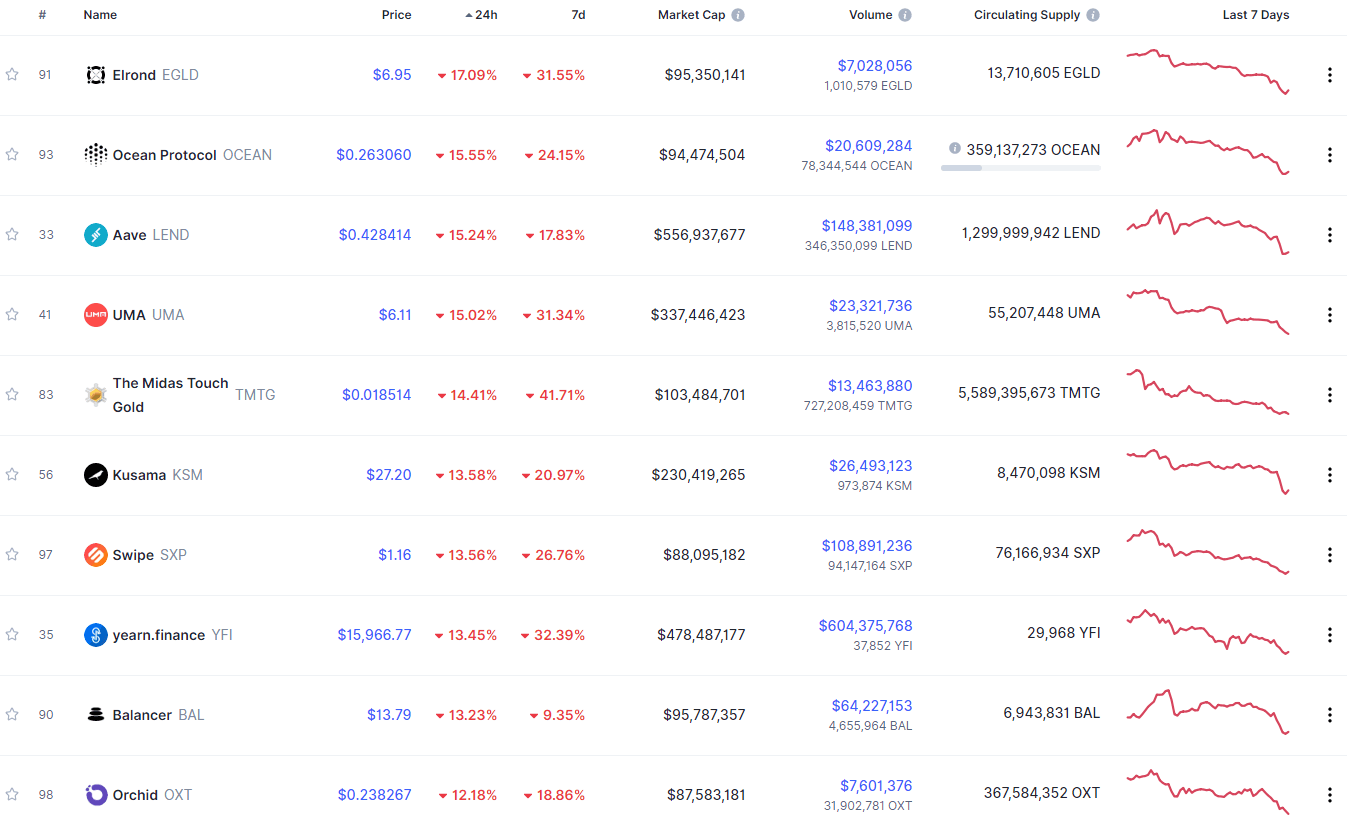
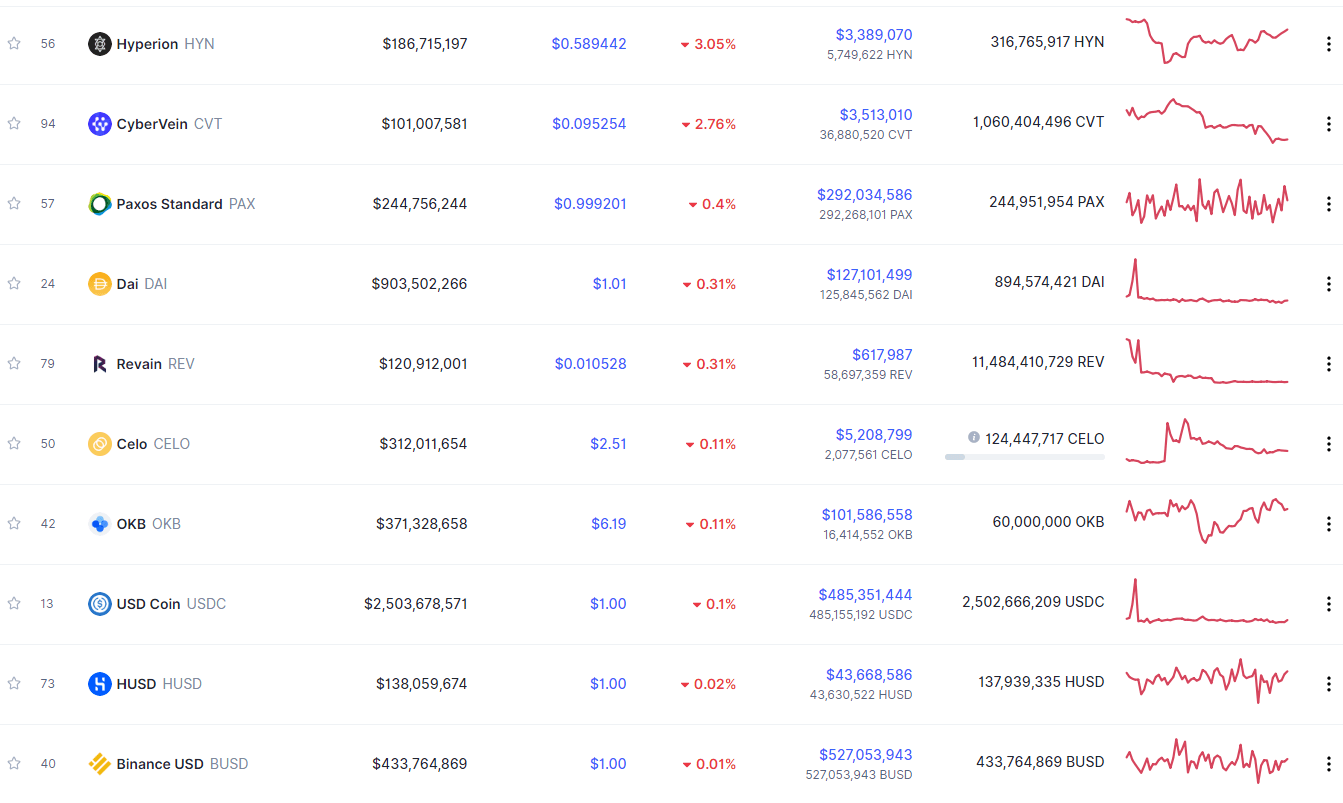
Bottom 10 24-hour Performers (Click to enlarge)
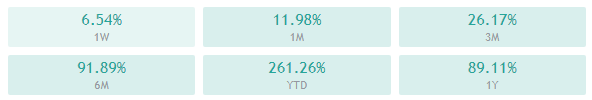
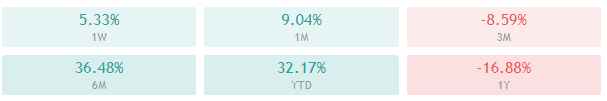
Bitcoin’s market dominance has stayed at the same place as yesterday, with its value currently staying at 62.2%. This value represents a 0% difference when compared to the value it had yesterday.
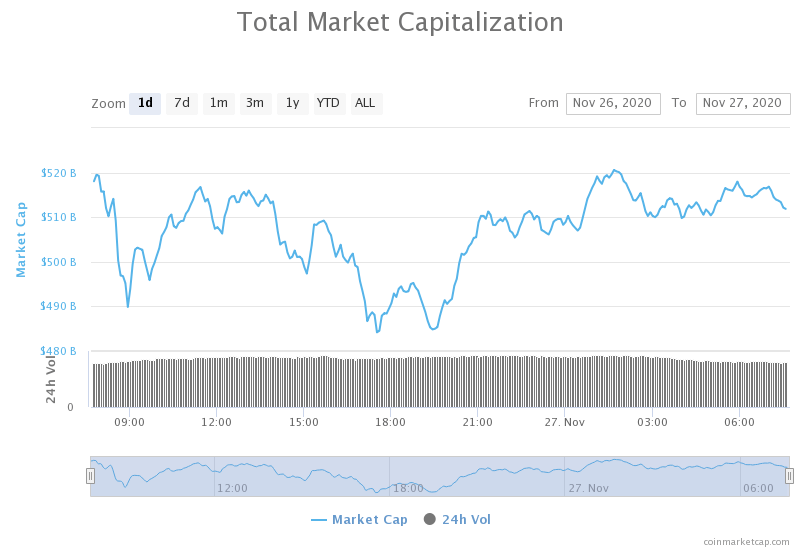
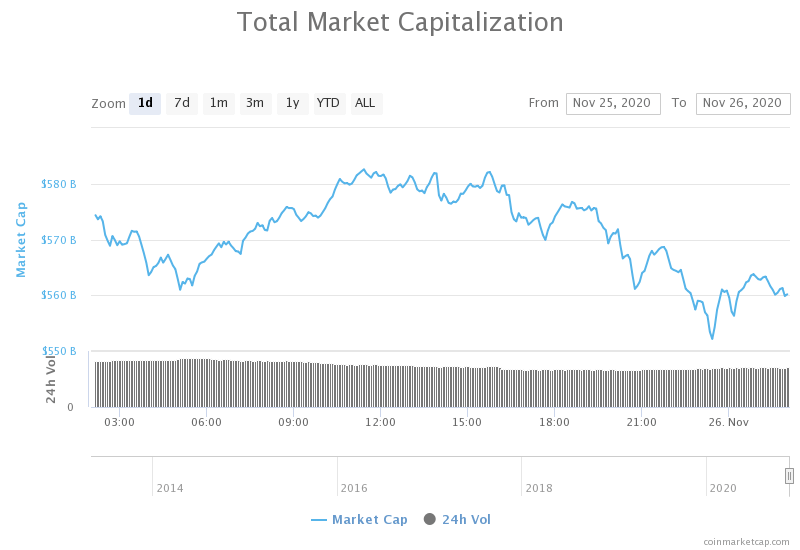
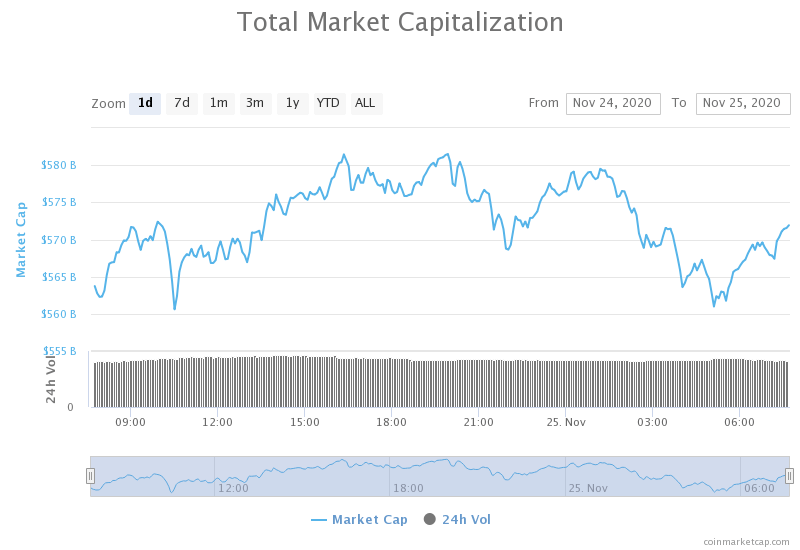
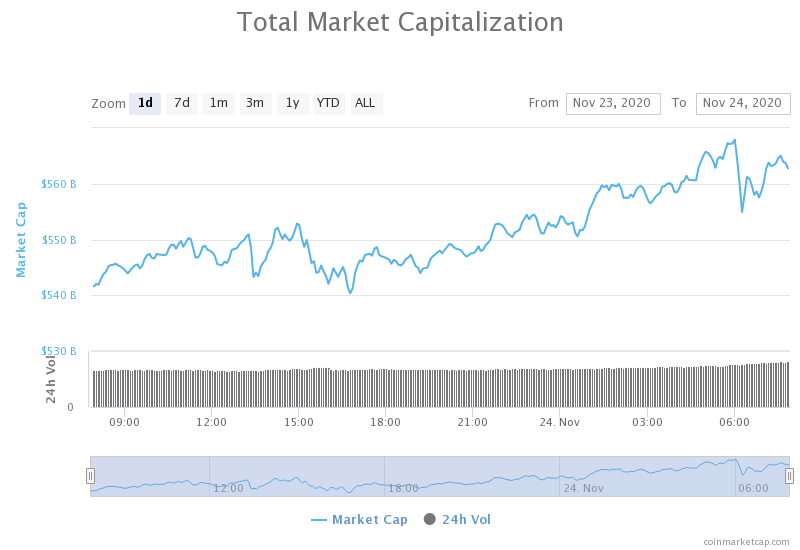
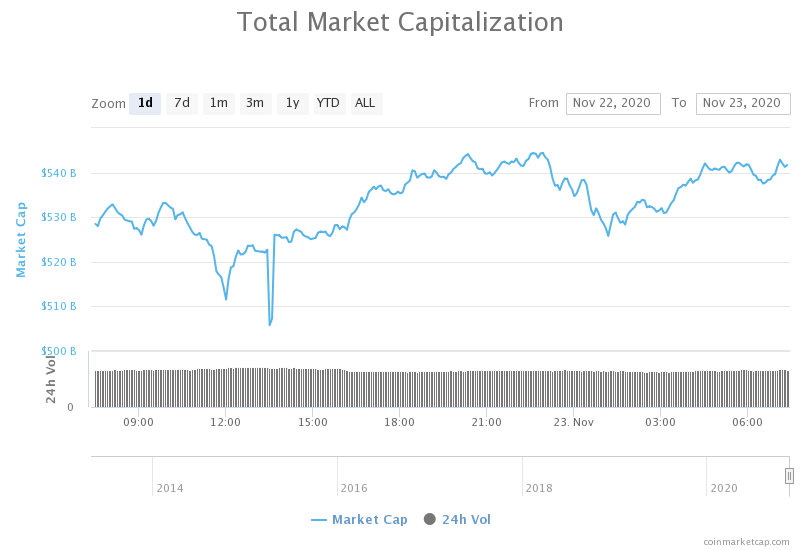
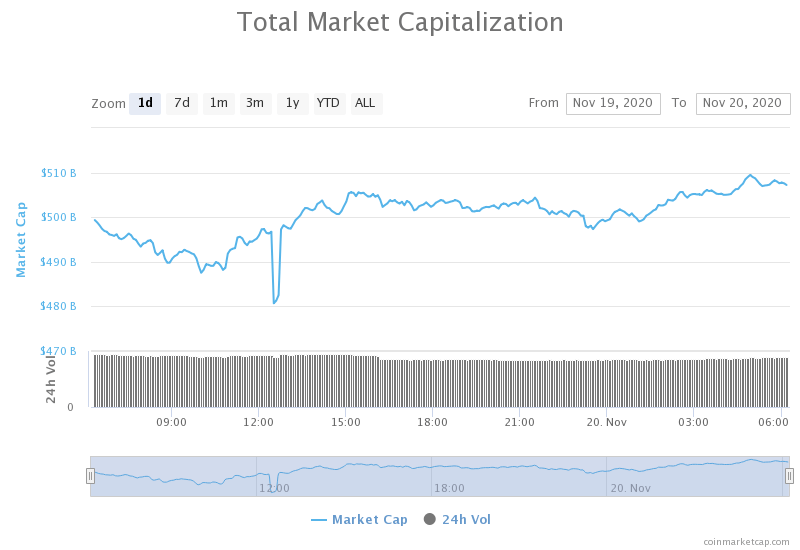
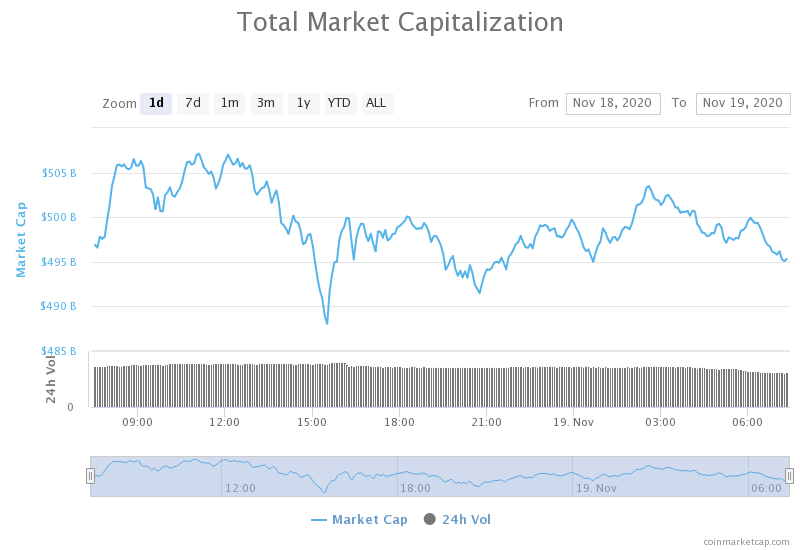
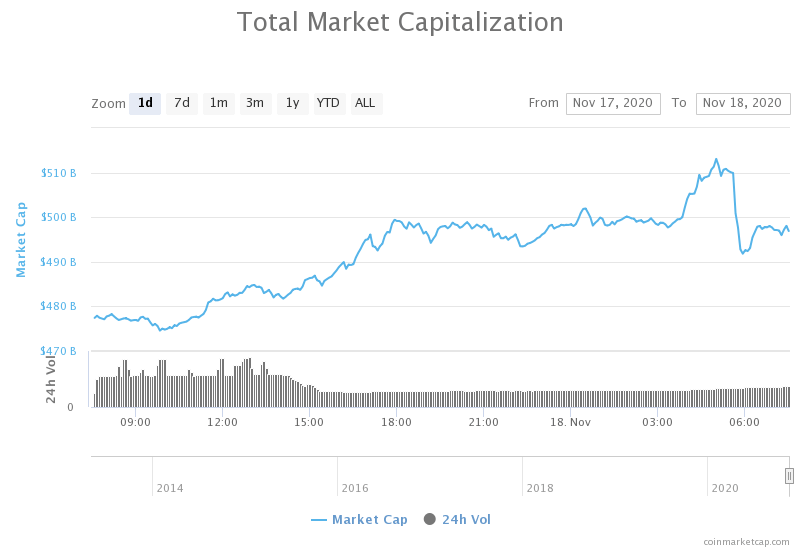
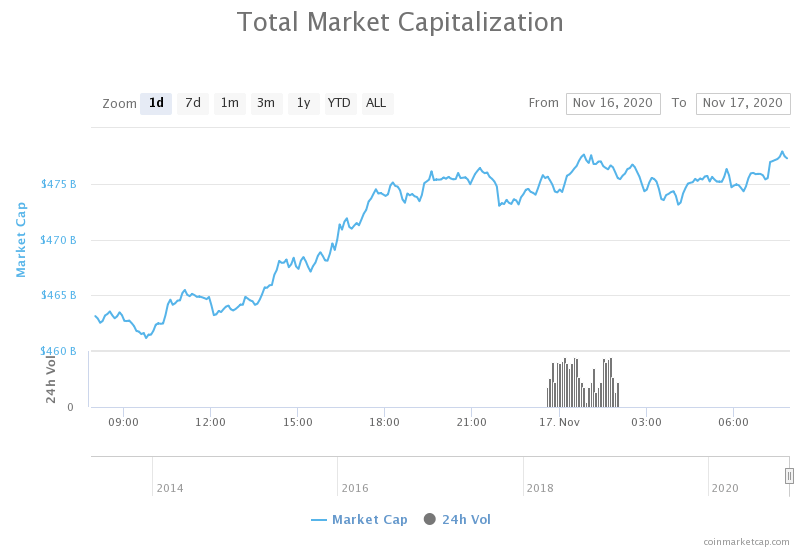
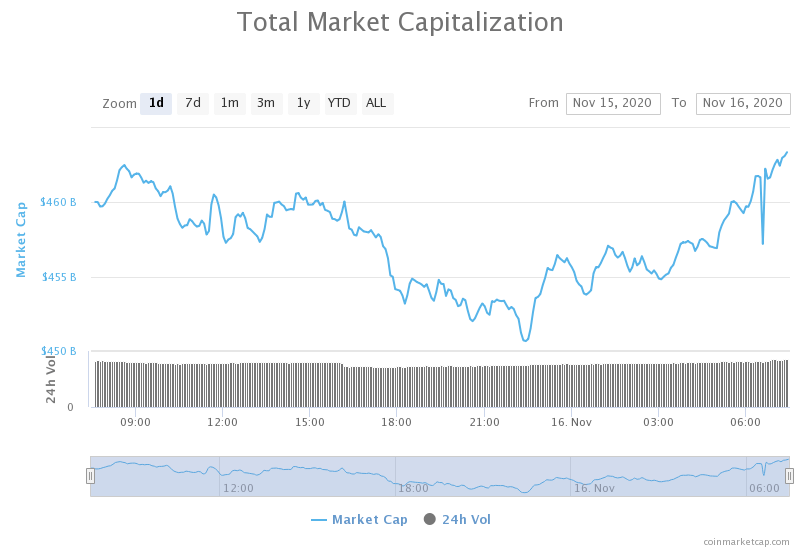
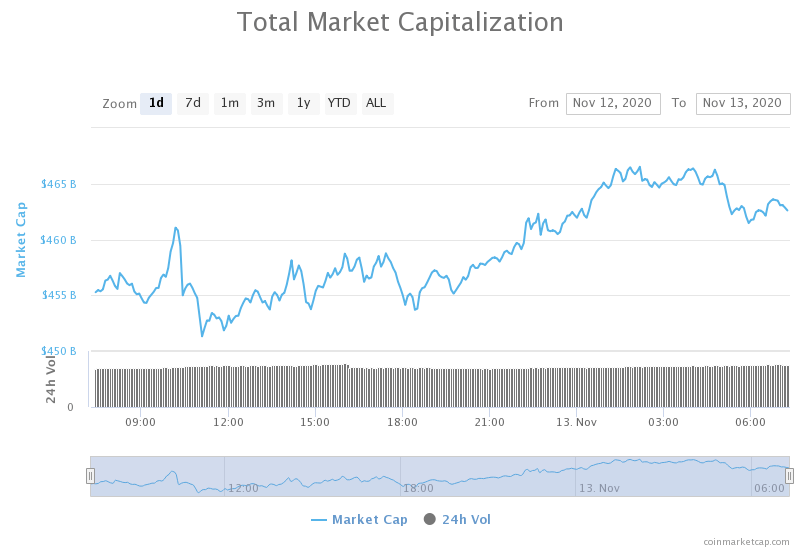
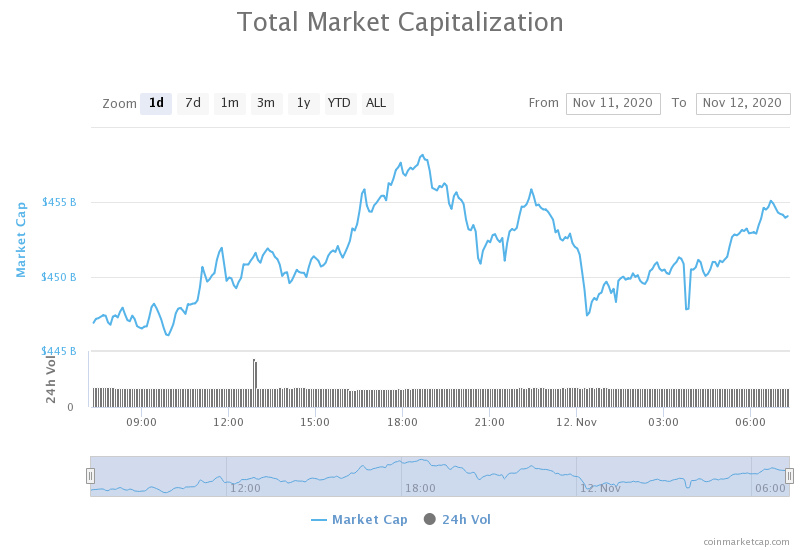
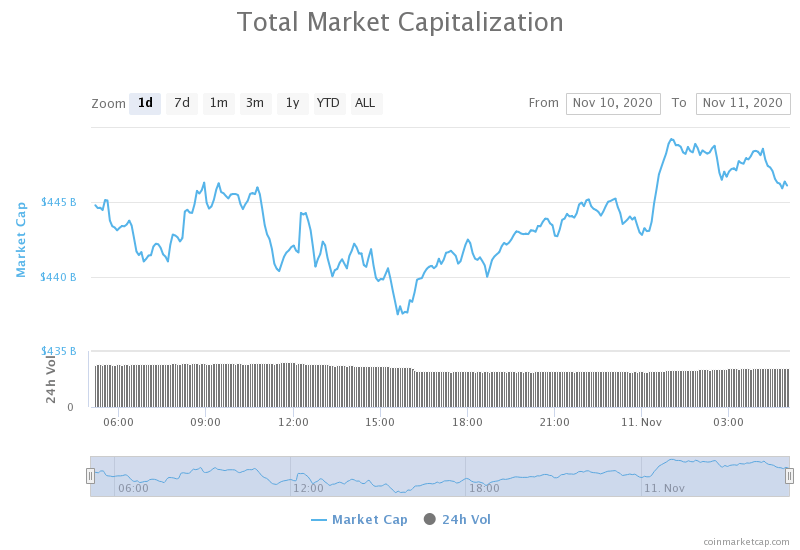
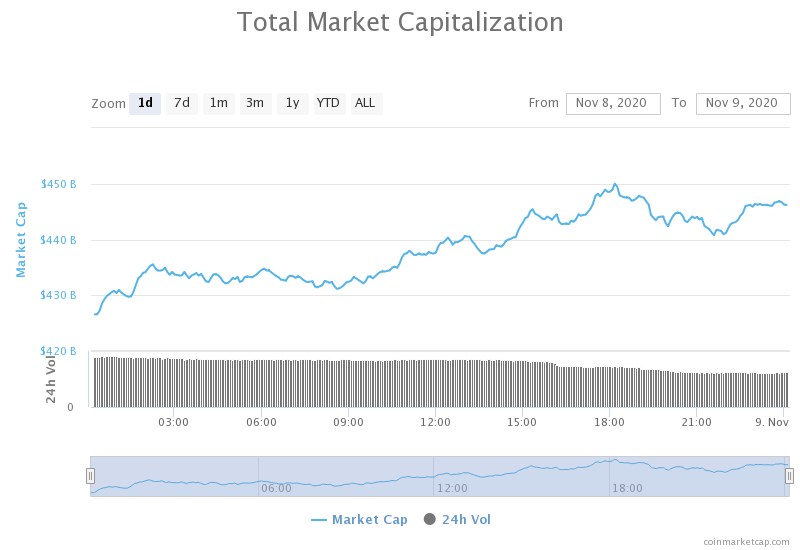
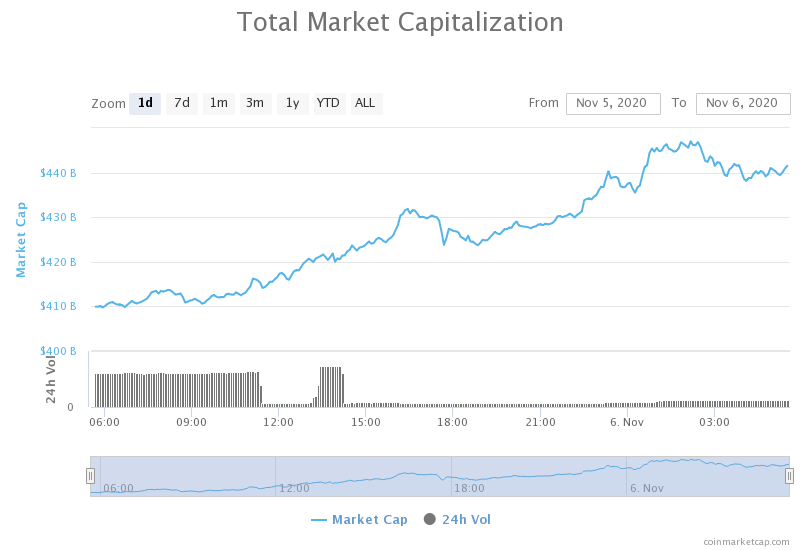
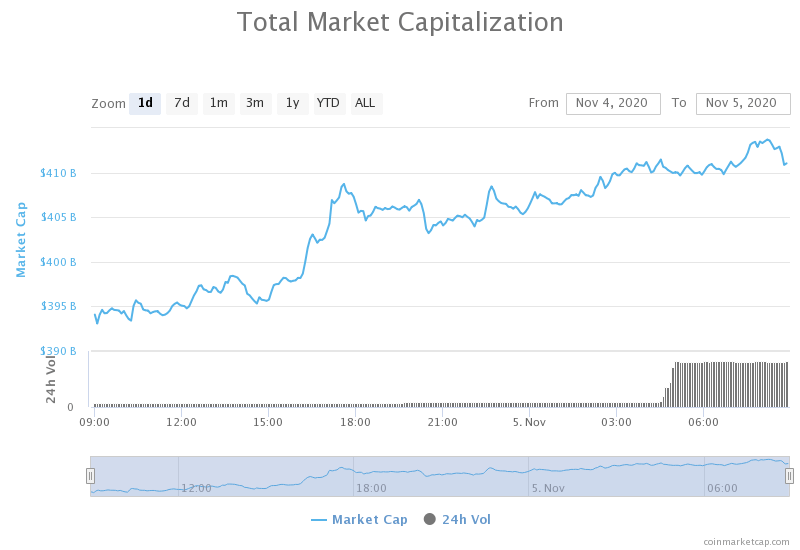
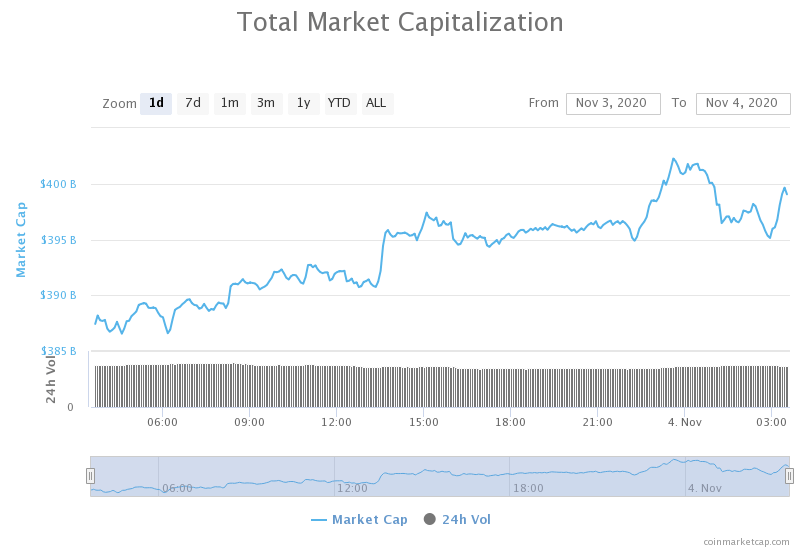
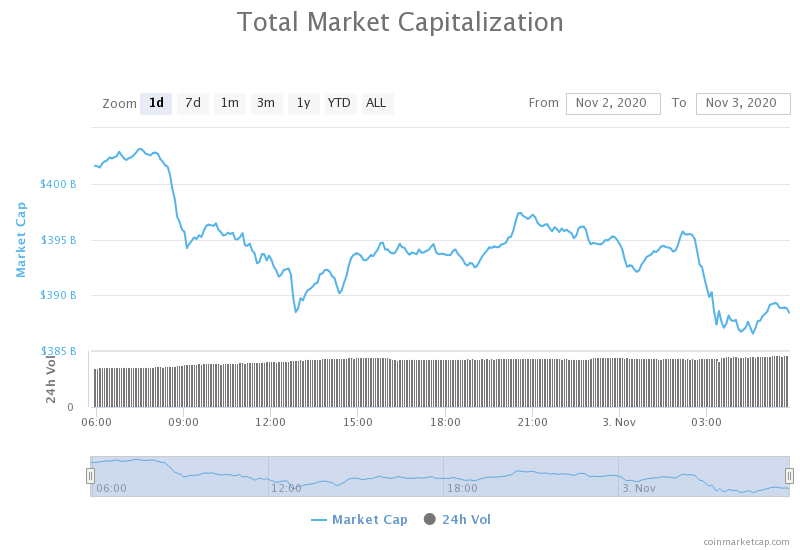
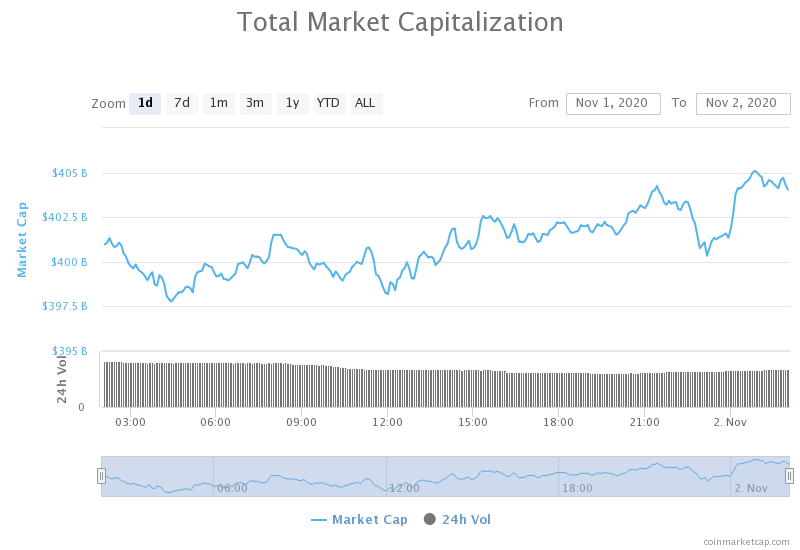
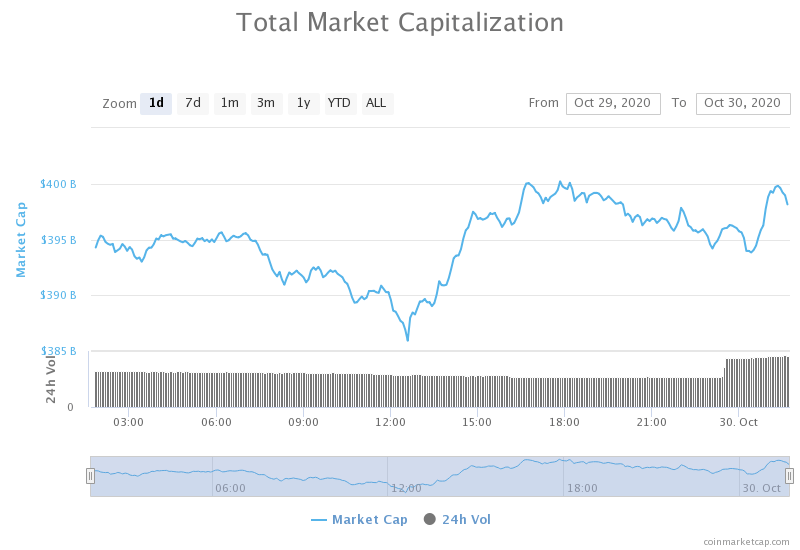
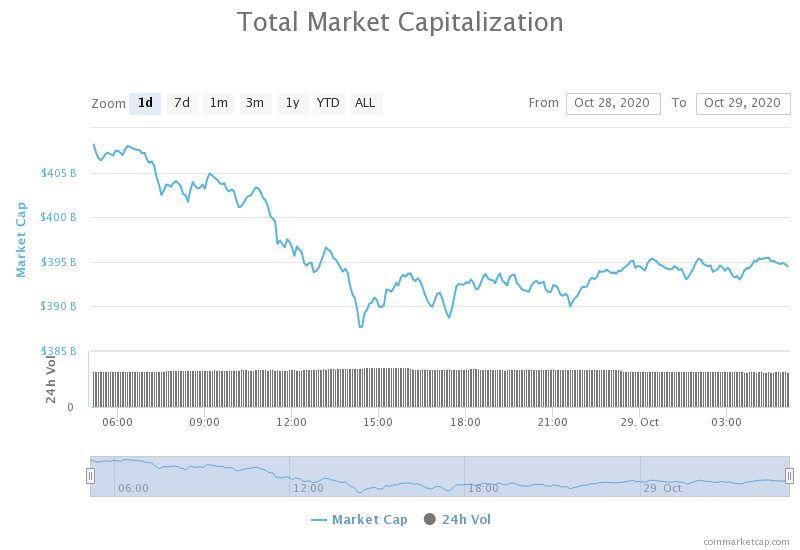
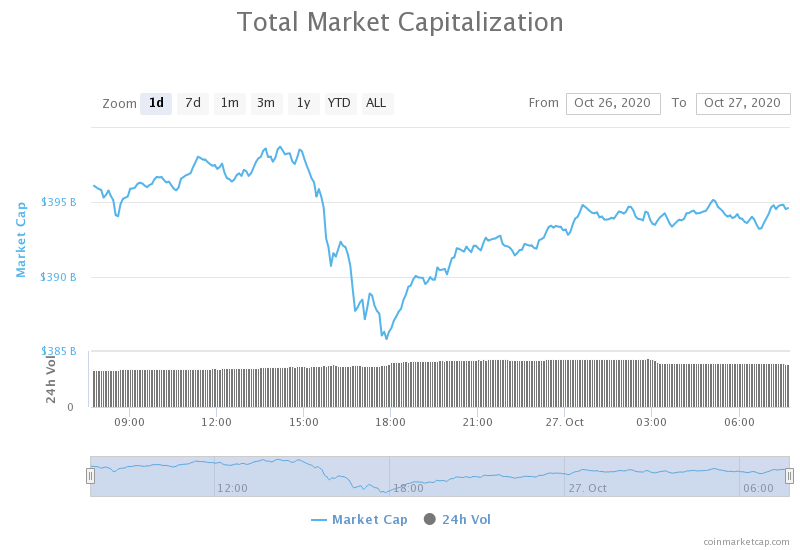
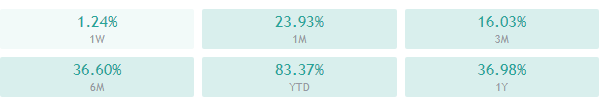
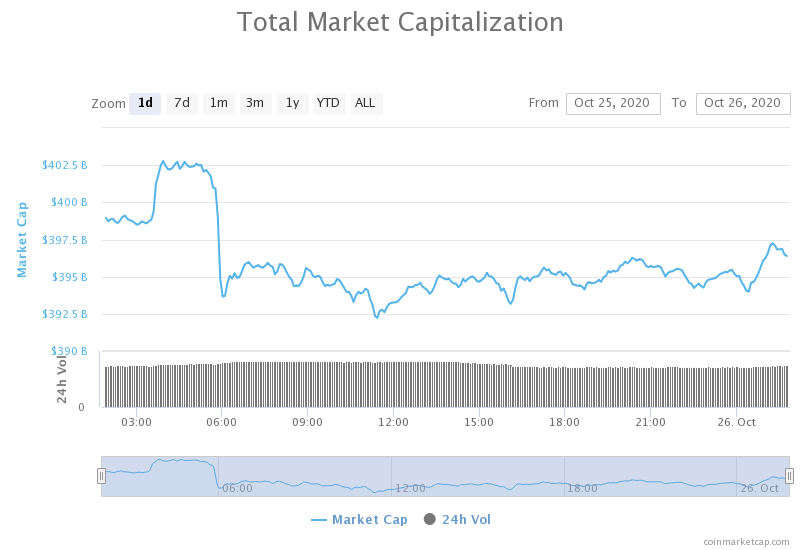
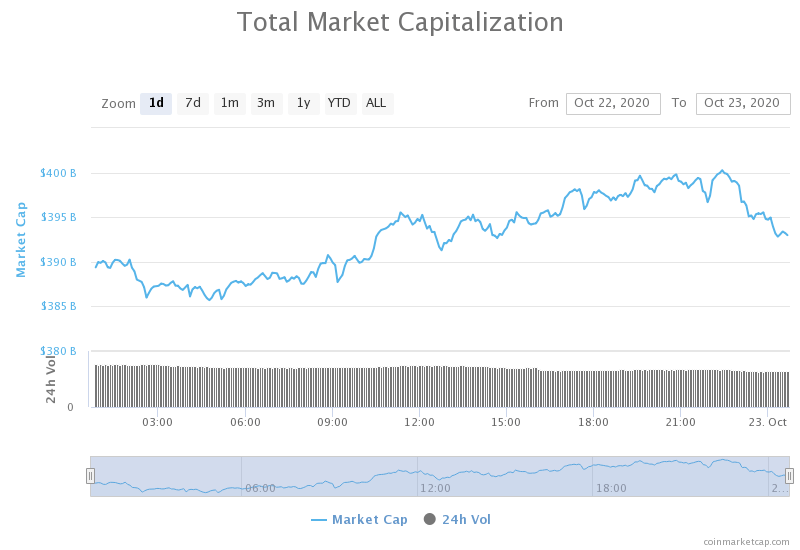
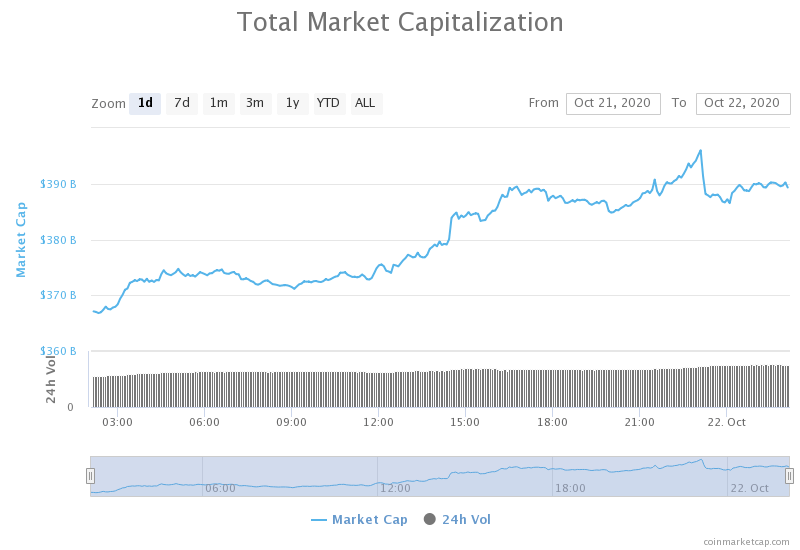
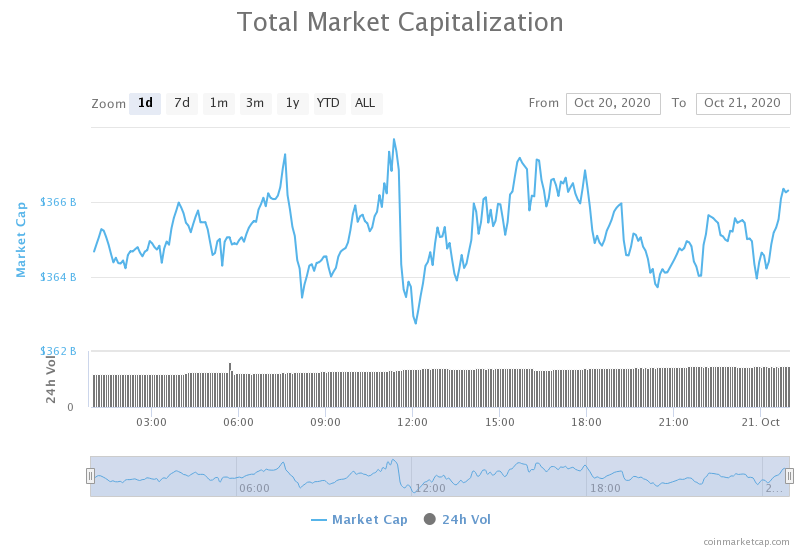
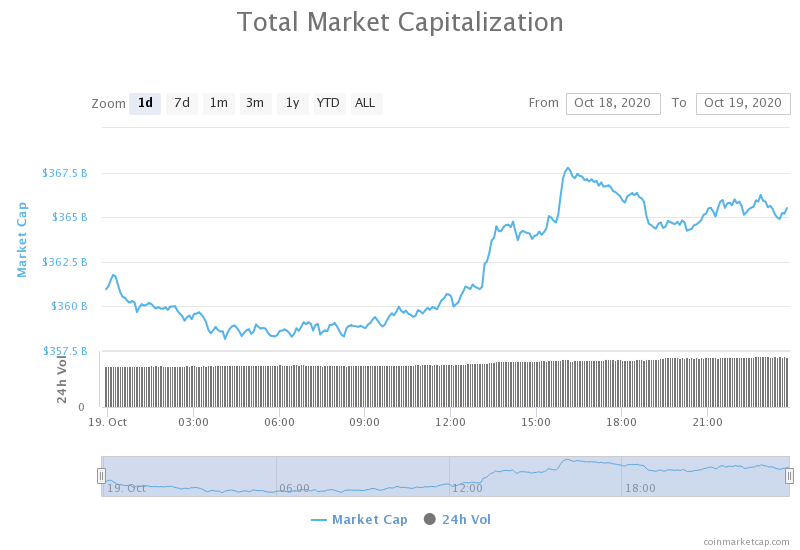
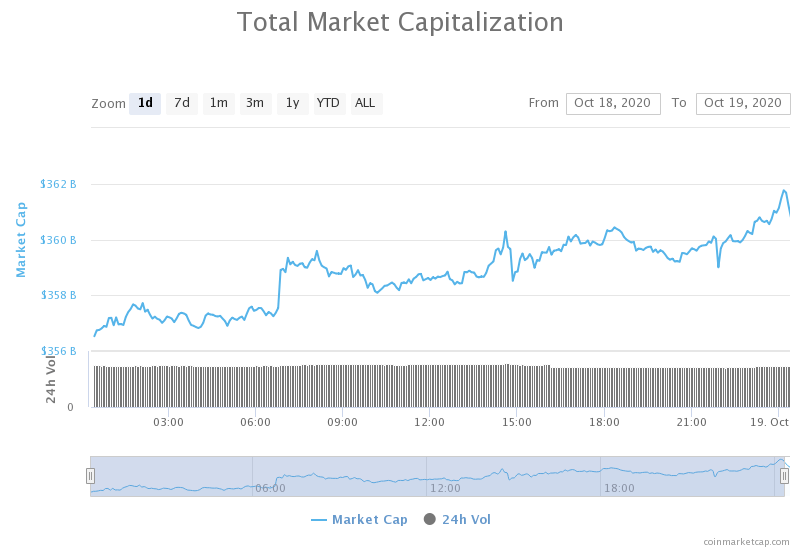
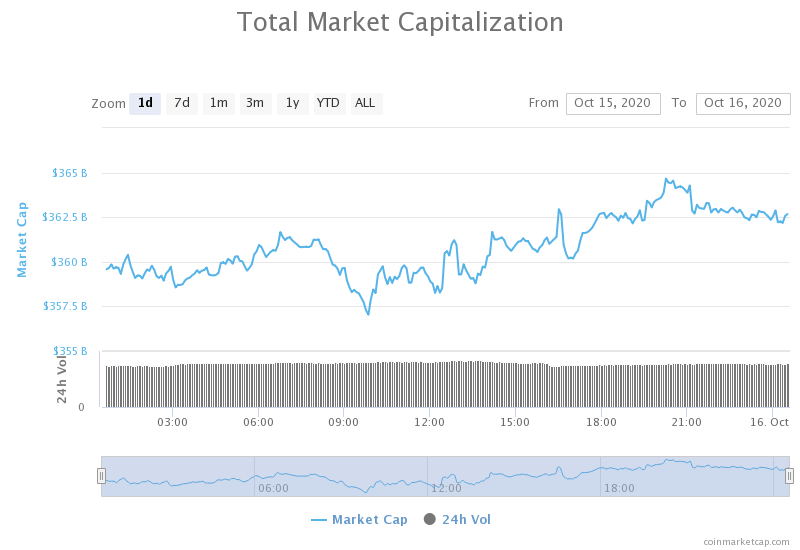
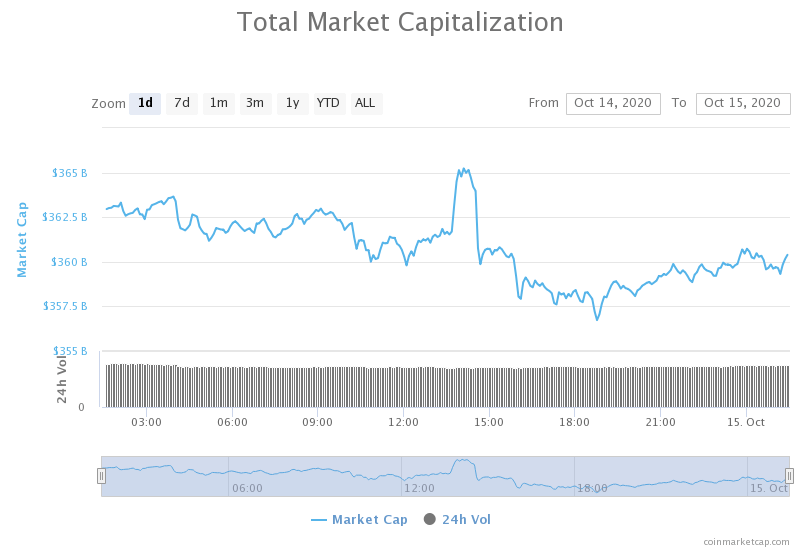
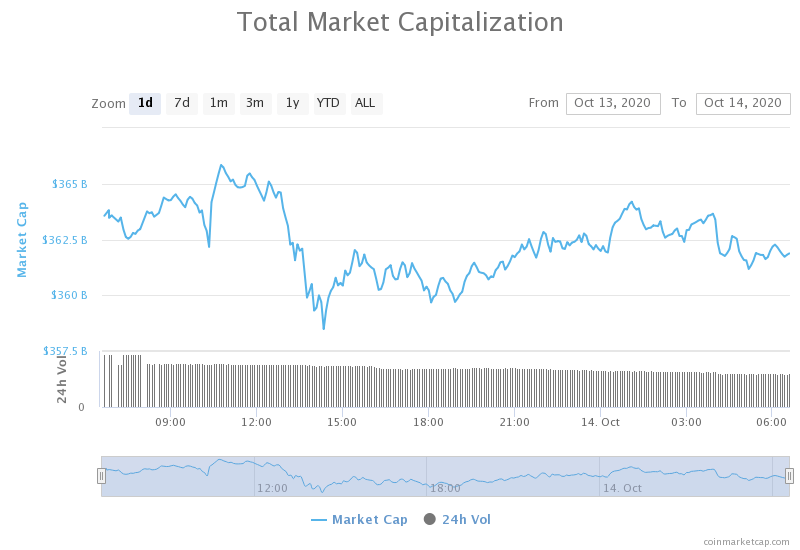
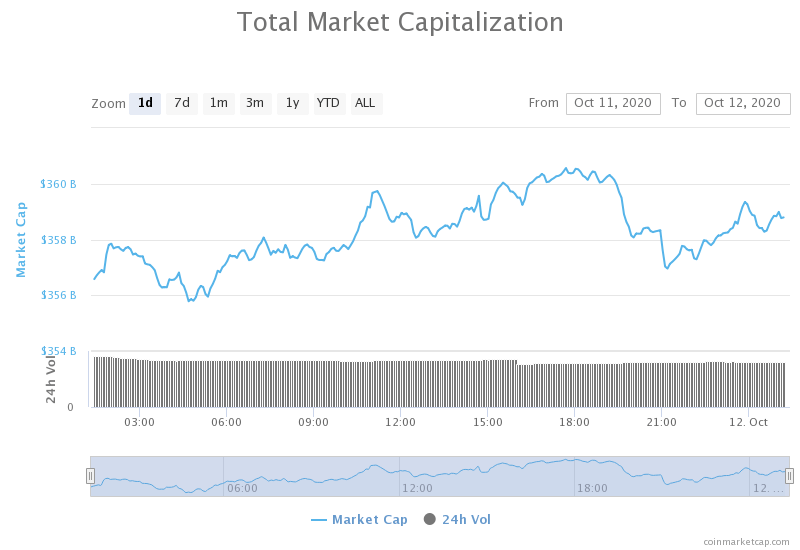
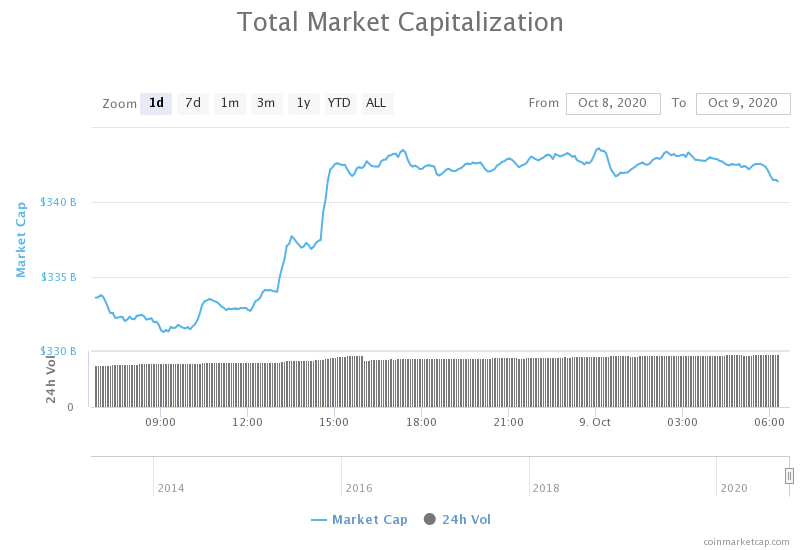
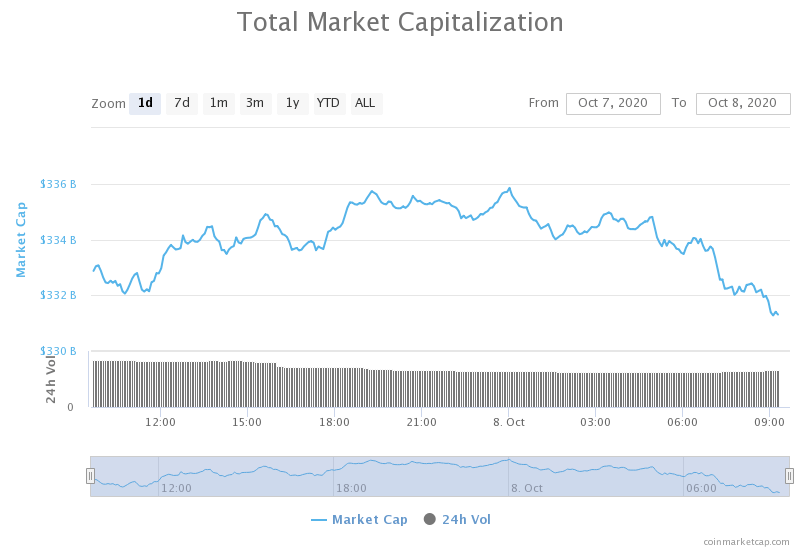
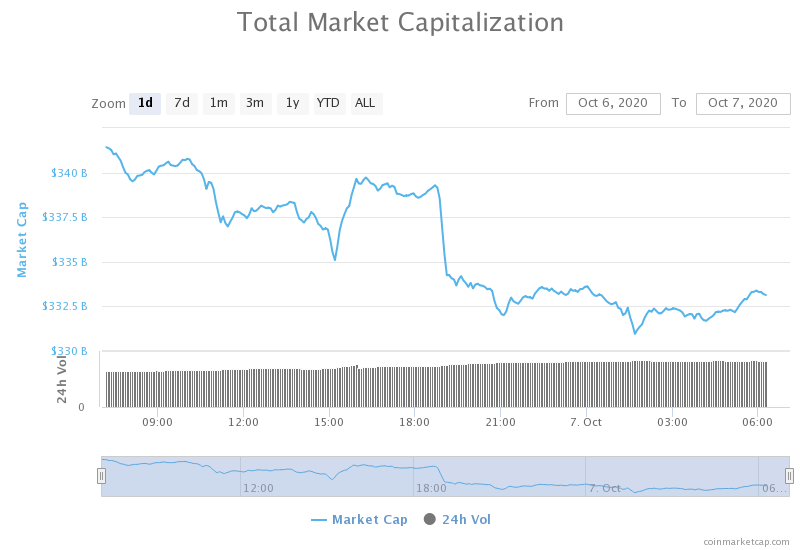
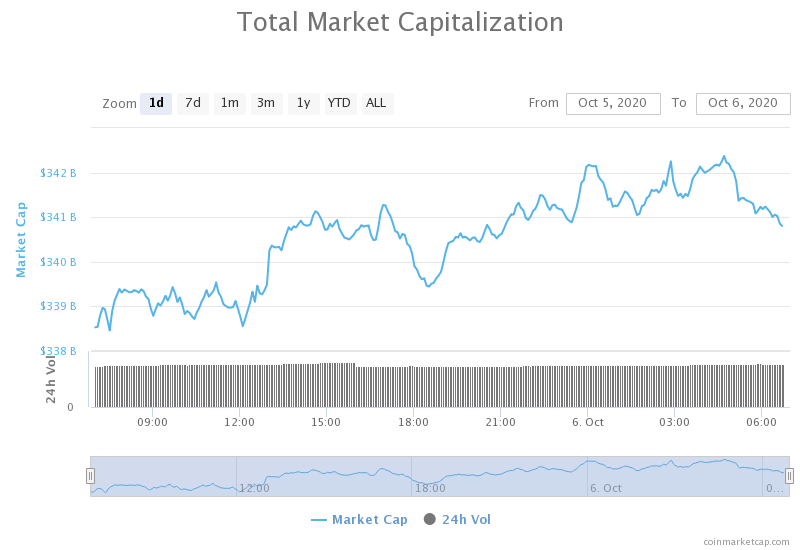
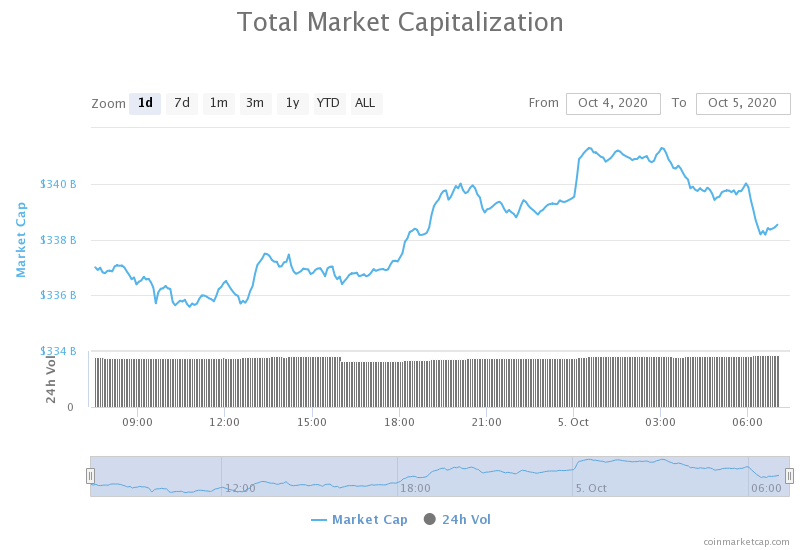
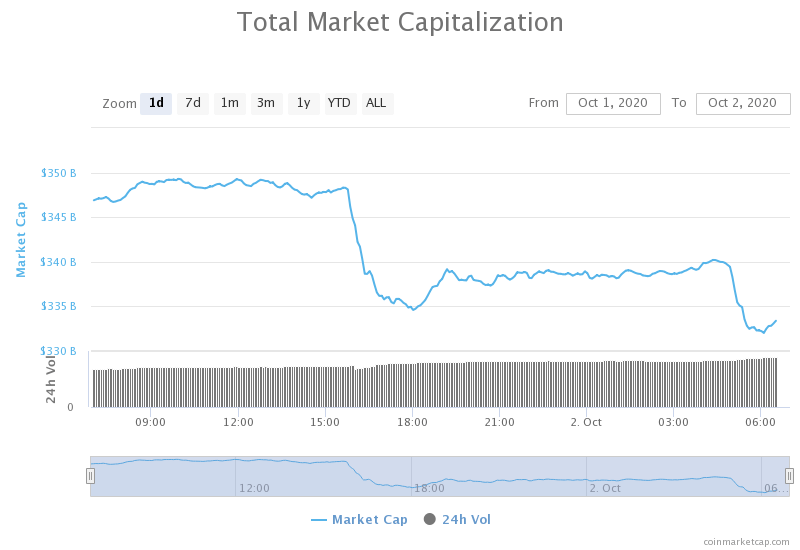
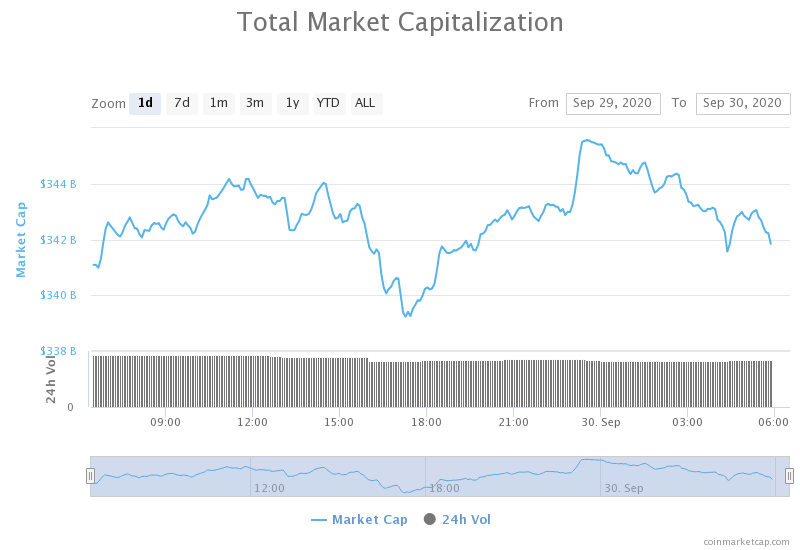
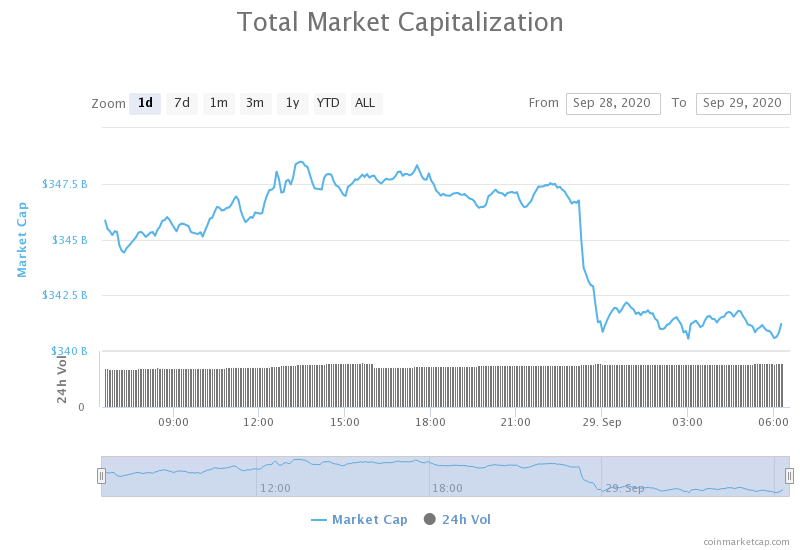
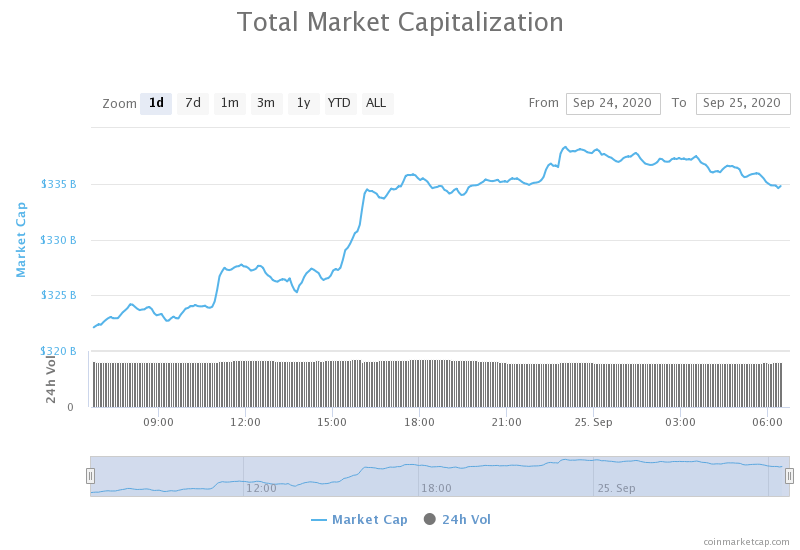
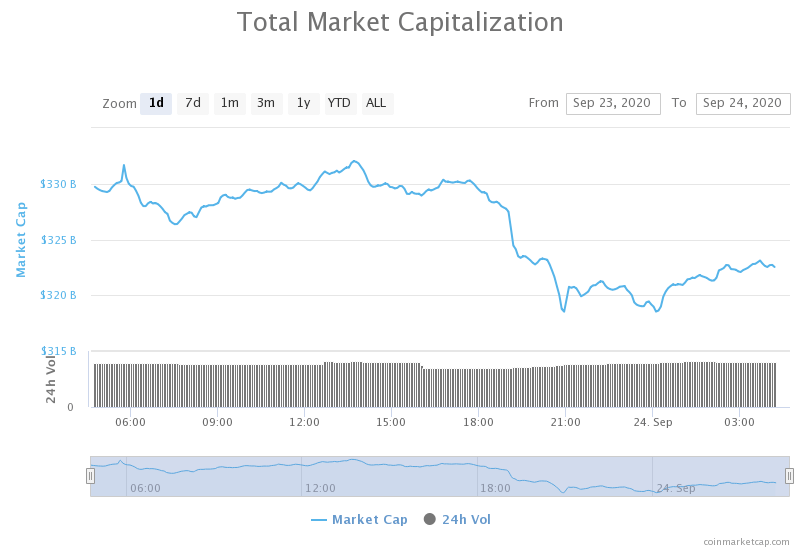
Daily Crypto Market Cap Chart
The crypto sector capitalization has decreased significantly over the course of the day. Its current value is $511.86 billion, representing a $48.67 billion decrease compared to our previous report.
_______________________________________________________________________
What happened in the past 24 hours?
_______________________________________________________________________
- Bitcoin price crashes to $16,350 as various derivatives positions worth billions of dollars get liquidated (The Block)
- OKEx has seen over $110m in net crypto outflows after its withdrawals reopened (The Block)
- DAI price increase led to a whopping $103 million worth of liquidations at DeFi protocol Compound (The Block)
- Crypto.com Now Allows its Customers to Pay Tax Fees in Bitcoin (Cryptobriefing)
- US Treasury Department Proposal an “Existential Threat to Bitcoin” (Cryptobriefing)
- Indian Cryptocurrency Investors Want to Clear the Fog Around Regulations (Cryptobriefing)
- Despite losing $120m in a single day, MicroStrategy is still up on its Bitcoin investment (Cryptoslate)
- Yes, You Can Now Spend Your Bitcoin This Black Friday (Coindesk)
- Previously Unpublished Emails of Satoshi Nakamoto Present a New Puzzle (Coindesk)
- Bitcoin’s price correction may not be over yet, on-chain data analysts warn (Cointelegraph)
_______________________________________________________________________
Technical analysis
_______________________________________________________________________
Bitcoin
The largest cryptocurrency by market cap has triggered a rally towards the downside after creating a double top, which brought its price as low as $16,215. While some analysts say that the downturn is not over yet, Bitcoin has recovered slightly and is now consolidating just above the $17,000 mark.
While shorting Bitcoin could be a good profit-making opportunity if the downtrend continues, trading against the long-term trend is very risky. However, thinking about hedging against any downturns should be considered.
BTC/USD 1-hour Chart
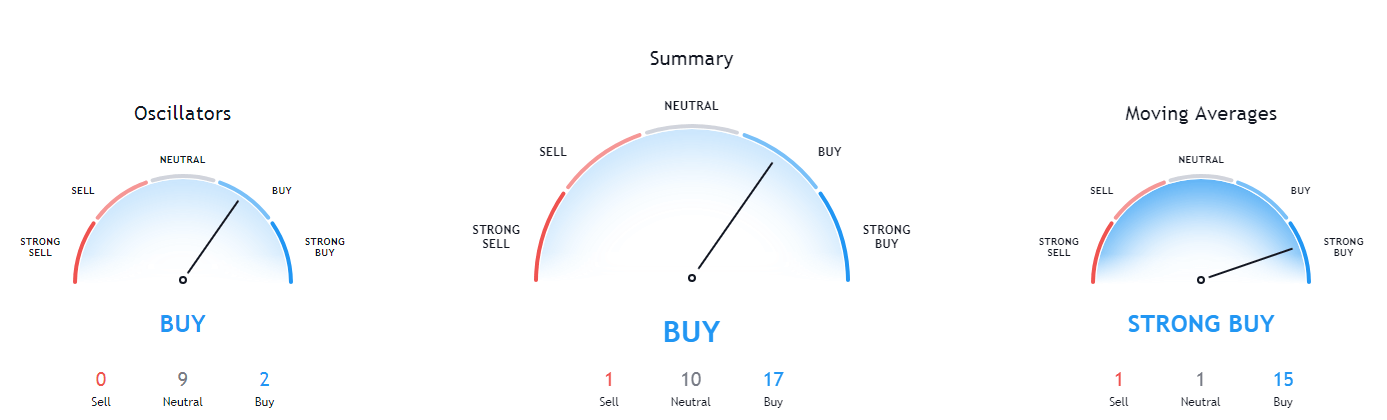
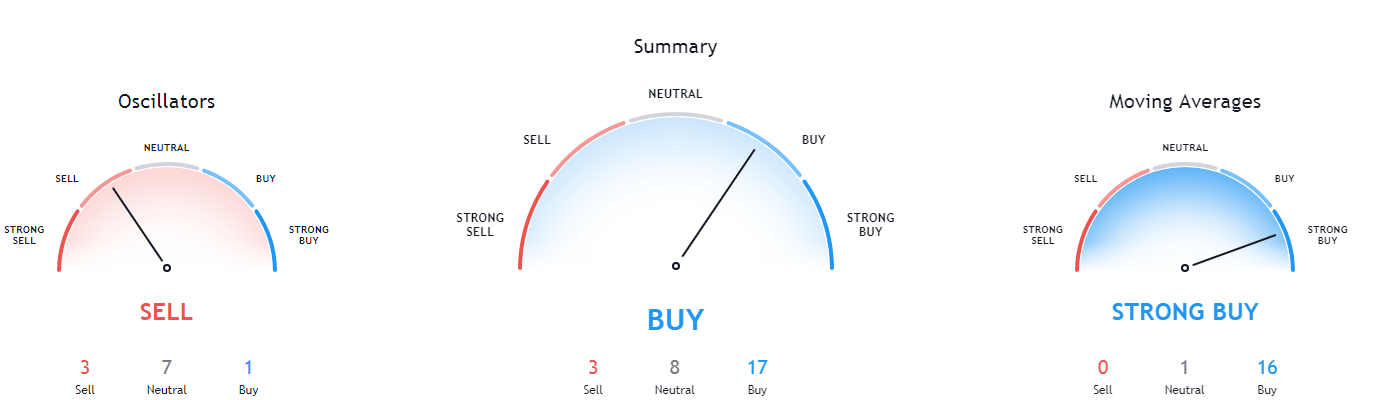
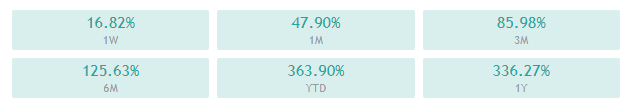
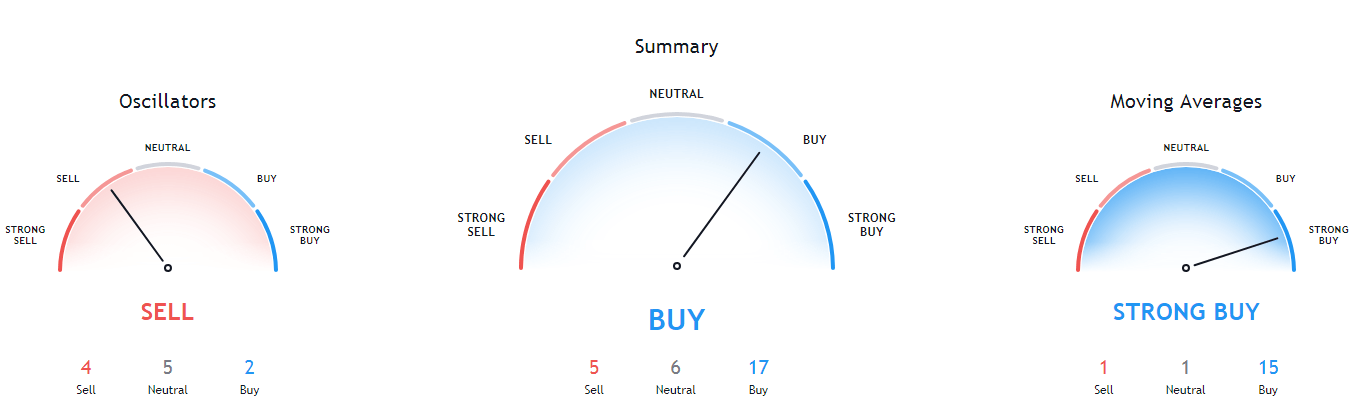
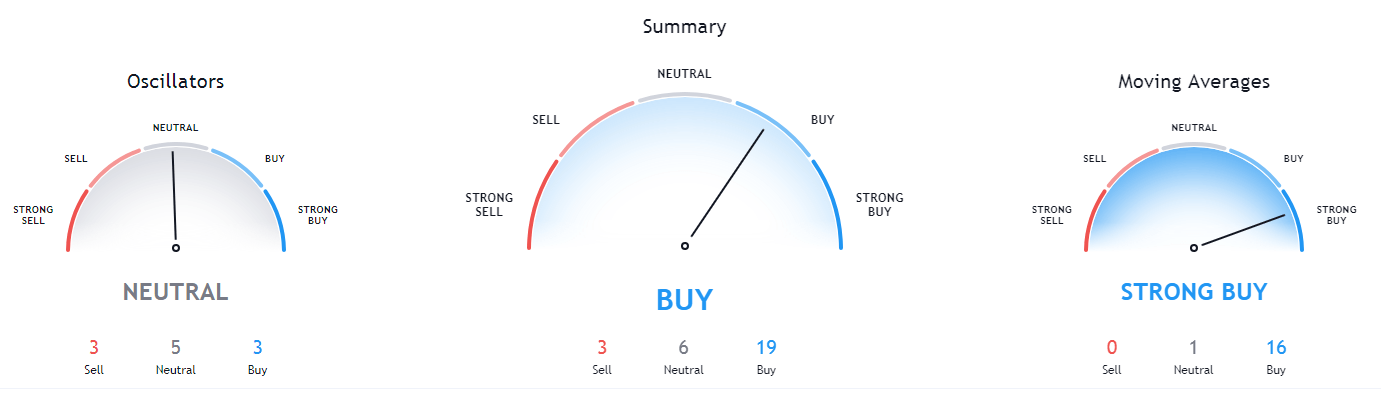
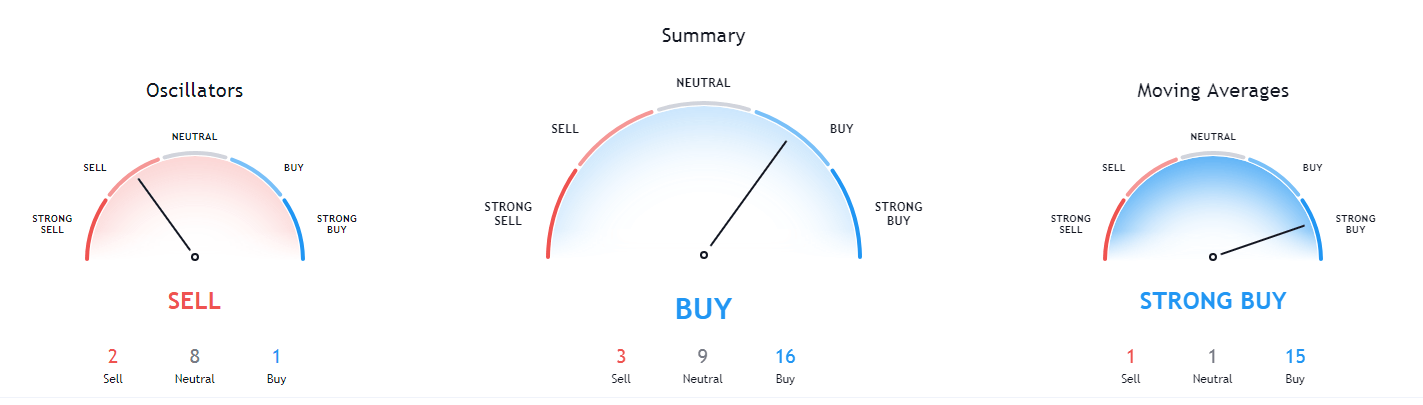
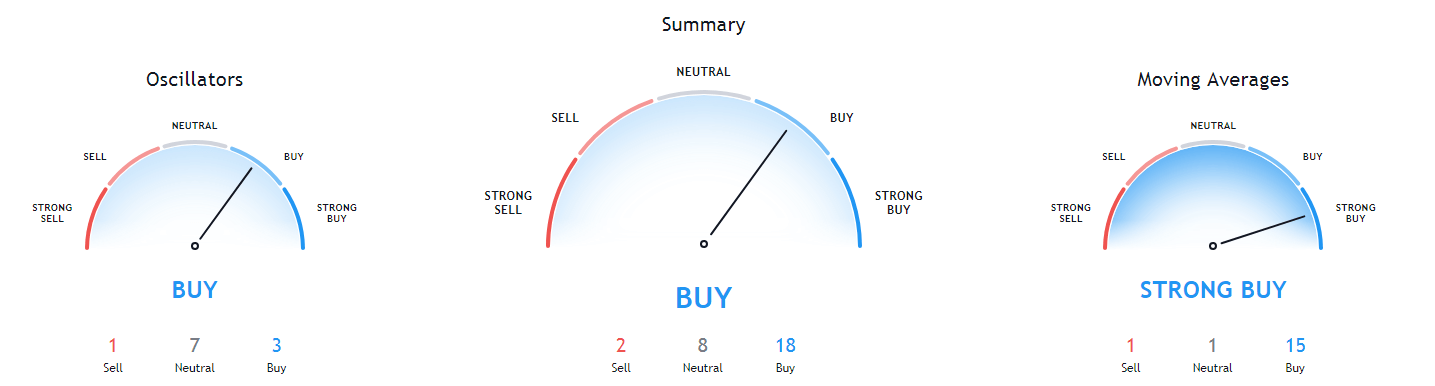
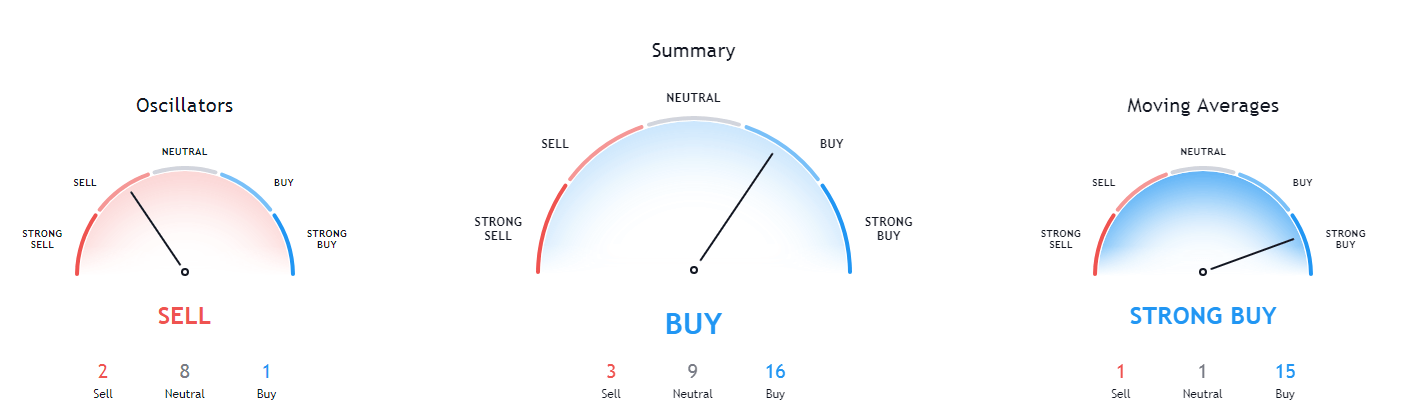
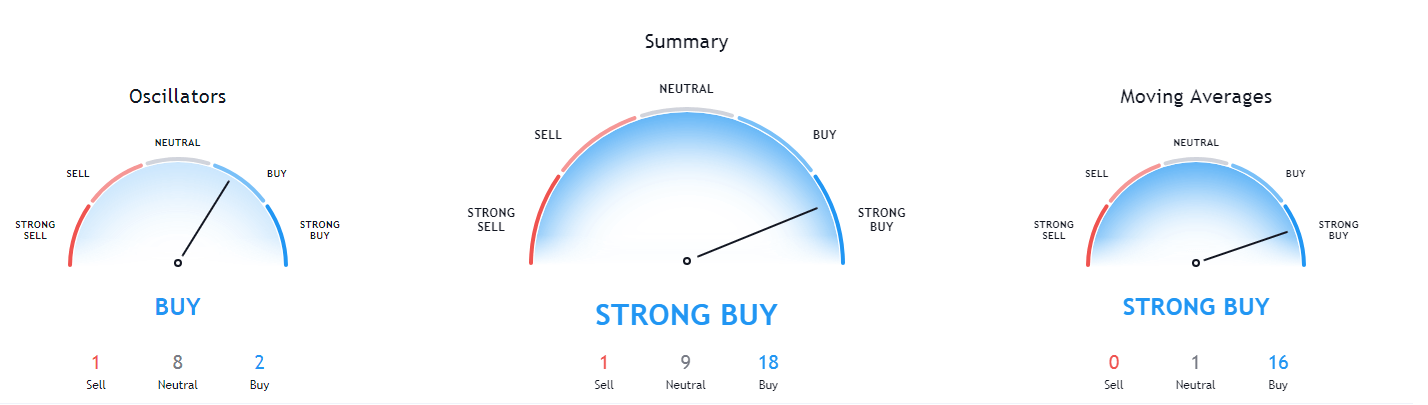
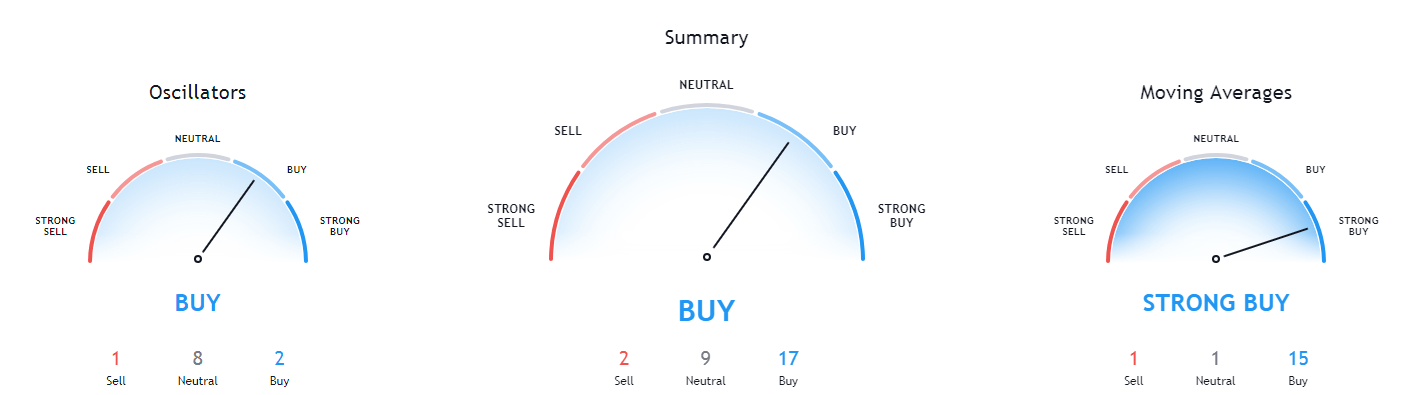
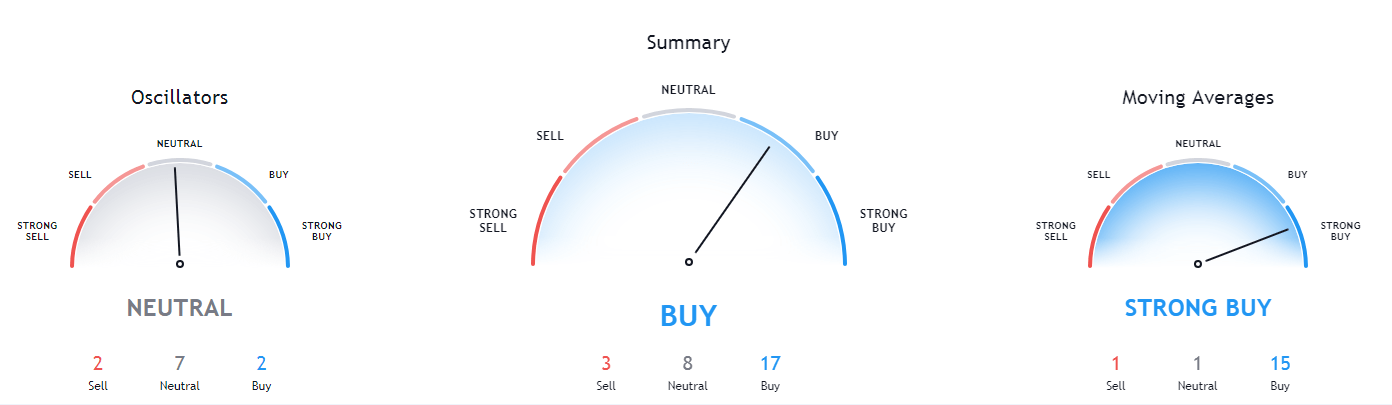
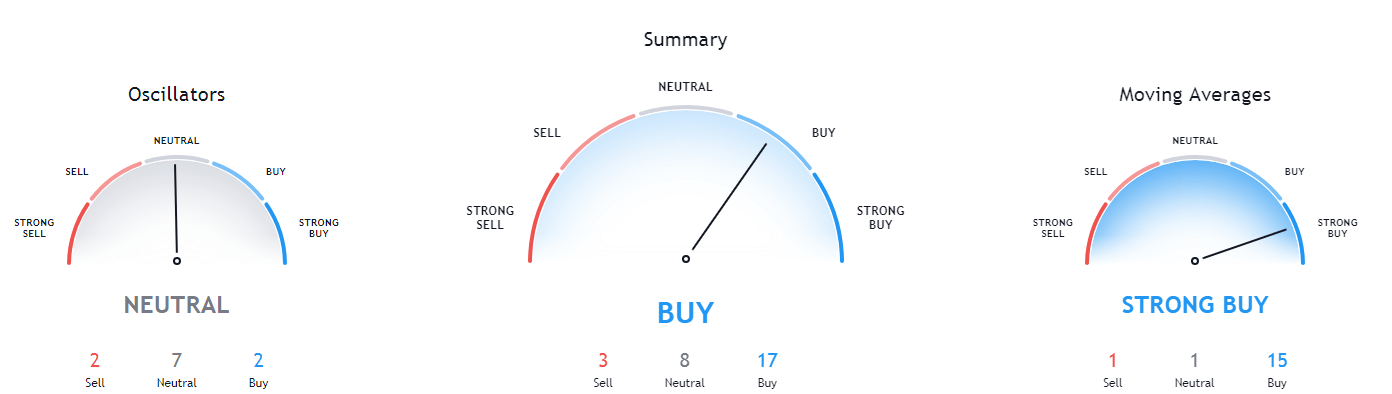
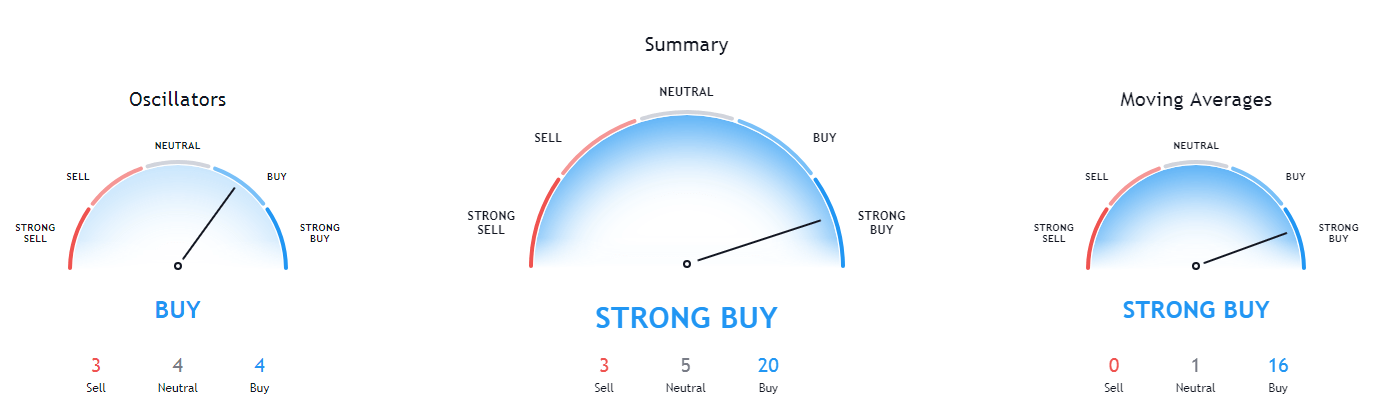
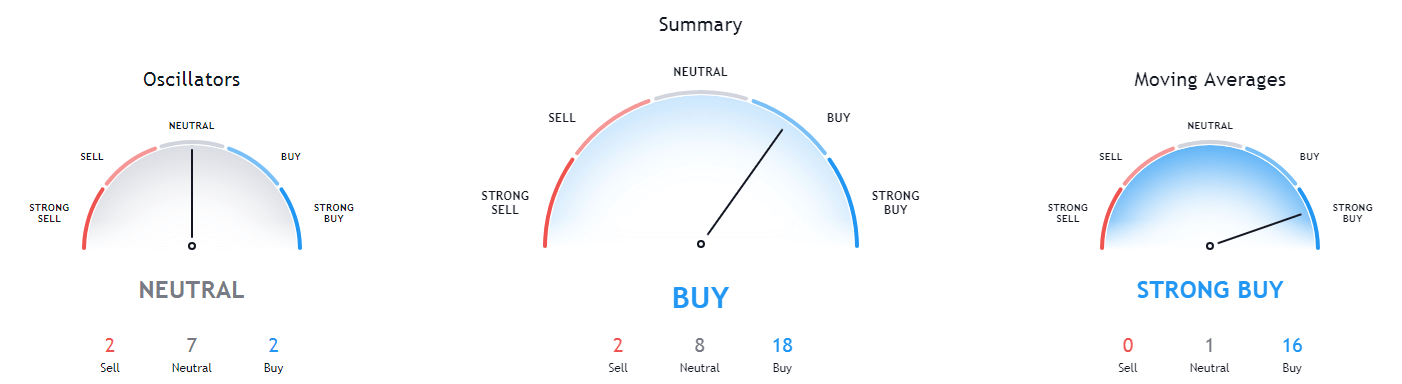
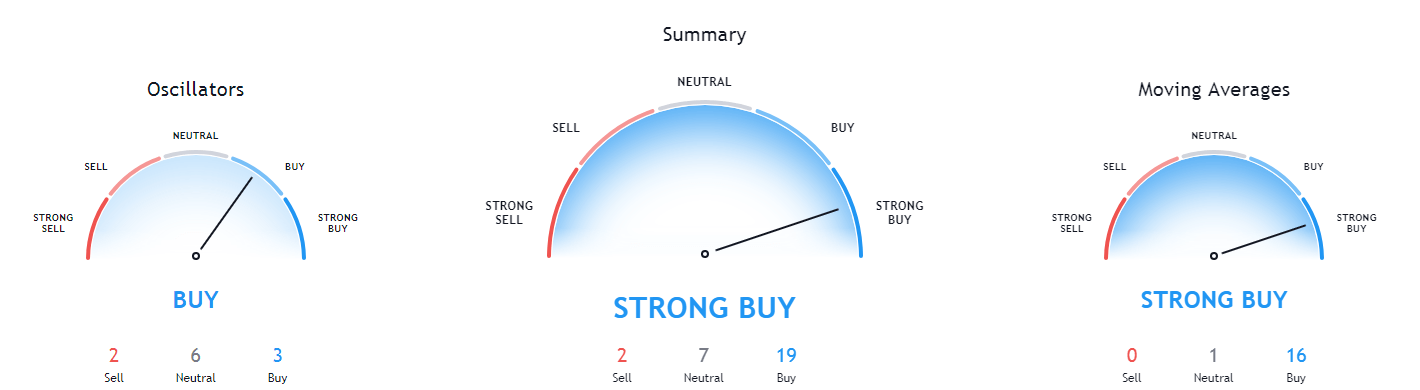
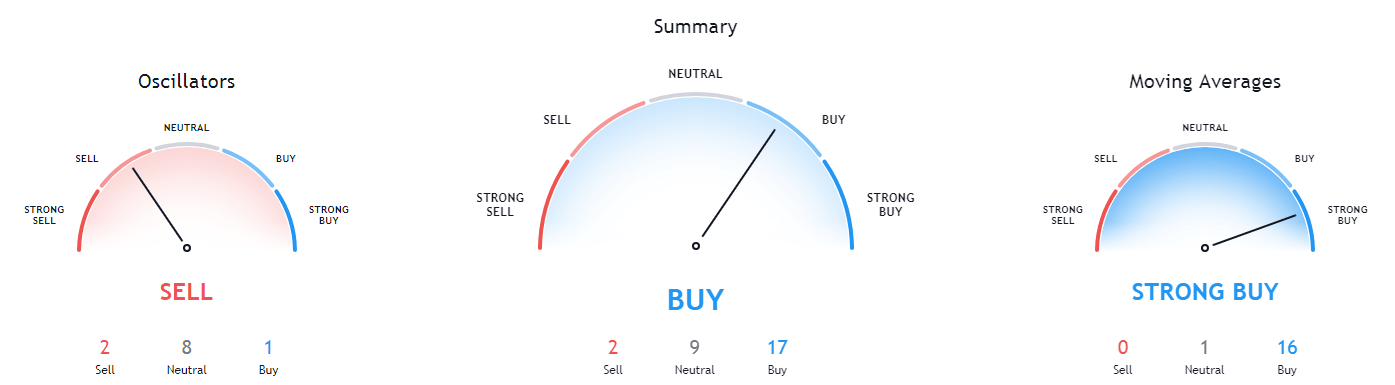
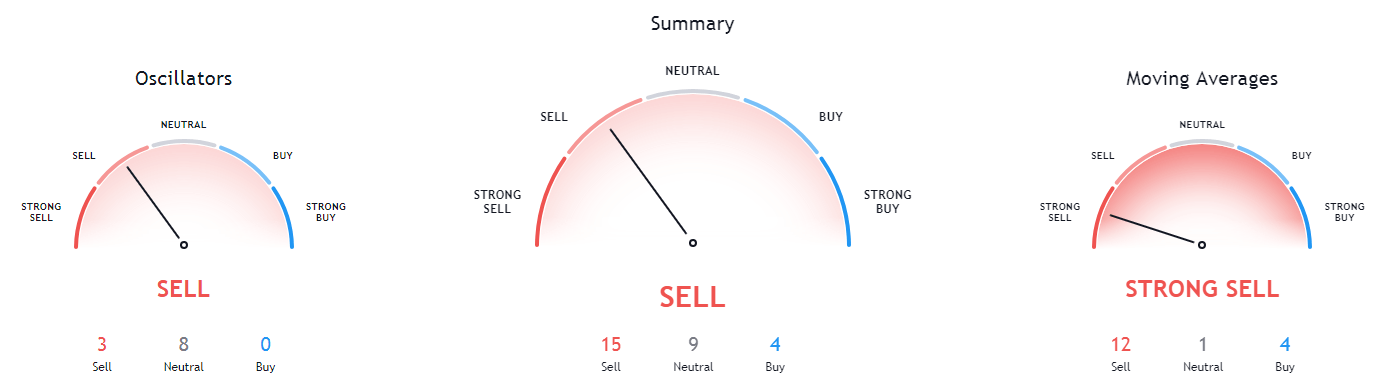
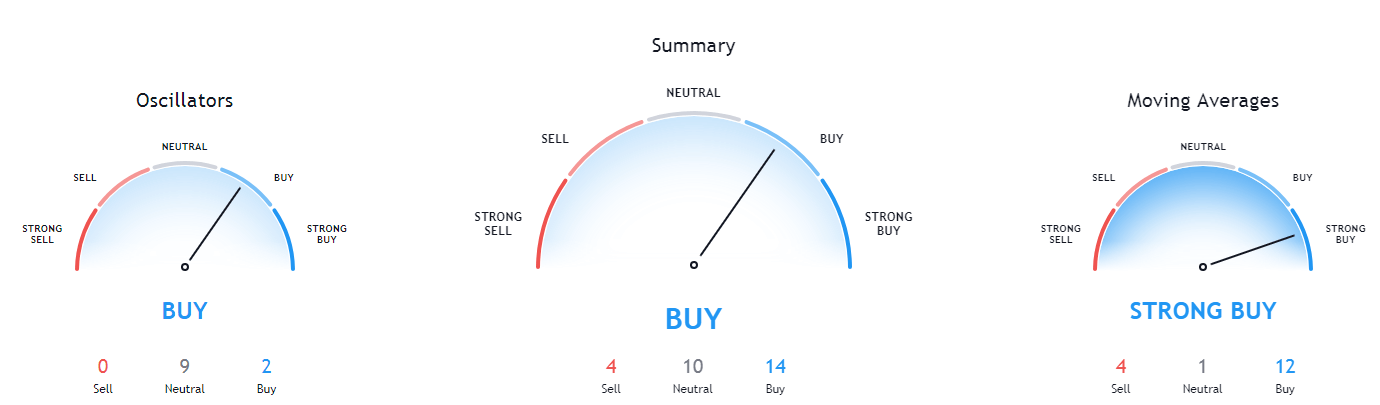
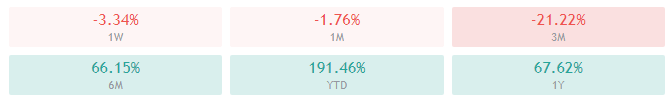
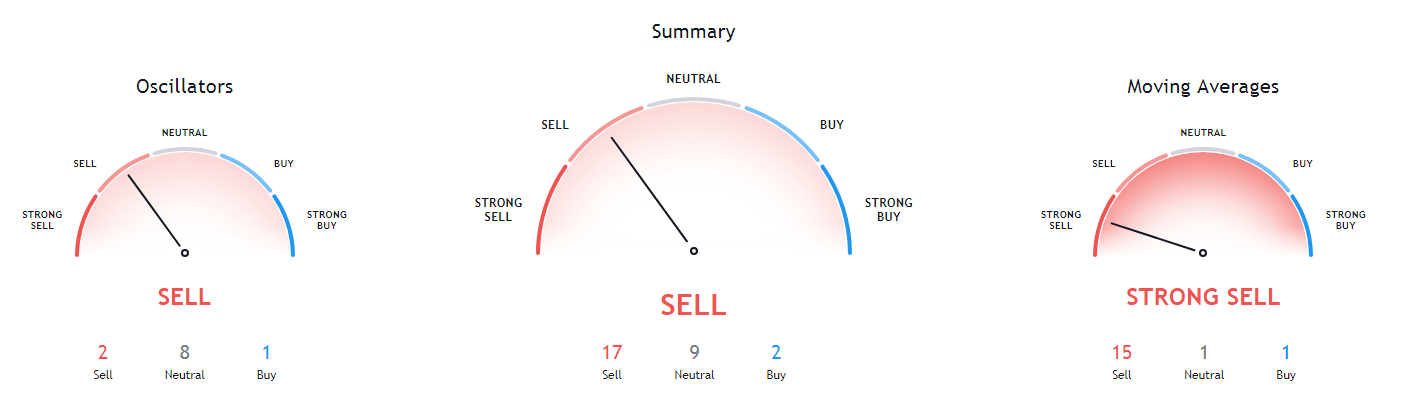
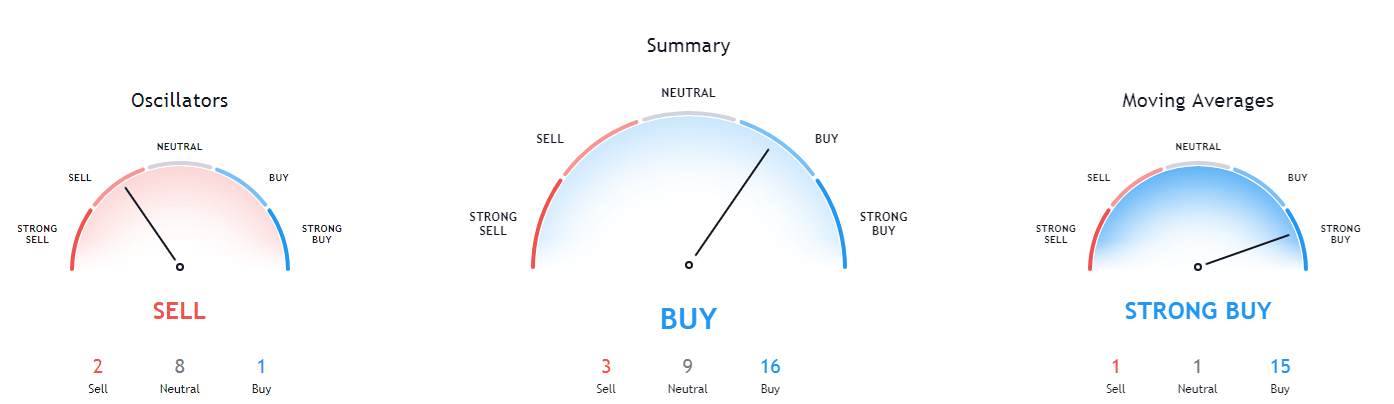
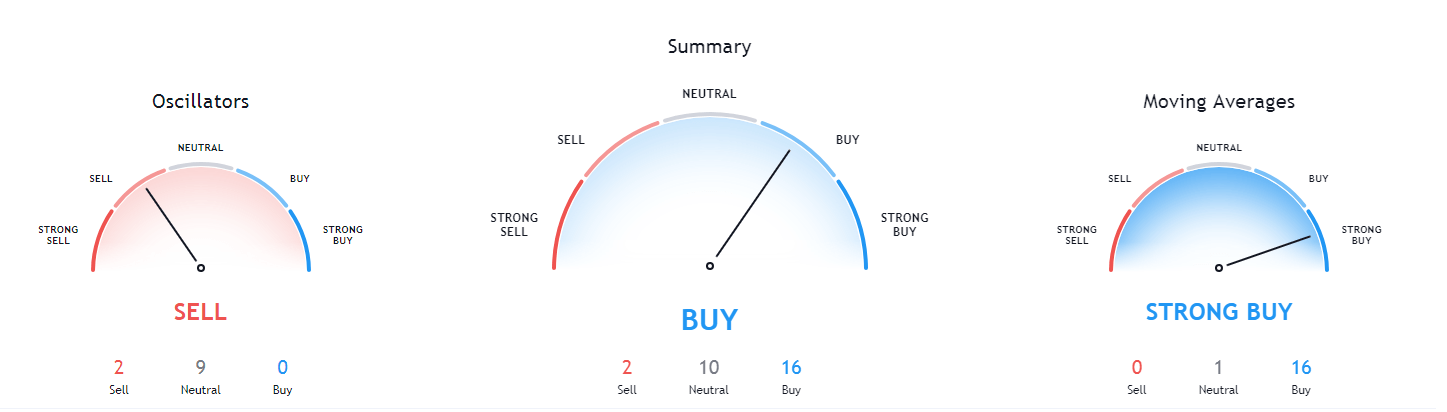
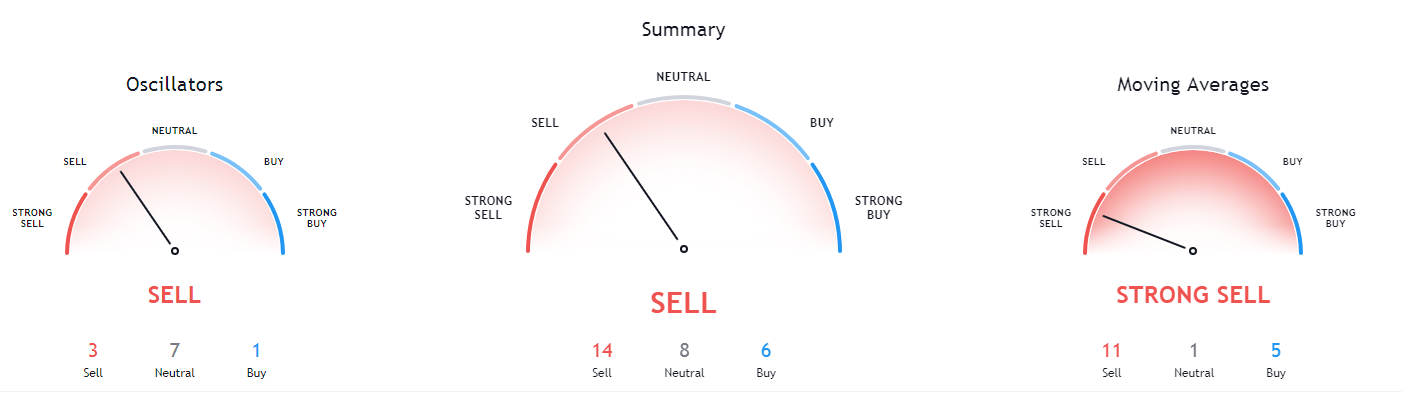
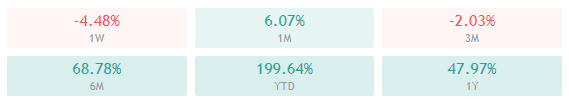
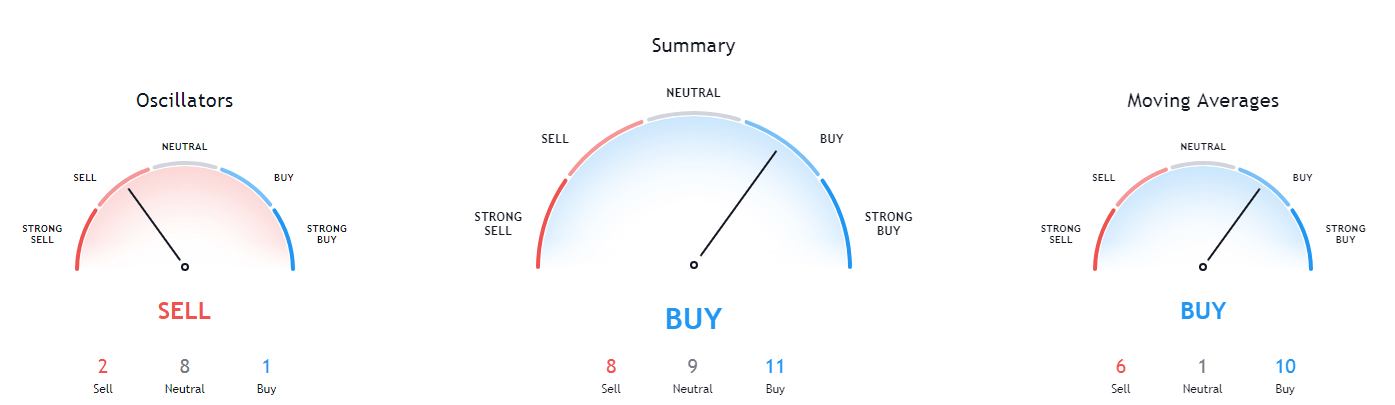
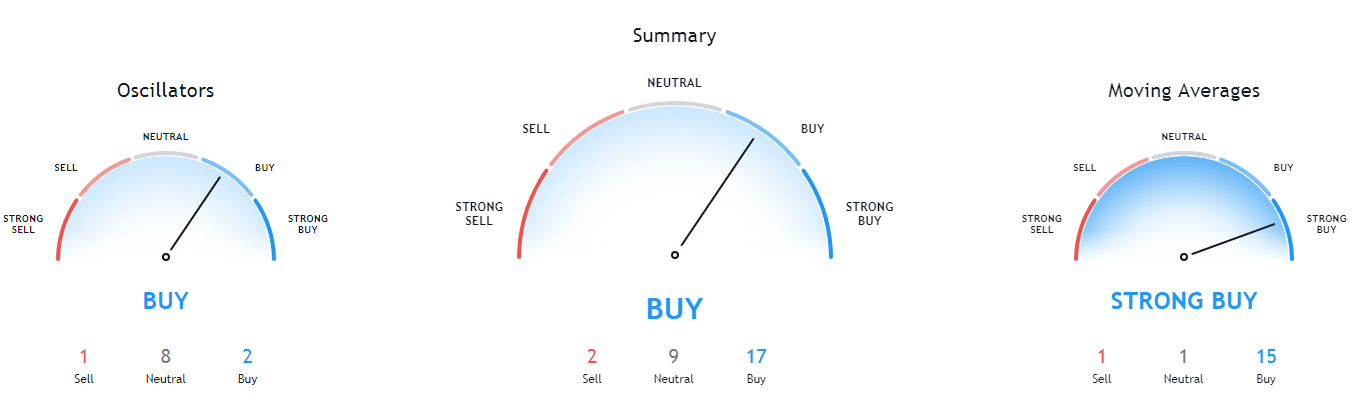
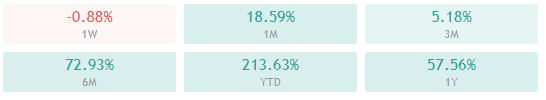
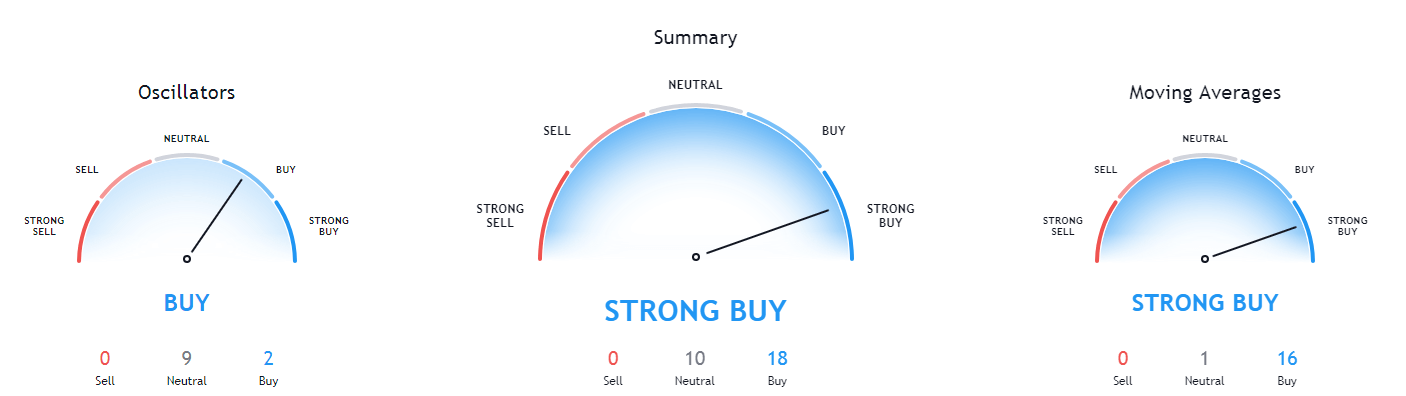
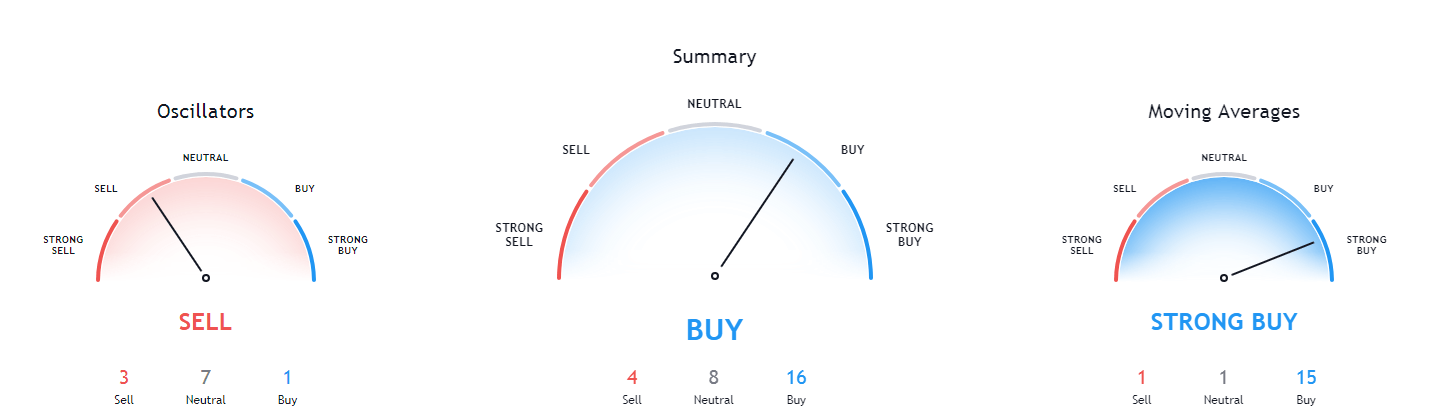
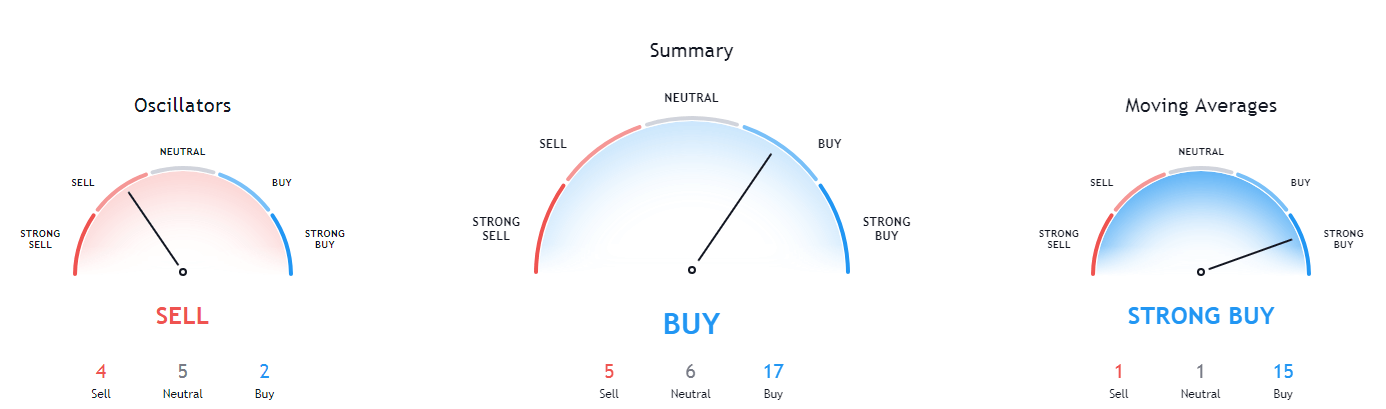
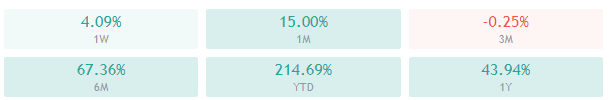
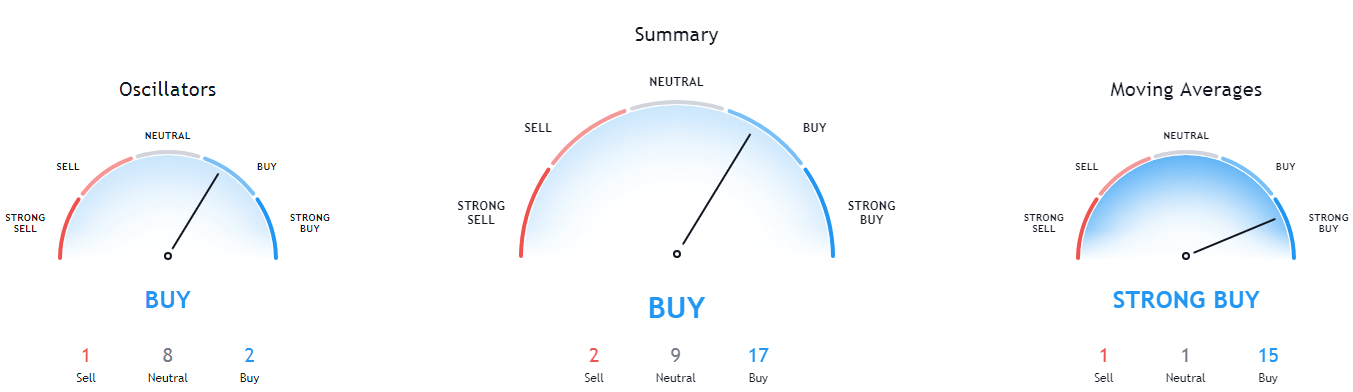
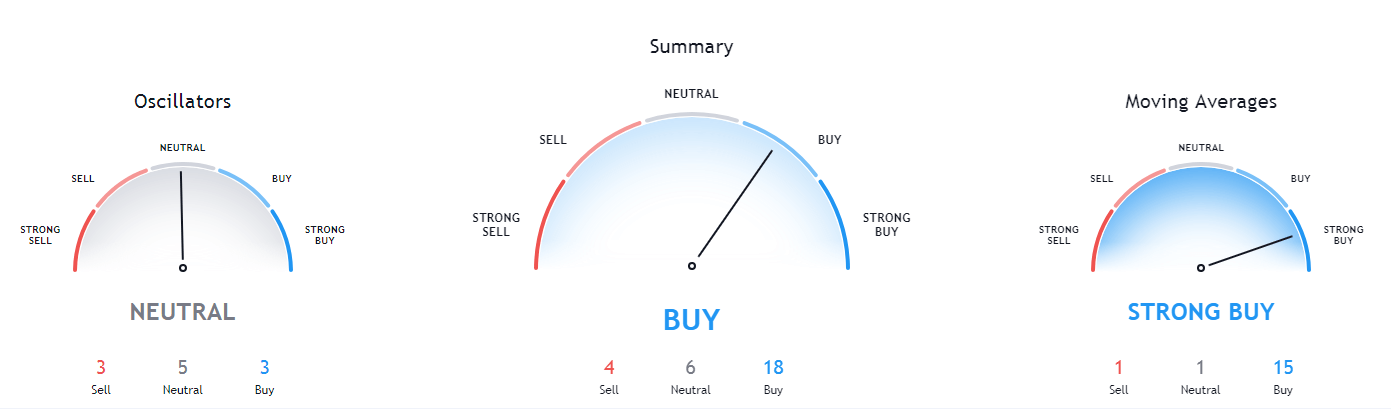
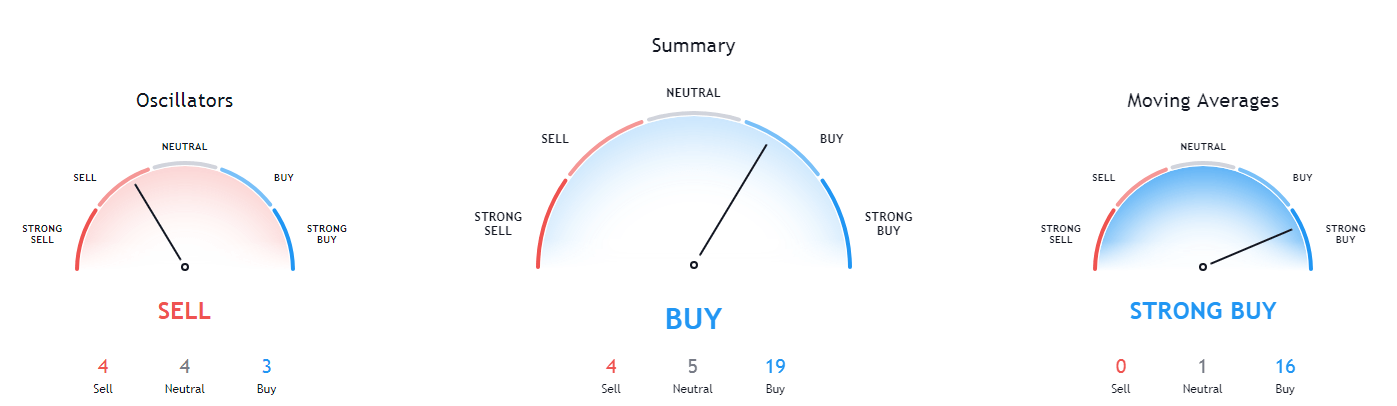
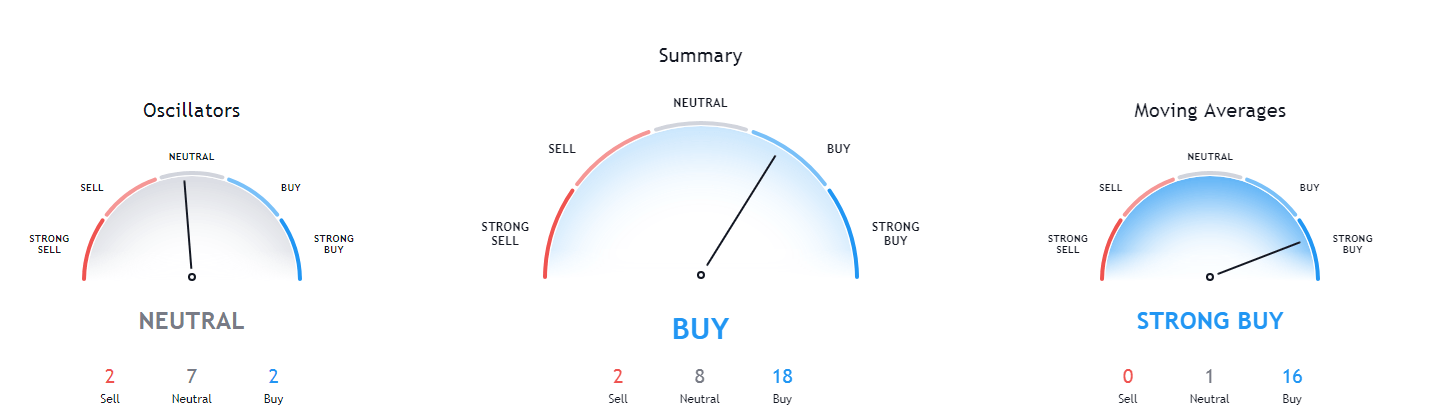
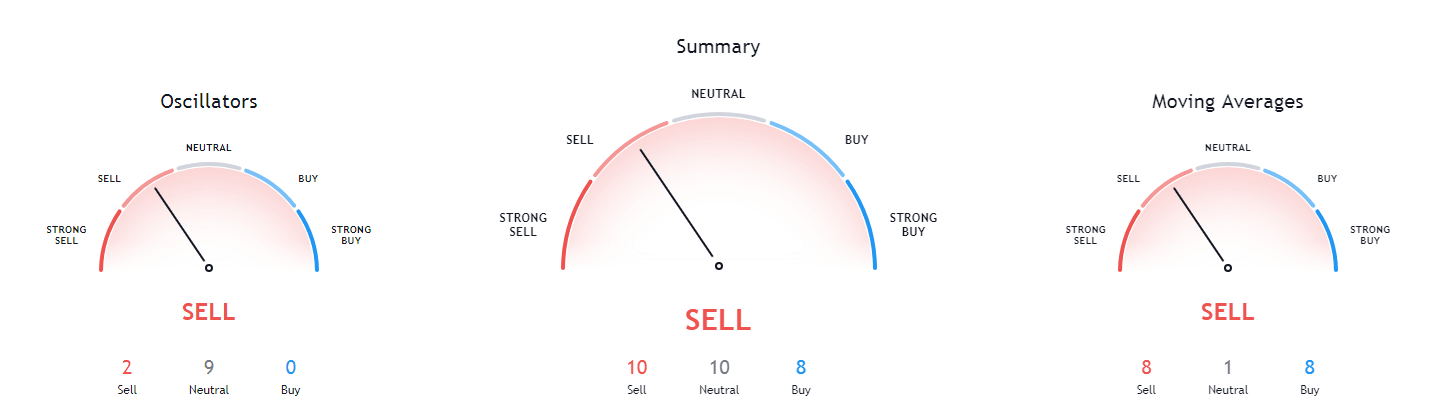
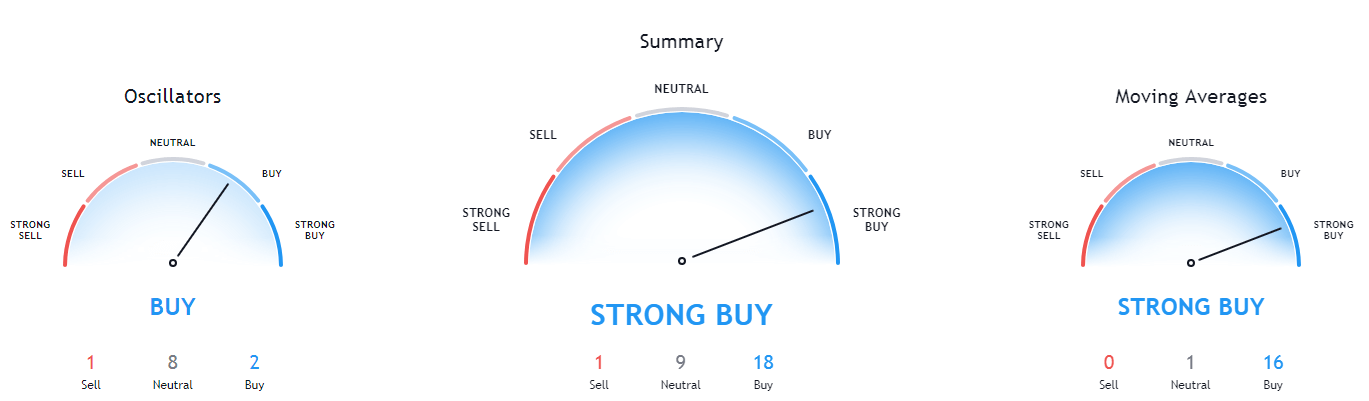
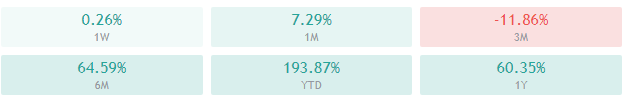
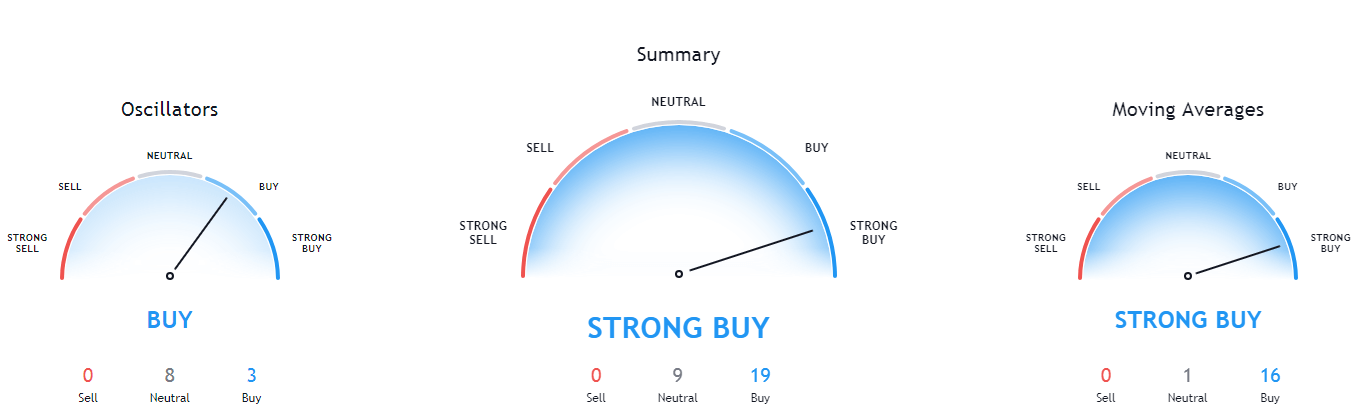
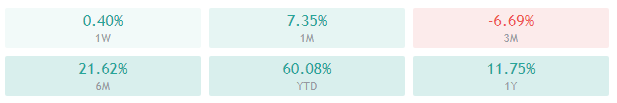
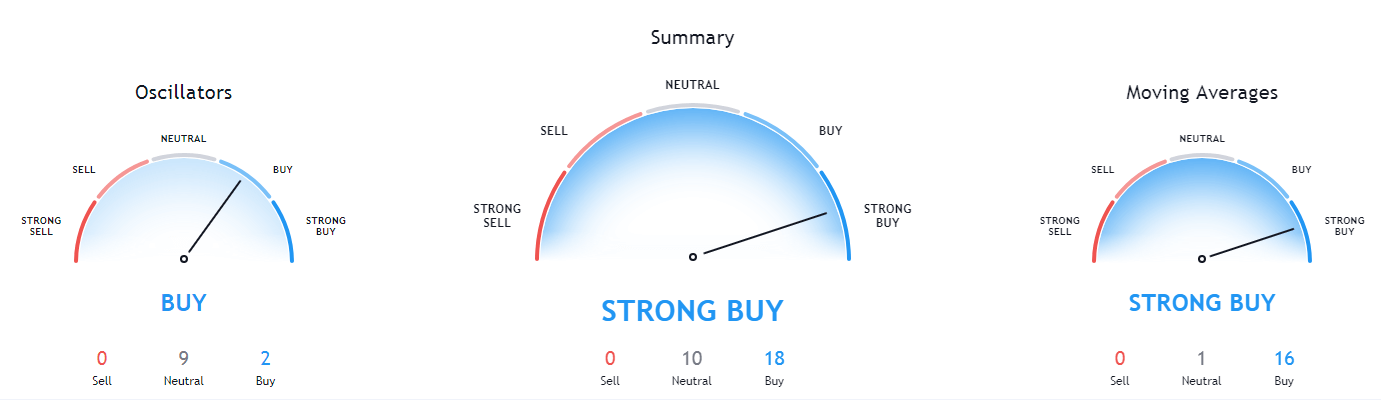
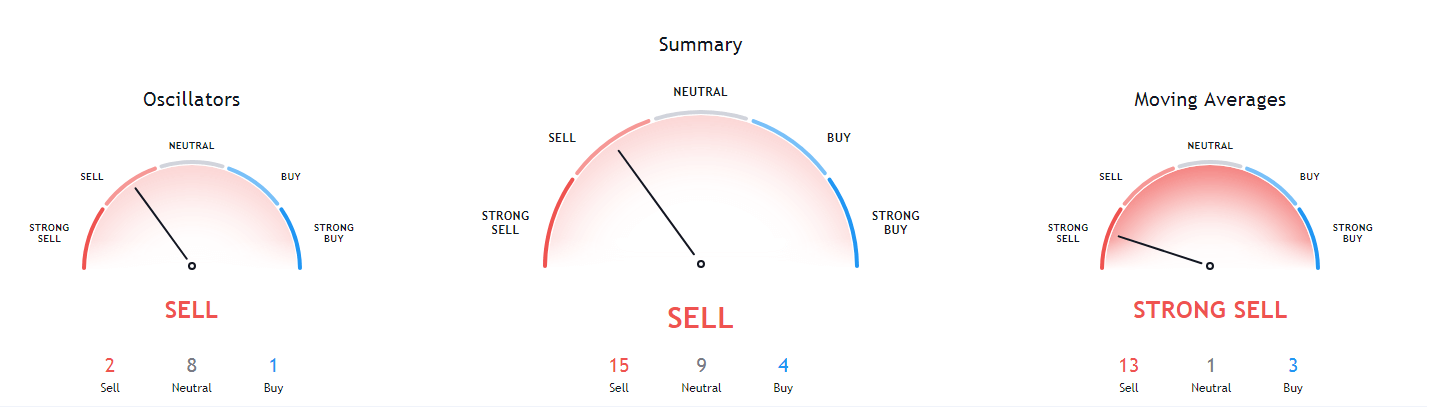
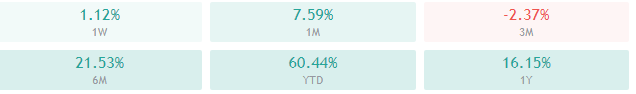
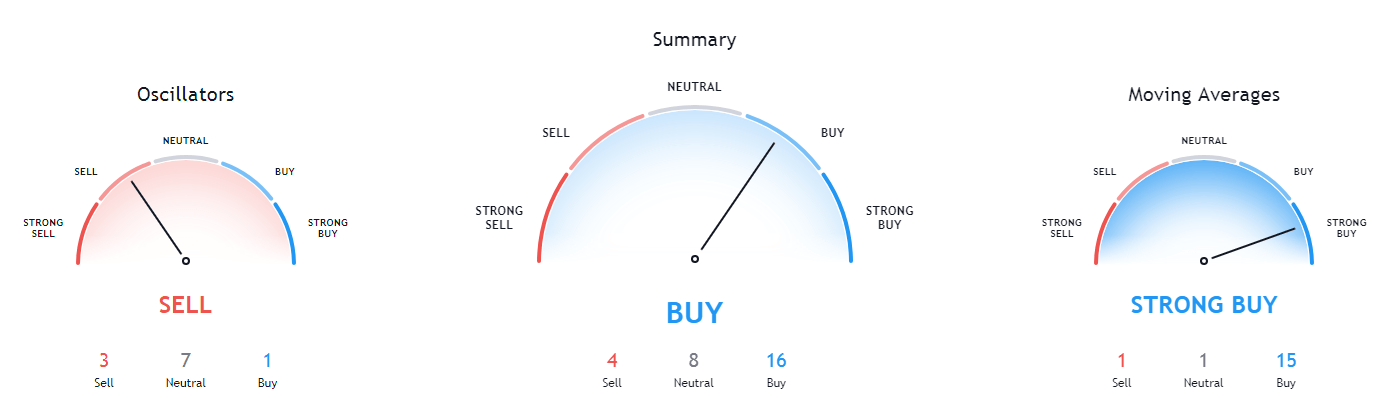
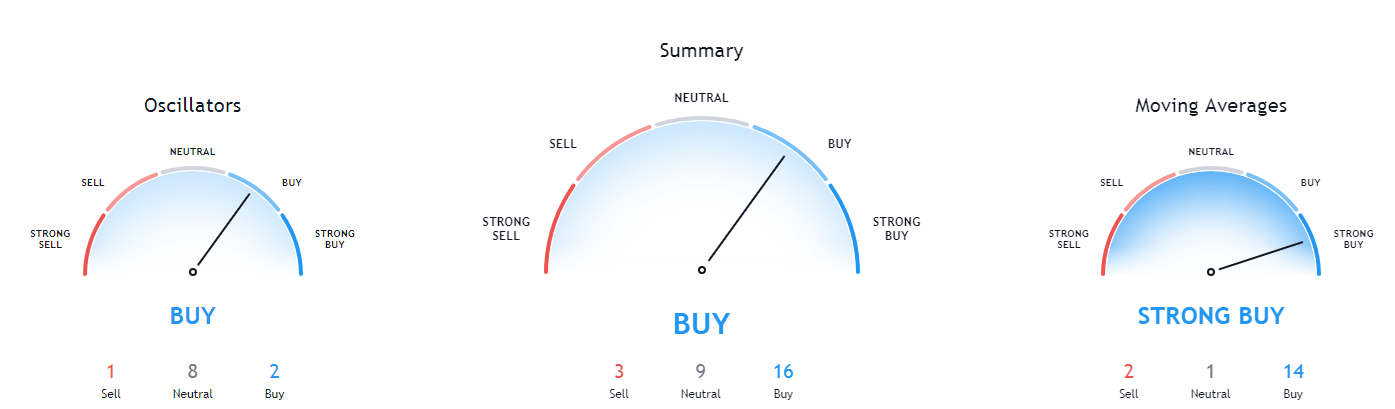
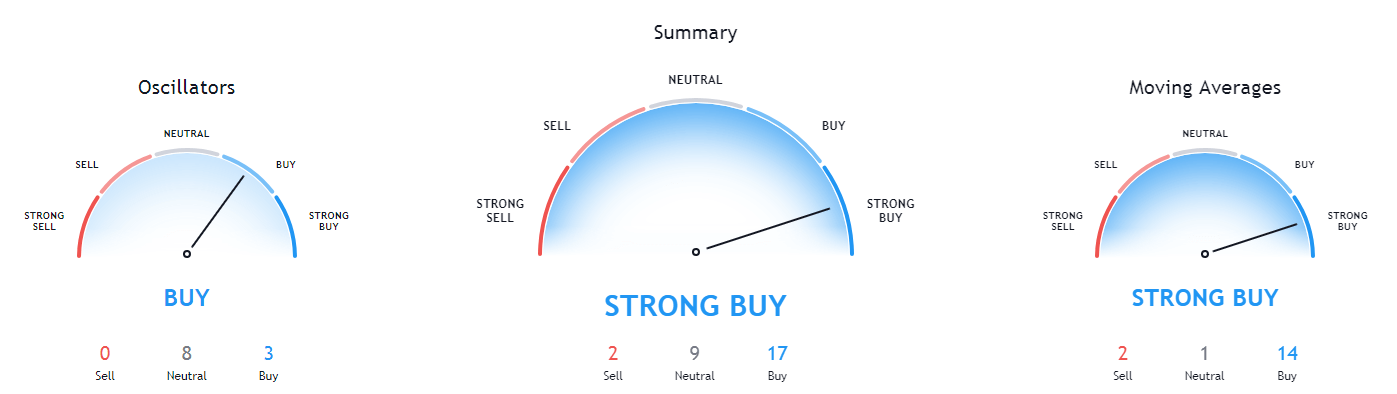
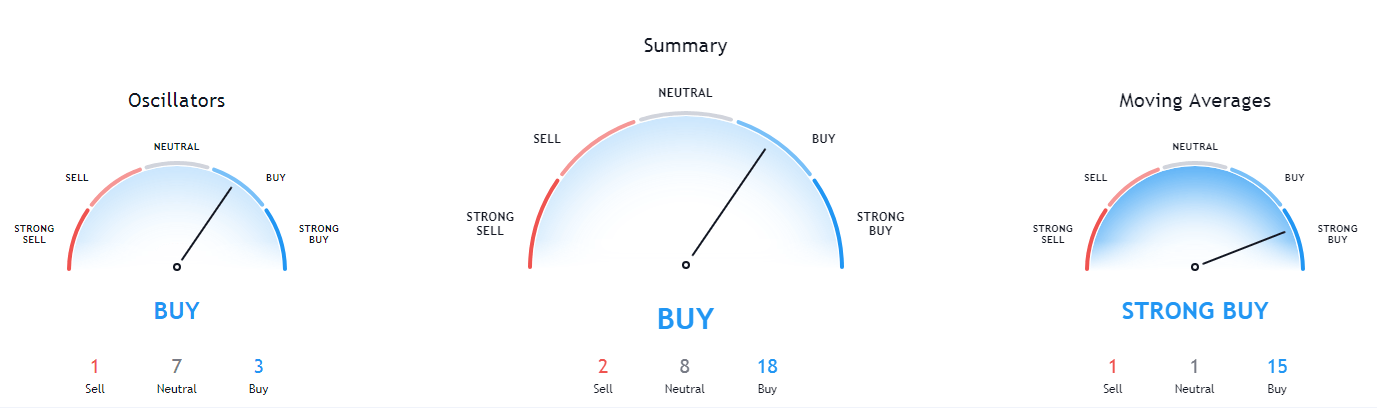
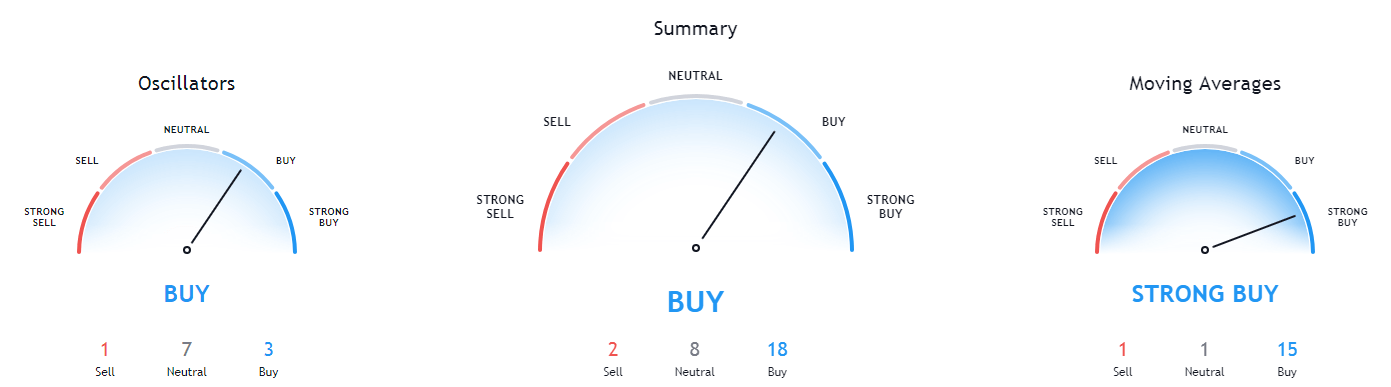
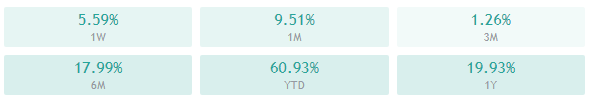
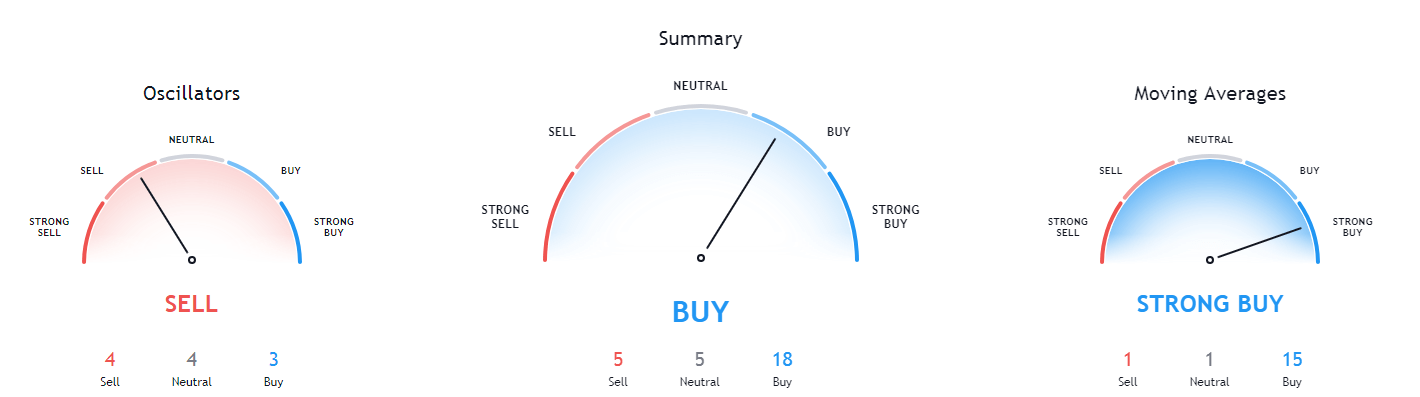
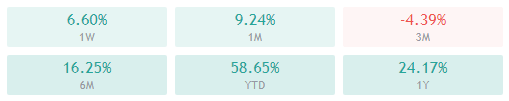
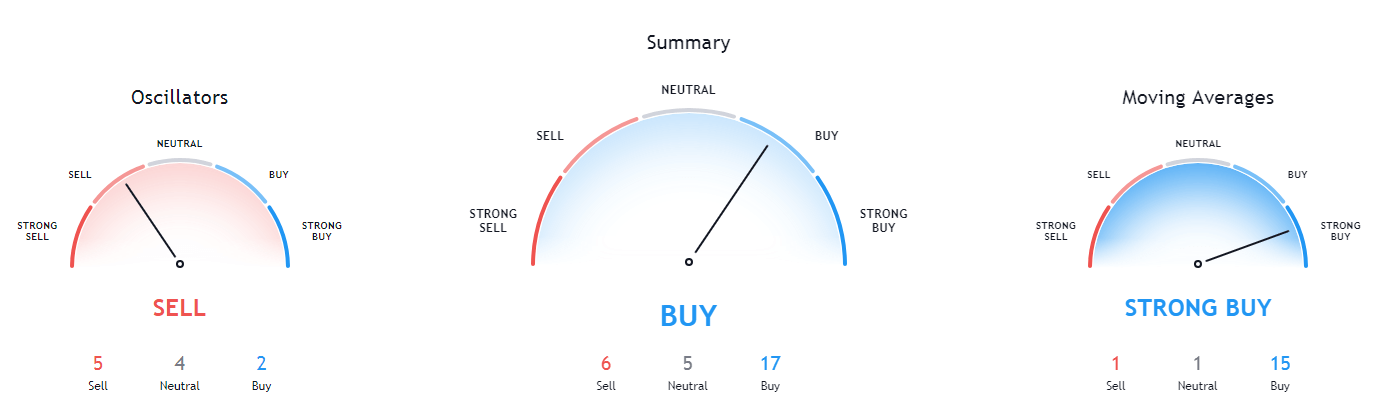
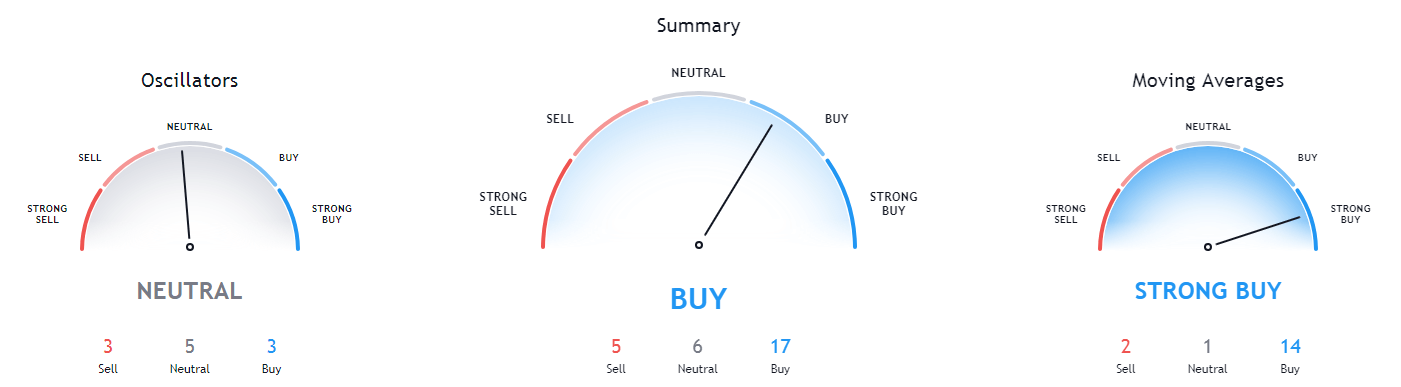
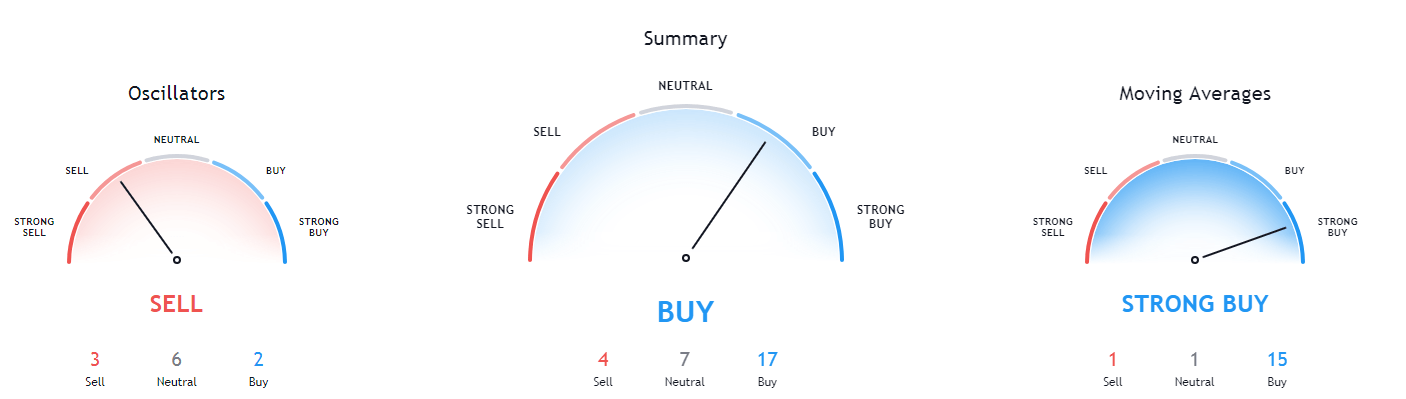
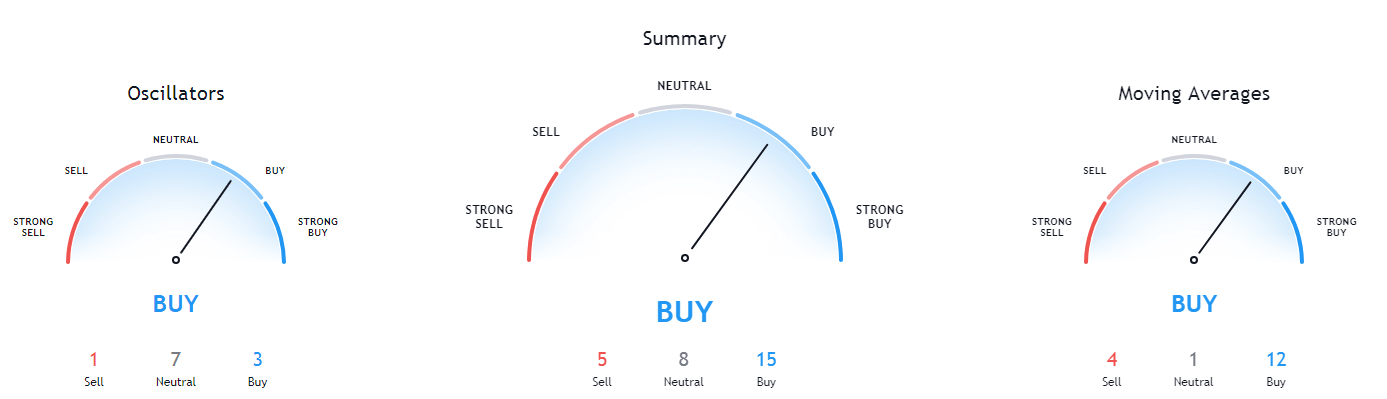
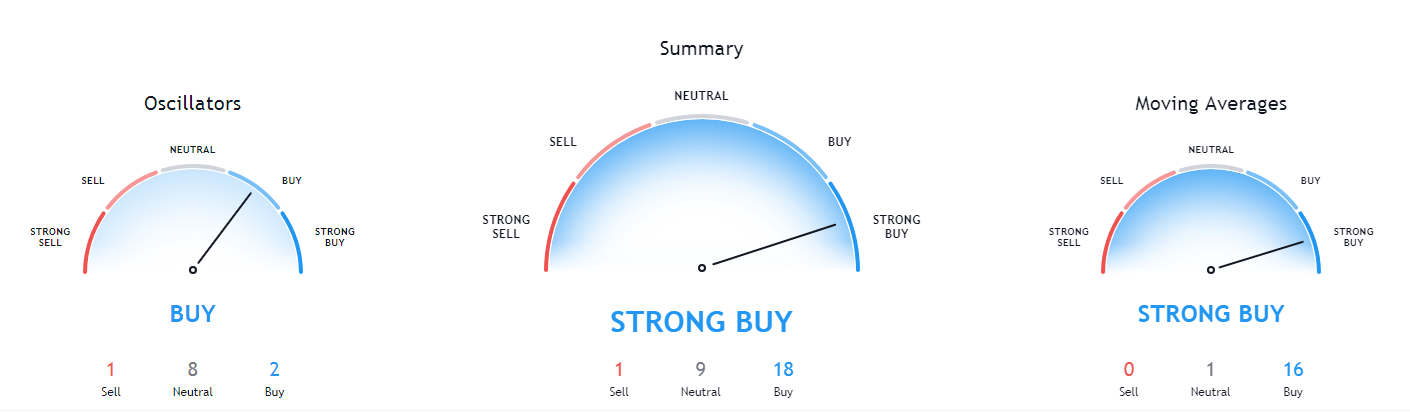
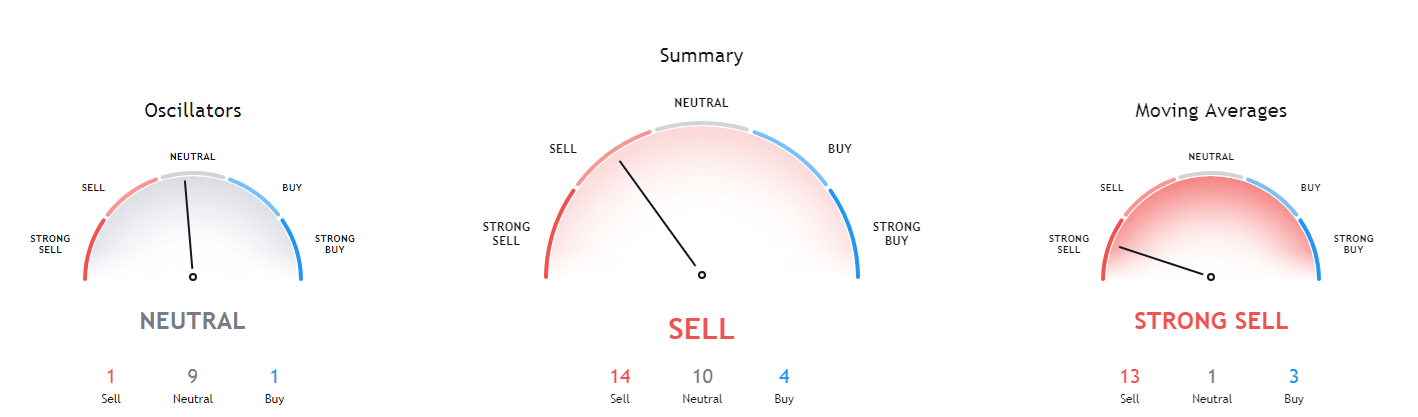
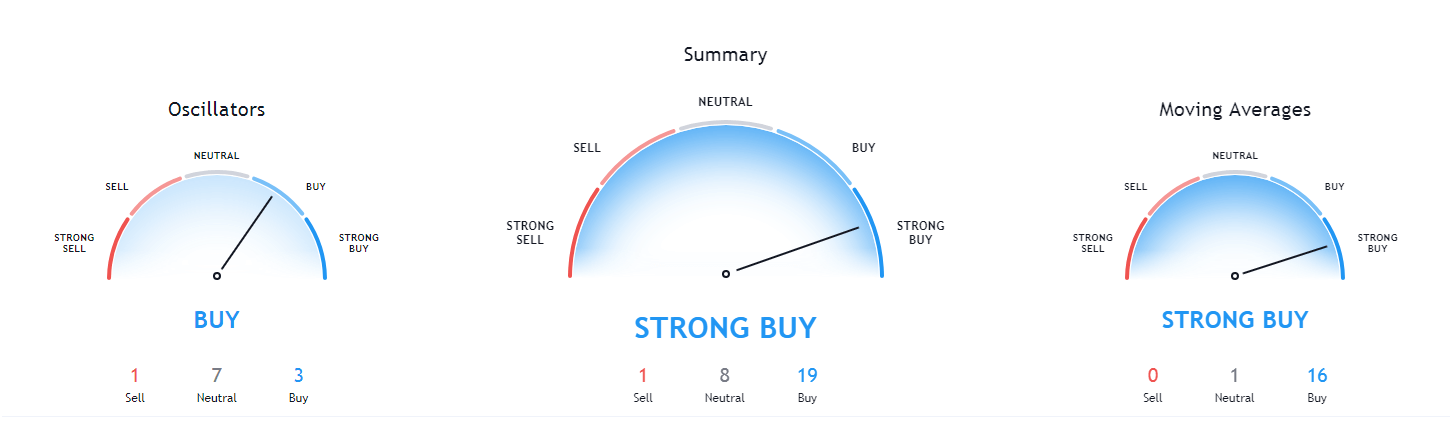
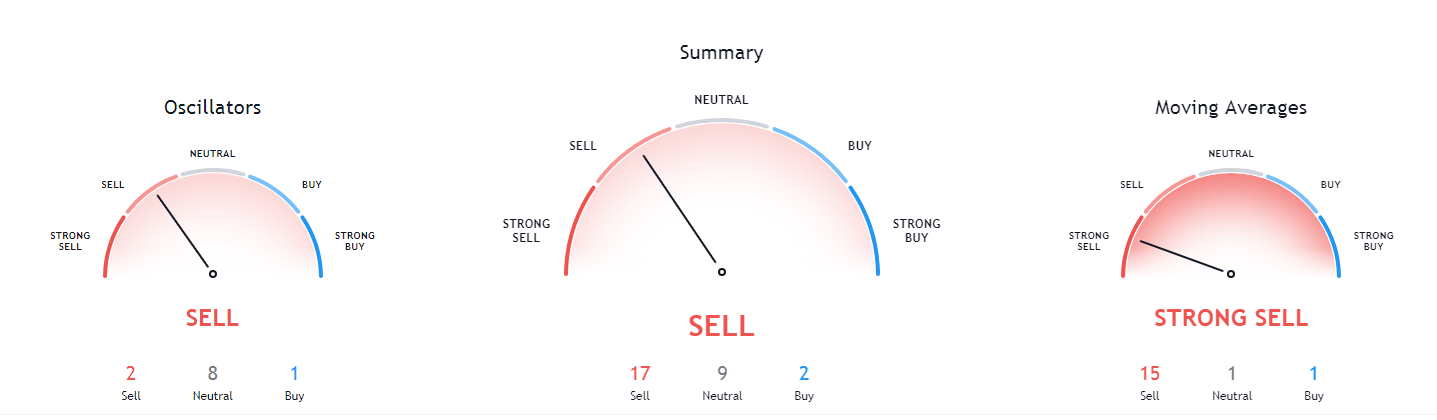
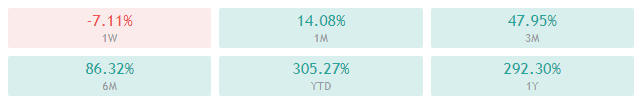
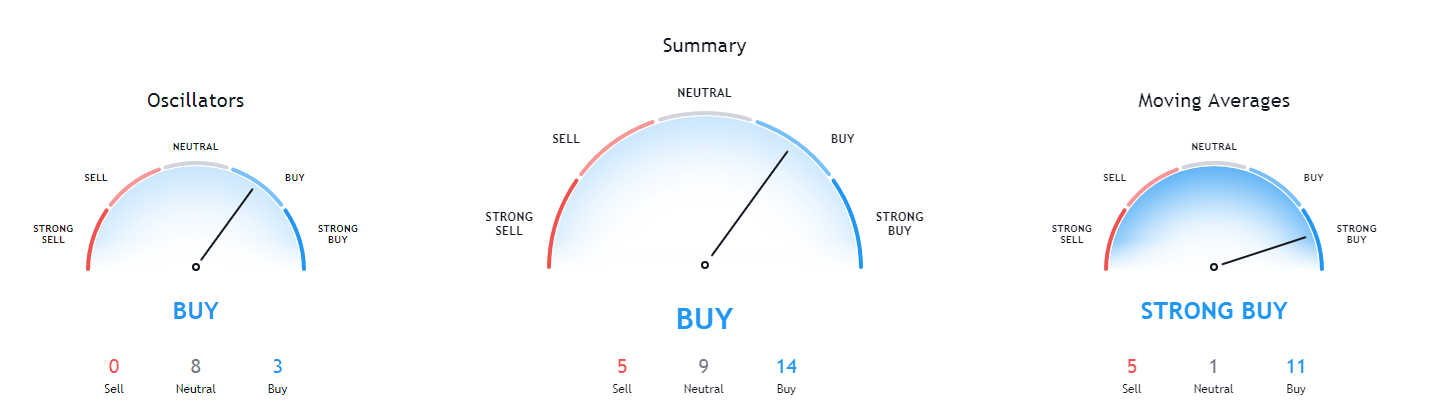
Bitcoin’s daily and weekly technicals are tilted towards the buy-side and show no signs of neutrality. On the other hand, its monthly technicals show some signs of neutrality, while its 4-hour technicals are completely bearish.

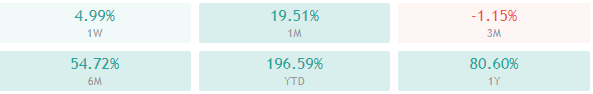
BTC/USD 1-day Technicals
Technical factors (1-hour Chart):
- Price is far below its 50-period EMA and at its 21-period EMA
- Price is at its middle Bollinger band
- RSI is neutral (44.33)
- Volume is average
Key levels to the upside Key levels to the downside
1: $17,450 1: $17,000
2: $17,850 2: $16,800
3: $18500 3: $16,350
Ethereum
Ethereum has experienced the same chain of events Bitcoin did in the past day or so. The downtrend ended up bringing Ethereum’s price back to as low as $480 before recovering. However, Ethereum’s ascending channel (yellow dotted) top line has stayed strong and triggered a mini-rally, which then brought the price above the red ascending line as well. Ethereum is now consolidating at around $515.
Ethereum’s current fundamental outlook is very bullish, but (as we said in our previous articles) any sharp move to the downside triggered by Bitcoin will affect Ethereum in a major way as well. This makes trading up hard, as one needs to constantly check Bitcoin’s price as well.
ETH/USD 1-hour Chart
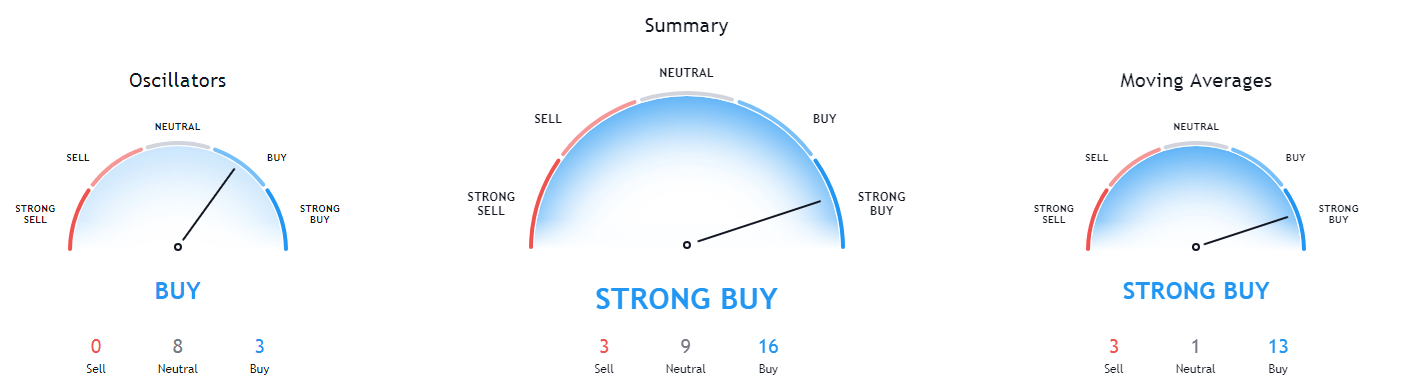
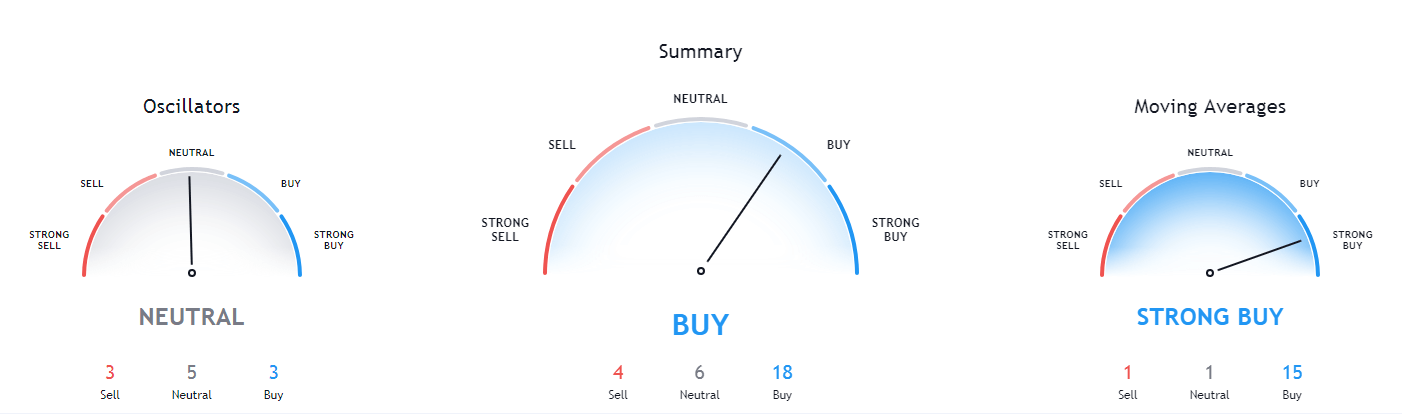
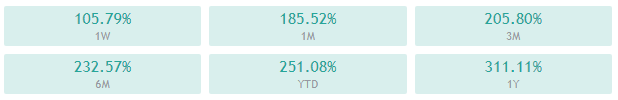
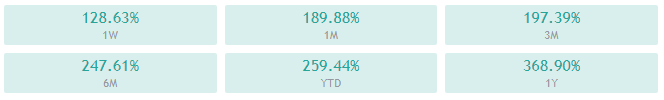
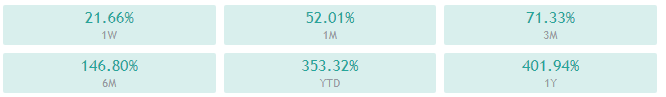
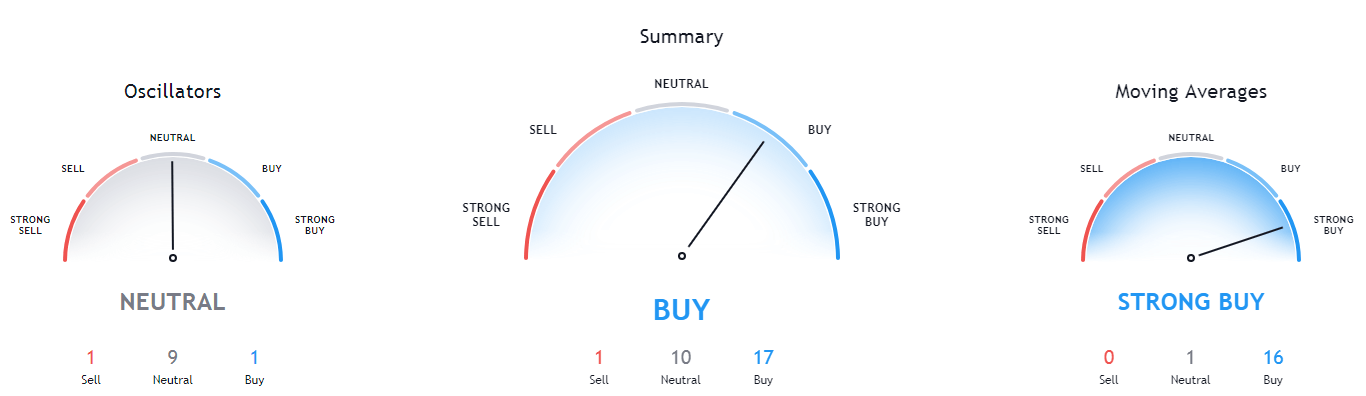
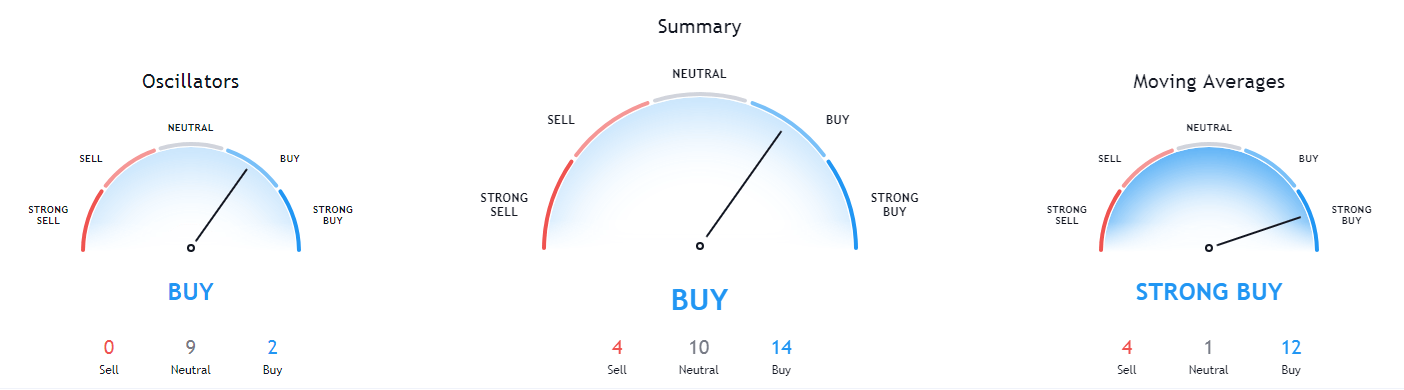
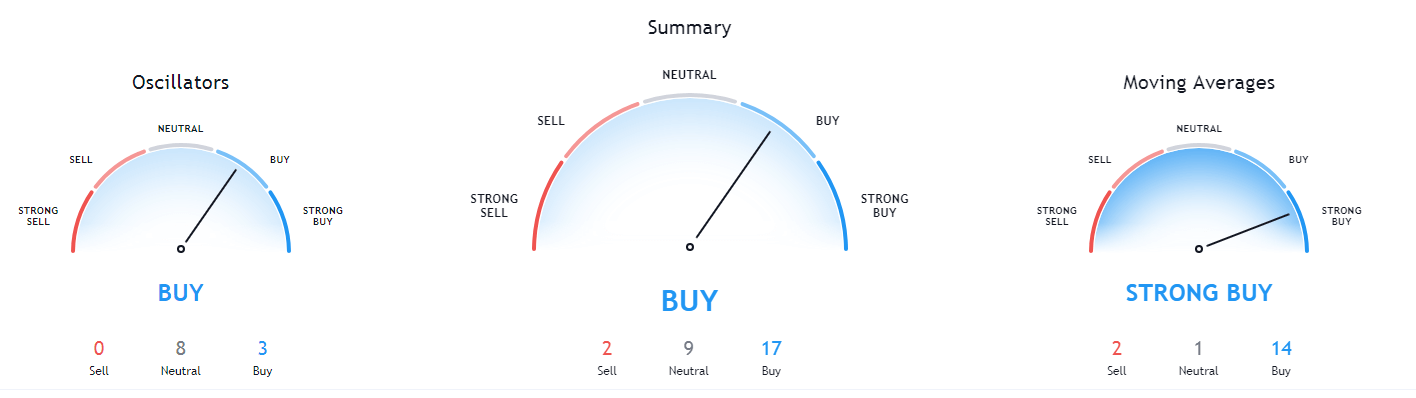
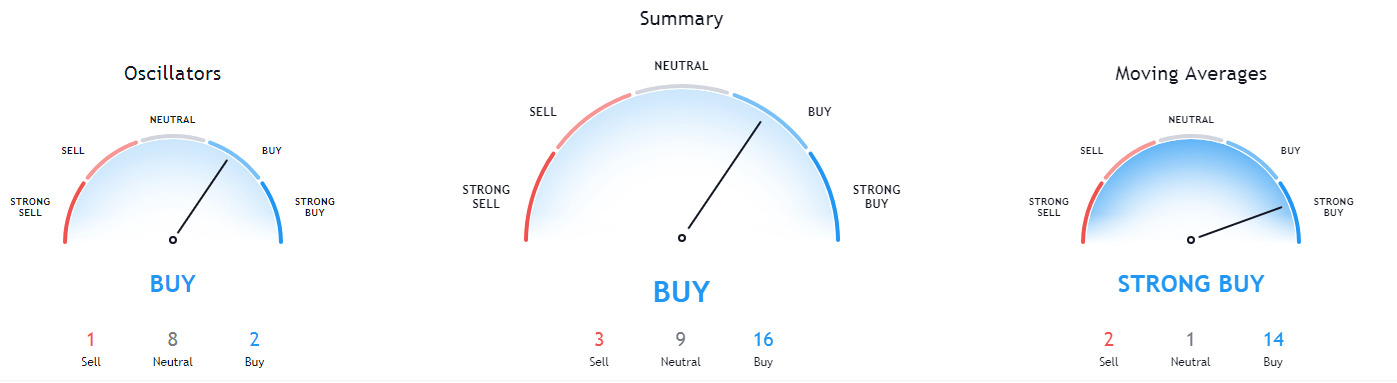
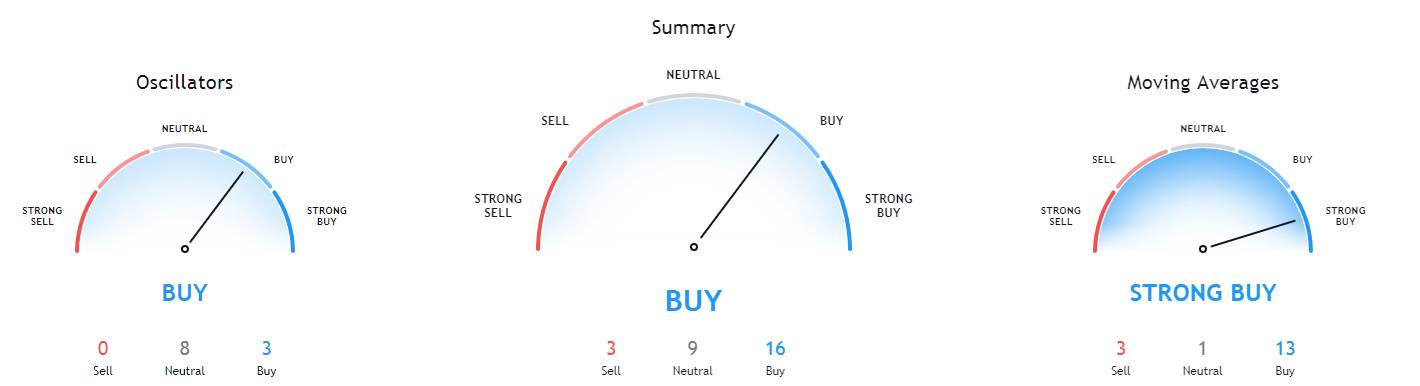
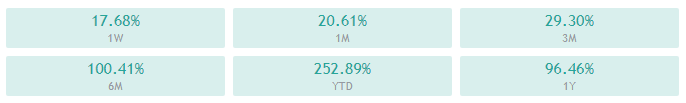
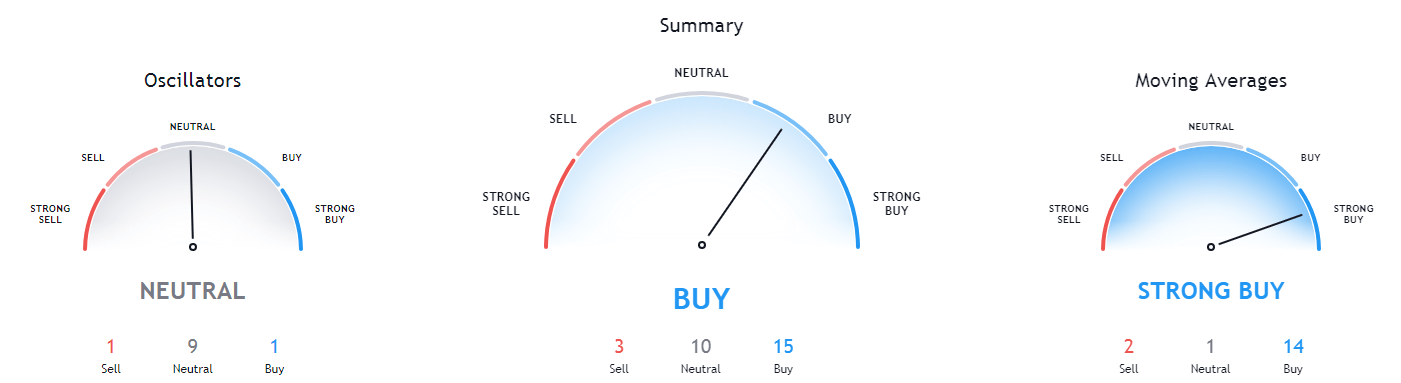
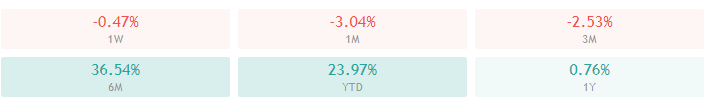
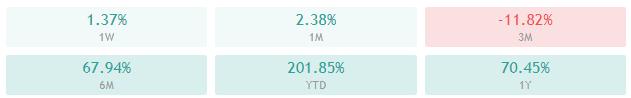
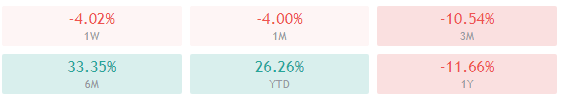
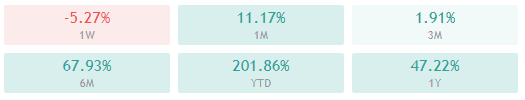
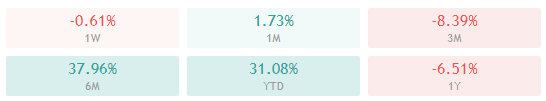
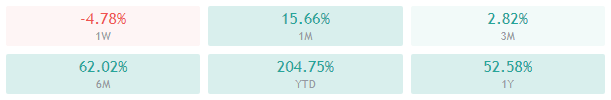
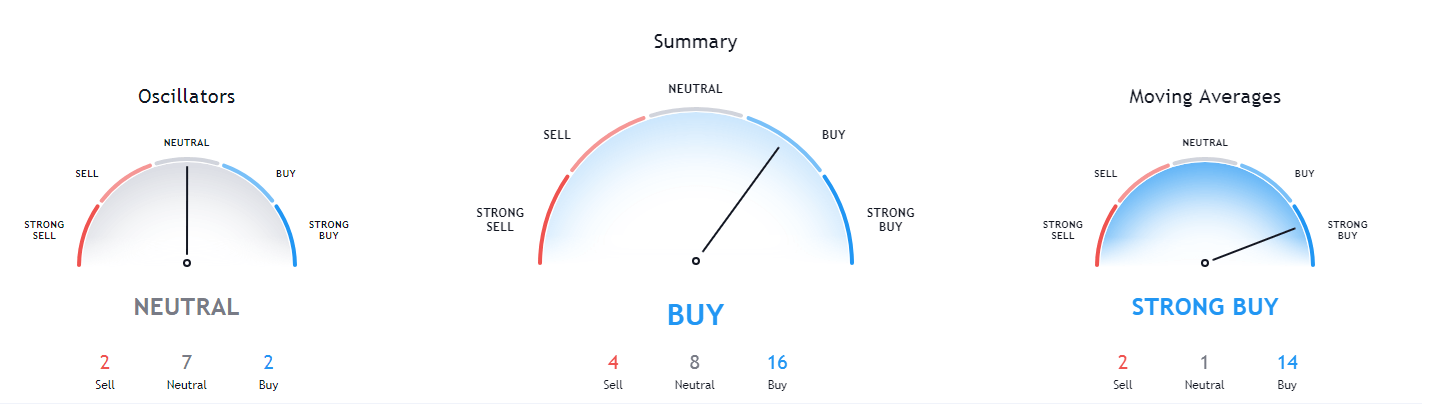
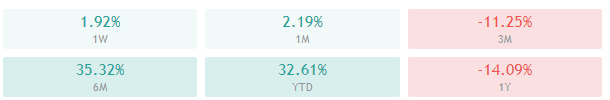
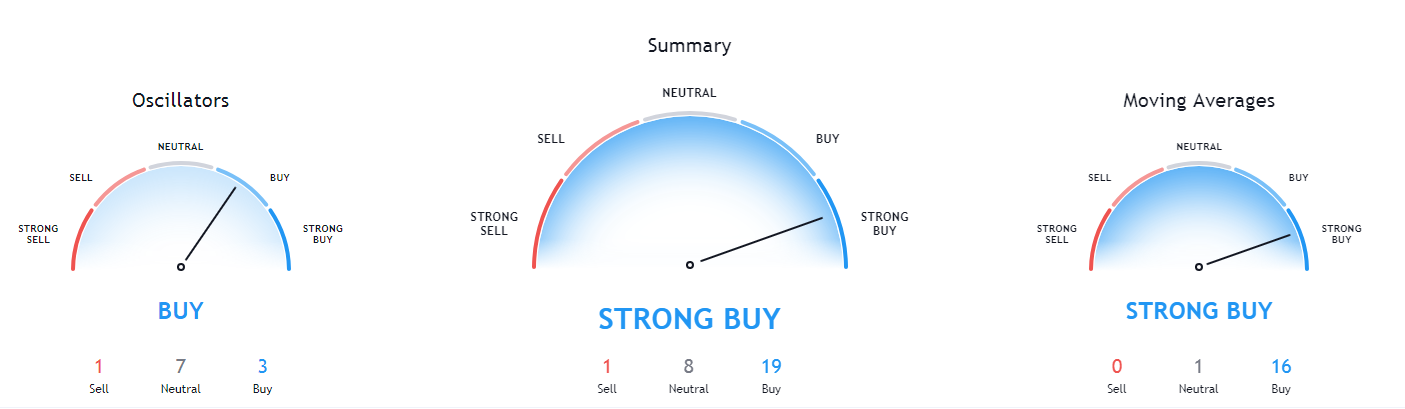
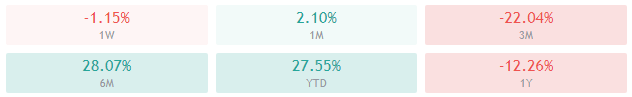
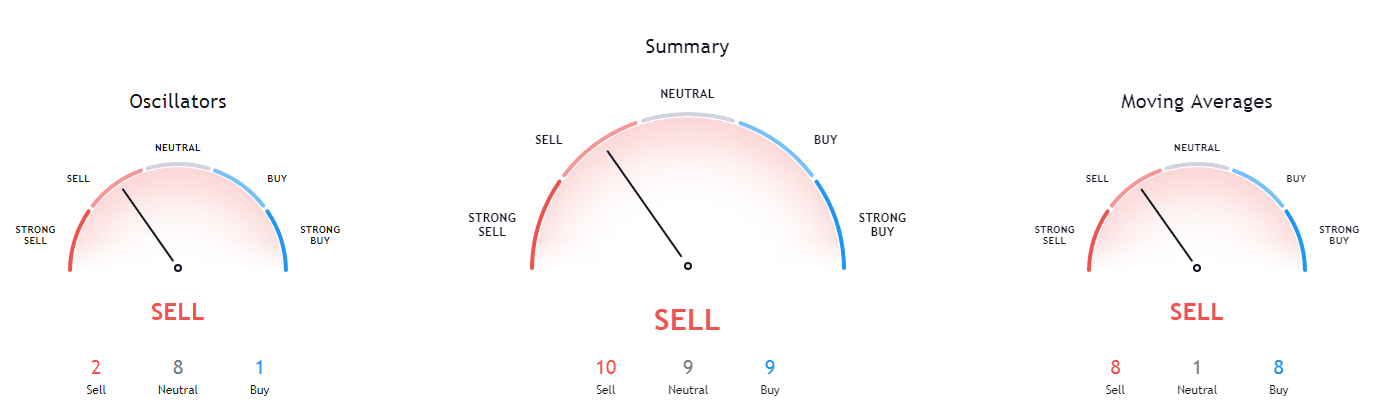
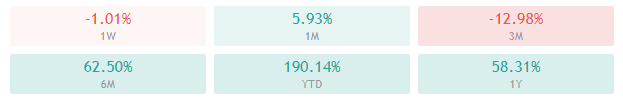
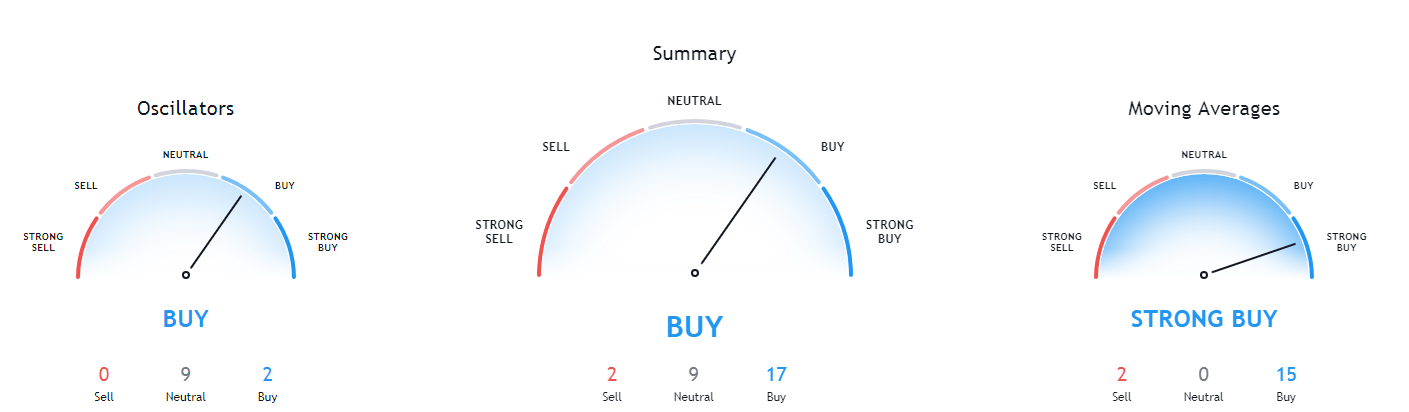
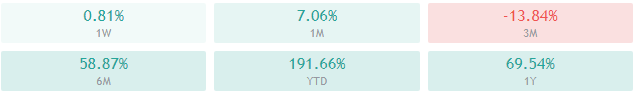
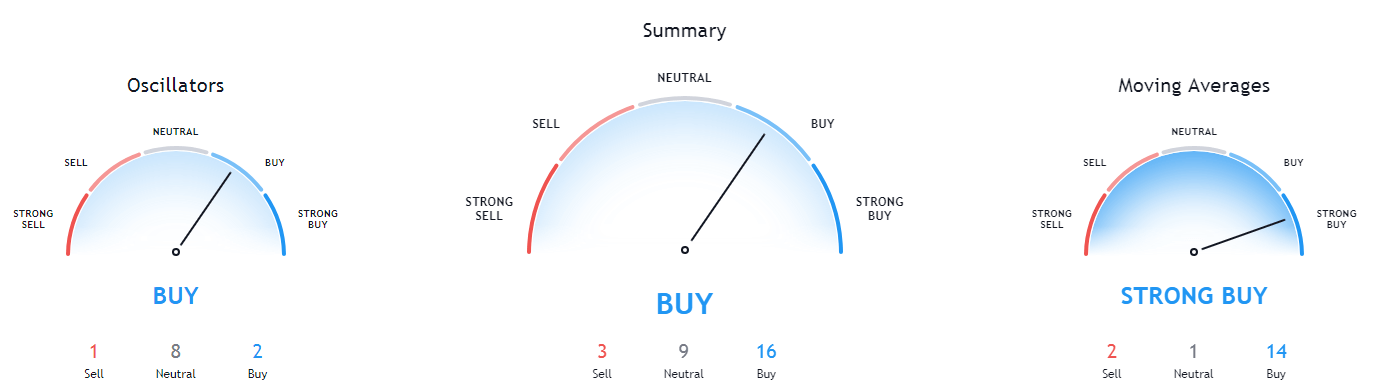
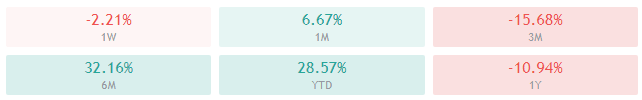
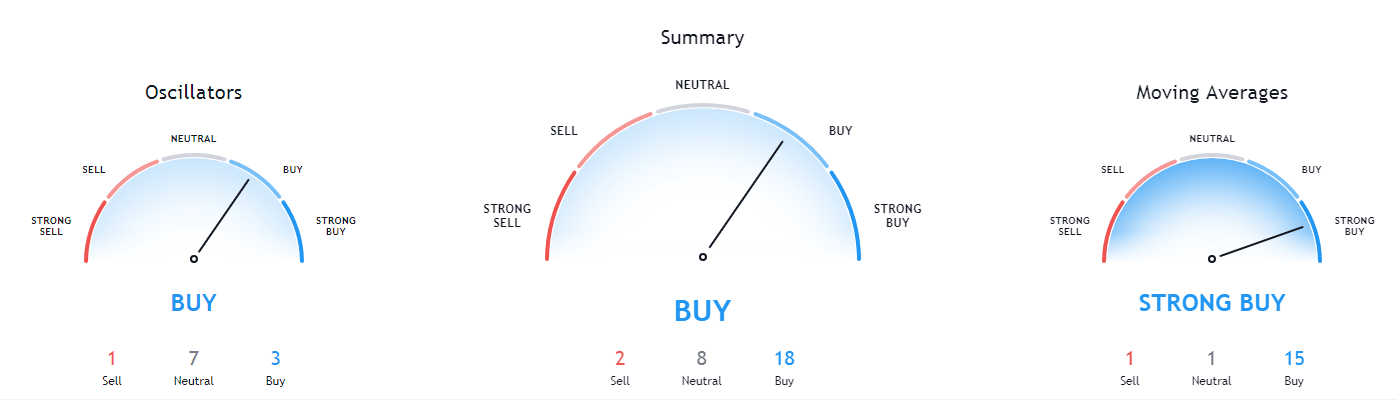
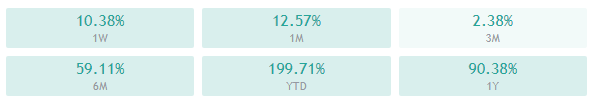
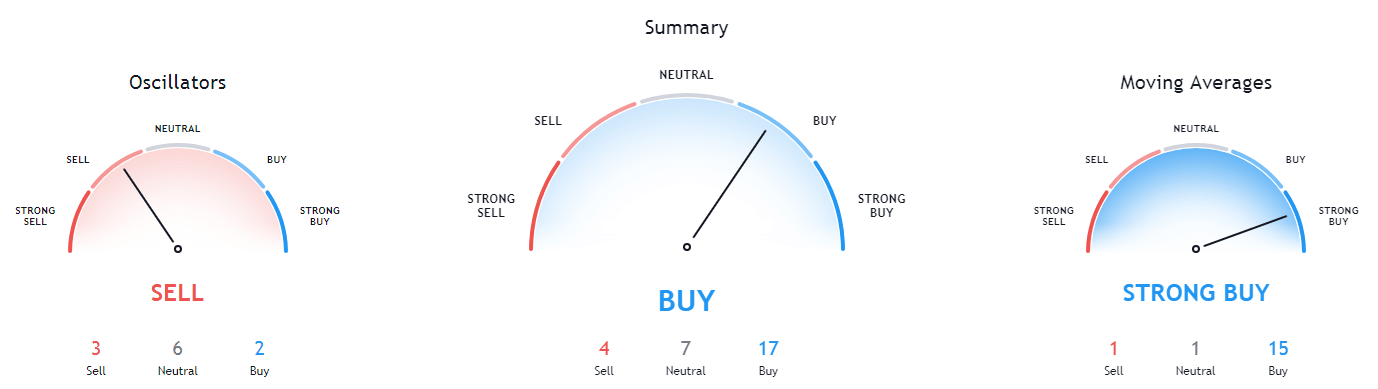
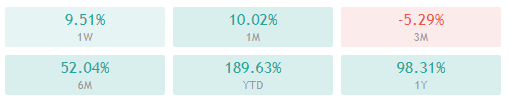
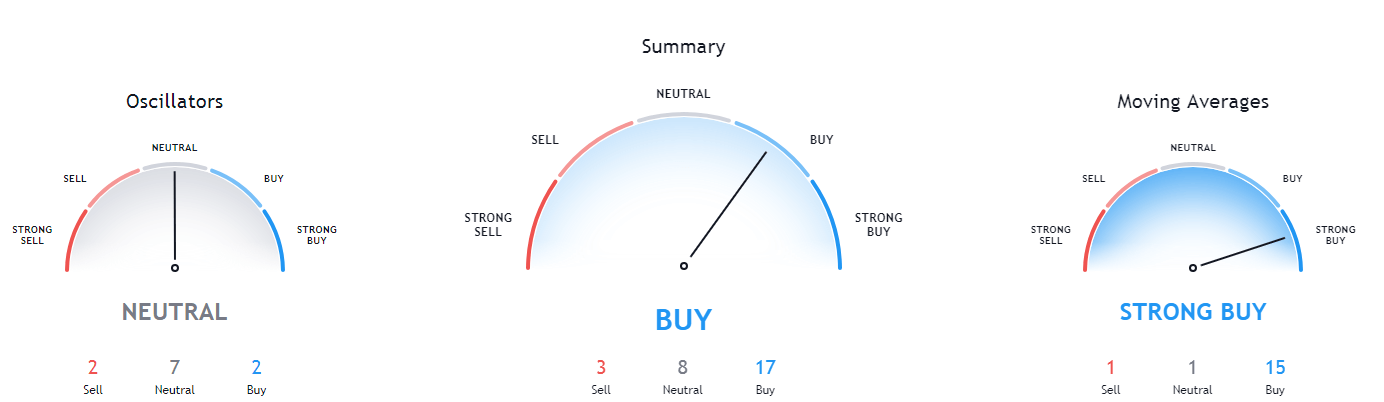
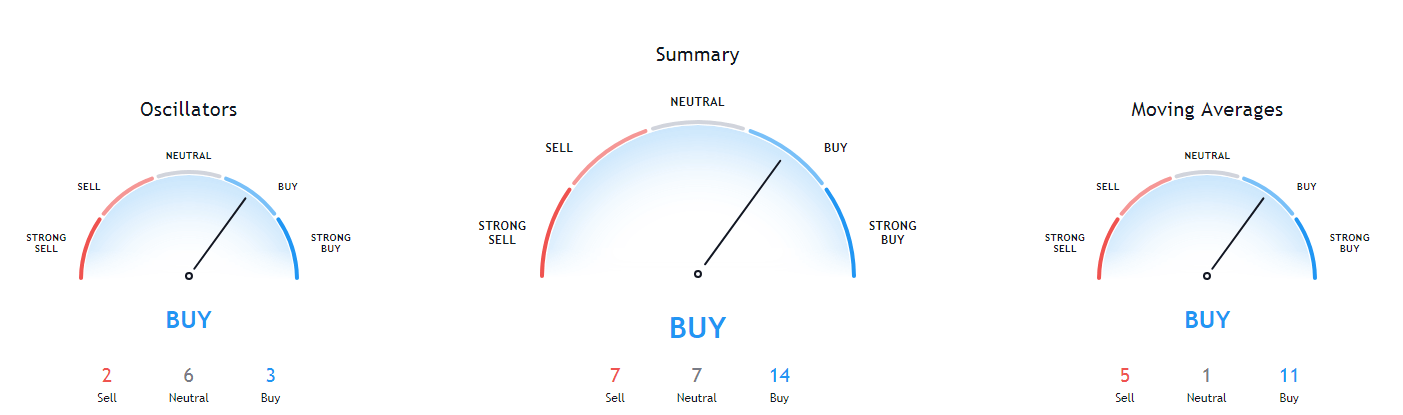
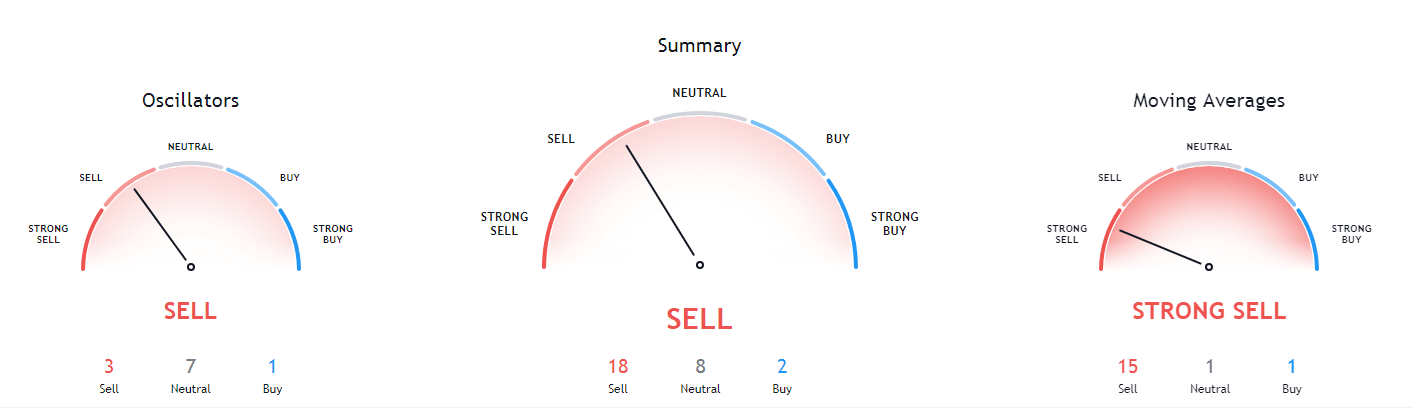
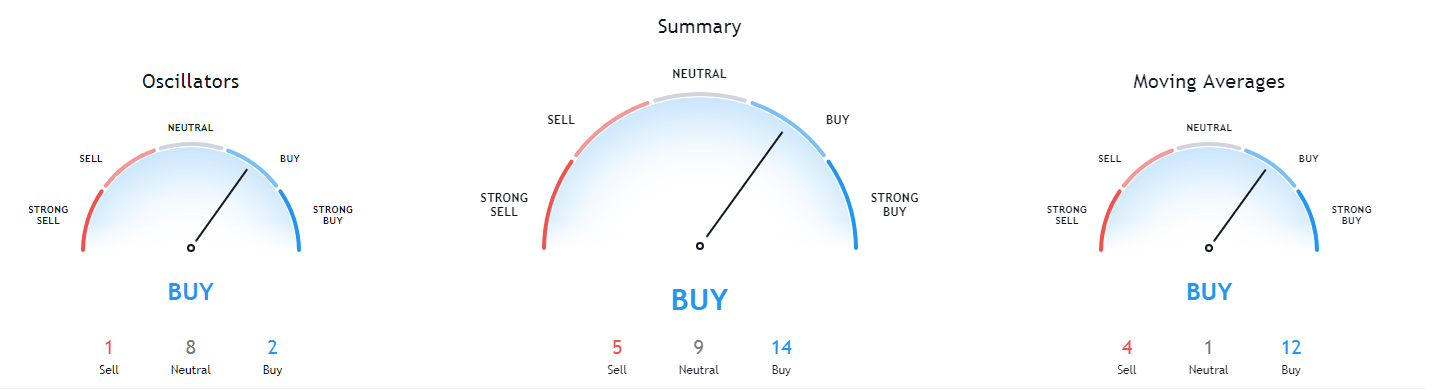
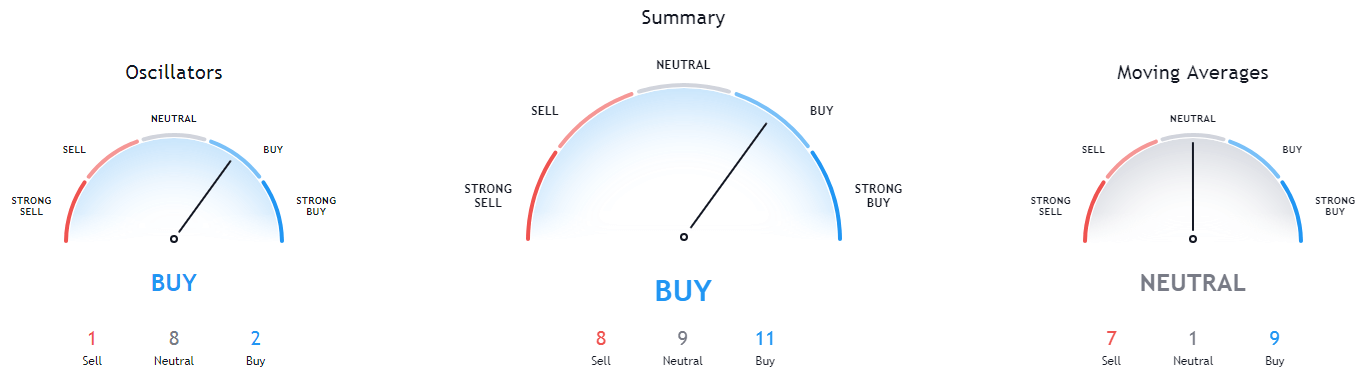
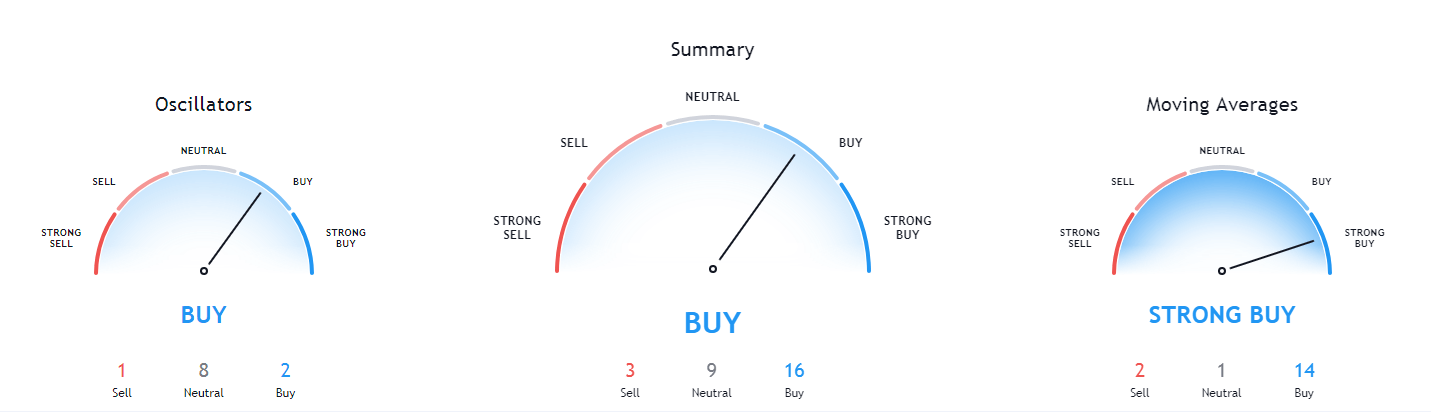
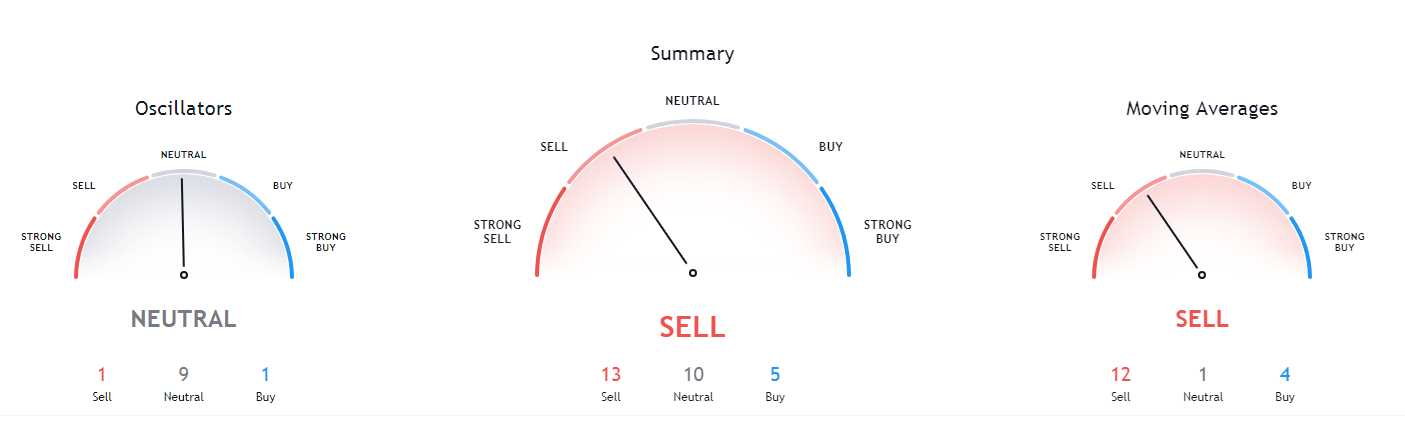
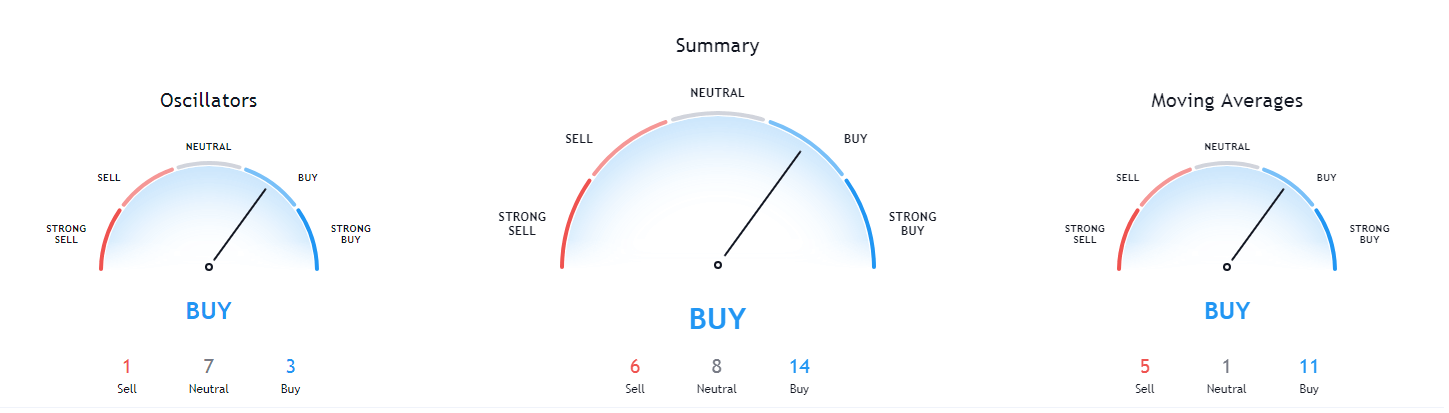
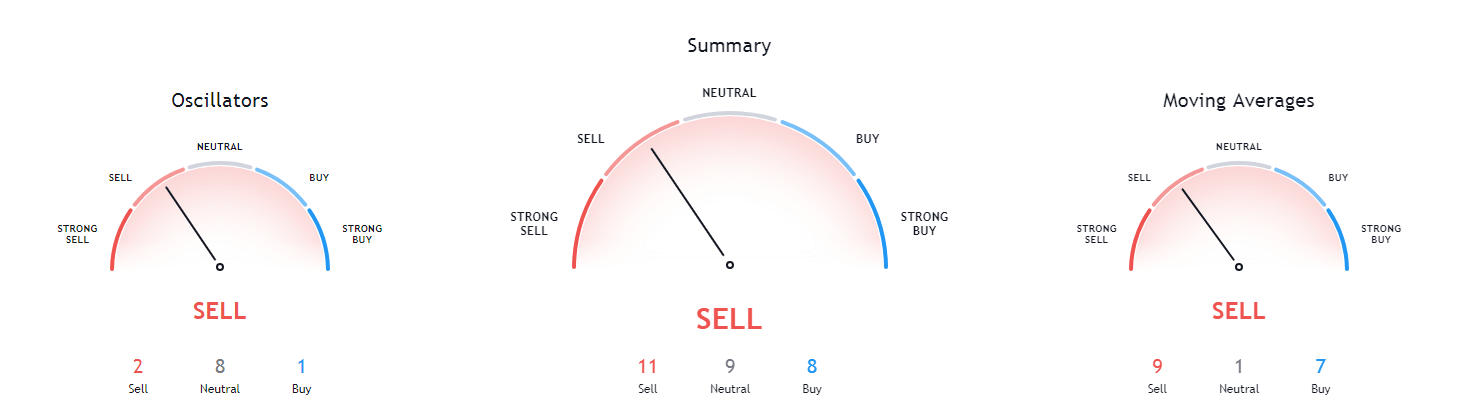
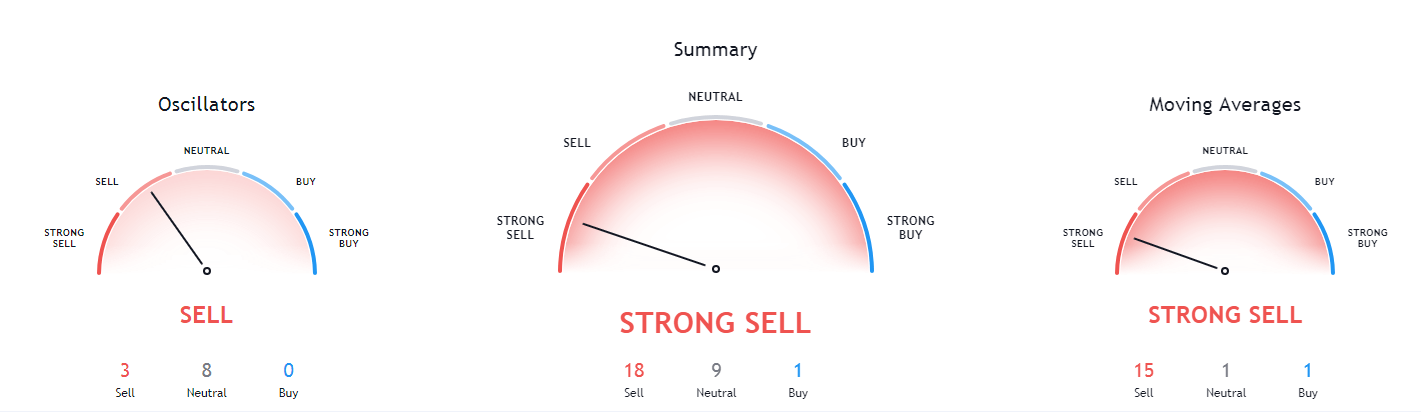
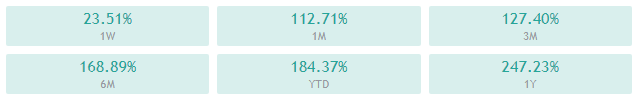
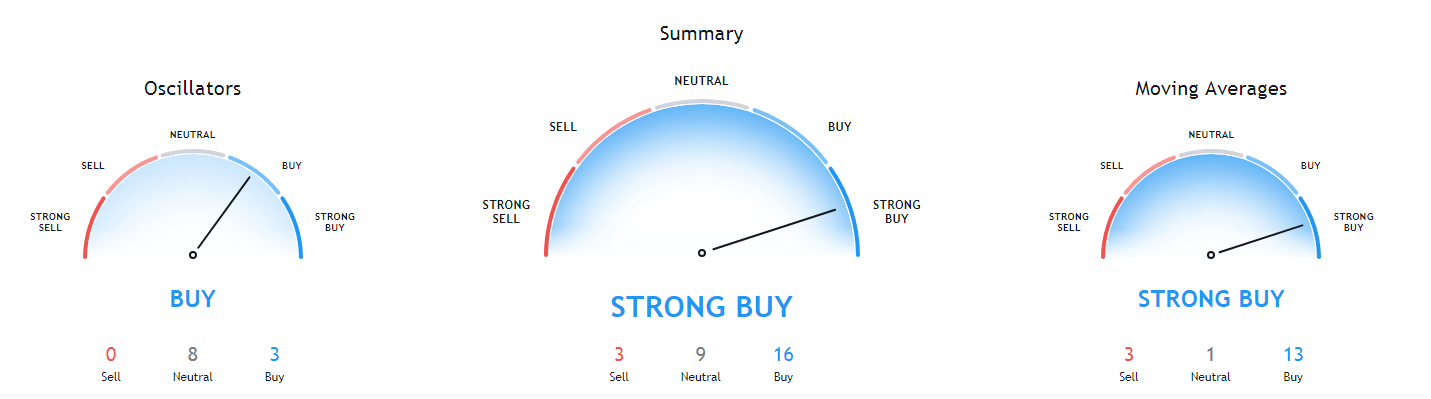
Ethereum’s daily, weekly, and monthly technicals are completely bullish and show no or just slight neutrality signs. On the other hand, its sentiment seen in the 4-hour time-frame’s is completely bearish.
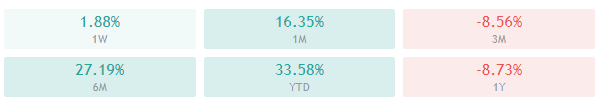
ETH/USD 1-day Technicals
Technical Factors (4-hour Chart):
- The price is far below its 50-period and at its 21-period EMA
- Price is at its middle Bollinger band
- RSI is neutral (44.53)
- Volume is average
Key levels to the upside Key levels to the downside
1: $600 1: $510
2: $630 2: $500
3: $735 3: $490
Ripple
The fourth-largest cryptocurrency by market cap has posted lower highs three times in a row, with its lows testing the $0.625 support level each time the price went down. However, the third time XRP went towards this level, Bitcoin’s push towards the downside triggered XRP bears, which took over the market. The downturn ended at the $0.475 level, which held up quite nicely. XRP is now trading in the middle of a range, bound by $0.475 to the downside and $0.625 to the upside.
Trading XRP may not be optimal at the moment as trading Bitcoin is both potentially more profitable and a bit more straightforward.
XRP/USD 1-hour Chart
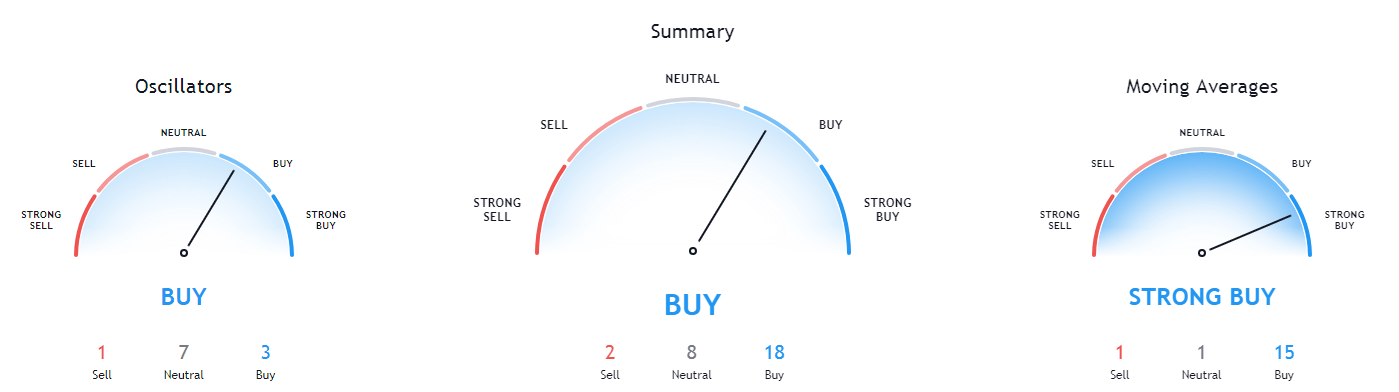
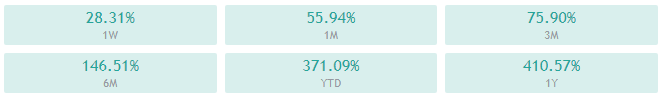
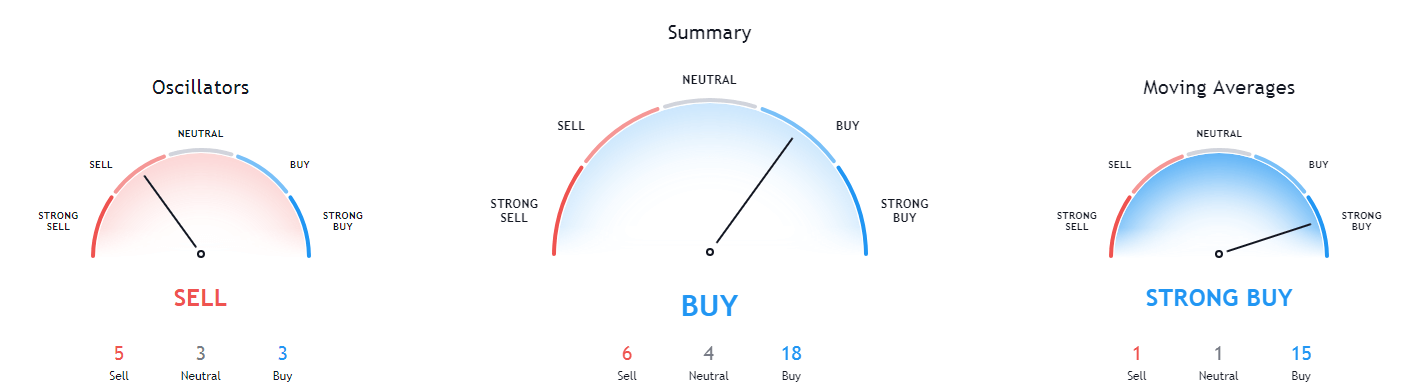
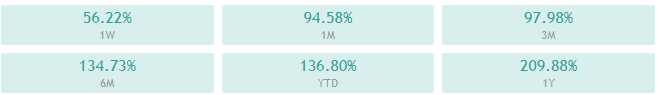
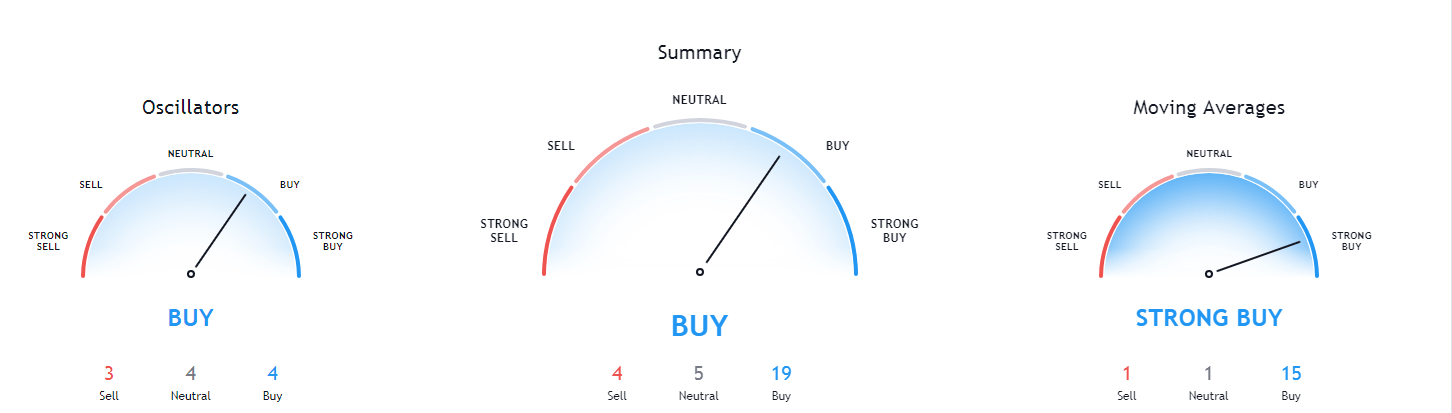
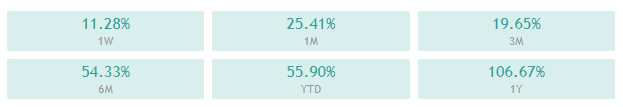
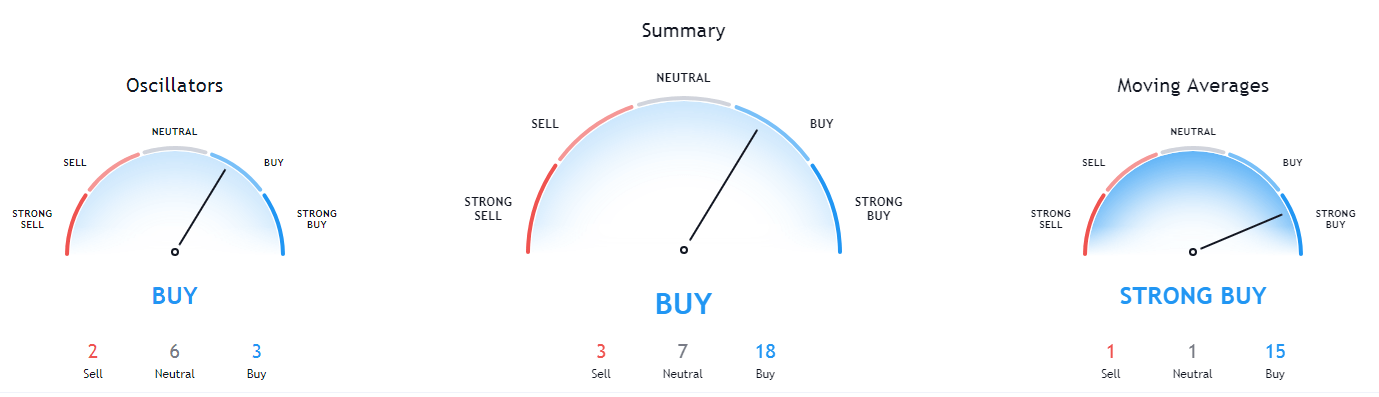
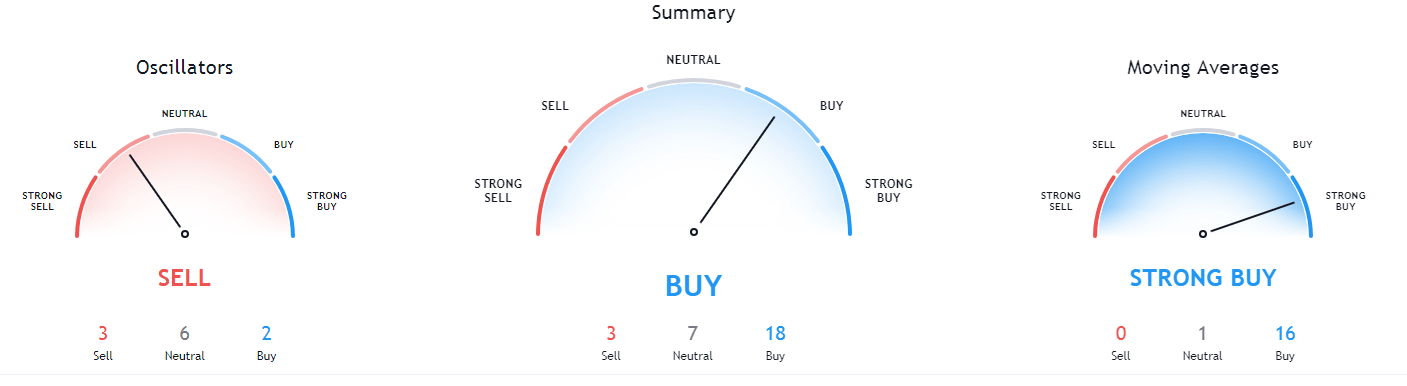
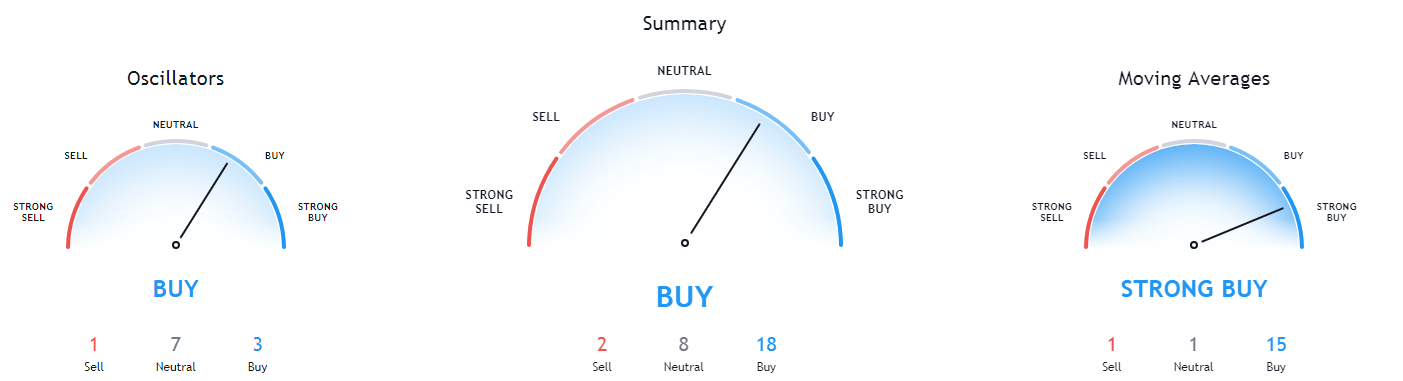
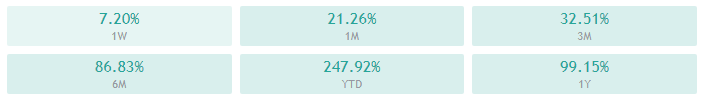
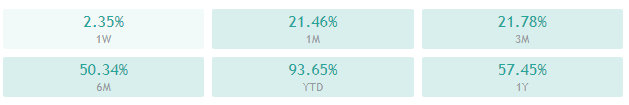
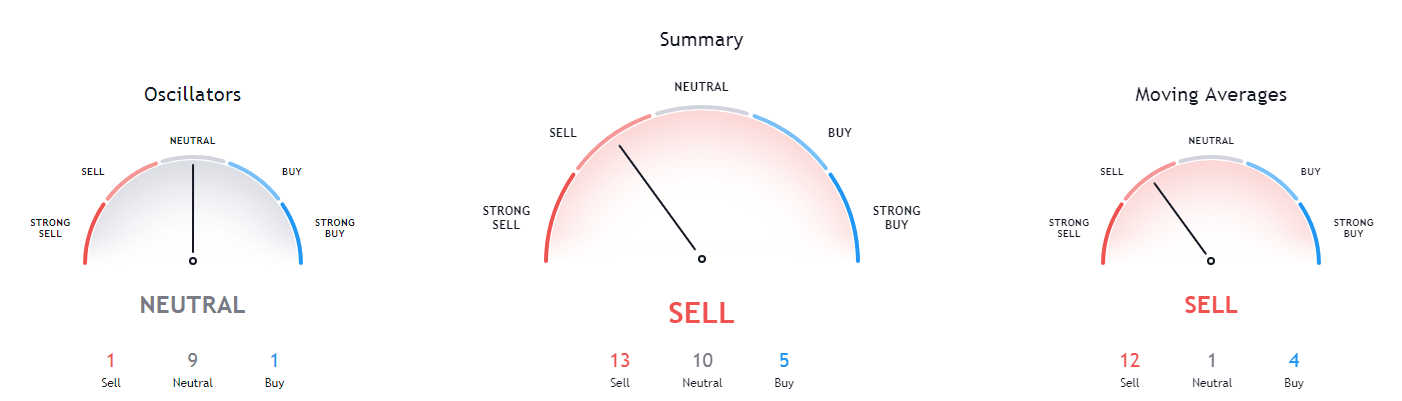
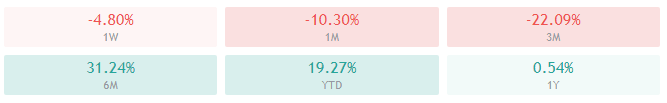
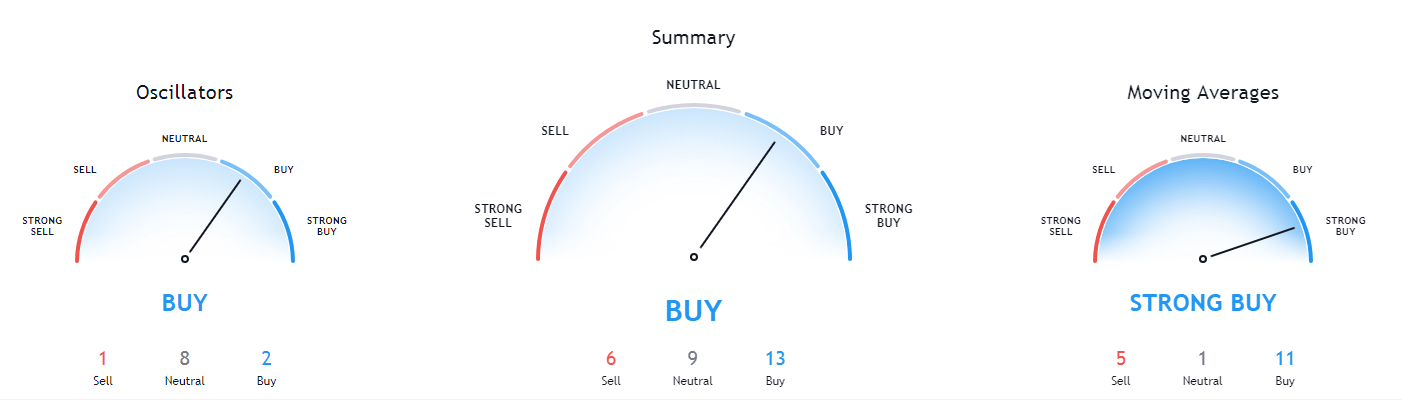
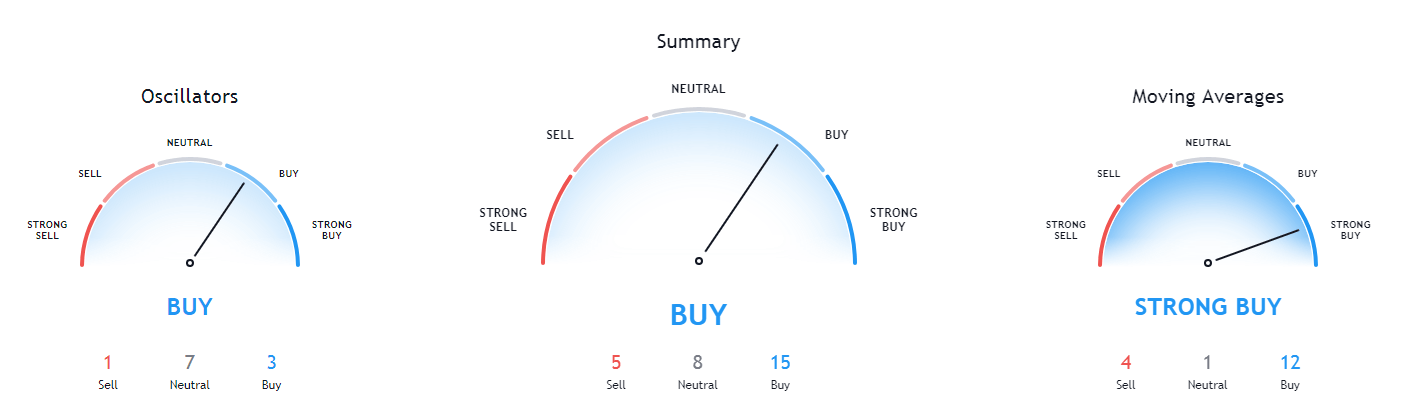
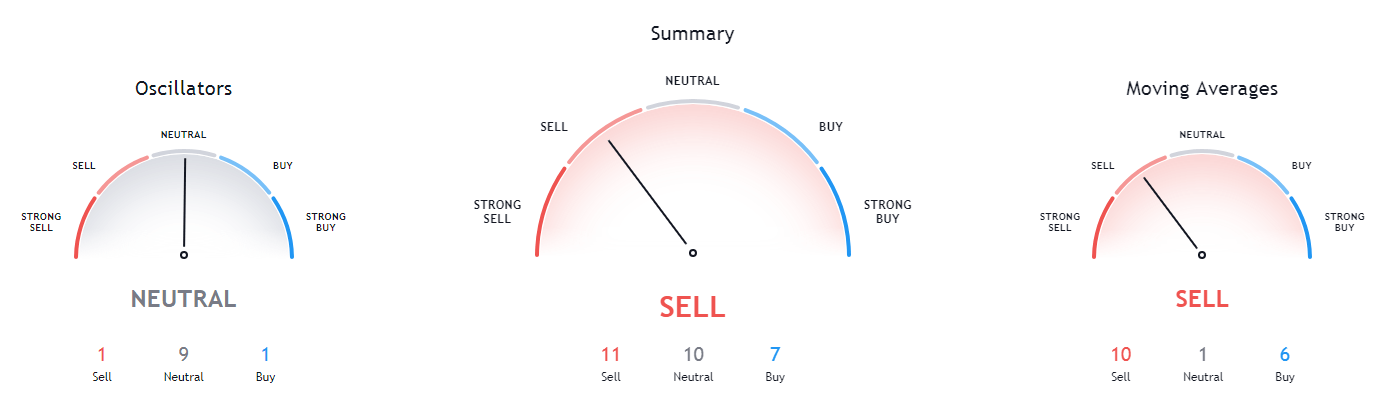
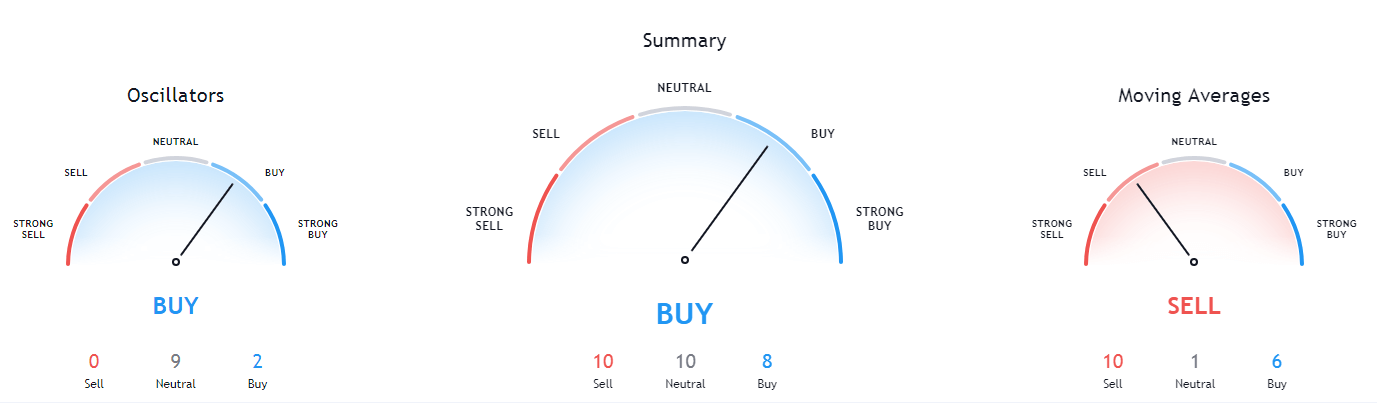
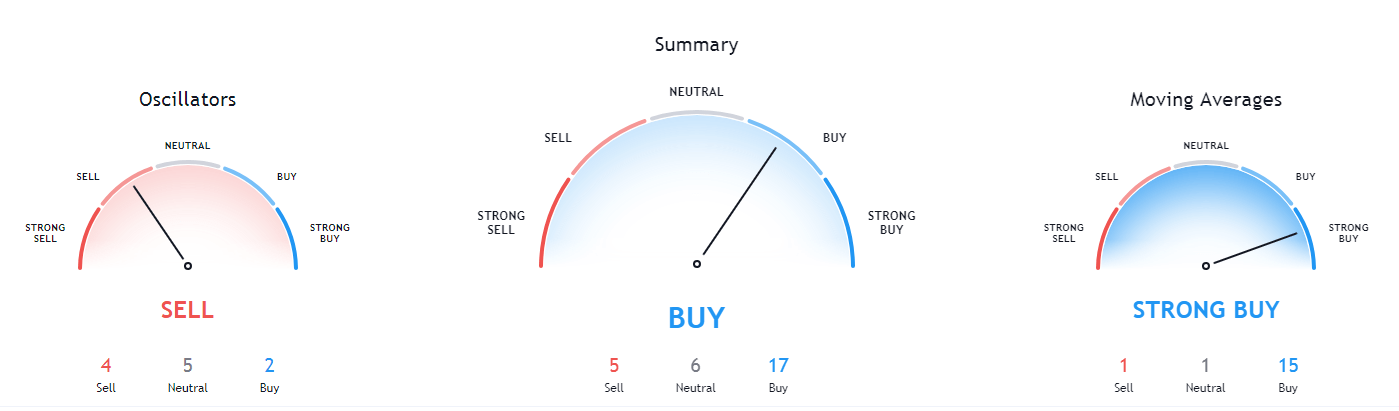
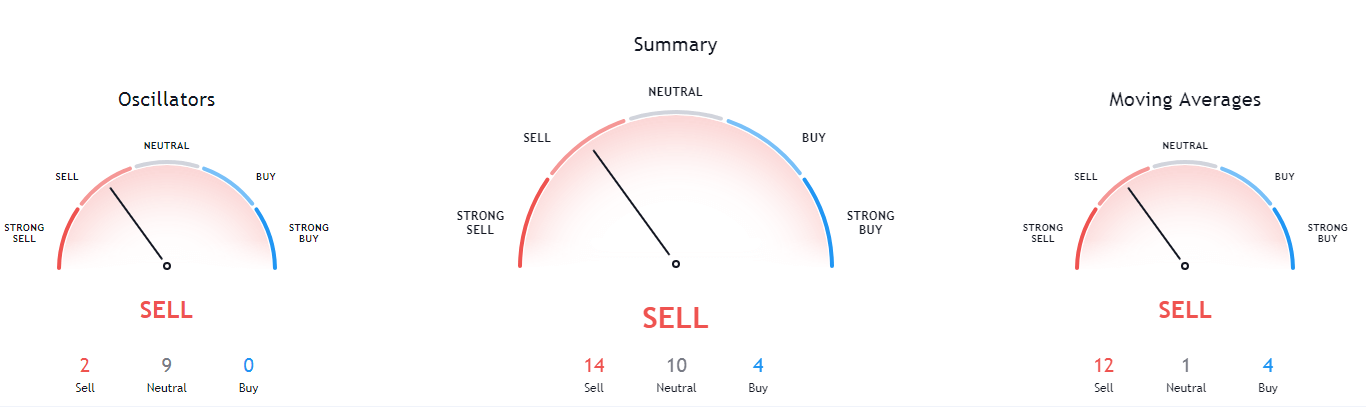
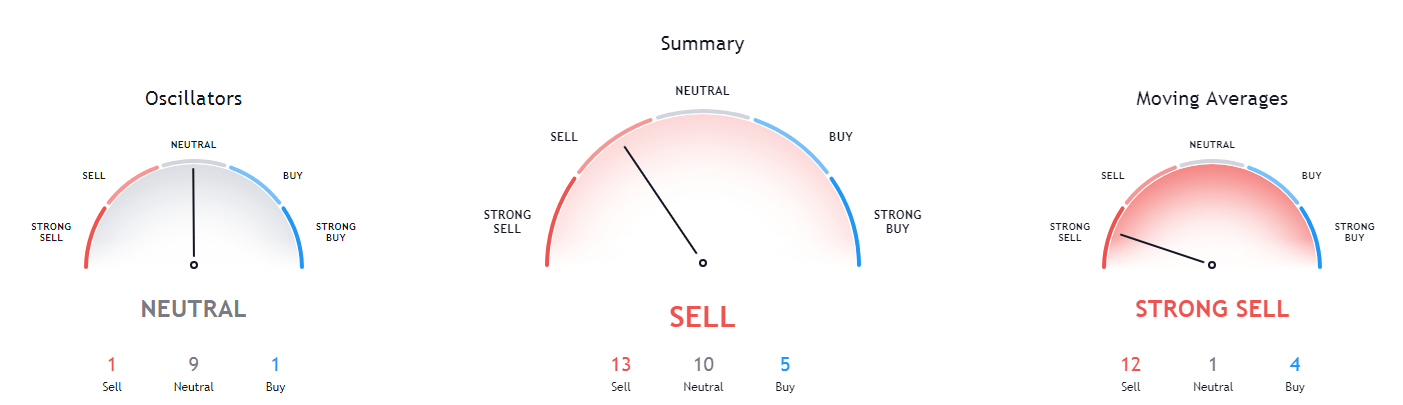
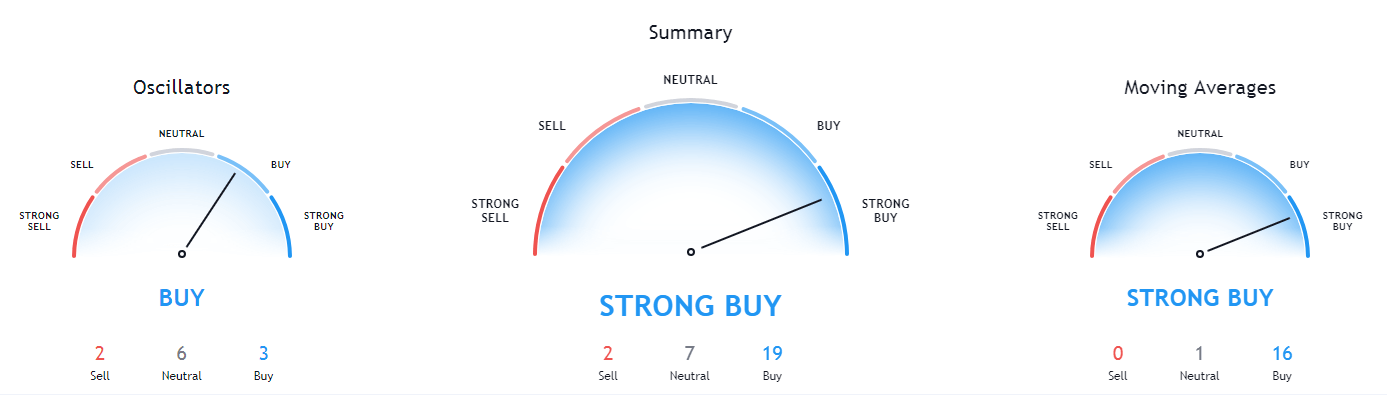
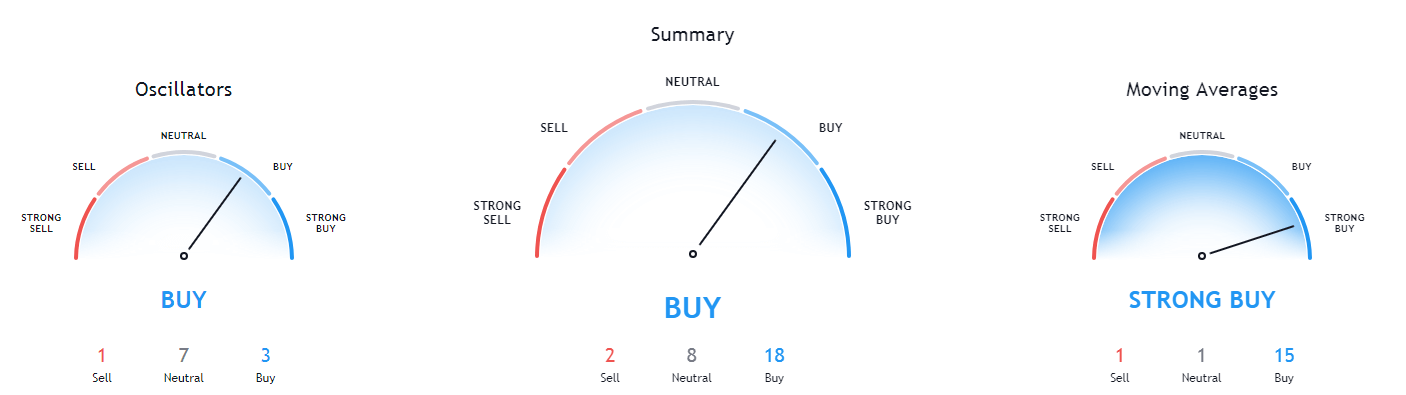
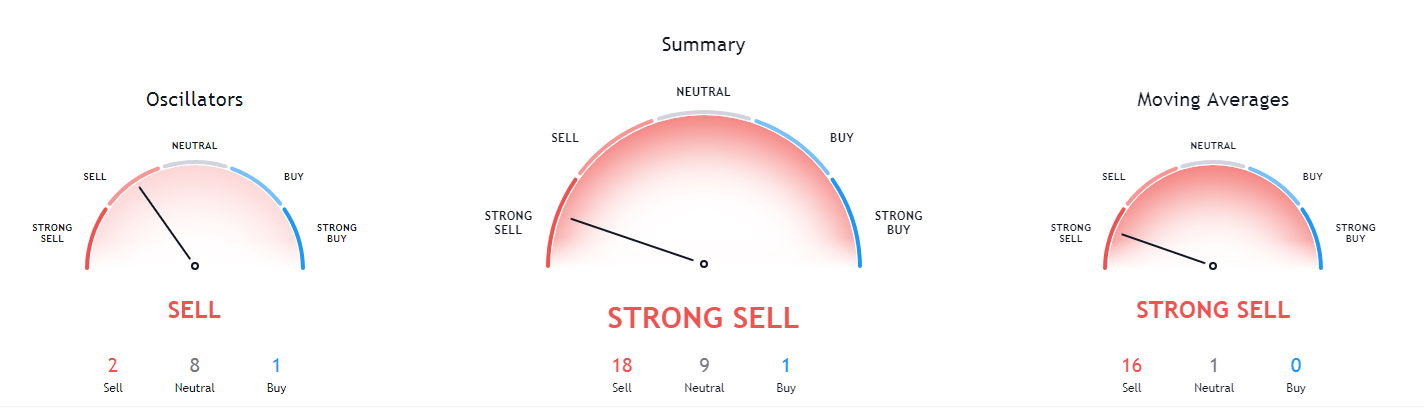
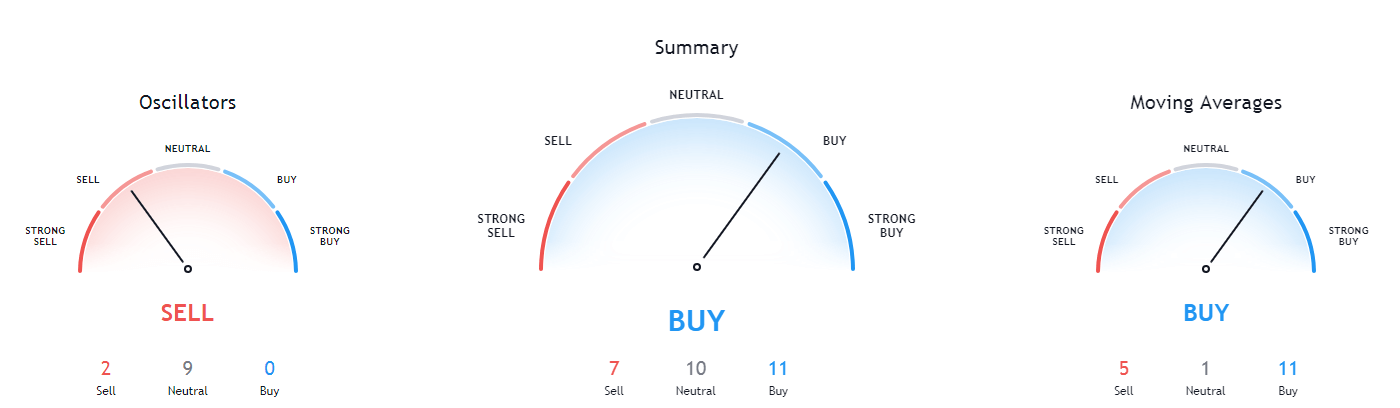
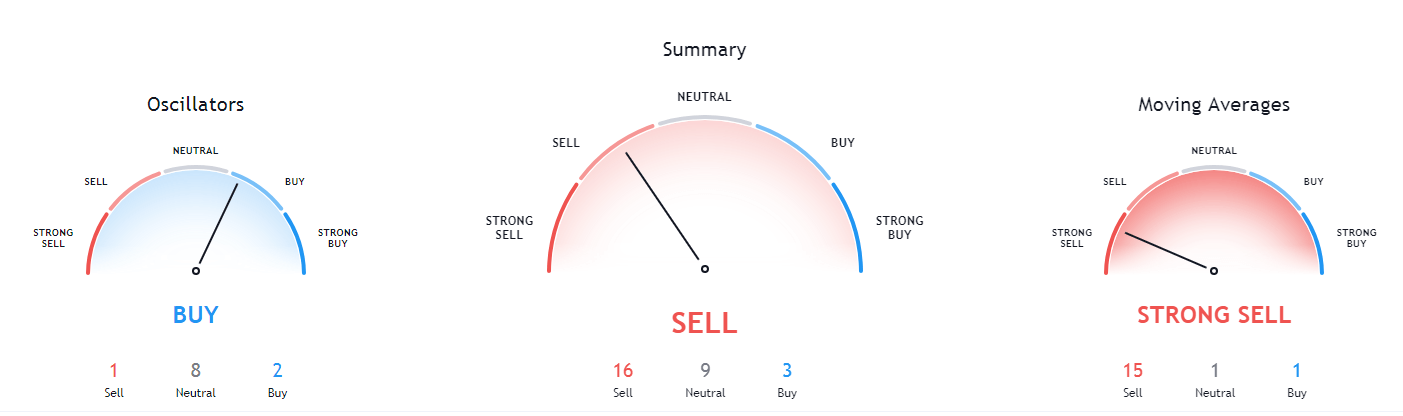
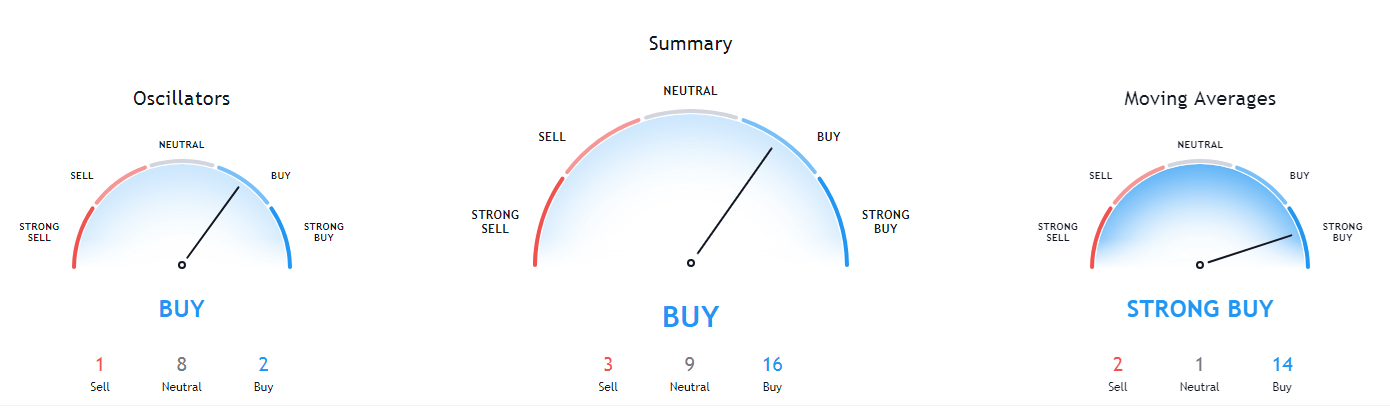
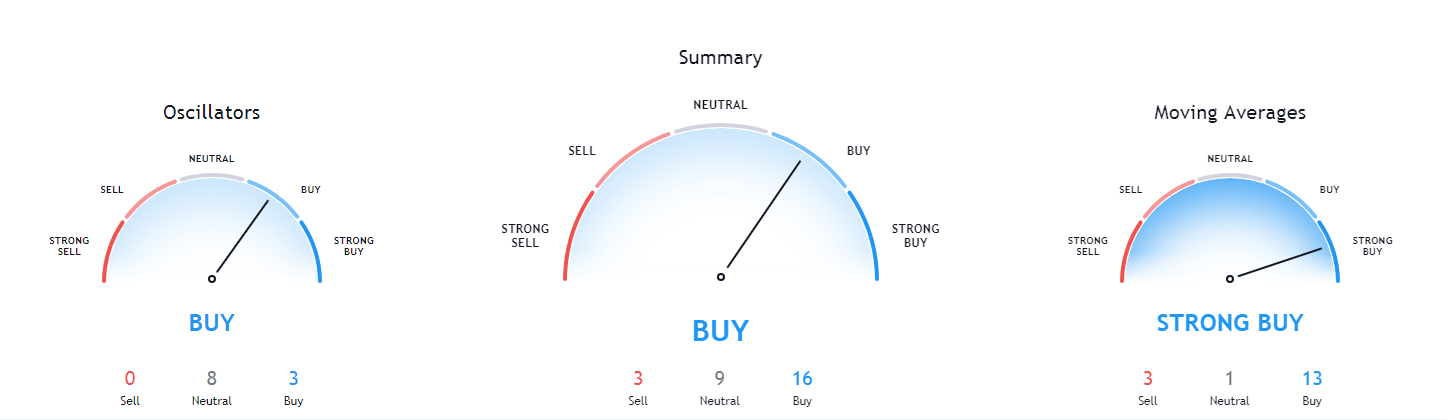
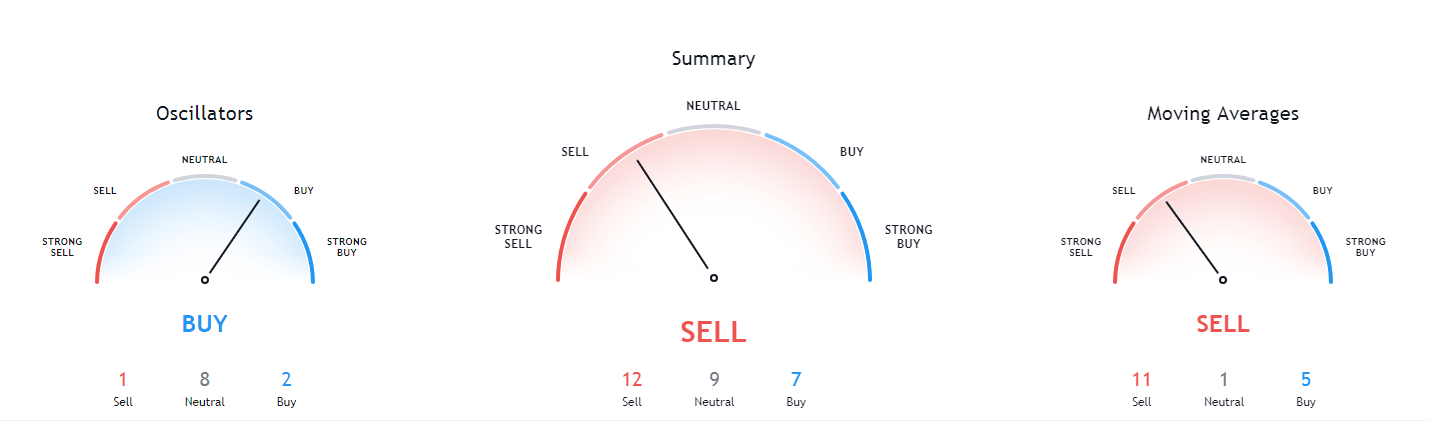
XRP’s technicals on all time-frames are bullish, with its daily time-frame being the only one not showing any signs of neutrality. The other time-frames show either slight neutrality or even slight bearishness.
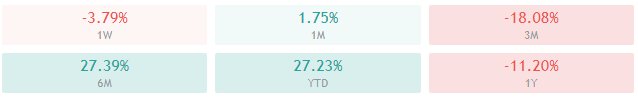
XRP/USD 1-day Technicals
Technical factors (4-hour Chart):
- The price is slightly below its 50-period EMA and at its 21-period EMA
- Price is slightly above its middle Bollinger band
- RSI is neutral (48.78)
- Volume is slightly above average
Key levels to the upside Key levels to the downside
1: $0.625 1: $0.475
2: $0.79 2: $0.443
3: $0.963 3: $0.4