Categories
Forex Elliott Wave Forex Market Analysis

Can EURUSD Re-Test the Level 1.20?

The EURUSD pair advances in an unfinished impulsive formation that raised the common currency from 1.06359 till 1.20114. The price action started to develop a corrective sequence, still progressing, corresponding to its fourth wave of Minor degree. Explore with us what should be the target of the fifth impulsive wave.

Market Sentiment

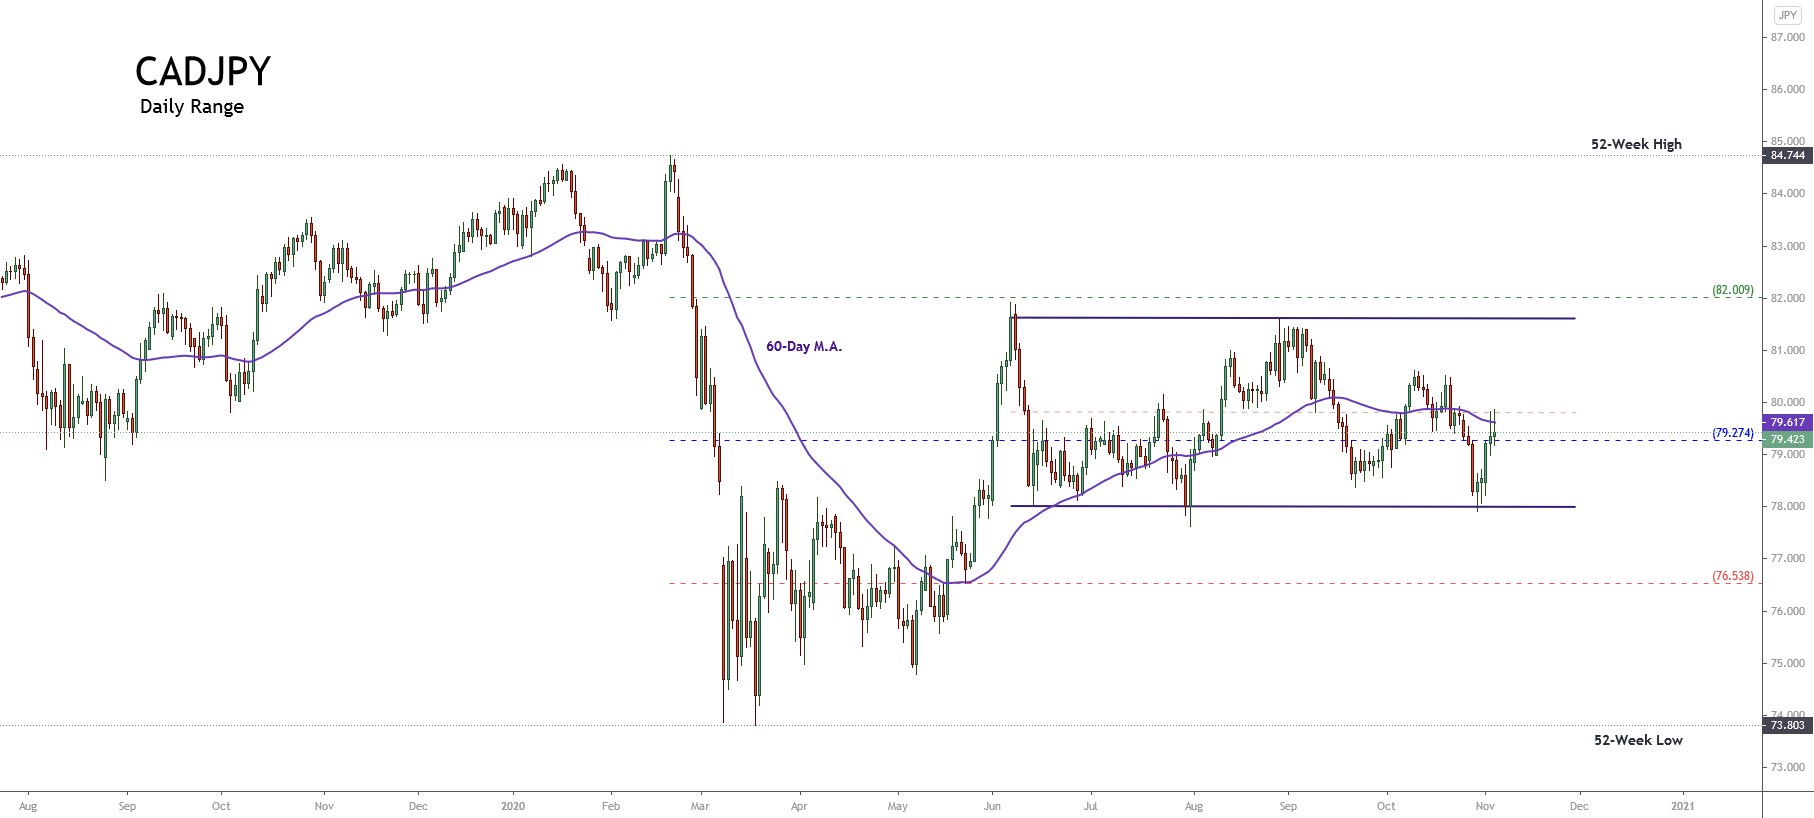
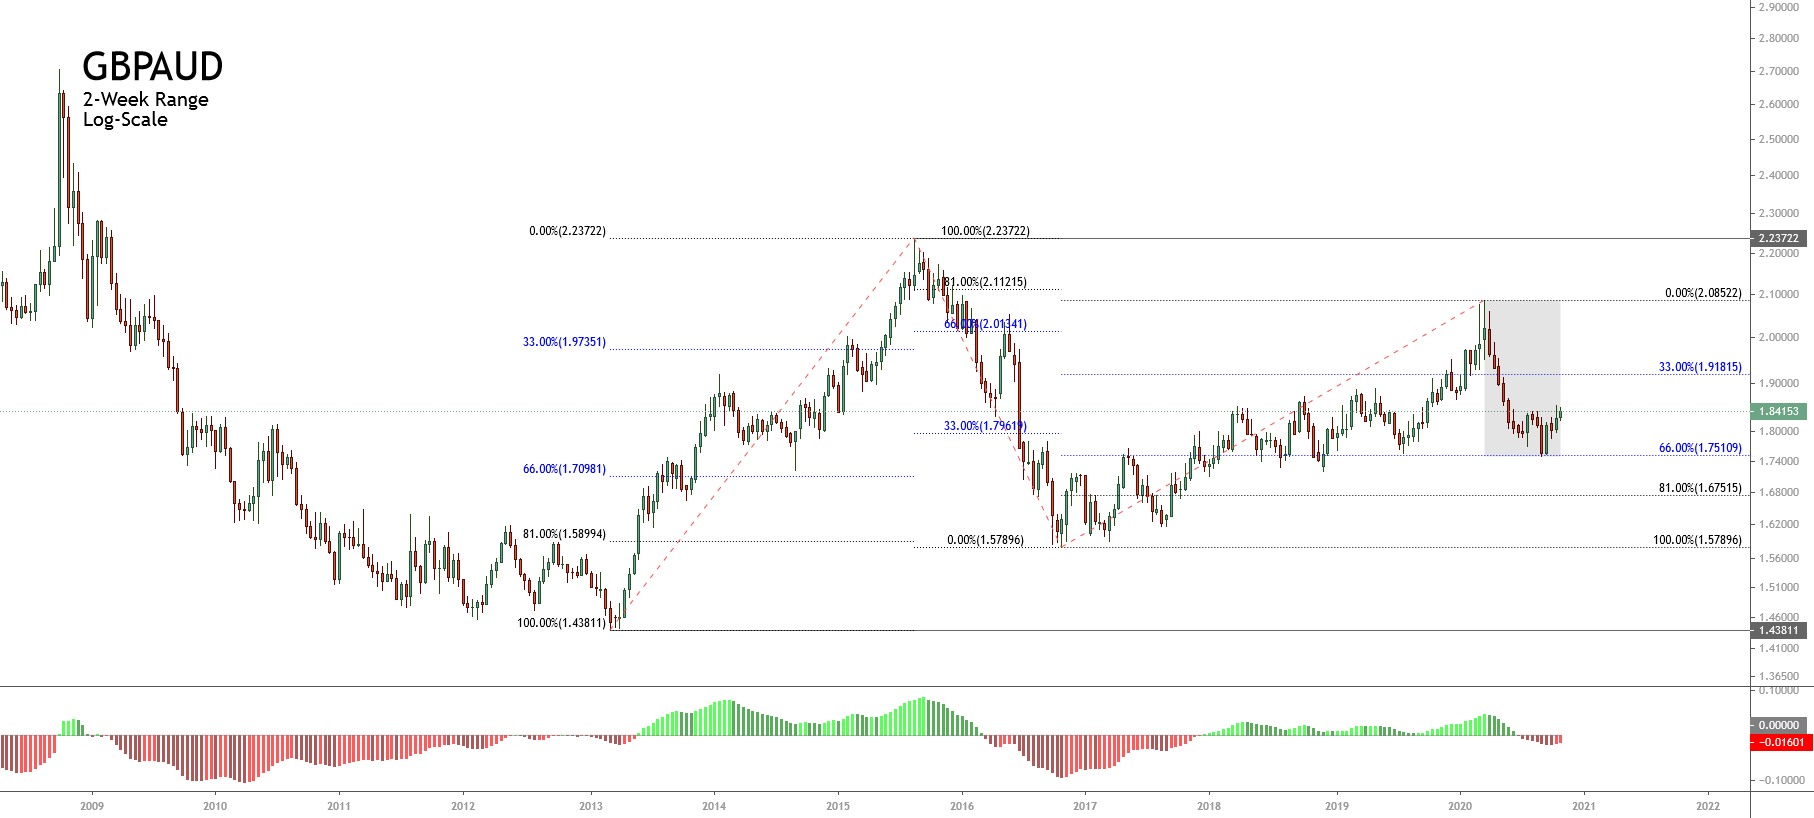
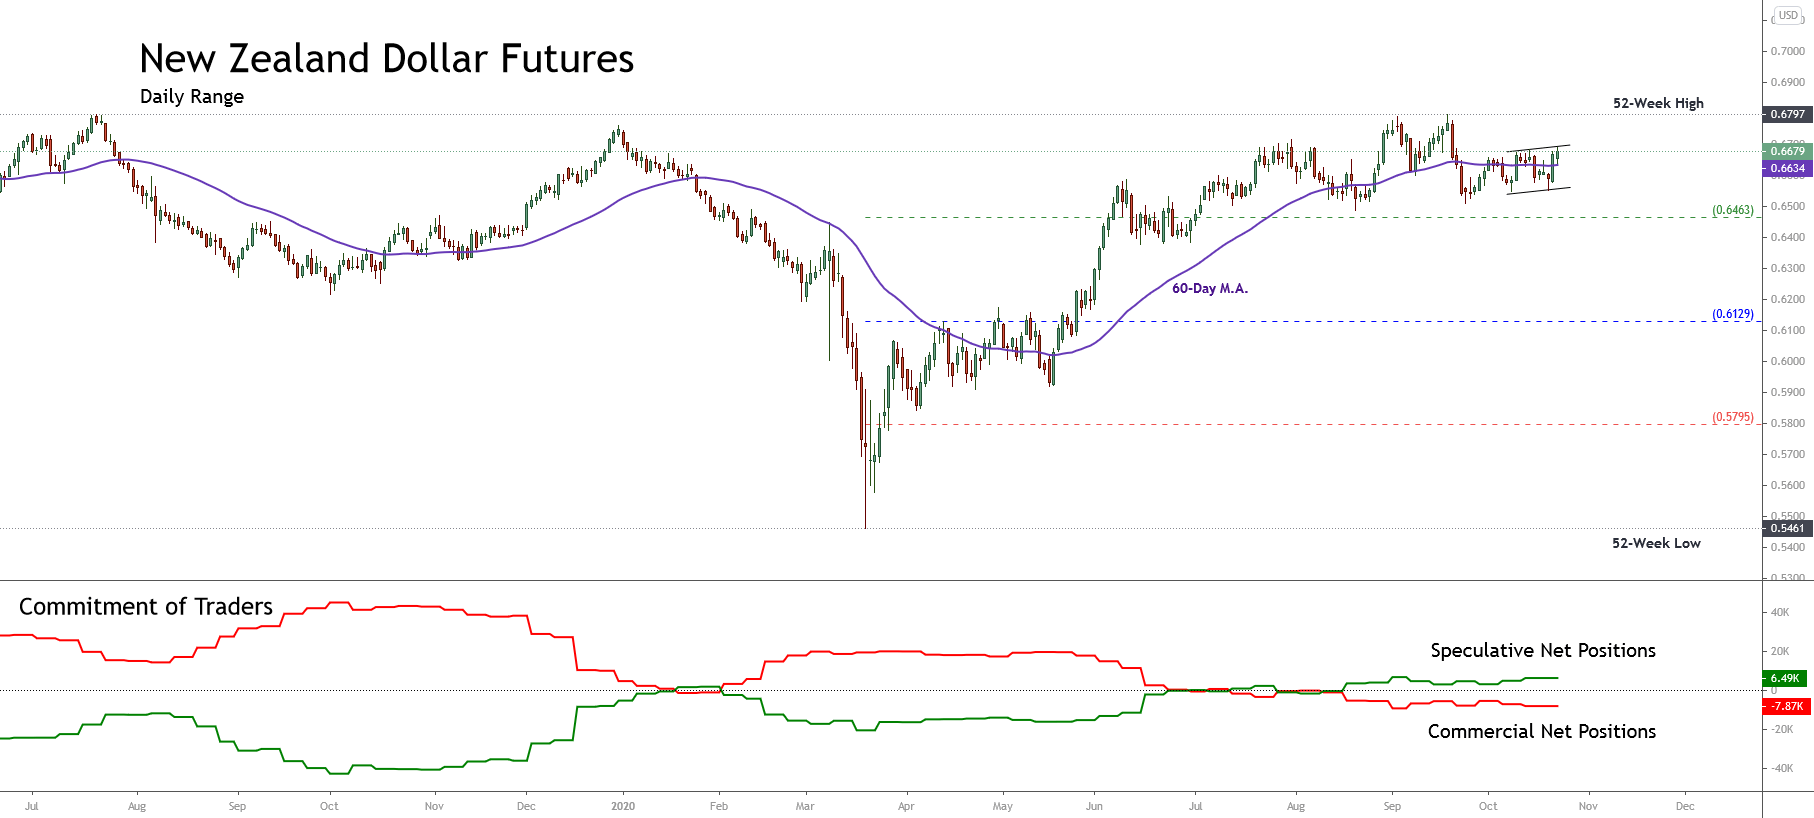
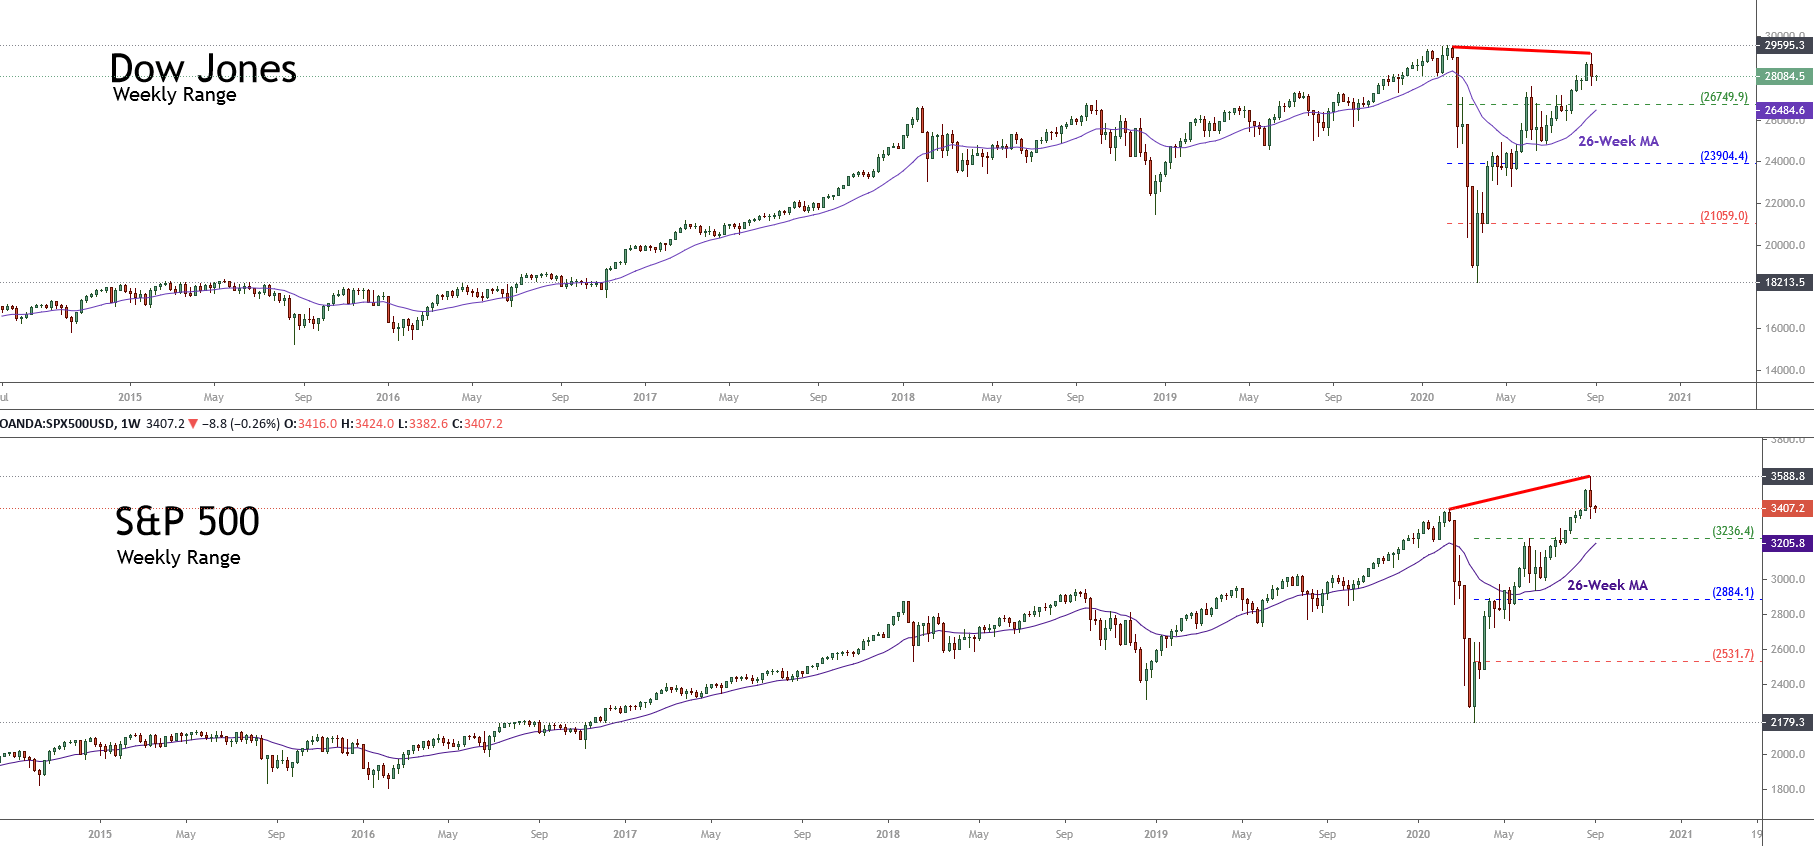
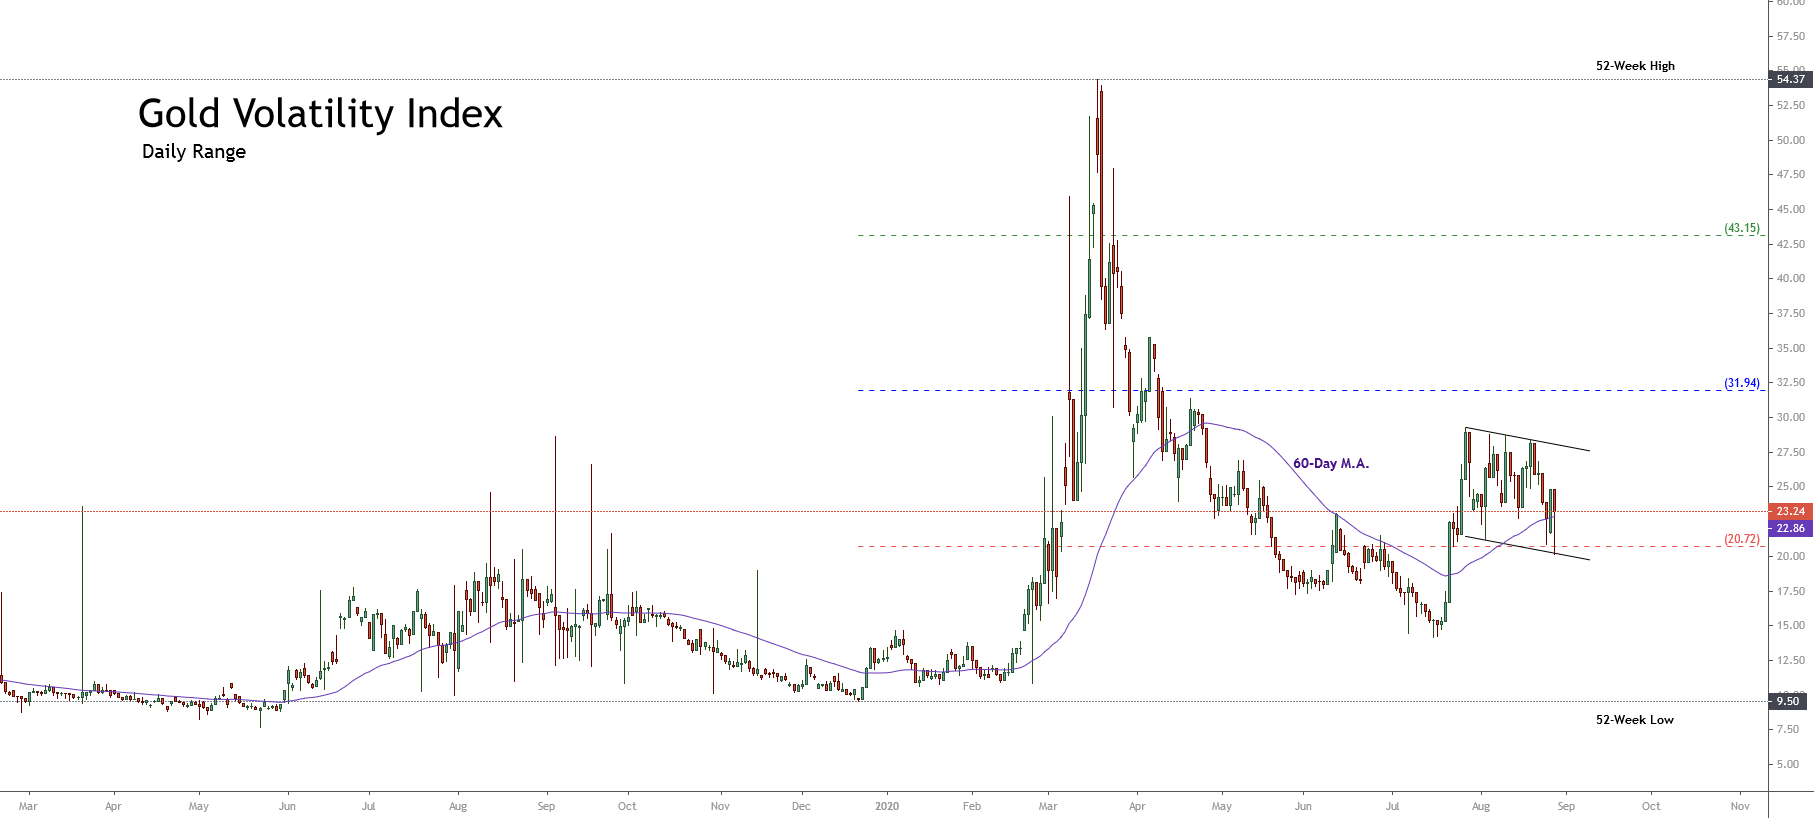
The long-term market sentiment of the EURUSD pair based on the 52-week high and low range unveils the price moving in the extreme bullish zone. 

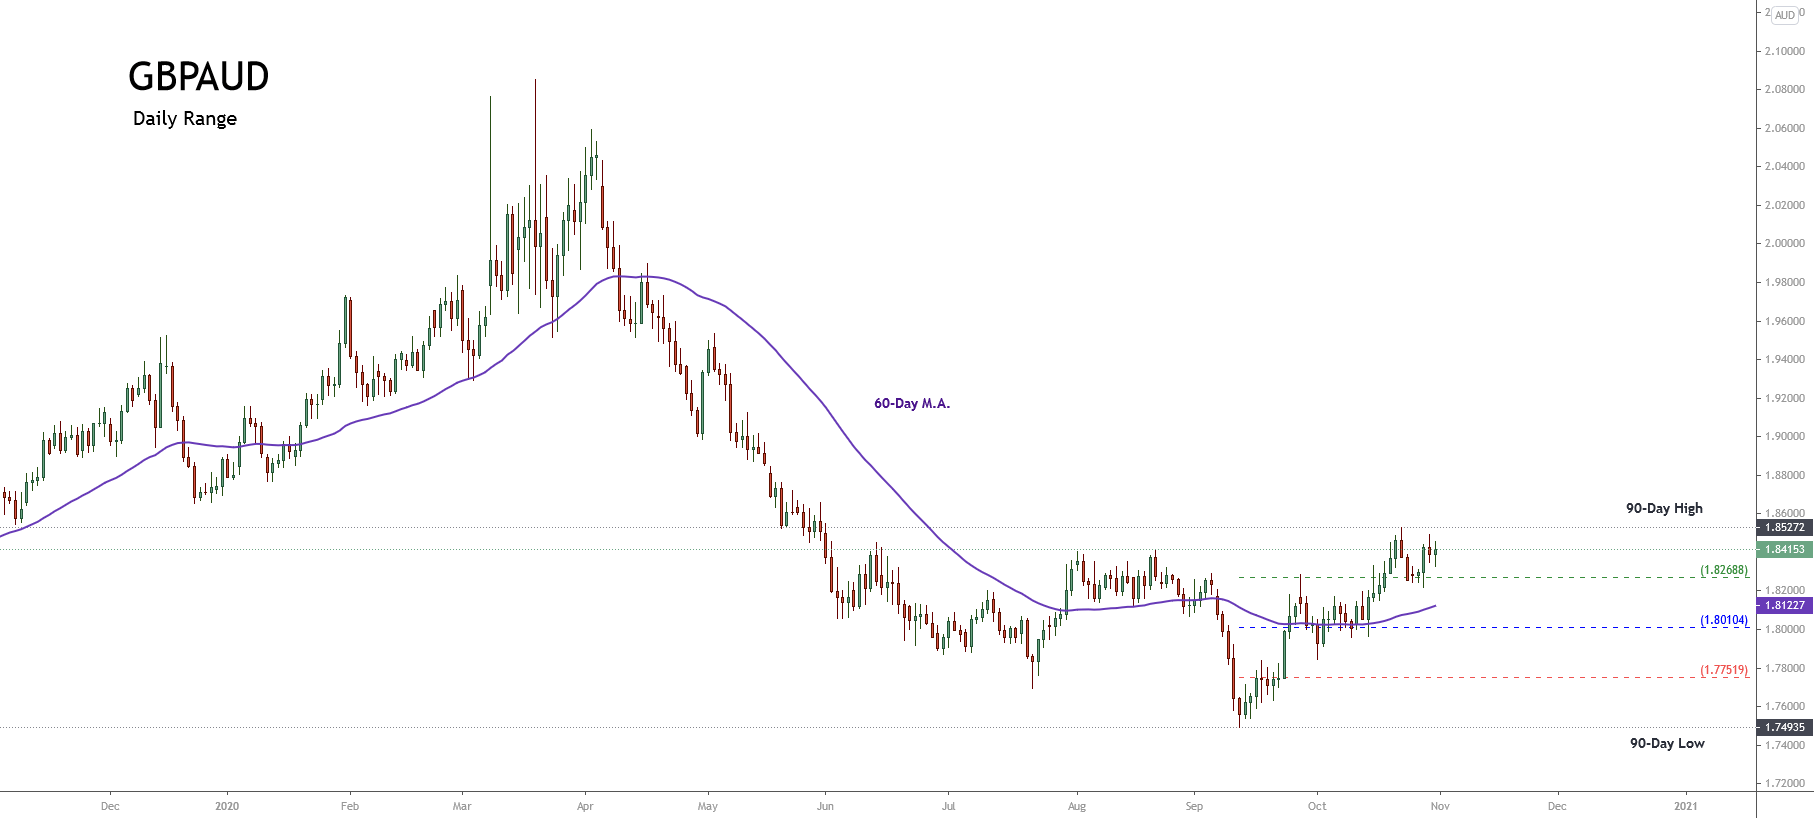
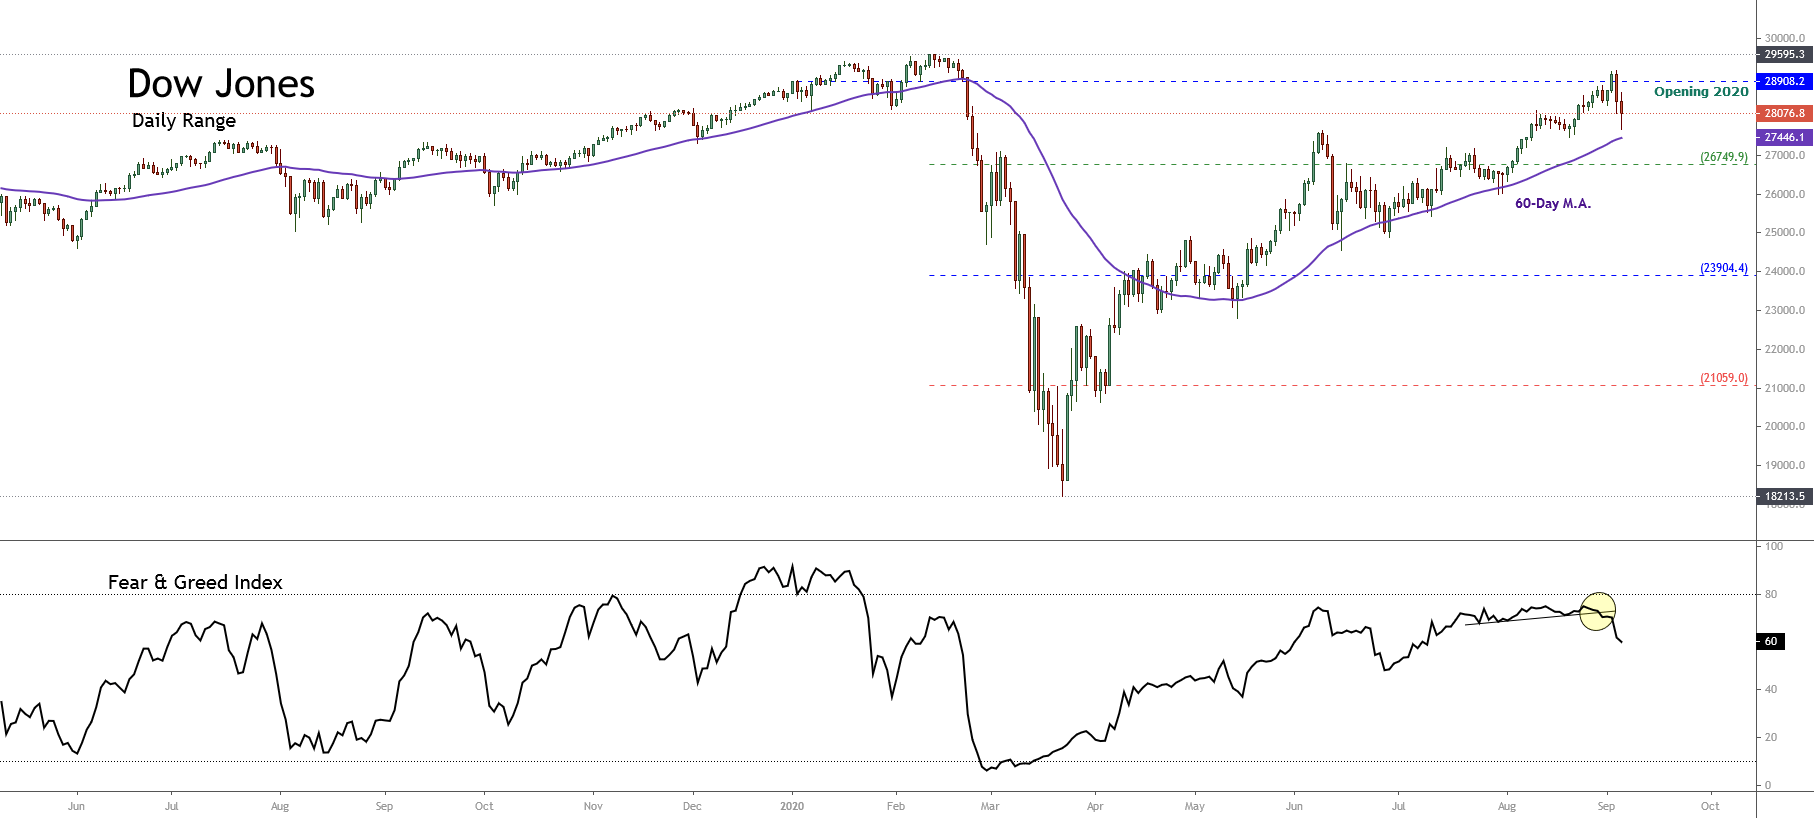
The following daily chart illustrates the common currency moving above the 60-day linear weighted moving average, confirming the extreme short-term upward bias prevalent in the current price action.

Likewise, the consolidation formation bounded between 1.16121 and 1.18566, appearing after the rally from mid-May to early September, leads us to anticipate the take-profit activity of big market participants. In other words, the price could begin a new movement toward the 52-week high zone, creating a euphoric sentiment for the euro before developing a corrective move.

Elliott Wave Overview

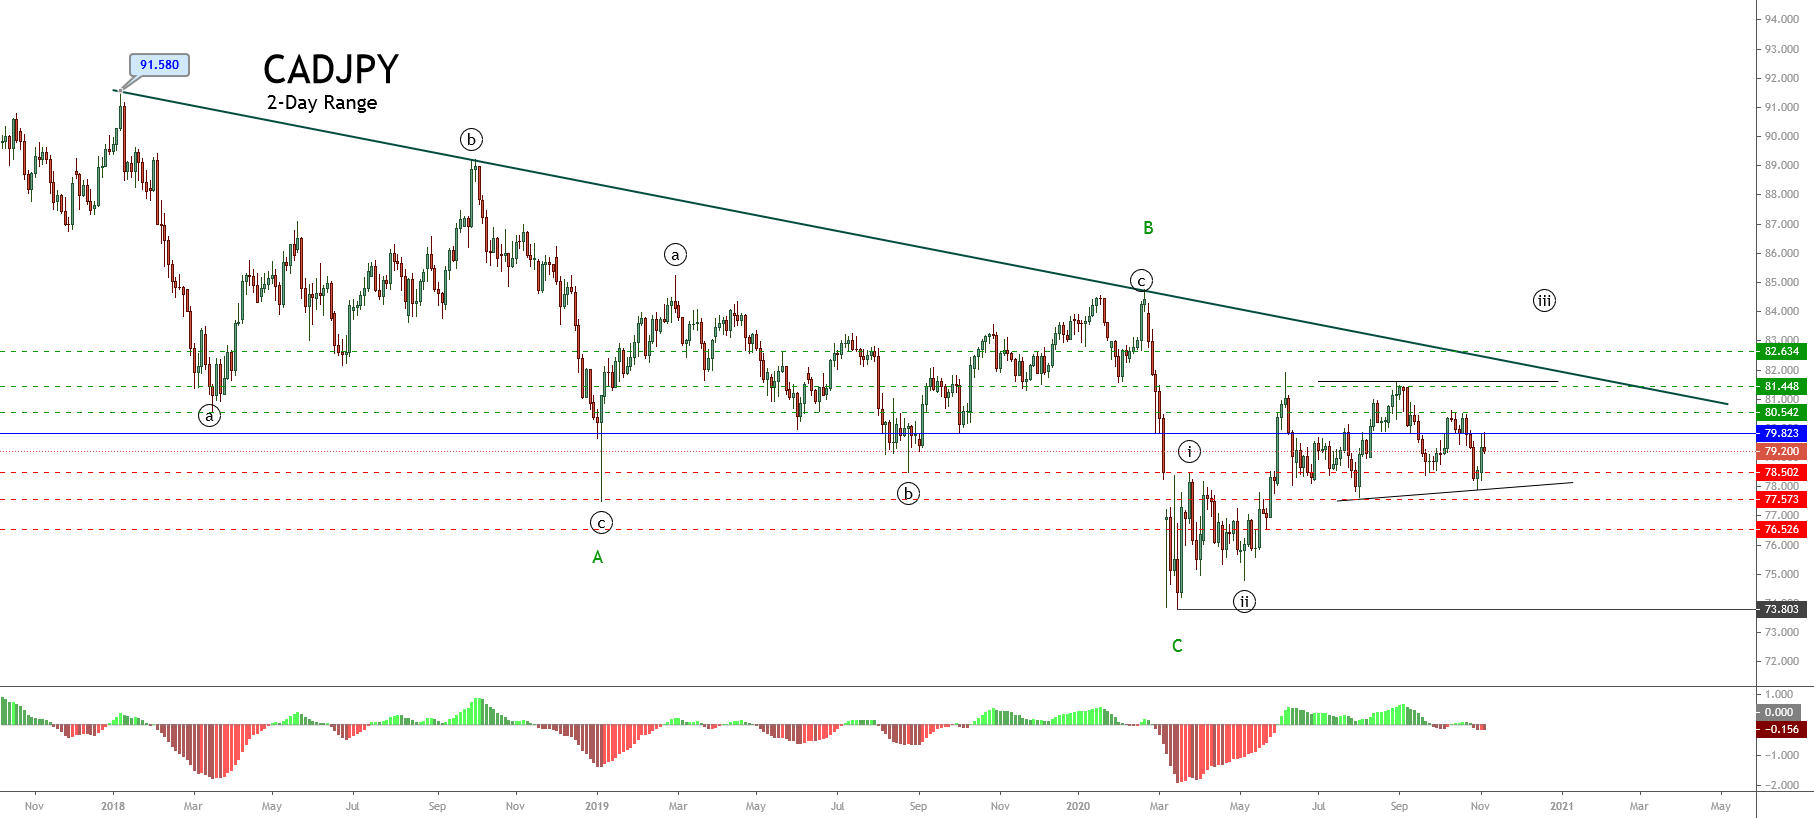
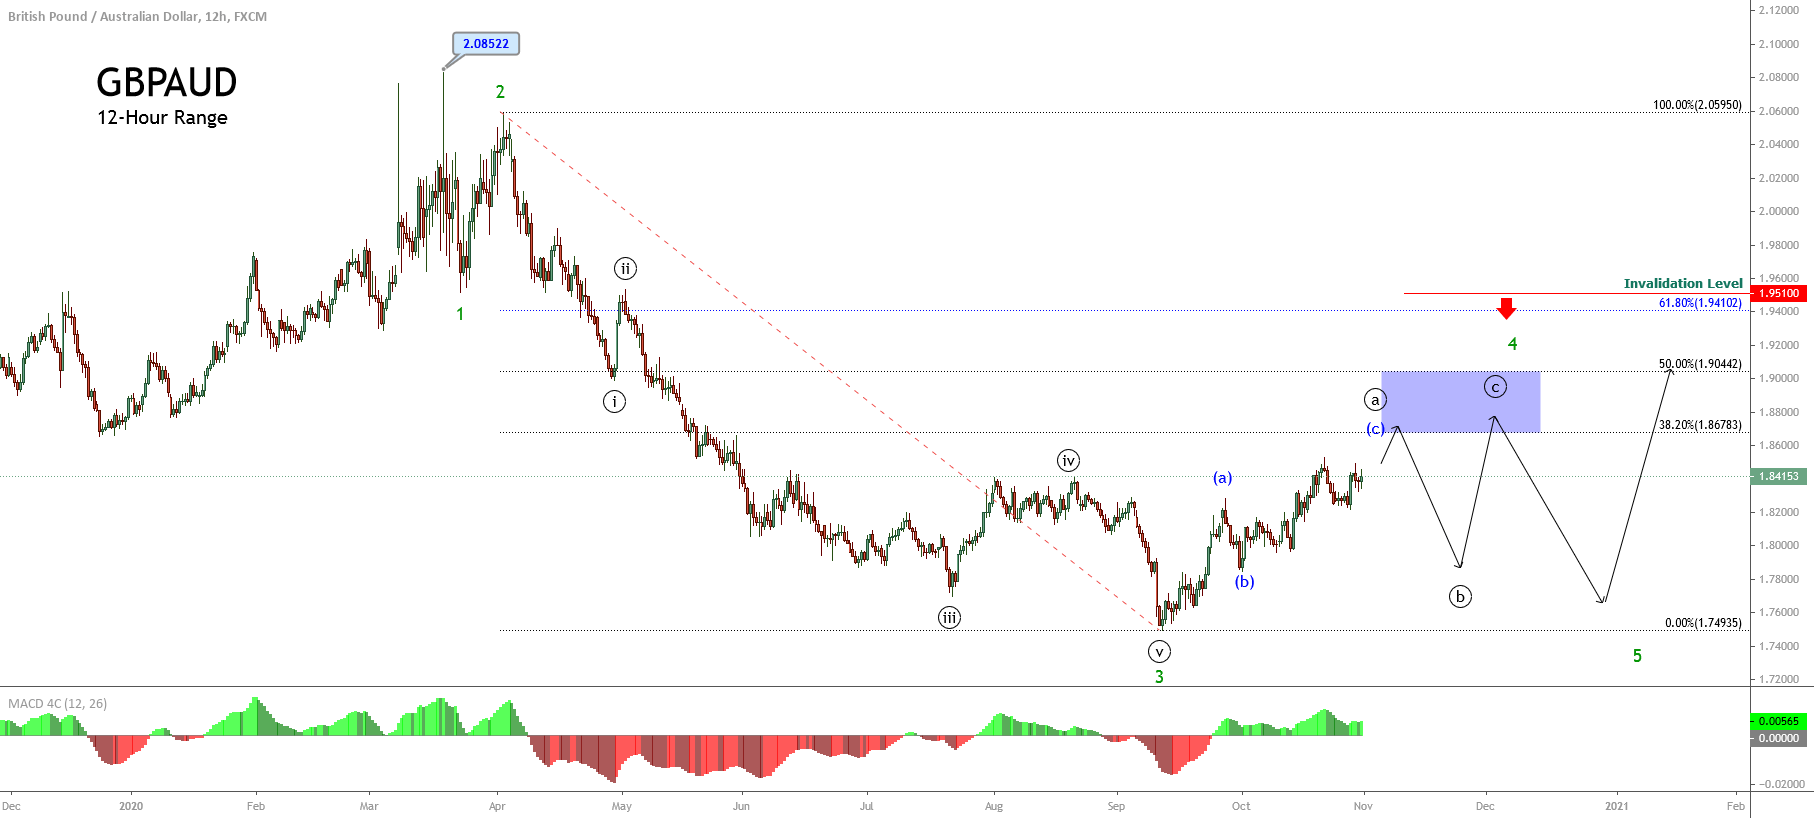
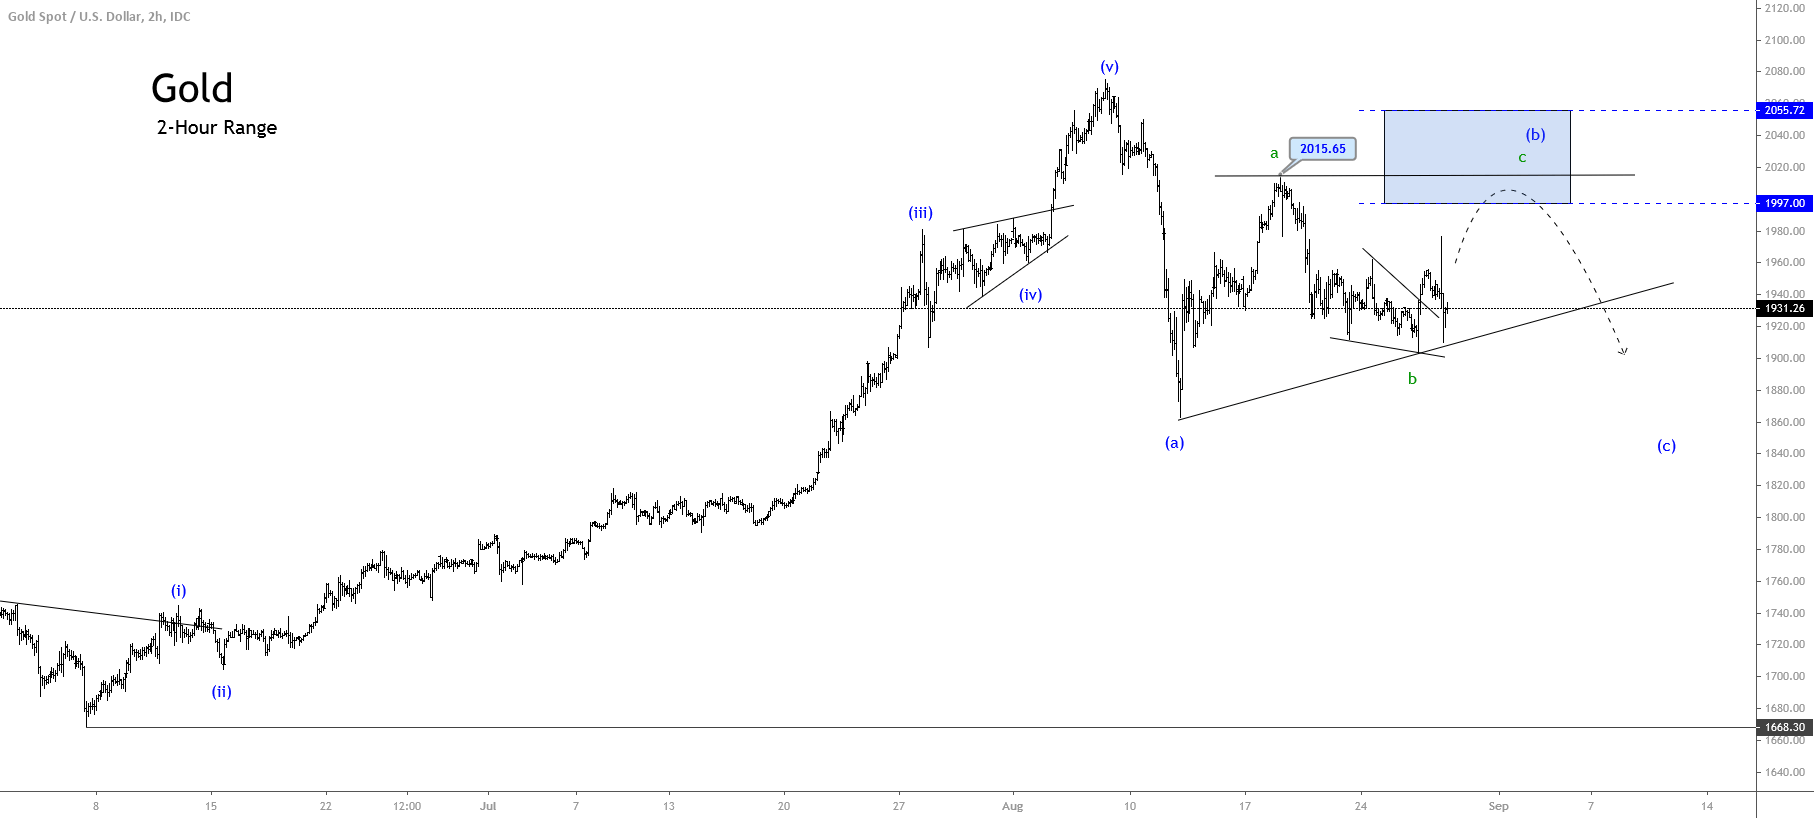
 EURUSD pair’s long-term outlook under the Elliott Wave perspective reveals the upward advancement of the common currency in an unfinished impulsive wave, which currently progresses in its fourth wave of Minor degree, suggesting further highs.

The following daily chart exposes de uptrend developed by the EURUSD since the March 23rd low located at 1.06359, where the price found fresh buyers, who remain in control of the long-term uptrend.

The Elliott Wave point of view illustrates the EURUSD pair developed and completed a third extended wave of Minor degree labeled in green when the price reached 1.20114 on past September 01st. Once the common currency found resistance at 1.20114, the EURUSD started to develop its fourth wave of Minor degree identified in green.

Considering that the second corrective wave was simple in terms of price and time, by the alternation principle of the Elliott Wave theory, the fourth wave should be a complex correction. In this regard, the complexity could be in terms of price, time, or both.

If the correction were complex in price, the formation could be a flat pattern like an irregular flat. If the complexity were in terms of time, the corrective pattern could be a triangle formation. Finally, if the correction develops a combination of price and time complexity, the structural series could be a double three or a triple three pattern.

Short-term Elliott Wave Outlook

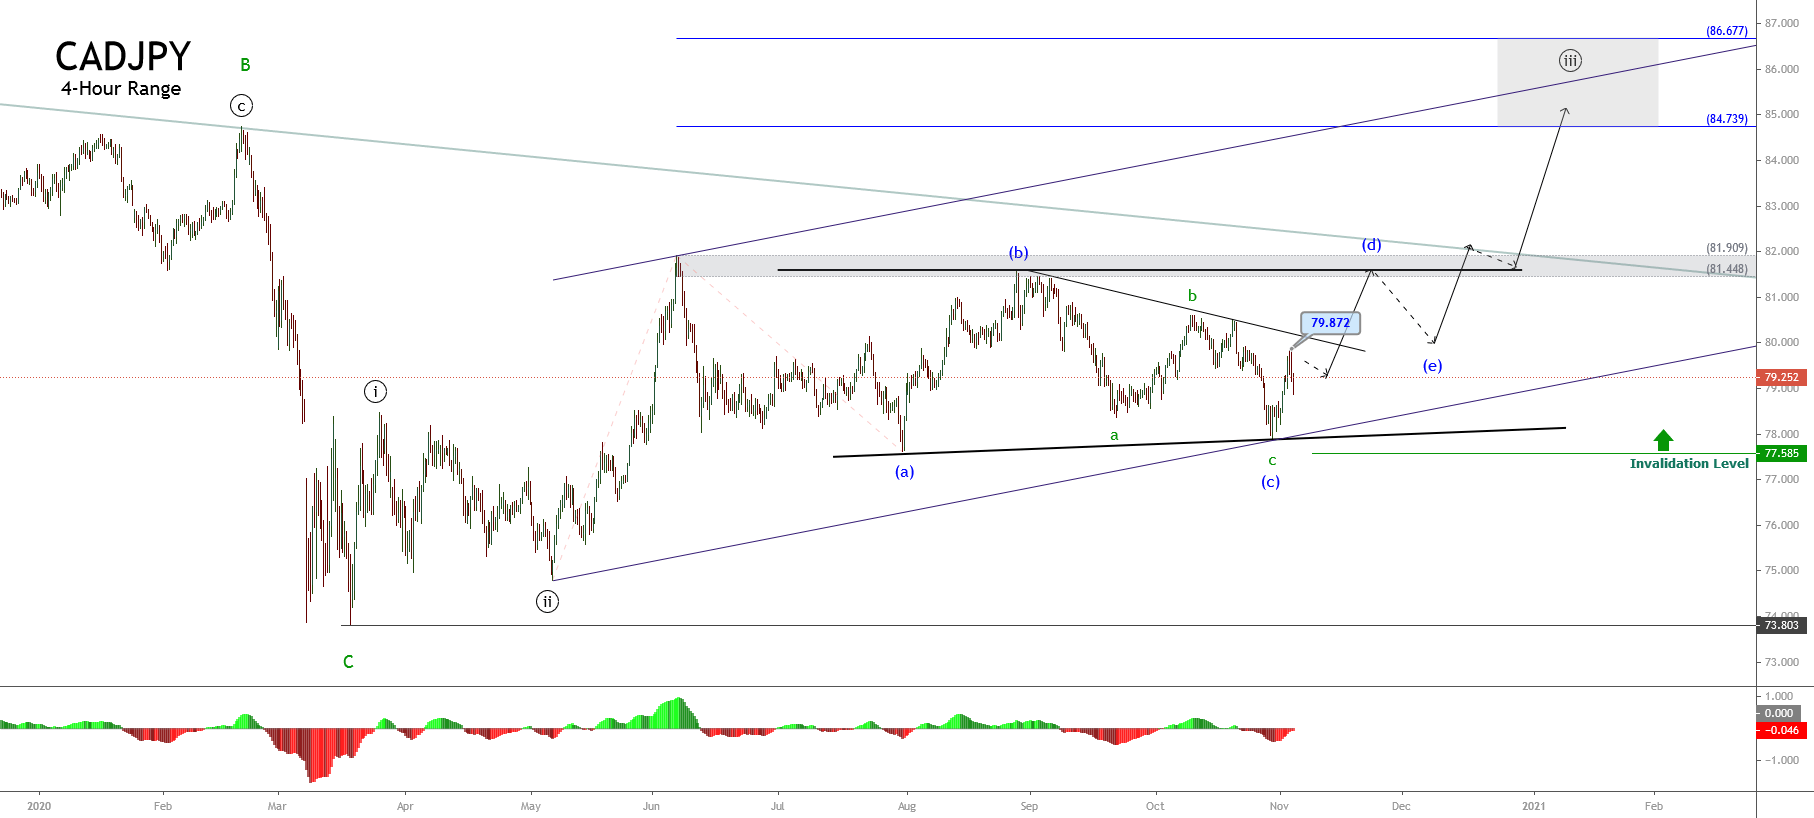
Once the fourth wave ends, the common currency should advance in its fifth wave, shown in green in the following chart. Considering that the third wave is the extended wave, two potential scenarios exist for the fifth wave target.

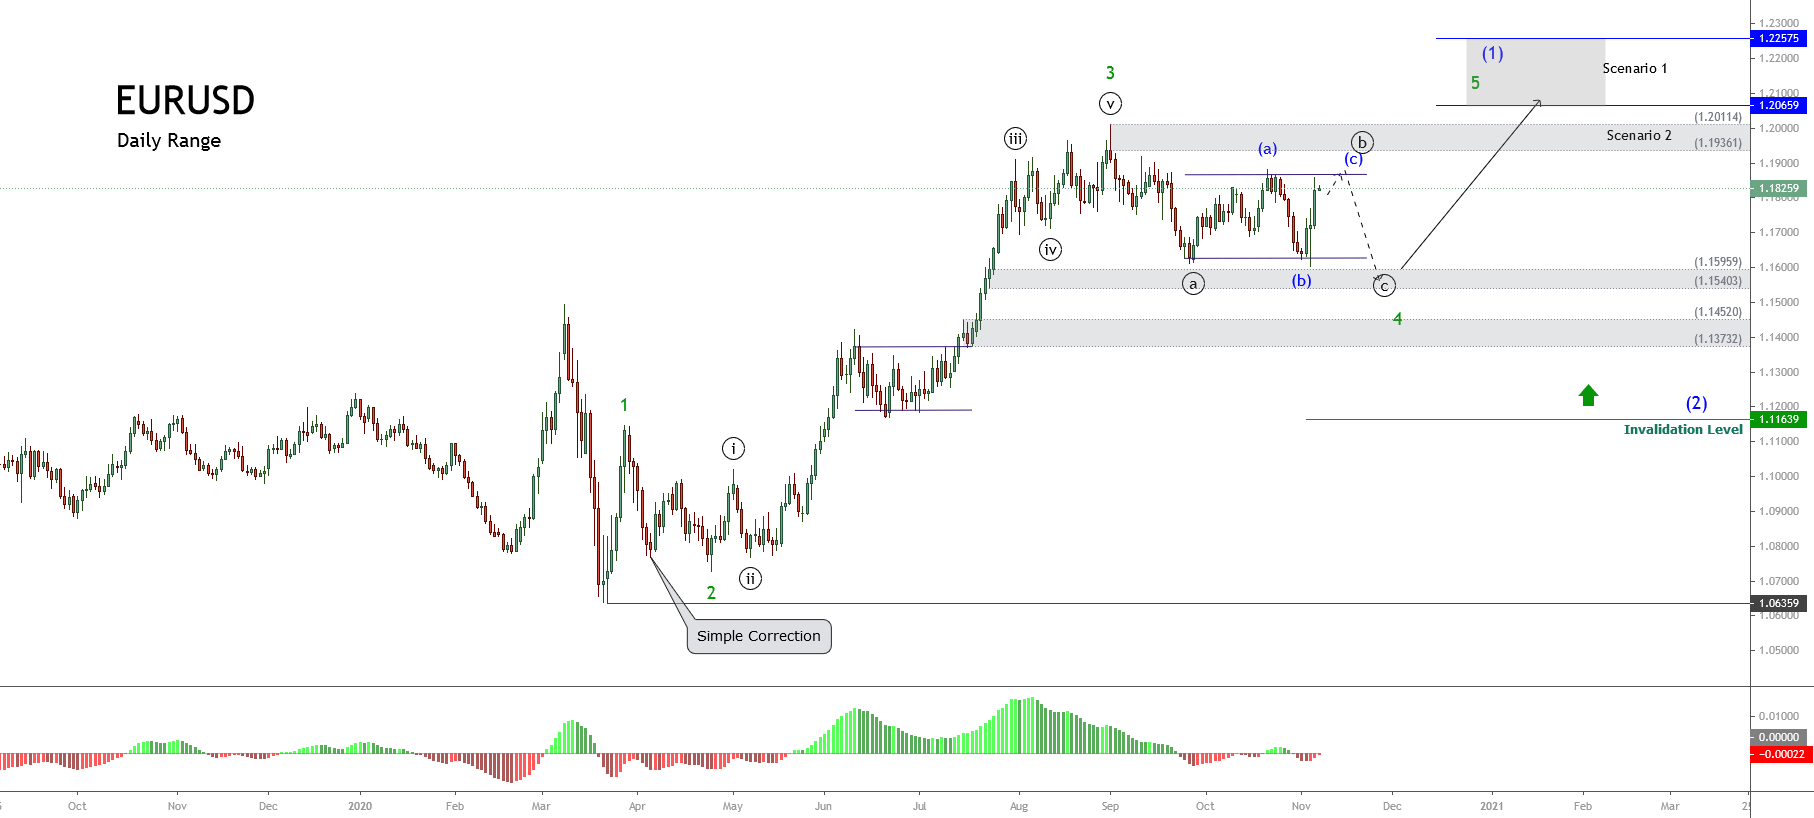
The first scenario considers the advance slightly higher than the top of the third wave, which could reach the area between 1.2065 and 1.2257.

The second scenario may arise if the fifth wave’s bullish pressure fails and finds resistance in the supply zone, which is located between 1.19361 and 1.20114.

To conclude, the invalidation level corresponding to this bullish scenario is a close below 1.11639.

Categories
Forex Market Analysis

Profiting from GBPNZD Weakness

Overview

The GBPNZD cross extends its losses. The pair’s sentiment is currently controlled by the bears. The Elliott Wave sequence suggests the possibility of a new decline, which could accelerate its price toward the long-term ascending trendline.

Market Sentiment

The GBPNZD cross declined 0.47% in the Wednesday trading session, propelled by the US presidential election’s tight results. In this context, the 12-hour chart illustrates the market sentiment, displaying the 90-day high and low range.

We observe in the previous chart that GBPNZD moves mostly sideways and consolidating in the bearish sentiment zone. Simultaneously, the price action moving below the 200 moving average is a confirmation that the short-term bias is to the downside Furthermore, the current session’s range and long body candle reveal the bearish pressure dominating the market sentiment. Finally, the following chart’s lower graph shows the retail traders’ activity positioning, which moves to 74% on the long side. This contrarian indicator confirms the bearish bias of big market participants.

In summary, as long as the GBPNZD price doesn’t unveil bullish reversal signals or surpasses the 1.96371 level, the market sentiment will remain on the bearish side.

Technical Big Picture

The long-term outlook of the GBPNZD cross under the Elliott Wave perspective unveils its advance in a corrective structure, which began in late August 2015 when the price topped at 2.53193 and declined in a three-wave internal sequence. This downward sequence ended in early November 2016, when the price found support at 1.67055.

Once the cross found fresh buyers, the price started to advance in an ascending corrective sequence identified as wave (B) of Intermediate degree, which ended in the first part of March 2020 when the GBPNZD climbed until 2.17598.

In terms of the Elliott wave theory, considering that the structural series in progress completed two segments subdivided into three internal waves, the sequence could correspond to a flat pattern, a triangle, or a double three formation.

Nevertheless, although the three potential structures have different implications, the pressure remains on the bearish side.

Short-term Technical Analysis Outlook

The GBPNZD cross in its 4-hour chart unveils the incomplete downward structure that began on August 20th at 2.02711. This bearish short-term sequence of Minuette degree identified in blue could correspond to a wave (iii) or (c).

In both cases, an upward retracement toward the psychological 1.94 barrier could serve as an entry to the bearish side. Likewise, the third segment, in development, could extend its drops to the area between 1.91117 and 1.89719, which coincides with the long-term ascending channel.

In this regard, long-term traders could wait for this decline where the price could re-test the long-term trendline to add to their long positions.

Finally, the invalidation level for this bearish scenario stays at 1.98053, which coincides with the end of wave (ii) or (b) identified in blue.


Categories
Forex Forex Elliott Wave Forex Market Analysis

Is CADJPY Ready for a New Rally?

Overview

The CADJPY cross advances mostly sideways in an incomplete triangle pattern. The corrective structure that remains in progress suggests the possibility of further upsides in the coming trading sessions.

Market Sentiment

The market sentiment on the CADJPY cross looks neutral, although during the overnight trading session, although the US presidential election is driving up volatility.

The following daily chart shows the long-term market participants’ sentiment unfolded between the 52-week high and low range. The figure reveals the price action currently moving on the neutral zone, which moves near the level of 79.274. 

In this context, the neutral sentiment is confirmed by the sideways channel, which began in early June, and the price action moving below the 60-day moving average Nevertheless, the bullish wide range candle of November 02nd leads to expect further upsides in the following weeks.

Technical Big Picture

The CADJPY cross moves in a sideways upward structure that belongs to an incomplete upward sequence that began last March 17th when the price found fresh buyers at 73.803.

The 2-day chart shown below illustrates the big picture of CADJPY under the Elliott Wave analysis perspective. The figure reveals the pair’s action advancing in an incomplete third wave of Minute degree labeled in black.

The consolidation structure of the CADJPY cross, in progress, suggests the possibility of a bullish continuation. Likewise, in terms of the Elliott Wave theory, if the current upward sequence corresponds to an incomplete impulsive sequence, the price could develop an extended wave. Nevertheless, a signal of confirmation of the potential new rally will occur if the price breaks and closes above the pivot level located at 79.823.

The short-term supports and resistance levels are as follows:

  • Resistance 1: 80.542
  • Resistance 2: 81.448
  • Resistance 3: 82.634

Pivot Level: 79.823

  • Support 1: 78.502
  • Support 2: 77.573
  • Support 3: 76.526

Short-term Technical Analysis Outlook

The CADJPY cross in its 4-hour chart unveils the course in a corrective structure that resembles a triangle pattern (subdivided into 3-3-3-3-3). This potential triangle pattern remains unfinished and could be developing its wave (d) of Minuette degree labeled in blue.


From the previous chart, both the breakout and close above the descending trendline connect the top of wave (b) of Minuette degree with the end of wave b identified in green as the close above the level 79.872 could confirm the turning bias from neutral to bullish.

The advance in its wave (d) identified in blue could find resistance between 81.448 and 81.909. Once the potential triangle pattern completes, the price could advance toward 84.739 and even extend its gains until 86.677.

Finally, the upward scenario’s invalidation level is located below the end of wave (a) of the Minuette degree labeled in blue.

Categories
Forex Forex Market Analysis

EURAUD: Can we Profit from the Bear Side?

Overview

The EURAUD cross moves mostly bearish in a downward sequence that began in early October. The price action suggests that the cross could develop a new low before complete the bearish sequence still in progress.

Technical Big Picture

The EURAUD cross penetrated the sideways trading zone developing the second bearish leg of its three-wave movement that looks incomplete. Likewise, once the current bearish wave ended, the cross could start a new rally subdivided into a five-wave sequence.

The following chart represents the EURAUD cross in its 12-hour range, in which the sideways trading range goes between 1.60332 and 1.65744. This consolidation formation found its bottom on June 02nd, and its top corresponds to a pivot level that turned into a long-term key level.

Consequently, as long as the price keeps moving below this level, the short-term bias will continue being bearish. However, the May 29th breakout of the 1.67728 level, when the cross rallied topped at 1.68273, suggests the possibility of a new upward sequence.

Concerning its Elliott wave analysis, the current bearish sequence corresponds to an incomplete wave ((b)) of Minute degree labeled in black, which began when the price found fresh sellers at 1.68273.

Currently, the EURAUD cross advances in its internal wave (c) of Minuette degree identified in blue. Its completion could suggest a new rally that could drive the price toward the October high zone.

The short-term key supports and resistance levels are as follows:
• Resistance 1: 1.66856
• Resistance 2: 1.67824
• Resistance 3: 1.68724
Pivot Level: 1.65744
• Support 1: 1.64608
• Support 2: 1.63565
• Support 3: 1.62565

Technical Analysis Outlook

The short-term outlook for the EURAUD cross and under the Elliott Wave perspective exposes the bearish advance in the third wave of Subminuette degree identified in green, which belongs to the wave (c) of Minuette degree labeled in blue.

The following 3-hour chart shows the intraday consolidation activity that suggests the equilibrium between bull and bear traders. In terms of the wave theory, the consolidation structure should correspond to wave iv of Subminuette degree.

The Elliott wave structure suggests the possibility of a limited upside until 1.6460 and 1.6494, where the price could find fresh sellers expecting to join their limited positions with a potential target in the area between 1.63198 and 1.62201. This decline should complete the fifth wave that belongs to wave (c) identified in blue.

Finally, the invalidation level of the bearish scenario locates at 1.6573.

Categories
Forex Elliott Wave Forex Market Analysis

EURJPY: Can we Profit Short-Term?

Overview

The EURJPY cross advances in a corrective sequence that began on September 01st; this corrective movement looks incomplete. The short-term Elliott wave outlook foresees a limited recovery prior to its a coming decline corresponding to its fifth wave.

Technical Big Picture

The EURJPY cross, in its 12-hour chart, illustrates an incomplete downward sequence that began on September 01st when the price found fresh sellers at level 127.075. 

The previous figure exposes an upwards structural series subdivided into three-wave identified in Minute degree and labeled in black, which began on the May 06th low located at 114.397 and ended on the September 01st high when the price topped 127.075. 

Once the price found fresh sellers at 127.075, the cross started to retrace, developing a three-wave sequence identified in the Minuette degree labeled in blue. Until now, wave (c) doesn’t show bullish reversal signals, which lead us to expect further declines.

The short-term key supports and resistance levels are as follows:

  • Resistance 1: 123.160
  • Resistance 2: 124.233
  • Resistance 3: 124.999
  • Pivot Level: 122.377
  • Support 1: 121.144
  • Support 2: 120.271
  • Support 3: 119.311

Technical Outlook

The short-term outlook for EURJPY illustrated in its 3-hour chart reveals the intraday consolidation, which coincides with the progress of its fourth wave of Subminuette degree labeled in green.

In this regard, the market participants could mostly drive the price toward the supply zone between 122.550 and 122.890, from where the EURJPY cross could start developing the next decline corresponding to its fifth wave identified in green.

The potential target zone of the next decline locates between 121.038 and 120.051, which coincides with the base-line of the descending channel that extends from the September 01st high to date. 

Finally, the invalidation level of the downward scenario locates at 123.402.

Categories
Forex Market Analysis

Australian Dollar Prepares for Interest Rate Decision and Retail Sales Data Ahead

Overview

The Australian Dollar will face two high volatility events; the first one corresponds to the interest rate decision, for which the analysts’ consensus foresees a rate cut to 0.1% from the current 0.25%. The second one corresponds to September’s Retail Sales figures, where the consensus expects a recovery. Nevertheless, the price action suggests a new decline before reversing.

Market Sentiment

From a fundamental perspective, the Australian Dollar will have two high volatility events that will drive the next week’s oceanic currency movements.

The first event corresponds to the Interest Rate Decision, which will occur on Monday the 2nd during the overnight session. The analysts’ consensus foresees a reduction from the current rate of 0.25% to 0.10%. 

The last interest rate cut by the Reserve Bank of Australia’s broad members occurred in March 2020, where policymakers decided to cut the reference rate from 0.5% to 0.25%.

The second high impact will occur in the overnight trading session of Tuesday 03rd, where the Australian Bureau of Statistics will release the Retail Sales (MoM) data corresponding to September. The analysts’ consensus foresees a decline to 1.5%. 

Although the analysts’ polled foresee a contraction for September, they expect an improvement in the retail sector after falling 4% in August.

On the market sentiment side, the GBPAUD cross in its daily chart exposes the 90-day high and low range, which reveals the short-term participants’ sentiment. 

The previous chart illustrates the price action moving in an upward sequence that began on September 11th that pushed the cross from the extreme bearish sentiment zone toward the extreme bullish sentiment zone. 

In fact, the 60-day moving average movement below the price confirms the bullish bias that carries the cross. The next supports locates at 1.82688, which corresponds to the extreme bullish sentiment zone support, and 1.81227 corresponds to the 60-day moving average that acts as a dynamic support.

In summary, considering the pessimistic forecasts by the Australian data analysts and the extreme bullish sentiment unveiled in the GBPAUD cross, there exist the possibility of further weakness in the oceanic currency.

Technical Analysis Outlook

The big picture of the GBPAUD cross under the Dow Theory exposed in its 2-week log-scale chart reveals the price is moving mostly sideways since early March 2013, when the price touched its bottom of 1.43811. Once the cross found buyers, the price raised until 2.23722 reached in mid-August 2015. 

Once the March 2015 high was reached, the pair started to correct the Primary trend finding support at 1.57896 in late October 2016. This correction accomplishes the Dow Theory rule that says that the Secondary trend retraces between 33% to 66% of the Primary trend. 

The same situation occurs with the ascending sequence that advances from 1.57896 toward 2.08522 reached in mid-March 2020, which retraces beyond 66% of the previous decline. 

Likewise, the GBPAUD cross started to develop a downward sequence, which found a bottom at 66% of the previous rally. Nevertheless, considering the price and time relationship between the last decline and the previous two movements, we conclude that this decline corresponds to the Minor trend of the Secondary upward trend, which looks incomplete. 

The GBPAUD outlook under the Elliott Wave Theory exposes the progress in a downward five-wave sequence, which advances in its incomplete wave 4 of Minor degree labeled in green. This corrective structural series currently moves in its wave ((a)) of Minute degree identified in black.

Considering the elliott Wave theory, the current wave in progress should develop three internal segments and advance until the zone between 1.86783 to 1.90442, where the cross could find resistance and start its wave ((b)) in black.

Likewise, considering that the third wave of Minor degree is the extended wave, the fifth wave should fail to reach a lower low than the end of the third wave of Minor degree located at 1.74935. Finally, the invalidation level of the bearish scenario is located above 1.95100.

Categories
Forex Market Analysis

Dow Jones Turns Bearish As the US Presidential Election Approaches

Overview

The Dow Jones Industrial Average holds its bearish bias expecting the US presidential election scheduled next November 03rd. Throughout this year, the Industrial Average has declined over 6% (YTD). Although the latest decline looks like a short-term top, the US leading benchmark could resume its advances.

Market Sentiment Overview

The Dow Jones Industrial Average (DJIA) accelerated its declines on Wednesday’s trading session, backed by the market participants’ expectations before the US presidential election scheduled next November 03rd.

The following daily chart exposes the short-term market movements of the Industrial Average. The figure shows the penetration below the psychological level of 27,035.1 pts, which indicates the Dow Jones penetrating the bearish sentiment zone.

Simultaneously, the price action reveals its consolidation below the 60-day weighted moving average, which confirms the bearish bias. On the other hand, the re-test of the previous low located at 26,541 pts increases the likelihood of further declines.

The next daily chart unveils the 90-day high-low range of the Dow Jones Volatility Index (VXD). The figure shows the advance of VXD in the bullish sentiment zone, which confirms the bearish sentiment observed in the Industrial Average, as an increasing (bullish) volatility is mostly associated with declining prices.

Therefore, considering both the Industrial Average as the Dow Jones Volatility Index, the short-term market sentiment bias for the DJ-30 remains on the bearish side. The likelihood of extended declines would drive the DJIA toward the extreme bearish sentiment zone.

Technical Analysis Outlook

The big picture of the Industrial Average reveals that the retracement experienced during the last two weeks belongs to the bullish sequence that began on March 23rd when the Dow started its recovery, following the massive mid-February sell-off.

The DJIA’s technical outlook under the Elliott Wave Theory is unveiled in the following log-scale daily chart. We can see that the primary bullish trend that began with March 23rd’s low located at 18,213.5 pts, which is currently in progress.

In the figure, we see DJIA’s price consolidating in a sideways formation. This stage began once the Industrial Average topped at 29,193.6 pts on September 03rd.

On the other hand, we should consider that the sideways formation moves above the 25,570.2 level, or 33% of the bullish sequence of the primary trend. Therefore, the upward trend remains intact right now, and the current correction represents a pause and not a deeper correction for the US benchmark.

The below 4-hour chart shows the Industrial Average under the Elliott Wave perspective, developing an incomplete flat pattern (3-3-5) of Minute degree labeled in black that looks incomplete.

Currently, Dow Jones completed its wave (iii) of Minuette degree labeled in blue, which belongs to wave ((c)) of Minute degree. This structural series that remains in progress moves inside the wave B or 4 of Minor degree labeled in green.

Considering that the flat pattern looks incomplete, the Industrial Average should see a new lower low, which would reveal a bullish divergence on the MACD oscillator confirming the progress on the fifth wave of Minuette degree. After this move, the Dow Jones should develop a wave C or 5 of Minor degree with an internal five-wave sequence.

Therefore, short-term, we may expect a limited decline, likely toward the 26,050 pts, from where Dow Jones could start to develop a new rally in five waves.

Categories
Forex Elliott Wave Forex Market Analysis

Hang Seng Moves in an Incomplete Flat Pattern

Overview

The Hang Seng Index continues advancing mostly sideways in an incomplete bearish sequence, corresponding to a flat pattern sequence, still in progress. Once the current corrective formation ends, the Chinese benchmark will likely start developing a new long-term bullish cycle.

Market Sentiment Overview

The Chinese benchmark Hang Seng Index (HSI) shows a drop of over 12% (YTD). However, even when it has recovered 16 percent from the lows reached after the massive sell-off occurred during the first quarter of the year, the market sentiment of the Chinese benchmark index continues dominated by the bearish side. 

In the following Hang Seng’s daily chart, we can spot its 90-day high-low range. The figure exposes the index developing in a sideways movement happening since the second quarter of the year. On the other hand, the rejection of the 24,953.4 points suggests that the mid-term market sentiment is slightly bearish. 

Besides, considering that the Hang Seng Index moves on the 60-day weighted moving average, a short-term upward pressure is observed.

In conclusion, the Chinese benchmark’s market sentiment seems neutral, waiting for the price action to unveil the next trend’s direction.

Elliott Wave Outlook

Under an Elliott Wave perspective, Hang Seng’s big picture reveals the incomplete corrective movement from the end of a bullish cycle the Hang Seng Index initiated in mid-February 2016 from 18,278.8 pts. This bullish sequence ended its five-wave structural series when the Chinese benchmark reached its all-time high of 33,484.1 pts in late January 2018.

The next figure illustrates the HSI log chart on a 2-day timeframe. The price pattern reveals the Chinese benchmark moving mostly bearish on its wave (C) of intermediate degree labeled in blue, which seems incomplete. In this context, although HSI reached the minimum requirement for this movement: 100% of equal waves between waves A and C, the internal structure of its C wave is unfinished.

The following 4-hour chart exposes the internal structure of wave 4. We distinguish that the corrective structure has created two Minute degree segments, labeled in black on the figure. Considering that each leg follows an internal sequence subdivided into three waves, the Elliott Wave Theory leads us to expect its progression on a regular flat pattern.

On the other hand, short-term, the Hang Seng Index could develop a new upward movement subdivided into a five-wave sequence, which should complete the ((c)) wave of Minute degree labeled in black. Once this move ends, the Chinese benchmark could develop a new decline corresponding to a wave 5 of Minor degree, which should complete the (C) wave of Intermediate degree.

Finally, considering that the third wave of Minor degree labeled in green was the extended move, and considering the amplitude of wave 4, the fifth wave of Minor degree should not penetrate below the low of wave 3 located at 21,139.3 pts. In other words, the wave (C) of Intermediate degree identified in blue is likely not to end below 21,139.3 pts.

Categories
Forex Elliott Wave Forex Market Analysis

NZDUSD Short-Term Wave Analysis

Overview

The NZDUSD pair advances in a sideways corrective formation suggesting the progress in an incomplete short-term flat pattern. The completion of its move could give way to a new bearish movement of the upper degree; however, this incomplete correction could be temporary.

Market Sentiment Overview

The New Zealand Dollar moves slightly bullish this Thursday, 22nd advancing 0.13%, expecting the inflation data released by New Zealand’s Statistics, Stats NZ, in the upcoming overnight session. The data corresponds to the third quarter of 2020, and surveyed analysts expect an increase that could rise to 1.7% (YoY), being 0.2% more than the previous reading published in July.

The New Zealand Dollar futures market sentiment, presented in the following daily chart, unveils the price moving in the extreme bullish sentiment zone. In the chart, we can distinguish  0.6463 as support the level and 0.6797 as the resistance level. A level that corresponds to the 52-week high. 

On the other hand, the chart highlights the price action is moving mainly sideways, consolidating around the weighted moving average of 60 days. This context of price action suggests we can expect a corrective move before continuing its bullish trend.

Concerning the evolution of the Commitment of Traders Report, the previous chart exposes the institutional positioning on the bullish side. In consequence, although the current consolidation calls for a corrective move, the primary trend is bullish.

The next figure unveils that 73% of retail traders currently hold their positions on the bearish side, confirming a contrarian long-term upward bias to this pair.


Elliott Wave Outlook

The NZDUSD short-term outlook under the Elliott Wave perspective unveiled in its 3-hour chart exposes the kiwi’s sideways advance since the oceanic currency topped at 0.67978 on September 18th, where the pair started to develop a corrective structure that remains in progress.

Considering that a corrective structure is subdivided into a three-wave sequence, we can notice in the previous figure that the NZDUAD action progresses in its second wave, identified as wave B of Minor degree, and labeled in green. This segment corresponds to a flat pattern (3-3-5), which currently develops its wave ((c)) of Minute degree identified in black.

At the same time, the internal structure of the wave ((c)) reveals that the price action could be advancing in its wave (v) of the Minuette degree labeled in blue. This market context suggests the possibility of a limited upside before start developing a downward sequence, corresponding to wave C of Minor degree. 

In summary, the short-term outlook for the NZDUSD pair, under the Elliott Wave perspective, foresees a downward move, which corresponds to a wave C of Minor degree. This potential next move may subdivide into a five-wave sequence. Once this corrective formation completes, the Kiwi should begin to develop a new upward impulsive sequence of upper degree coinciding with the long-term institutional bias.

Categories
Forex Market Analysis

Russell 2000 Resume its Advances

Overview

Russell 2000 advances on the first trading session of the week, reporting gains over 2.6%. The market sentiment reveals to us the penetration in the extreme bullish sentiment zone, supporting the possibility of fresh upsides. In this regard, the Elliott Wave structure exposes an incomplete bullish structure supporting the likelihood of further rises.

Market Sentiment Overview

Russell 2000 advances over 2.6% in the first session of the week, easing the bearish sentiment that dominated the previous two weeks sell-off in where the U.S. index that groups to the 2,000 small capitalized companies plummeted over 5%.

The big picture of Russell 2000 exposes a divergence with the S&P 500. From the following weekly chart, we distinguish to Russell 2000 without confirming the S&P 500 record high at 3,588.8 pts reached on September 02nd. According to the Dow Theory, the fresh highs must be confirmed, and divergence must be considered an exhaustion or reversal signal of the current bull market. In this case, Russell 2000 remains without confirming the last record high reached by the S&P 500.

Although both indices move above the 26-week moving average, indicating the upward bias on the stock market, the S&P 500 remains moving in the extreme bullish sentiment zone while the Russell 2000 looks bouncing toward the extreme bullish sentiment zone. This market context carries us to expect for Russell 2000 the possibility that the price visits fresh highs, even surpassing the 1,600 pts.

The next daily chart of Russell 2000 unveils the price action bouncing from last July’s previous consolidation zone. The bullish reaction developed by the Russell leads us to foresee further upsides in the following trading sessions.

Simultaneously, the Fear & Greed index looks moving below level 50, which corresponds to the “fear zone.” This lecture added to the bearish sentiment of news media, leads us to expect a bullish reversal move.

Regarding the volatility side, the Russell 2000 Volatility Index reveals the extreme bearish sentiment zone penetration. This decline confirms the possibility of further declines to the area between 25.82 to 20.35, from where the price could find support.


In consequence, considering the penetration to the extreme bullish sentiment zone of Russell 2000 and the lowest level observed in the Russell 2000 Volatility Index, we expect fresh upsides in the U.S. stock market.

Elliott Wave Outlook

The short-term outlook under the Elliott wave perspective of Russell 2000 illustrates the advance on an incomplete five-wave sequence, which began on July 10th when the U.S. index found fresh buyers at 1,376.67 pts, starting the current bullish cycle that remains in progress.

From the 4-hour chart, we distinguish the completion of the second wave of Subminuette degree labeled in green. According to the Elliott wave theory, the canalization with its base-line from the end of wave (b) of Minuette degree identified in blue as the origin to wave ii in green and projected until the end of the first wave of the same degree should provide the target of the third wave. In this context, the potential third wave could advance to 1,617.06 and extend 1,707.29 pts.

Finally, the bullish bias confirmation will occur if the price closes above the last intraday descending trendline. At the same time, the current upward scenario will remain active while the Russell 2000 index keeps moving above 1,452.24 pts.


Categories
Forex Market Analysis

DAX Advances in an Ending Diagonal Pattern

Overview

The German benchmark index, DAX 30 advances in the extreme bullish sentiment zone accumulating gains over 60% after the German index gained support on the March’s low at 7,957.6 pts. In spite of the up-up-up market sentiment, the DAX develops an ending diagonal pattern that is still unfinished, suggesting the current upward trend’s exhaustion.

Market Sentiment Overview

DAX 30 continues its recovery following the German index drop to 7,957.6 pts, on March 23rd, which is the lowest level since late August 2013. From Mach’s low, DAX 30 advances over 60%.

The next DAX chart presents the German index in its daily timeframe illustrates the 52-week high and low range. The German index currently develops an upward movement in the extreme bullish sentiment zone. The short-term bullish sentiment is being confirmed by the 60-day moving average, which acts as support in the latest trading sessions.

The extreme bullish sentiment aided by the DAX surpassing the opening price of the year boosted the up-up-up sentiment in the news media added with the incomplete ascending wedge that remains in progress. These signals suggest the exhaustion of the current short-term bullish trend.

On the other hand, the daily chart of the DAX Volatility Index (VDAX) shows a mostly sideways movement in the extreme bearish zone. At the same time, the lateral consolidation pattern developed by VDAX, which remains unfinished, could experience a new decline raising the possibility of further upside in the German stock market.

Consequently, the German stock market sentiment is being dominated by extreme bullish bias. However, the incomplete ascending wedge pattern suggests the exhaustion of the upward movement.

Elliott Wave Outlook

The short-term outlook of the German stock market under the Elliott Wave perspective unveils the progress on an incomplete ending diagonal pattern, developing a new upward movement.

The DAX, in its 4-hour chart, exposes the progress of an upward corrective formation that follows an internal structure of a zigzag pattern of Minute degree labeled in back. The bullish move began in the March low when the German stock market plummeted until 7,957.6 pts. 

Currently, DAX advances in its fifth wave of Minuette degree labeled in blue, which, in turn, develops an ending diagonal pattern in its internal structure. This terminal formation, subdivided in a 3-3-3-3-3 sequence of Subminuette degree, identified in green, is seen advancing in its fifth wave. This pending upward movement agrees with the likely decline in the DAX Volatility Index.

Consequently, according to the Elliott wave perspective, our short-term outlook anticipates further upsides as long as the price stays above 12,737.5 pts. This potential upside could strike the 13,544.3 pts completing the wave ((c)) of Minute degree identified in black.

Categories
Forex Elliott Wave Forex Market Analysis Forex Technical Analysis

Gold Continues its Triangle-Pattern Consolidation

Overview

Gold continues on the fifth consecutive week of consolidation. The pattern is developing a contracting triangle which remains incomplete. The internal structure observed in this consolidation pattern suggests a limited upside before completing the corrective formation in progress.

Market Sentiment Overview

The price of Gold continues moving sideways by the fifth week in a row, testing the support on the extreme bullish sentiment zone of the 52-week high and low range. Although the precious metal eases 7.5% from its all-time high at $2,075.14 per ounce to date, the yellow metal report gains over 27.7% (YTD).

The following chart presents the yellow metal in its weekly timeframe. In it we distinguish the price movement testing the extreme bullish zone support located at $1,917.81 per ounce. This market condition leads us to expect a new decline for the coming trading sessions, finding support in the 26-week moving average, which currently moves in the $1,850.10 per ounce.

The potential decline in Gold’s price is backed by the strength of the U.S. Dollar Index, shown in the next intraday chart. In the figure, we observe the Greenback showing recovery signals moving above the 120-hour moving average.

On the other hand, the Gold Volatility index continues consolidating in a flag pattern. As discussed in our previous analysis, the current sideways movement, in progress, converges with gold’s consolidating formation, suggesting a new decline in the valuation of the precious metal.

Summarizing, the market sentiment for the yellow metal reveals the exhaustion of the extreme bullish sentiment that dominated the market participants’ activity until early August when the yellow metal reached its record high at $2,075.14 per ounce. At the same time, the recovery signals unveiled by the U.S. Dollar Index lead us to expect further declines in the precious metal.

Elliott Wave Outlook

The short-term Elliott Wave perspective for the yellow metal illustrated in the following hourly chart reveals a consolidation formation identified as an incomplete contracting triangle pattern.

In the hourly chart, we recognize the price action advancing in an incomplete corrective structural series, which began after the yellow metal topped at $2,075.14 per ounce from where the golden metal started to find sellers. The first decline corresponding to wave (a) of Minuette degree identified in blue found support at $1,832.62 per ounce. This bearish aggressively-looking leg alternates with wave (b), which still remains in progress.

The incomplete wave (b) in progress follows the internal sequence of a contracting triangle pattern, which currently ended its wave d of Subminuette degree labeled in green. According to the Elliott wave theory, the price should develop a marginal advance completing a wave e, in green, before continuing its bearish path. The limited upward move expected corresponds with the potential decline foreseen in the Gold Volatility Index, which shows a consolidation in the form of a flag pattern.

Categories
Forex Market Analysis

Dow Jones Declines Below an Ending Diagonal Pattern

Overview

The Dow Jones Industrial Average stopped its progress that started on the March 23rd’s low at 18,213.5 pts, from which it proceeded toward the 29,193.6 pts, reached on September 03rd. This movement made it recover its yearly losses that happened in the first quarter of 2020. The latest decline observed following the ending-diagonal breakdown leads us to warn about a likely bearish scenario.

Market Sentiment Overview

The Dow Jones Industrial Average stopped its advance from the mentioned recovery in our previous analysis. In our previous outlook, we commented about the divergence between the S&P 500 and the Industrial Average, which still did not reach a fresh record high as the S&P 500 did. As the following figure illustrates, the divergence observed between the two U.S. indices drives us to the conclusion that the last all-time high reached by the S&P 500 remains without confirmation by the Dow Jones. This situation carries us to expect the exhaustion of the current stock market recovery.


The next chart illustrates the Industrial Average in its daily timeframe. In the figure, we distinguish the market action moving on an extreme bullish sentiment zone, confirmed by its price action above the 60-day moving average. However, the latest sell-off negated the strike of the opening 2020 price easing near to 1.75% (YTD).

The breakdown observed in the Fear and Greed Index highlighted in yellow, signal the decline of the bullish sentiment prevailing during the previous stock market sessions. This reading adds to the context observed in the Dow Jones Volatility Index daily chart, which remains well in the bearish sentiment zone – above the 60-day moving average. This leads us to suspect that the recovery observed in the stock market is ending.

In consequence, from a market sentiment perspective, our position for the Dow Jones changes from bullish to neutral expecting the bullish continuation or bearish reversal confirmation.

Elliott Wave Outlook

Under the mid-term Elliott Wave perspective, the Industrial Average in its 4-hour chart reveals the completion on September 03rd of the fifth wave of Minuette degree labeled in blue, as the price topped at 29,193.6 pts., where Dow Jones found fresh sellers.

The last Dow Jones rally observed in the previous chart, developed in five waves, illustrates an ending diagonal pattern, which, after the price broke and closed below the line (ii)-((iv), dropped until the wave (iii) in blue. This movement leads us to expect further corrections in the U.S. stock market.

Simultaneously, the completion of the wave ((c)) of Minute degree in black and wave B of Minor degree in green points us to anticipate the development of a regular flat pattern, which follows a 3-3-5 structural sequence. In this context, Dow Jones might start to develop a new decline into five waves.

Finally, our central perspective for the Industrial Average remains neutral, expecting additional confirmation signals for the next movement. If the price action confirms a bearish continuation, the Dow Jones index could find support in 21,000 pts.

Categories
Forex Market Analysis

Gold Still Controlled by the Bull

Overview

The Gold price continues developing a sideways movement, which corresponds to an incomplete corrective structure that is still incomplete. Although there is an extreme bullish sentiment among market participants, the price of the golden metal could be poised to a decline in the following trading sessions.

Market Sentiment Overview

Gold prices continue moving sideways, consolidating above the psychological barrier of $1,900. The precious metal gains of over 28% (YTD) were boosted by the US Dollar weakness, which has dropped 5.47% (YTD) so far.

Gold, in its weekly timeframe, illustrates the market sentiment of the precious metal exposed by its 52-week high and low range. In the chart, we currently distinguish the market action moving mostly sideways, on the extreme bullish sentiment zone. The indecision candle that the yellow metal developed leads us to observe a state of equilibrium between the market participants.

On the other hand, looking at the volatility of the precious metal (GVZ) exposed in its daily chart, we observe the price action is consolidating in a flag pattern in the bearish sentiment zone. At the same time, we highlight the bounce GVZ developed from the extreme bearish sentiment zone toward the bearish zone in which currently is consolidating. We see that GVZ, moving above its 60-day moving average, shows an improvement in the investors’ sentiment.

The current market context observed in the Gold Volatility Index, which is consolidating creating a flag formation, added to Gold’s retesting of  $1,917.81 per ounce, corresponding to the support of the extreme bullish sentiment zone, leads us to expect a new decline in the price of the yellow metal.

Elliott Wave Outlook

The short-term outlook under the Elliott wave perspective and illustrated in its 2-hour chart exposes the sideways movement evolving an incomplete corrective structure, after the yellow metal touched its all-time high at $2,075.14 per ounce, reached on August 06th.

Once the precious metal topped at $2,075.15 per ounce, Gold completed its fifth wave of Minuette degree, and it is drawing a corrective sequence that remains incomplete. In the previous figure, we distinguish the aggressively developed first downward leg. This fast movement drove the yellow metal to ease over 10%, finding a bottom at $1,862.32 per ounce. That gave the pass to the wave (b), identified in blue, which remains in development.

The second leg of the incomplete three-wave sequence completed its first wave of a lesser degree at $2,015.65 per ounce, starting to retrace with a lower momentum. This decelerated movement observed in the wave b of Subminuette degree, identified in green, drives us to verify the alternation principle stating that a fast move should alternate with a slow movement.

For the coming trading sessions, we expect an upward movement that would complete the wave c of Subminuette degree, in green, which at the same time would end the wave (b) in blue. Once this wave ends, the price should start to decline in a five-wave sequence corresponding to wave (c) of Minuette degree, labeled in blue. This downward scenario agrees with the potential upside observed in the Gold Volatility Index chart.

Categories
Forex Market Analysis

NIFTY 50 Rallies with Extreme Bullish Sentiment

Overview

The Indian benchmark NIFTY50 index that groups the 50 largest capitalized companies of the Indian stock market loses over 6.6% during 2020. However, since March’s low at 7,511.10 pts, NIFTY 50 recovers over 51% and could visit the 12,000 pts in the following trading sessions.

Market Sentiment Overview

The Indian stock market led by the NIFTY 50 index underperforms 6.69% (YTD), recovering its losses from the massive sell-off starting last February, which dragged it to lose over 38% mid-March when the price found support at 7,511.10 pts. Once the Indian index found support, the price began to recover from its declines advancing over 51% to date.

The following chart exposes to NIFTY 50 in its daily timeframe moving above the 11,200.65 pts corresponding to the zone of extreme bullish sentiment. At the same time, from the figure, we distinguish the Indian benchmark moving above the 200-day and 60-day moving average, confirming us the bullish bias of NIFTY 50.

Considering that the extreme bullish sentiment prevails in the NIFTY 50 index, the price could advance toward the 12,000 pts as a psychological barrier, which coincides with a previous consolidation zone.

Elliott Wave Outlook

The big picture of NIFTY 50 under the Elliott wave perspective unveiled in the 2-week chart and log scale, exposes the advance of the Indian stock market in the fourth wave of Primary degree labeled in black. Once the price reached its all-time high at 12,430.50 pts in January 2020, completing its wave ((3)) of Primary degree began.

From the chart, we observe some extended waves developed by NIFTY 50 in each impulsive movement identified with ellipses. In the first wave of Primary degree, in its internal structure, the third wave corresponds to the extended wave. While in the third wave of Primary degree, watching inside of the fifth wave of Minor degree labeled in green, which belongs to the third wave of Intermediate degree in blue, corresponds to the extended wave. 

Finally, in the fifth wave of Intermediate degree, we recognize the first wave of Minor degree as the extended wave. In this context, the fifth wave of Intermediate degree could be confused with an ending diagonal pattern. Although the ending diagonal pattern tends to appear in a fifth wave or wave c, this case does not correspond to an ending diagonal pattern.

On the other hand, considering the previous corrective formations that look like a three-wave structural sequence, the current fourth wave of Primary degree could be a complex formation as a triangle pattern, which holds a 3-3-3-3-3 series. Under this scenario, our short-term outlook for the Indian benchmark foresees the bullish continuation, which could surpass the last all-time high at 12,430.50 pts. 

Once the price completes its wave (B) of Intermediate degree in blue, the Indian stock market could develop a sideways movement forming a potential triangle pattern. Once the corrective formation in progress ended, NIFTY 50 could resume its advances developing a wave ((5)) in black, which could see fresh all-time highs.