Categories
Crypto Videos

Origin Dollar Is Compensating Investors After The $7,000,000 Hack!


How Can DeFi Improve Adoption Rates? Origin Dollar’s Compensation Plan Announced

Decentralized finance stablecoin project Origin Finance announced its plan to compensate users affected by a $7 million exploit that happened in Nov.

On Nov 17, Origin Dollar announced that its yield-bearing stablecoin project had been the subject of a $7 million flash loan attack. While this attack is just another instance of the numerous hacks and exploits hitting DeFi projects this year, the Origin Dollar team’s response stands out as it intends to fully compensate the affected users.

In a blog post that came out on Friday, Dec 11, Origin Dollar product manager Micah Alcorn has laid out a multi-tiered plan that would immediately pay 75% of its users their lost funds, all denominated in Origin Dollar’s stablecoin OUSD.


On the other hand, for larger depositors, payments would be a slightly more complicated process, as they would involve a 1-year time-locked quantity denominated in the e-commerce utility token OGN. This means that whether or not these larger depositors will be 100% compensated for their loss will depend on the utility OGN token’s performance.

Even with the timelock included in the payout plan, Alan, a semi-anonymous core developer for the insurance-coverage protocol Cover, says that the effort coming from Origin might help attract new users to the DeFi space. 

He stated that this type of behavior sets a precedent that allows DeFi users to feel more confident in the platforms that they use, which would, in turn, help with the adoption of the protocols themselves. According to Alan, the Cover project he is working on has nearly tripled its total value locked ever since its users decided to cover the Pickle Finance hack.

Following the same trend, Nsure Network — another coverage protocol currently in testnet phase — has been doing great lately, rising nearly 60% on the month.

As the hack and fraud coverage tools develop, Alan recommends that developers take their time to seriously investigate launching projects with coverage plans and clear exploit contingencies as a core feature.

“DeFi needs to set a strong precedent that the protocols themselves need to be held accountable if they manage to get hacked, rather than its users. From what I’ve seen with the recent exploits happening, getting hacked simply means ‘Oops, we’ll make sure to patch this bug and do better next time’ to most projects. Having an “insurance fund” really brings comfort to users, as they now know that if the protocol gets hacked, their deposits are, at least to some degree, covered.” – said Alan.

If DeFi is ever going to truly break mainstream, these kinds of protections and contingency plans might be a requirement rather than just a luxury.

Categories
Crypto Daily Topic Cryptocurrencies

What Exactly is Proof of Keys?

In crypto, there’s a saying: “not your keys, not your coins.” This means that if you do not have sole custody of your private keys, you cannot really claim to have ownership over your funds. If your keys are with a crypto exchange or any other third-party custodian, you may as well forget about being the true owner of your funds. 

Many crypto owners today make the mistake of leaving their funds on exchanges. But considering the insecurity history of crypto exchanges, they are far from the safest place to keep your cryptocurrency. Millions, (or perhaps billions) worth of crypto has been lost through hacks on exchanges. The most famous one is Mt. Gox, in which people lost vast sums of Bitcoin and are yet to be compensated up to this day. And while that may be several years ago, crypto hackers are always upping the game. This is to say exchanges are not a safe place to store your crypto. 

So, how does that have anything to do with proof of keys? 

Understanding Proof of Keys 

Proof of Keys is actually ‘Proof of Keys Day’ in full. The event is the idea of crypto investor Trace Mayer, who came up with the concept so as to spread awareness of the need for crypto owners to practice self custody of their private keys and, in so doing, reclaim their financial independence. Proof of Keys is an annual celebration every January 3rd. 

Proof of Keys day is an idea geared at preventing crypto investors’ reliance on exchanges to store their funds. The first Proof of Keys event happened on January 3rd, 2019 – to intentionally coincide with the day of Bitcoin’s genesis block. 

In essence, Proof of Keys Day is a day to celebrate financial autonomy. The bigger picture is to remind crypto investors of the importance of keeping their private keys in their personal wallets. By having full control of their keys, they can rest assured that no one has access to their crypto holdings. 

Crypto holders have access to numerous types of crypto wallets – from online wallets to paper wallets to desktop wallets to hardware wallets. However, hardware wallets are the most secure options out there – and among the most reputable of these is Ledger, Trezor, and KeepKey. Hardware wallets are not connected to the internet. This renders them immune to hackings and other online vulnerabilities. 

What are the Intended Outcomes of Proof of Keys Day? 

The philosophy guiding Proof Of Keys Day is perfectly in step with that of Bitcoin: to eliminate third-party intermediaries and operate in a trustless electronic money transfer system where parties can operate securely and confidently without sacrificing their financial sovereignty. With that, let’s look at the intended outcomes of Proof Of Keys Day: 

#1. Teach new crypto investors how to move funds around

Crypto holders should be knowledgeable and comfortable enough to move their coins around. While this may be as easy as ABC for veterans, it can be intimidating for newcomers. From the (seemingly) complex key numbers to the wide range of wallets, it can all look absolutely bewildering. For this reason, Proof of Keys Day encourages investors to familiarize themselves with the different types of cryptocurrency wallets and how to use them. It also reminds them how the transfer of value happens on the blockchain. 

#2. Remind crypto holders to actually own their funds 

Like we’ve mentioned before, the main objective of Proof of Keys Day is to encourage crypto investors to take ownership of their private keys. When you leave your funds on an exchange, you essentially forfeit complete control of your money. Though it takes place only once a year, Proof of Keys Day is a chance for people to reclaim control of what’s theirs. 

#3. Expose dishonest crypto exchanges

Financial entities are known for fractional reserve banking – which is the practice of leveraging existing customer deposits by lending out more funds than what they truly have at hand. While this profits the institutions, it’s risky for the real owners of the money since a ‘bank panic’ could cause bankruptcy for the institution. In the crypto space, Proof of Keys Day could encourage holes of crypto investors to withdraw their money from exchanges. If enough investors do that, it may expose exchanges engaging in fractional reserve tendencies or those that lie about their actual reserves. That’s if the publicly verifiable nature of blockchain networks has not already done so.

#4. Celebrate Bitcoin’s genesis block

Last but certainly not least, Proof of Keys Day allows investors from all over the world to celebrate the Bitcoin genesis block – the first day a block was mined on the Bitcoin network. The genesis block was the first-ever Bitcoin transaction. In the transaction, Satoshi Nakamoto sent 50 BTC to Hal Finney – an early Bitcoin developer. It’s also, to an extent, a day to remember the first ‘commercial” Bitcoin transaction when somebody bought two pizzas for 10,000 Bitcoins.

How to Participate in the Proof of Keys Movement

Whether you’re a newcomer to crypto or a veteran, you’ll find that participating in Proof of Keys Day is very easy. Again the idea is to express financial independence by moving all funds from exchanges or other custodial services. 

To get started, take an inventory of all crypto coins you have on exchanges. This will show you who really owns what in regards to your money. Then, proceed to choose a crypto wallet of your choice. Ensure to choose a wallet that you’re comfortable with and one with a sufficient level of security. Next, transfer your funds from custodial platforms to your personal wallet. This means you can now control your private keys and, with them, your funds. 

Some crypto investors celebrate Proof of Keys Day, even if for one day. This involves moving their coins from exchanges for one day in a symbolic move to affirm their financial autonomy. Active traders are the ones more likely to engage in this kind of practice. This is because they need to have their crypto funds in exchanges to facilitate trades. After the symbolic transfer of funds to their personal wallets, they usually move them back to exchanges. But for long-term investors (HODLers), it’s better to keep their money in their personal wallets. 

Final Thoughts

Proof of Keys Day is a simple concept – but quite monumental in meaning. It’s a day to remind crypto holders to take back ownership of their funds by taking control of their private keys. Hordes of crypto investors participate in the event with a single goal of affirming their financial sovereignty. It’s a day to educate people and remind them about crypto security principles in general. 

Categories
Cryptocurrencies

Blockchain in Fashion  and Luxury Retail

Nearly every industry these days is discovering the potential and power of blockchain. Even fashion, which you may not expect, is slowly onboarding the tech. The fashion industry is one where fraud is all too common – at least when it comes to sourcing authentic materials. But putting aside the solving of problems, are there ways in which blockchain can make the fashion industry better?

In this article, we’ll discover that yes, there are. In fact, several brands are spearheading the shift to the blockchain, including the luxury jewelry industry. Whether it’s increasing transparency, giving fashion workers a fairer shot, reducing wastage, blockchain can do so much for fashion. 

With that, let’s dive into how blockchain can be good for the fashion industry. 

#1. Monitoring deliveries 

With blockchain, fashion companies can be assured of items and parcels, making their way to the desired destination. Participants to every delivery can monitor real-time where an item is. Having to wait for deliveries is a tedious and productivity-decreasing process. This becomes even worse when a project relies on several deliveries. It can be a tall order keeping track of every single delivery. And in case of losses, that might turn up bad real fast. 

Blockchain-powered tracking of deliveries and purchases can reduce the likelihood of losses and the confusion that arises from customers having to run around trying to retrieve persons that didn’t make it on time/at all. Every single step can be monitored on the transparent blockchain, where everyone can see the progress, making for an efficient and desirable experience for everyone involved.

 #2. Reducing counterfeits

The blockchain could help dramatically reduce counterfeits. In fashion, authenticity is highly valued, and in the future, a QR code to verify genuineness will be the standard. If an authentic item has been switched for a fake in the distribution process, it will be very easy for the blockchain to smoke that out. 

The Italian government recently pumped €15 million into blockchain technology to help reduce ‘Made in Italy’ counterfeiting in various industries, including fashion. The introduction of the technology will go a long way to protecting authentic ‘Made in Italy’ goods. 

#3. Reclaiming ownership

With the rise of nonfungible tokens (NFTs), people’s interest in blockchain ownership has also spiked. Blockchain allows people to own their data and intellectual and physical property in a trustless and verifiable manner. 

Fashion designers are already taking advantage of this possibility. Martine Jaelgaard, a London-based designer, incorporated QR codes in her garments, which allows them to be recorded and tracked on the blockchain. 

Paris-based Satoshi Studios sells high-quality sneakers that can be tracked using the blockchain using a QR code. This allows an individual to track the origin and supplies for the material and every process in manufacturing. 

#4. Provenance

The luxury industry of diamonds benefits from blockchain as companies use it to trace every step of the supply process. From mining to transporting to molding to sales, it’s easy to monitor every component of the process. 

Major diamond brand DeBeers is leading an industry-wide move into blockchain adoption, as blockchain-based diamond tracking platform Tracr becomes more influential. London-based diamond retailer Taylor & Hart has teamed up with blockchain company Everledger to authenticate the source of diamonds using the blockchain. Brilliant Earth, a San Francisco-based jewel retailer, is also using the Everledger platform for the same end. 

Such transparent processes ensure that buyers have more confidence in what they’re purchasing – together with its source, businesses in the diamond industry can keep their reputation. 

#5. Supply chain management

Blockchain can infinitely improve supply chain management for all kinds of industries. A lot has to do with transparency: it’s possible to track the movement of materials from the manufacturer to the retailer and, in some cases, ownership. 

Fashion giant Burberry recently partnered with IBM for a blockchain-based protocol that would allow customers to register their items and allow the viewing of the history and information about the garment and its impact on the environment and even people. 

The protocol, dubbed ‘Voyage’, allows customers to view an item’s supply chain before purchasing and registering them on the blockchain using corresponding serial numbers. Voyage is a pioneering information tool that will allow end-users to ascertain whether the right material has been used and if working conditions were good for workers.

#6. Improve employee welfare/reducing the recalling of products 

The transparency accorded by blockchain means fashion businesses can look at the data surrounding the supply chain’s employees. We hear reports all the time about poor working conditions or pay for workers all over the world. With blockchain in fashion, it will be easier to highlight concerns and improve employee welfare. This can include logging in the hours worked in the blockchain – and these hours being accounted for fairly. 

Also, blockchain-powered quality assurance can help prevent unnecessary costs, and items are less likely to depreciate in quality while being taken to the customer. 

#6. Blockchain-based warranties and coupons 

Maintaining open-source records of when goods were purchased could make it infinitely easier for manufacturers, retailers, and consumers to track when goods were purchased and keep records of warranties and guarantees. 

Customers will no longer have to hang on to physical receipts for years. All they will need to do is log into an account and access the same purchasing information as to their manufacturer and retailer.

Also, it will be easy for retailers to offer digital coupons to their customers. Such an issuance process is not only transparent; it also allows retailers to reach wider audiences in a more effective and cost-efficient process. 

#7. Consumer data ownership

Blockchain tech will help participants in fashion track items, but consumers can also have more control over their data. When fashion brands enter customer’s data on the blockchain, customers can view any activity surrounding it. 

This is incredibly important, especially in an era when concerns around data privacy become more prevalent than ever, and companies like Facebook face increased regulatory pressure around their treatment of user data. 

Final Thoughts 

Blockchain can offer so much to the fashion world. Between facilitating transparency to ensuring fair work practices to cost efficiency to the reduction of waste to improving customer experience, there’s no end in sight for the incredible potential of blockchain to positively disrupt the fashion world. Ultimately, the tech will serve to improve the relationship between brands and customers for the good of everyone involved. Blockchain can herald a new future for fashion. 

Categories
Crypto Market Analysis

Daily Crypto Review, Dec 16 – XRP Getting Crushed; BTC and ETH Stuck within a Range

The cryptocurrency sector was mostly stable today as Bitcoin kept within its trading range. Bitcoin is currently trading for $19,393, representing an increase of 1.13% compared to yesterday’s value. Meanwhile, Ethereum’s price has increased by 0.10% on the day, while XRP managed to lose a whopping 8.56%.

 Daily Crypto Sector Heat Map

XcelToken Plus gained 263.82% in the past 24 hours, making it the most prominent daily crypto gainer by far. It is followed by Amun Bitcoin 3x Daily Long’s 161.53% and rbase.finance’s 129.84% gain. On the other hand, Maximine Coin lost 99.42%, making it the most prominent daily loser. It is followed by STEM CELL COIN’s loss of 97.69% and Patron’s loss of 89.45%.

Top 10 24-hour Performers (Click to enlarge)

Bottom 10 24-hour Performers (Click to enlarge)

Bitcoin’s market dominance has moved up since our last report, with its value currently being 63.9%. This value represents a 0.4% difference to the upside than the value it had when we last reported.

Daily Crypto Market Cap Chart

The cryptocurrency sector capitalization has decreased slightly since we last reported, with its current value being $564.0 billion. This represents a $4.20 billion decrease when compared to our previous report.

_______________________________________________________________________

What happened in the past 24 hours?

_______________________________________________________________________

_______________________________________________________________________

Technical analysis

_______________________________________________________________________

Bitcoin

Bitcoin has continued trading within a range between $19,100 and $19,570, possibly hitting a wall of profit-taking institutional traders. Despite the overall bullishness of the market, the largest cryptocurrency by market cap failed to break the $19,666 level or even reach it. This is because of the increasing number of BTC Whales (holders of 10,000 to 100,000 Bitcoin) leaving the market and taking profit as the price approaches the $20,000 mark.

The sheer amount of resistance hovering above $19,500 will make it quite hard for Bitcoin bulls to push towards the all-time highs. In case the aforementioned push doesn’t happen, we can expect a possible dip towards $18,000.

BTC/USD 4-hour chart

Bitcoin’s overview on all time-frames is bullish, with its weekly time-frame being the only one completely bullish. The rest of the time-frames are slightly tilted to the neutral side.

BTC/USD 1-day Technicals

Technical factors (4-hour Chart):
  • Price is above its 50-period and slightly above its 21-period EMA
  • Price is between its middle and top Bollinger band
  • RSI is neutral (60.06)
  • Volume is average
Key levels to the upside          Key levels to the downside

1: $19,100                                 1: $18,600

2: $19,666                                 2: $18,190

3: $20,000                                  3: $17,800

Ethereum

Ethereum has hit a sell wall as well, stopping its upward price movement just below $600 for the third time in 3 days. The second-largest cryptocurrency by market cap is stuck between $581 to the downside and $600 to the upside, which is a very narrow range for long-term trading.

Ethereum will most likely experience a sharp break out of the current range, creating a potential safe trade with set parameters.

ETH/USD 4-hour Chart

Ethereum’s overview on all time-frames is bullish, with its daily time-frame being the only one completely bullish. The rest of the time-frames are slightly tilted to the neutral side.

ETH/USD 1-day Technicals

Technical Factors (4-hour Chart):
  • Price is slightly above its 50-period and at its 21-period EMAs
  • Price is at its middle Bollinger band
  • RSI is neutral (54.03)
  • Volume is slightly below average when compared to the previous week
Key levels to the upside          Key levels to the downside

1: $600                                     1: $581

2: $632                                     2: $565 

3: $636.5                                   3: $545

Ripple

XRP has continued its downturn, this time breaking the crucial $0.475 level. Its price has steadily decreased ever since Dec 1, when it could not break $0.683. This steady descent has created a downtrend, which many analysts think is the death of XRP’s price.

However, there is still hope for XRP. Some analysts believe that this is the 4th of 5 waves in a pattern that XRP started creating on Aug 20 and that the next wave will start an uptrend that will propel its price above $1.

XRP/USD 4-hour Chart

XRP’s longer-term technicals are tilted towards the buy-side, while its short-term technicals are tilted towards the sell-side. While its 4-hour time-frame is completely bearish, its daily overview is slightly more neutral.

XRP/USD 1-day Technicals

Technical factors (4-hour Chart):
  • Its price is currently well below both its 50-period EMA and its 21-period EMA
  • Price is at its bottom Bollinger band
  • RSI is close to the oversold territory (31.25)
  • Volume is well below its average level
Key levels to the upside          Key levels to the downside

1: $0.5                                      1: $0.475

2: $0.543                                   2: $0.45

3: $0.57                                    3: $0.425

Categories
Crypto Videos

Crypto!The 3 Best Key Indicators To Watch When Trading Bitcoin! No

3 Key Indicators to Watch When Trading Bitcoin


For the past week, Bitcoin’s price has been dancing around the $20,000 mark, which has led many traders to lose their patience. In the eyes of those traders, the current lack of bullish momentum is problematic, especially when considering that Bitcoin tested the $16,200 level roughly two weeks ago.

Experienced traders tend to look at several key indicators that serve as telling signs of a major trend reversal. These key indicators are:

  • The futures premium
  • Volumes, and
  • Top traders’ positions at major exchanges


While a handful of negative indicators do not precede every dip, there are some signs of weakness that show a trend reversal more often than not. 

Monitoring the futures contracts premium

The open interest of perpetual contract buyers and sellers is matched at all times in any futures contract. Simply put, there is no way an imbalance of any form can happen, as every trade requires both a buyer and a seller.

Funding rates ensure that there are no exchange risk imbalances. When sellers are the ones demanding more leverage, the funding rate goes negative. Therefore, the traders who want to be on the short side will be the ones paying the fees. The opposite is true, as well.

Sudden shifts to the negative funding rates indicate a strong interest in keeping short positions open. Ideally, investors would monitor a couple of exchanges at the same time to avoid eventual anomalies, no matter how rare they are.

By measuring how much more expensive futures contracts are versus the regular spot market, traders can gauge the bullishness level of the market.

The fixed-calendar futures usually trade with a 0.5% or higher premium when compared to regular spot exchanges. Whenever this premium decreases or turns negative, traders can consider this a red flag. Such a situation, also called backwardation, indicates strong bearishness.

Monitoring volume

In addition to constantly checking futures contracts, good traders also track the spot market volumes. Breaking important resistance levels while simultaneously showing low volumes is somehow intriguing. Typically, low volumes show a lack of confidence. Therefore, any significant price change should be accompanied by an increase in trading volume.

Top traders long-to-short ratio 

Another key metric that can be used is the top traders’ long-to-short ratio. This metric can be found at many leading crypto exchanges.

Traders should pay attention to changes in this metric rather than absolute figures as there are often discrepancies between exchanges’ methodologies.

As an example, a sudden move below the 1.00 long-to-short ratio should be a troubling signal. This is because the historical 30-day data, as well as the current 1.23 figure, favor longs.

As we mentioned before, the ratio can differ significantly between exchanges, but traders should watch changes in ratios rather than the absolute numbers themselves.

Unlike our previous example from Binance, it is common for OKEx top traders to hold levels below 1.00, all while not necessarily indicating bearishness. According to the 30-day data on this exchange, numbers below 0.75 should be cause for worry.

Conclusion

No set rule or method could predict every single spike or dip, but certainly, there are ways to improve your chances of improving your profitability when trading.

Monitoring the funding rate, spot volumes, as well as the top traders’ long-to-short ratio provides a much clearer view of the Bitcoin market as a whole, rather than simply reading candlestick patterns and monitoring general oscillators like the RSI and MACD.

This is mostly because the aforementioned metrics provide a direct gauge of professional traders’ sentiment, rather than just retail sector sentiment, and it is crucial to take them into account as Bitcoin tries to break $20,000.

Categories
Cryptocurrencies

What’s Ethereum 2.0 and Why Does it Matter? 

After a years-long wait, Ethereum 2.0 is finally here. Well, almost. The major upgrade will see the Ethereum network fix various scalability and security issues. The most notable shift will perhaps be moving from a proof-of-work (PoW) consensus mechanism to a proof-of-stake (PoS) protocol. 

But this is just a scratch on the surface. With Ethereum being one of the most important cryptocurrencies in the world, Ethereum 2.0 is set to shake up not just the Ethereum ecosystem but cryptoverse in general. 

Understanding Ethereum 2.0

Ethereum 2.0 is an upgrade to the Ethereum protocol. Also known as Eth2 or Serenity, the update is meant to improve the scalability and security of Ethereum. The current Ethereum blockchain, with the scalability of 15 transactions per second (TPS), can simply not handle the volume that would be required to handle millions of transactions per second. Eth2 will not just power dramatically more than that; it will also remove bottlenecks for developers and users.

Ethereum founder Vitalik Buterin and the team have been working on Eth2 for years now. This is because scaling a blockchain without sacrificing security and decentralization is not an easy task. Eth2 will address these issues through several important features that will be starkly different from the Ethereum we have now. 

What’s the difference between Ethereum and Ethereum 2.0? 

What will mainly distinguish the two versions is that Ethereum 2.0 will feature a proof-of-stake consensus, implementing shard chains and the beacon chain. Let’s look at each of these features in more detail. 

#1. Proof-of-stake 

Ethereum currently implements a proof-of-work consensus model to secure the network and maintain and facilitate an incentive mechanism to reward miners who confirm and validate transactions on the network. Unfortunately, PoW requires huge amounts of energy – which is not sustainable in the long run. 

PoS is a far faster and sustainable alternative to PoW. PoS involves granting stakers in the network the right to become a validator and get paid to verify transactions. Other validators can confirm the “minting” of the block. If there are enough confirmations, the block can be added to the blockchain. Validators will then be rewarded with block rewards for the successful block. 

PoS is a lot of times better than PoW when it comes to energy-efficiency. This is because, unlike PoW, there isn’t an energy-intensive process required to validate blocks. This is also good news for individuals who want to help secure the network. 

Another feature that a PoS model will enable security on Ethereum 2.0 not previously possible with PoW. PoW is susceptible to a 51% attack. The PoS model will not only reward validators for being honest; it will penalize attempts at fraud. One such penalty will be ‘slashing,’ which will not only involve the validator in question being forced out, but all/part of their stake will be penalized. 

#2. Sharding 

Individuals who wish to access the Ethereum network have to do that via a node. Nodes store a copy of the entire Ethereum network, meaning they have to download it. This takes up too much storage and slows things down. 

Shard chains act like the blockchain but only hold a specific subset of the blockchain in question. This means nodes only have to manage a ‘shard’ of the entire network. This goes a long way in increasing transaction throughput and enhancing scalability. 

#3. The beacon chain 

Shard chains will work in a parallel version. This necessitates a mechanism of sorts to keep them in sync with one another. Enter the beacon chain, which will facilitate consensus to shard chains. 

Beacon chain is a completely new, proof-of-stake blockchain rendering that will be the coordinator of the whole ecosystem. The chain will facilitate data sharing between the shard chains and facilitate scalability. The beacon chain will be the first roll-out feature of Eth2. 

How Ethereum 2.0 Will Be Rolled Out 

Ethereum 2.0 will not be released at once but rather in three phases. Each phase will feature a crucial feature to contribute to the success of the new blockchain. 

#1. Phase 0

Phase 0 constitutes the first rollout, and it will come down to the release of the beacon chain, which is central to the network’s functioning. The beacon chain will start accepting stakers’ deposits in preparation for the proof-of-stake consensus. All registered stakers will not be able to withdraw from the contract until shard chains are put in place. Afterward, staking deposits will be locked up until the next rollout. The Phase needed a minimum threshold of 524,288 ETH to launch. This target has already been met and even passed. 

#2. Phase 1/1.5

The next phase will be two phases combined: Phase 1 and Phase 1.5. Phase 1 will bring with it shard chains, which will allow validators to produce blocks via a PoS consensus. Phase 1.5 will officially now introduce shard chains and begin the transition from proof-of-work to proof-of-stake. This phase will be released in 2021. 

#3. Phase 2 

This will be the final phase, whereby the blockchain will fully support shard chains – which will have taken on new features and capabilities. The shards will have the ability to integrate with smart contracts, allowing decentralized applications (DApps) developers to mesh seamlessly with the network. This phase will be slowly rolled out in 2021 and beyond. 

When Will Ethereum 2.0 Be Released? 

The Ethereum 2.0 upgrade will start rolling out on December 1, according to a blog post by the Ethereum Foundation on November 4. The launch is conditional on at least 16,383 validators, each staking 32 ETH to make up 524,288 ETH. Vitalik Buterin led the way in depositing ETH, putting up 3,200 (worth more than $1 million), according to Etherscan, which tracks Ethereum transactions. See the launch pad where ETH is being deposited here

Ethereum enthusiasts are naturally excited about the launch and hope everything will fall in place. If the launch is successful, the Ethereum network as we know it will change a lot – and for the better. 

Closing Thoughts 

Ethereum 2.0 is a long-awaited update to the world’s second most popular crypto and blockchain network. Having been introduced to the world of smart contracts and DApps, the network has been the most popular go-to option for DApp developers worldwide. But in recent years, the network has been grappling with scalability issues that would have proven unsustainable in the long term.

The rollout of the new network will take a while, even longer than many expect. But as long as the train will soon leave the station – that’s good enough news for the community. 

Categories
Crypto Market Analysis

Daily Crypto Review, Dec 15 – Bitcoin Whales Stopping the Push Towards $20k; XRP on the Downturn

The majority of the cryptocurrency sector ended up being in the slight green since we last reported, with Bitcoin trying to reach the all-time highs (though so-far unsuccessfully). Bitcoin is currently trading for $19,106, representing an increase of 0.15% compared to yesterday’s value. Meanwhile, Ethereum’s price has decreased by 0.32% on the day, while XRP managed to lose 2.97%.

 Daily Crypto Sector Heat Map

Mandi Token gained 175.35% in the past 24 hours, making it the most prominent daily crypto gainer by far. It is followed by yTSLA Finance’s 169.53% and DefHold’s 129.84% gain. On the other hand, DistX lost 98.32%, making it the most prominent daily loser. It is followed by AC Index’s loss of 94.05% and YXO’s loss of 43.16%.

Top 10 24-hour Performers (Click to enlarge)

Bottom 10 24-hour Performers (Click to enlarge)

Bitcoin’s market dominance has moved up very slightly since our last report, with its value currently being 63.5%. This value represents a 0.2% difference to the upside compared to the value it had when we last reported.

Daily Crypto Market Cap Chart

The cryptocurrency sector capitalization has increased since we last reported, with its current value being $569.80 billion. This represents a $9.01 billion increase when compared to our previous report.

_______________________________________________________________________

What happened in the past 24 hours?

_______________________________________________________________________

_______________________________________________________________________

Technical analysis

_______________________________________________________________________

Bitcoin

Bitcoin had quite an interesting day as it (at one point) tried to push towards the all-time highs, or at least towards its next resistance level (sitting at $19,666). However, the sheer resistance near the $20k level was immense, and the largest cryptocurrency by market cap dipped to its immediate support level ($19,100), which is where it’s at right now.

The data provided by various sources point to Bitcoin whales blocking the way towards and past $20k, despite all the bullish sentiment currently surrounding the cryptocurrency.


BTC/USD 4-hour chart

Bitcoin’s overview on all time-frames is fully bullish, with its monthly time-frame being slightly more tilted to the neutral side than the rest.

BTC/USD 1-day Technicals

Technical factors (4-hour Chart):
  • Price is above its 50-period and slightly above its 21-period EMA
  • Price is near its middle Bollinger band
  • RSI is neutral (55.33)
  • Volume is average when compared to the past week
Key levels to the upside          Key levels to the downside

1: $19,100                                 1: $18,600

2: $19,666                                 2: $18,190

3: $20,000                                  3: $17,800

Ethereum

Ethereum was in the same boat as Bitcoin for the past couple of days, with its price movement mirroring Bitcoin’s. Ether tried to move towards the $600 mark, but got stopped out just below it, triggering a pullback to its immediate support level ($581). However, its downside is well-guarded, both by the $581 support level and the 4-hour 21-period moving average.

Ethereum will most likely continue mirroring Bitcoin’s moves in the short future, meaning that traders should either focus on trading Bitcoin or pay close attention to its movements while trading Ether.

ETH/USD 4-hour Chart

Ethereum’s overview on all time-frames is fully bullish, with its weekly time-frame being slightly more tilted to the neutral side than the rest.

ETH/USD 1-day Technicals

Technical Factors (4-hour Chart):
  • Price is slightly above both its 50-period and 21-period EMAs
  • Price is near its middle Bollinger band
  • RSI is neutral (53.74)
  • Volume is slightly below average when compared to the previous week
Key levels to the upside          Key levels to the downside

1: $600                                     1: $581

2: $632                                     2: $565 

3: $636.5                                   3: $545

Ripple

XRP is one of the cryptocurrencies that rarely mirrors Bitcoin’s movements, and that was the case in the past 24 hours as well. However, the fact that its price doesn’t mirror the largest cryptocurrency was bad news lately. XRP’s price continued its slow descent, this time breaking the $0.5 mark to the downside. At one point, there was an attempt to regain this level, which got shut down pretty quickly.

While the overall crypto sector is surrounded by bullish sentiment, XRP is looking quite bearish in the short-term. Shorting the fourth-largest cryptocurrency by market cap can be a valid trading strategy, simply due to its consistency going down in recent days.

XRP/USD 4-hour Chart

XRP’s longer-term technicals are completely bullish, while its daily overview is slightly more tilted towards neutrality. Its 4-hour time-frame, however, is slightly tilted towards the sell-side.

XRP/USD 1-day Technicals

Technical factors (4-hour Chart):
  • Its price is currently below its 50-period EMA and slightly below its 21-period EMA
  • Price is between its middle and bottom Bollinger band
  • RSI is neutral (37.98)
  • Volume is well below its average level
Key levels to the upside          Key levels to the downside

1: $0.5                                      1: $0.475

2: $0.543                                   2: $0.45

3: $0.57                                    3: $0.425

Categories
Crypto Market Analysis

Daily Crypto Review, Dec 14 – BTC and ETH Consolidating After A Bull Rally; XRP Left in the Dust

The majority of the cryptocurrency sector ended up in the green as Bitcoin spent the weekend regaining the value it lost after failing to break its all-time high with confidence. Bitcoin is currently trading for $19,144, representing an increase of 1.69% compared to yesterday’s value. Meanwhile, Ethereum’s price has increased by 3.61% on the day, while XRP managed to gain 3.77%.

 Daily Crypto Sector Heat Map

BDCC Bitica COIN gained 229.29% in the past 24 hours, making it the most prominent daily crypto gainer by far. It is followed by Ethereum Lightning’s 223.18% and Nuggets’ 190.36% gain. On the other hand, rbase.finance lost 72.18%, making it the most prominent daily loser. It is followed by COIL’s loss of 48.85% and SBank’s loss of 40.65%.

Top 10 24-hour Performers (Click to enlarge)

Bottom 10 24-hour Performers (Click to enlarge)

Bitcoin’s market dominance has moved up half a percent since we last reported, with its value currently being 63.3%. This value represents a 0.5% difference to the upside compared to the value it had when we last reported.

Daily Crypto Market Cap Chart

The cryptocurrency sector capitalization has increased significantly over the weekend, with its current value being $560.79 billion. This represents a $31.22 billion increase when compared to our previous report.

_______________________________________________________________________

What happened in the past 24 hours?

_______________________________________________________________________

_______________________________________________________________________

Technical analysis

_______________________________________________________________________

Bitcoin

Bitcoin has been on fire this weekend, with its price skyrocketing from its recent lows. The uptrend that started on Dec 11 brought its price from $17,600 all the way up to $19,400 before starting to consolidate. The steep ascending trend it created was unsustainable in the long run, so Bitcoin left it and continued trading sideways just above $19,100. The largest cryptocurrency by market cap is currently fighting for this level, with the previous five 4-hour candles holding above the support.

BTC/USD 4-hour chart

Bitcoin’s daily and monthly technicals show slight signs of neutrality on top of its overall bullishness. On the other hand, its 4-hour and weekly technicals are completely bullish.

BTC/USD 1-day Technicals

Technical factors (4-hour Chart):
  • Price is above both its 50-period and 21-period EMAs
  • Price is between its middle and top Bollinger band
  • RSI is neutral (59.17)
  • Volume is slightly below the average level
Key levels to the upside          Key levels to the downside

1: $19,100                                 1: $18,600

2: $19,666                                 2: $18,190

3: $20,000                                  3: $17,800

Ethereum

Ethereum has followed Bitcoin’s footsteps and created its own ascending channel, in which it moved from Dec 11 until Dec 13. The second-largest cryptocurrency by market cap has left this channel and started its own consolidation phase right above the $581 support level.

Ethereum’s moves seem like a mirror to Bitcoin’s moves, with slightly more or less intensity. Traders should be extremely careful of sudden moves Bitcoin can make that could disrupt their Ethereum trades.

ETH/USD 4-hour Chart

Ethereum’s 4-hour, daily, and weekly technicals overall bullish but show signs of neutrality or even some bearish indicators. On the other hand, its monthly technicals are completely tilted towards the buy-side.

ETH/USD 1-day Technicals

Technical Factors (4-hour Chart):
  • Price is above both its 50-period and 21-period EMAs
  • Price is between its middle and top Bollinger band
  • RSI is starting to descend after being close to overbought (58.72)
  • Volume is average when compared to the previous week
Key levels to the upside          Key levels to the downside

1: $600                                     1: $581

2: $632                                     2: $565 

3: $636.5                                   3: $545

Ripple

XRP performed much worse than Bitcoin and Ethereum over the weekend, with its short-term outlook being quite bearish. The fourth-largest cryptocurrency by market cap ended up losing $13.11% of its value week-over-week, with its price currently sitting at the $0.5 level.

XRP is currently fighting to stay above the $0.5 level, with its past four 4-hour candles managing to do this. Traders may be able to catch a trade in either direction when XRP confirms its position above/below $0.5 on increased volume.

XRP/USD 4-hour Chart

XRP’s 4-hour and daily overviews are heavily tilted towards the sell-side but still show some neutral indicators. Its longer-term technicals, though, are completely bullish.

XRP/USD 1-day Technicals

Technical factors (4-hour Chart):
  • Its price is currently below both its 50-period EMA and its 21-period EMA
  • Price is between its middle and bottom Bollinger band
  • RSI is neutral (37.98)
  • Volume is slightly below the average level
Key levels to the upside          Key levels to the downside

1: $0.5435                                 1: $0.5

2: $0.57                                     2: $0.475

3: $0.6                                      3: $0.45

Categories
Crypto Market Analysis

BTC/USD Weekly Chart Analysis + Possible Outcomes

In this week’s BTC/USD analysis, we will be taking an in-depth look at the most recent technical formations, as well as look for the possible short-term price outcomes.

Overview

Bitcoin has had quite a volatile week experienced yet another steep decrease in price as a continuation of the bear retracement after the cryptocurrency couldn’t post new all-time highs with confidence. However, the largest cryptocurrency by market cap has recovered from the decline in a matter of days, with its price over $19,000 once again.

While Bitcoin’s fundamentals only grew stronger as more and more institutional investors acknowledge it as a competitor to gold. This trend of large public companies investing in the best-known cryptocurrency has been seen throughout 2020, and many say that this is the sole reason for the current Bitcoin’s run.

Technical factors


Bitcoin is currently in a steep upwards-facing trend, which brought its price from $17,600 all the way to $19,000. While the channel is way too steep to be considered a long-term option, Bitcoin has the option to follow it for a little bit more, possibly riding the way up to the $19,666 major resistance (and a previous all-time high on Bistamp). This will most likely be the pivot point for Bitcoin, which will decide if it will try to tackle the levels above $20,000 or stay below it and seek support near $19,100.

Likely Outcomes

Bitcoin’s currently sending out very bullish signals, but we included a slightly bearish scenario as well, just to make sure all bases are covered.

1: In case Bitcoin heads further up, its price will most likely stop at the major pivot point, which sits at $19,666. This level is the all-time high from 2017 and is a major resistance level. From here, Bitcoin bulls will have to decide whether they will push towards the upside or remain below this level:

  • In case that the price moves further up, its next possible resistance level (there isn’t much resistance above $20,000, so all possible resistance levels will be extensions of the Fib retracements) is most likely to be sitting at around $20,750.
  • In case the price decides to stay below $19,666, we can expect it to move down and look for support at $19,100 or $18,600 levels.

2: If Bitcoin breaks the ascending channel early and pushes towards the downside, its first strong support level is $19,100 (which it will inevitably break if it pushes down and breaks the channel) and then $18,600.

Entering any short trades could be quite risky at the moment due to the bullish momentum Bitcoin has gathered. However, trading above $20,000 is equally as risky as Bitcoin would be entering a zone with no set resistance and support levels. However, entering long traders is certainly a safer option at the moment.

Categories
Forex Videos

Forex Trading Algorithms Part 3-Converting Trading Strategy To EA’s & Elements Of Computer Language!


Trading Algorithms – The Elements of a Computer Language – Part I


A computer language is a formal language to convert our ideas into a language understandable by a computer. Along with computing history, languages have evolved from plain ones and zeroes to assembly language and up to the high-level languages we have today.

Assembly language

Assembly language is a direct link to the computer’s CPU. Every assembly instruction of the instruction set is linked to a specific instruction code to the CPU.  

Fig 1. The basic structure of an X86 CPU. Source cs.lmu.edu

The CPU characteristics are reflected in the instruction set. For instance, an X86 CPU has eight floating-point 80-bit registers, sixteen 64-bit registers, and six 16-bit registers. Registers are ultrafast memories for the CPU use. Thus every register has assembly instructions to load, add, subtract, and move values using them. 

Fig 2- Example of assembly language

source codeproject.com

A computer program developed in assembly language is highly efficient, but it is a nightmare for the developer when the project is large. Therefore, high-level languages have been created for the benefit of computer scientists.

The Elements of a high-level language

A modern computer language is a combination of efficient high-level data structures, elegant and easy-to-understand syntax, and an extensive library of functions to allow fast application development.

Numbers

A computer application usually receives inputs in the form of numbers. These come in two styles: integer and floating-point. Usually, they are linked to a name called “variable.” That name is used so that we can use different names for the many sources of information. For instance, a bar of market data is composed of Open, High, Low, and Close. We could assign each category the corresponding name in our program.

Integers correspond to a mathematical integer. An integer does not hold decimals. For instance, an integer division of 3/2 is 1. integers are usually used as counters or pointers to larger objects, such as lists or arrays.

A floating-point number is allowed to have decimals. Thus a 3/2 division is equal to 1.5. All OHLC market data comes in floating-point format.

Strings

A string is a data type to store written information made of characters. Strings are used as labels and to present information in a human-understandable form. Recently, strings are used as input in sentiment-analysis functions. Sentiment analysis 

Boolean

Boolean types represent true/false values. A true or false value is the result of a question or “if” statement. It can also be assigned directly to a variable, such as in

buyCondition = EURUSD.Close[0] > 1.151

In this case, buyCondition is False for EURUSD closes below 1.151, and is True when the close value is higher than 1.151.

Lists 

We usually do not deal with a single number. If we want to compute a 20-period moving average of the USDJPY pair’s Close, we would need its last 20 closes. To store these values, the language uses lists (or arrays in C++). A list is an ordered collection of values or other types of information, such as strings.

Since Lists are ordered, we can refer to a particular element in the list using an index. For instance, if we were to retrieve the candlestick Close two bars ago of the USDJPY, we would ask for USDJPY.Close[2]

Sets

A Set is an unordered collection of elements. Sets do not allow duplication of elements. That means it eliminates duplicate entries. Not all languages have built-in Sets, although it can be made through programming if needed.

Dictionaries

Dictionaries are a useful data type that maps a key to a value. For instance, in Python 

tel = {‘Joe’: 554 098 111, ‘Jane’: 660 413 901} 

is a telephone structure. To retrieve Joe’s phone, we would write:

mytel = tel[‘Joe’]

with mytel holding 554 098 111

As with sets, not all high-level languages have built-in dictionaries, but a savvy programmer is able to create one.


In the next video of this series, we will explain the elements for flow control.


Categories
Forex Videos

Forex Trading Algorithms Part 2 Converting Trading Strategy To EA’s! From Ideas To Code!


Trading Algorithms -From Ideas to code


As we have already said, computers are dumb. We need to explain to them everything. Moreover, digital computers are binary. They only understand ones and zeroes. Nothing else. 

Compilers and interpreters

To make our lives easier, we have created interpreters and compilers, able to translate our ideas into binary. Basically, both do the same job. Compilers produce a binary file that a computer can later execute, whereas interpreters translate each instruction as it comes in real-time.

From idea to the algorithm

Usually, traders think about when to enter and exit trades. An example brought by George Pruitt in his book The Ultimate Algorithmic Trading System Toolbox is the following. A trader wanted a code to enter the market and told him: 

” Buy when the market closes above the 200-day moving average and then starts to trend downward and the RSI bottoms out below 20 and starts moving up. The sell-short side is just the opposite.” 

No computer would understand that. In this case, the idea was partially defined, though: To buy when the price was above the 200-day SMA, and the RSI crosses down below 20. But what did he mean by “downward trend”? or “starts moving up”?

Pseudo-code

The first step to make a trading algorithm is to create an approximation to the code using plain English, but with more concise wording.

In the example above, Pruitt says that he could translate the above sentence into the following pseudo-code after some calls to his client:

The number inside brackets represents the close x days before the current session; thus, [1] is yesterday’s close.

In the pseudo-code, close below close[1] and close [1] below close [2] and close[2] below close[3] is the definition of a downtrend. But we could define it differently. What’s important is that a computer doesn’t know what a downtrend is, and every concept needed for our purposes should be defined, such as a moving average, RSI, and so forth.

The code

The next thing we need to do is move the pseudo-code to the actual code. There are several languages devised for trading. MT4/5 offers MQL4/5, which are variants of C++, with a complete library for trading. Another popular language is Easylanguage, created by Tradestation, which is also compatible with other platforms, such as Multicharts. Another popular language among quants is Python, a terrific high-level language with extensive libraries to design and test trading systems.

The code snippet above creates a Python function that translates the above code idea. In this case, the myBuy function must be told the actual asset to buy ( which should point to the asset’s historical data), and it checks for a buy condition. If true, it will return a label for the buy and the level to perform the buy, the next open of the asset in this case.

Systematic or discretionary?

The steps from idea to pseudo-code to code is critical. If you do not have a working algorithm, there is no way you could create a systematic trading system. But this is only the beginning. Creating a successful automated trading system is very hard and involves many developing, testing, and optimizing cycles. The market shifts its condition, and not always your system will perform. Then, you have to ask yourself if you’ll endure the drawdown stage until the market comes in sync with the system again.

Some systematic traders think that the best way to attack the market is to have a basket of uncorrelated trading systems, which are in tune with the market’s different stages: low-volatility trend, high-volatility trend, low-volatility sideways, high-volatility sideways, so your risk and reward is an average of all of them.

In the coming videos, we will dissect the steps to create an automated trading system. Stay tuned!

Categories
Crypto Daily Topic Cryptocurrencies

What Exactly Are Dark Pools? 

The finance world has always been filled with curiosities. Money is a touchy subject, and people often go to extraordinary lengths to protect their positions. Out of this has emerged the concept of ‘dark pools,’ which are financial trading hubs taking place away from the public’s eye. 

What are dark pools? How did they come to be? We’ll be looking at that and more in this article. Importantly, we’ll see the role they’ve played in the crypto space, if any. 

Understanding a Dark Pool

A dark pool is a privately arranged venue/hub/platform where financial instruments’ trading is held. Dark pools are in direct contrast with public exchange markets, which are heavily regulated and have a lot of media visibility. A dark pool has no publicly available order book, nor is its trades publicly visible (or are only visible once executed). 

Dark pools’ liquidity is known as dark pool liquidity. Most dark pool trading is executed in block trades. A block trade is a particularly large volume trade, usually at a predetermined price. 

Dark pools hark back to the 80s when institutional investors used them to exchange huge amounts of securities. Dark pools allow traders to place large orders without letting them known their intentions first. This is important because the public knowing their intentions to buy or sell large volumes of a security could negatively impact the trade before they can get to carry it out. 

Dark pools have become a substantial part of global financial markets, and we’ll be debunking them further in this article, together with their application in cryptocurrency. 

Cryptocurrency dark pools

UK-based crypto exchange Kraken pioneered dark pools crypto in 2016. “Dark pool trading allows for orders to be placed out of sight so that traders can make large buy or sell orders (minimum of 50 bitcoin or 2500 ether) without revealing their sentiment to other traders. Advantages include reduced market impact and better price for large blocks,” said Joseph Powell, CEO. 

A few countries around the world have been friendly to the concept of crypto dark pools. This is saying something when you consider the crime reputation that cryptocurrency has. Bermudan digital asset exchange Omega One’s Dark Pool was awarded the country’s first-ever crypto exchange license: “We are now on-boarding select institutions, liquidity venues, and market makers with a trading volume of $10 million a month.”

Why Use Dark Pools? 

Let’s say an institutional investor, A, believes Bitcoin’s price will soon take a hit. They decide to sell $1 million worth of BTC to ride out the fall in price safely. But two problems are impeding this proposition. First off, selling such a large amount of BTC on any open exchange will impact the market one way or another. They don’t want to cause such a large ripple in the market. 

The other problem is, no buyers are willing to purchase such a huge amount of Bitcoin, at least immediately. So they will have to break down the sale into the more manageable pieces of $50,000 at a time, 20 times. 

This means: 

  • They will incur charges on all the 20 sales. 
  • The sale will affect the market and probably send retail investors offloading as well, causing the price to crash.
  • The sale could end up being more costly – it’s highly likely they will not be able to sell each BTC at the going price, but lower. 

If the institutional investor used a dark pool, they’d save themselves from the above unfortunate scenarios. Selling on an open market would expose them to potential loss and send a negative signal to the market. 

Advantages of using a dark pool

There are several benefits of taking it dark: 

  • Avoid impact on market sentiment: Traders who wish to make large trades can do so in a way that they do not send signals to the market.
  • Better prices: In a dark pool, both seller and buyer get better prices than they would in the open market. The buyer buys low, while the seller sells high.
  • No slippage: The majority of trades in dark pools are usually block-trades set at predetermined prices. Traders know they can execute the trade at the expected price.

Controversies surrounding dark pools 

  • Conflict of interest: Seeing as the order book is not publicly available, a trader has no way of knowing that a trade was completed at the best possible price. If the entity facilitating the trade has a conflict of interest, they can potentially obfuscate the real price.
  • Negative effect on markets: If a large part of trading is happening in dark pools, the real market price may not reflect reality. The finance market relies on the free flow of information, and if a huge part of trading is happening under the radar, the actual market is disadvantaged.
  • Vulnerability to predatory practices: Dark pools are perhaps the best playing ground for predatory practices. In particular, high-frequency traders who may have access to order book data can unfairly exploit unsuspecting traders. 
  • Enabling pinging: Dark pools enable pinging, a questionable practice that involves sending many small orders to obscure a big hidden order. Pinging is used to identify liquidity in order books and can have an unhealthy effect on the market.
  • Decreasing popularity: Dark pools are not growing more popular – quite the opposite. This means institutional investors might be moving away from the practice. When their existence is less compelling, their overall effect on the broader market is harmful.

Decentralized dark pools

Just like dark pools in the traditional finance market, dark cryptocurrency pools are available on some exchanges, as we previously mentioned. Unlike traditional dark pools, decentralized dark pools enjoy better and more secure verification. Such verification is powered by state-of-the-art cryptography. Also, crypto dark pools are run by automatic protocols that help maintain fairness for all participants and less likely to be manipulated by unscrupulous players. Zero-knowledge proofs and other cryptographic technologies ensure a high degree of transparency and integrity. 

If a trade involves more than one blockchain, it can be seen through by cross-chain atomic swaps that are not only cheaper but also remove the bloat associated with third-party intermediaries. Dark pools can also help in illiquid cryptomarkets by enabling traders to conduct high-volume trades without slippage. While a huge order would send a negative signal in an open illiquid market, it wouldn’t have the same effect in a dark pool. 

So far, dark pools haven’t had a major effect on the crypto markets due to the relative lack of institutional traders in the space. Whether this will change in the future is anyone’s guess. 

Closing Thoughts

Courtesy of their secretive nature, dark pools have been a source of controversy throughout their existence. When a part of investing and trading activity occurs underground, it can never be desirable on any market. However, with decentralized dark pools, we could potentially see a shift in not just how they’re perceived but their usefulness to various players. Open source approaches to dark pools could ensure that everyone uses the same rule book, alleviating much of the associated risk. 

Categories
Crypto Daily Topic Cryptocurrencies

How to Buy Ethereum Using PayPal

For years now, Ethereum has been the most sought-after cryptocurrency right after Bitcoin. And in recent months, the coin seems to be on an unstoppable rally – which has only doubled down after the news that the long-awaited Eth2, an upgrade to the network, will be rolled out in December. At the time of writing, ETH is trading at over $500, according to Coinmarketcap. The currency has been oscillating within that range, which is a big deal considering the coin began the year with a tepid $130 in value. 

This is to say that Ethereum is more relevant than ever and will continue to command a huge share of the crypto market, at least in the foreseeable future. It’s also to say that demand for the currency is quite high at this point. 

For investors who wish to grab a piece of the Ethereum pie, what are their options to do so? Given that PayPal is one of the most widely used payment options, is it possible in 2020 to purchase Ethereum with it? 

This article set out to establish that. What we discovered is that PayPal is not supported in many crypto exchanges. However, you’re in luck because there are 2 or 3 places where you can buy ETH with PayPal, including on PayPal itself! 

Best Places to Buy Ethereum Using PayPal

#1. LocalCryptos

LocalCryptos is a peer-to-peer (P2P) cryptocurrency exchange that allows users to buy and sell crypto. The platform has tens of thousands of traders exchanging crypto with each other via various payment methods – PayPal included. 

When you purchase Ethereum via PayPal on LocalCryptos, you’re doing so directly from another user. The process is pretty straightforward. You’ll need to: 

  • Select a Buy With PayPal offer (posted by another user)
  • Enter the quantity of ETH you’d like to buy 

LocalCryptos requires the seller to put the ETH in an escrow before they can receive payment. When they do this, you can then transfer money with PayPal. You’ll receive the ETH after payment confirmation. The crypto-buying process on LocalCryptos is safe, beginner-friendly, and convenient. 

#2. eToro

eToro is a trading platform previously famous for CFD trading but has become one of the most reliable places to buy crypto in recent years. eToro allows buyers to purchase several cryptocurrencies with PayPal, including Ethereum, Ethereum Classic, Bitcoin, Bitcoin Cash, Binance Coin, Cardano, Litecoin, Dash, and more.

The platform even provides a dedicated eToro wallet, though not for every crypto (yet). However, at least it supports Ethereum. This makes eToro beginner-friendly to buy Ethereum. However, let the wallet be a placeholder as you look for a more solid and secure wallet. It’s good practice not to let your crypto hang around any exchange for too long since exchanges are susceptible to all kinds of online vulnerabilities. For some of the best wallet options in the market, see here

#3. PayPal

In highly welcome news, PayPal announced in October that they would start supporting the buying, selling, and holding of Ethereum, Bitcoin, Bitcoin Cash, and Litecoin on their platform. They also signaled support for the currency as a funding source for millions of merchants worldwide. 

There’s a caveat, though: this functionality will first be only available to eligible US accounts. Ethereum enthusiasts in other countries who use PayPal may have to wait a bit longer. 

Cost and Safety Implications

Buying Ethereum with PayPal is generally safe, especially since you can always initiate a chargeback if the seller doesn’t release ETH. However, be sure to use the function only if necessary; otherwise, overstretching it could get your account blacklisted by PayPal. 

Final Thoughts

Ethereum is currently roaring, and by all indications – it will continue to do so in coming months (and most likely years). With the impending protocol upgrade and an already incredibly bullish run, the currency shows no signs of stopping. With PayPal being one of the ‘mainstream’ payment methods today, it’s gratifying to know you can purchase the currency using the platform. 

Categories
Cryptocurrencies

What’s a Bitcoin Improvement Proposal? 

Bitcoin was the world’s first cryptocurrency. It has completely changed how the world views finance while at the same time rallying an entire industry of cryptocurrencies. Bitcoin holds (and probably will always hold) a very special place in cryptoverse. However, just like any new tech, Bitcoin has its growing pains. For this reason, Bitcoin developers are always coming up with improvement proposals for the network to make it even better. 

However, this is not done in a random fashion. Nine years ago, a man named Amir Taaki wisely came up with what’s known as a Bitcoin Improvement Proposal (BIP) that anyone should follow to suggest changes to the Bitcoin ecosystem. This article looks at what exactly a BIP is and what it entails. 

What’s a Bitcoin Improvement Proposal?

A Bitcoin Improvement Proposal (BIP) is an established standard in which people can suggest changes to the Bitcoin protocol. Such a proposed change can be about any aspect, including soft forks, improved recovery phrase formats, the peer-to-peer layer, and so on. Usually, BIPs are made by crypto developers or generally people with advanced computing skills. 

A BIP is created by individuals who believe that they have an idea that could vastly improve the Bitcoin ecosystem. The first-ever BIP – labeled BIP 0001 was made by a person named Amir Taaki. In essence, BIP 0001 was the groundwork for future BIPs – including how they would work and the expected standards. Not every change to the Bitcoin protocol affects it, and not every change requires a BIP.  

How a BIP is Approved or Rejected

Every BIP is initially a draft submitted by one or more individuals. However, before it is a draft, it has usually undergone rounds of discussions on the Bitcoin development mailing list, Bitcoin social forums, etc. 

When the BIP author receives feedback from the community, they can change or improve it based on that feedback. If it’s a major protocol change, it will first have to be implemented as a trial. If community members reach a consensus on the proposal, it proceeds to implementation. The final stage will involve developers implementing the new BIP code and network participants choosing to download it. 

Types of BIPs

BIPs are usually recognized as belonging to three categories. Let’s take a look at each: 

#1. Standards Track BIPs

These are BIPs that seek to improve the Bitcoin protocol, things such as blocks, scaling solutions, verifying transactions, etc. As you can see, standard track BIPs really get to the core of Bitcoin and its underlying infrastructure. Due to this, if the community accepts these types of BIPs they can have a permanent/major impact on the cryptocurrency. However, thanks to Bitcoin being already solid and ‘mainstream,’ it can be tough for a standard track BIP to be implemented and put into motion. 

#2. Information BIP

These types of BIPs are mainly targeted at issues like the design of the protocol and general guidelines. What this means is that information BIPs do not target the heart of Bitcoin and its underlying tech. However, these BIPs are still important and can be helpful to the Bitcoin ecosystem. 

#3. Process BIPs 

As the name suggests, process BIPs are suggestions to the BIP process. In this way, process BIPs are a lot like Standards Track BIPs, except they apply off-chain. In short, process BIPs apply to issues related to bitcoin but not directly involved in the underlying tech and code of Bitcoin. 

Structure of a BIP

If you’d like to submit a BIP, you’re expected to follow a certain structure to do so. The structure consists of the following: 

#1. Preamble

A preamble is the first section of a BIP. Here, the author includes details such as the BIP number, title, metadata of the BIP, and the author’s contact information and identity (s). Info in this section is important because it makes the BIP organized and easier to be shared or looked up. 

#2. Abstract

This is a description of the BIP, and it’s usually 200 words or less. In the abstract, the author distillates the proposal in simple and brief terms. The essence of the abstract is for people to easily understand what your BIP is about and what the core message is. 

#3. Copyright

In this section, the author includes any relevant copyright info for the proposal. This could be publication licenses, and so on. If the author uses license info, they must detail it here and see to it that all legal parameters are adhered to. 

#4. Specification

In this section, the author talks about any new features or ideas proposing to the Bitcoin protocol. Here, readers should have their questions answered about what your idea is and why they should care. Indeed, the specification section is the flesh of your BIP. As such, the author needs to write this section so that it’s easy to understand and be taken seriously. 

#5. Motivation

This is where an author describes why their idea is an improvement to Bitcoin. Here, you need to talk about why the existing solution is not good enough and how your idea can improve it. This doesn’t mean that the majority of the community will be on board. Still, it’s in this section why you make your case for better for worse. Even before you think about coming up with a VIP, ensure your idea is persuasive enough. Otherwise, your BIP may not go anywhere. 

#6. Rationale

This section is in some ways similar to the above section. But instead of talking about why the idea is important, you explain how you reached the decision to create your own BIP. This could be the decisions you made concerning the design, how you pushed through perceived rejections to the proposal, and so on. In short, the rationale section is where you preemptively respond to your critics way before they get a chance to criticize your idea. 

#7. Backward compatibility

In this section, you inform readers whether your BIP is backward compatible. If it’s not, you should provide details about the incompatibilities, including how severe they are and how you plan to deal with them. 

#8. Reference implementation

In this section, the author should provide an example of the idea that other developers could implement in the future. In other words, this is where you demonstrate your idea and showcase it to the community. If you don’t have a completed example, then your idea won’t cut it. After all, people need to see the idea of working in real life and not have to imagine it. This means it’s good to have a reference implementation before you begin working on your BIP.

The Big Picture 

BIPs can be extremely valuable to the Bitcoin ecosystem, especially as Bitcoin continues to rise in value. If positive changes are made to the protocol, it could make the world’s most popular cryptocurrency even stronger. The reverse is true. 

Much of the BIPs submitted so far have been about scaling Bitcoin. Some of them have led to contentious disagreements within the community, leading to contentious hard forks such as Bitcoin Cash and Bitcoin Gold. Others like SegWit2x have been turned down by a majority of the community. However, others, like SegWit and The Lightning Network, saw the green light of the community. Such updates could prove very key for the Bitcoin scaling issue.

Categories
Crypto Market Analysis

Daily Crypto Review, Dec 11 – Bitcoin Fighting for $18,000; Crypto Market in the Red

The majority of the cryptocurrency sector has ended up being in the red as Bitcoin spent most of the day under the $18,000 level. Bitcoin is currently trading for $17,920, representing a decrease of 2.91% compared to our last report. Meanwhile, Ethereum’s price has decreased by 4.30% on the day, while XRP managed to lost 2.85%.

 Daily Crypto Sector Heat Map

Freedom Reserve gained 950.51% in the past 24 hours, making it the most prominent daily crypto gainer by far. It is followed by LBRY Credits’s 336.6% and Seigniorage Shares’ 117.99% gain. On the other hand, Basis Cash lost 87.95%, making it the most prominent daily loser. It is followed by xBTC’s loss of 55.09% and IterationSyndicate’s loss of 44.55%.

Top 10 24-hour Performers (Click to enlarge)

Bottom 10 24-hour Performers (Click to enlarge)

Bitcoin’s market dominance has moved up less than half a percent since we last reported, with its value currently being 62.8%. This value represents a 0.2% difference to the upside compared to the value it had when we last reported.

Daily Crypto Market Cap Chart

The cryptocurrency sector capitalization has decreased in the past 24 hours, with its current value being $528.97 46.31 billion. This represents a $17.34 billion decrease when compared to our previous report.

_______________________________________________________________________

What happened in the past 24 hours?

_______________________________________________________________________

_______________________________________________________________________

Technical analysis

_______________________________________________________________________

Bitcoin

Bitcoin has spent most of the day in a price descent after it failed to break the $18,600 mark. BTC bulls tried to pick the price back up but failed, which has caused another mini-dip, which brought the price as low as $17,721 on Bitstamp. The $17,780 level has proven itself as great support once again, and Bitcoin is now trading in a range between it and $18,190.

Due to the amount of support and resistance levels in a narrow price range Bitcoin currently has, a push towards either side could be a possible safe trade to catch.

BTC/USD 2-hour chart

Bitcoin’s short-term technicals are tilted towards the sell-side but show slight signs of neutrality. Its long-time technicals, however, are completely bullish.

BTC/USD 1-day Technicals

Technical factors (4-hour Chart):
  • Price is below both its 50-period and 21-period EMAs
  • Price is close to its bottom Bollinger band
  • RSI is dipping towards being oversold (36.77)
  • Volume is slightly above the average level
Key levels to the upside          Key levels to the downside

1: $18,190                                 1: $17,780

2: $18,600                                 2: $17,500

3: $18,790                                  3: $17,200

Ethereum

Ethereum has quickly stopped in its tracks towards $600 after hitting a brick wall at $581. The rebound pulled its price back below $565, as well as $545, which it is now fighting for. The fact that Ethereum is in a short-term bear run is confirmed by higher volume candles during price drops than during price spikes.

Our call from yesterday regarding Ethereum’s dip after dropping below $565 turned out as predicted. Traders should pay attention to Bitcoin’s movements and the ascending (red) trend line when trading Etheruem.

ETH/USD 2-hour Chart

Ethereum’s short-term technicals are tilted towards the sell-side but show slight neutral signs. However, its long-time technicals are bullish, with its weekly overview being slightly neutral than its monthly overview.

ETH/USD 1-day Technicals

Technical Factors (4-hour Chart):
  • Price is below both its 50-period and 21-period EMAs
  • Price is slightly above its bottom Bollinger band
  • RSI is dipping towards oversold territory (36.18)
  • Volume is slightly above the average level
Key levels to the upside          Key levels to the downside

1: $565                                     1: $545

2: $581                                      2: $525 

3: $600                                      3: $510

Ripple

XRP followed the rest of the crypto sector and made a price dip, which brought its price to the $0.543 level, which held up quite nicely. Its price is now recovering and consolidating between $0.543 and $0.57, with no signs of potential movement to either side.

XRP traders should pay attention to Bitcoin’s price movement, as most cryptocurrencies follow the general market direction it sets.

XRP/USD 2-hour Chart

XRP’s 4-hour and daily overviews show confusing signs, with some indicators being bullish and some bearish. Its long-term technicals are, however, completely bullish.

XRP/USD 1-day Technicals

Technical factors (4-hour Chart):
  • The price is currently below both its 50-period EMA and its 21-period EMA
  • Price is slightly below its middle Bollinger band
  • RSI is neutral (41.75)
  • Volume is slightly above the average level
Key levels to the upside          Key levels to the downside

1: $0.57                                   1: $0.5435

2: $0.6                                       2: $0.5

3: $0.63                                    3: $0.475

Categories
Forex Videos

Forex Trading Algorithms Part 1-Converting Trading Strategy To EA’s & Running Tests On Profitability

Trading Algorithms –  An Introduction


Almost all traders, novices and pros alike, know at least the basics of technical analysis. Still, not many know how to convert a trading idea into a set of rules and then test them for profitability.  This video series aims to be an introduction to algorithms applied to trading. Even if you are not considering creating one EA or trading bot, we think it is very interesting to be proficient in converting your trading idea into formal code and test it. We will use mostly pseudo-code, but also python, a very easy-to-learn but powerful high-level language, and Easylanguage, developed by Tradestation, which is almost as pseudo-code because it was designed to be read as a natural language.


What is an algorithm?

An algorithm is a set of rules to perform a task in a finite number of steps. Basically, an algorithm is a recipe.


For example, if we were to create an algorithm to make a phone call manually. A possible solution could be this :

1.- Open the phone
2.- select the keyboard
3.- dial each number from left to right
4.- Click the green phone icon
5.- Hear the calling sound

6.- Busy tone?
    A- no ---> wait  60 seconds for the answer.
        Did somebody answer?
                Yes--> Start a conversation
                    I - Conversation ended?
                            Yes --> Hang up.
                No --> Hang up
    B- Yes ---> Wait 120 seconds and go to 4th step

Algorithms  used in Trading

There are many ways to create Trading algorithms, including advanced sentiment analysis, evaluating the words used in trading forums and news releases. Still, we will focus on algorithms for historical price action data series.

 The ability to create, test, and evaluate a trading algorithm is a terrific ability to own. This allows creating market models that map and profit from the market’s inefficiencies. If you happen to find one set of rules that historically made profits, it could likely continue making profits in the future. This is the basic premise of automated algos, expert advisors, and trading bots.


Algorithm properties

  • Inputs: zero or more values can be externally supplied. Some algorithms don’t need inputs, although the majority will, and of course, a trading algorithm will need to get timely data from the market to generate outputs.
  • Outputs: at least one result should be delivered. That is logical. The output may not only be a text. It can be a picture, a sound, or a market trading order.
  • Unambiguous: Each instruction must be explicit, with a single meaning.
  • Finite: It ends after a limited number of steps.
  • The algorithm should precisely specify what the computer should do. The computer is not smart. It is dumb. You should tell it precisely the action it has to make.
  • Effective: Every instruction should be basic enough to be made by hand or uses other algorithmic sub-units with the same property. Of course, the action must be feasible, which means the computer can perform that action because the instruction is included in the instruction set of the programming language you’re using.

The key to a good algorithm, as with recipes, is to break the ideas down into simple building blocks.

Flow Diagrams

Algorithms can be more complicated than a simple recipe. Besides, a recipe is interpreted by a (supposedly) intelligent cooker. On the other hand, algorithms are to be interpreted by brainless CPUs. Besides, algorithms usually accept a stream of data inputs, which must be transformed until an output or output is produced.  Flow diagrams are a pictorial representation of the algorithm’s process and data flow.

A Flow diagram is a very handy tool to develop your ideas into coherent algorithms because it helps you spot potential flaws and improvements and should be the first step before proceeding to the actual code.


In the next chapters, we will continue developing this basic idea, applied to trading, using trading examples.


Further reading:

The Ultimate Algorithm Trading Toolbox, by George Pruitt.


Categories
Forex Videos

Forex Position Sizing Part 12 – Two Tier Optimal F Part 2


Position Sizing XIII- Two-Tier Optimal f Part II


In Two-Tier Optimal f part I, we discussed the virtues and drawbacks of optimal f trading. In this part II video, we will present a methodology that will almost ensure that our initial capital is preserved with the possibility of astonishing growth factors on our trading account. This content is exclusive, and, so far, you will not see it explained elsewhere.


System requirements:

This methodology is valid only with profitable strategies. This method is not a miracle solution for losing systems.

It works best when the risk is homogeneous. That is, the dollar risk is a constant R factor to the rewards.

The better the system, the higher the and smoother are the rewards.


The Two-tier Strategy

1.- We split the trading account un two portions. One portion ( 25% of the total in our case) will be used with Optimal f positioning. The other part will be applied to a 1% risk positioning.

2.- After a determined goal (2X, 5X, 10X, 20X of the Opt-f portion), the account will be rebalanced ( by adding both sub-balances together) and then re-split(25%-75%) to start a new cycle. The cycle will also reboot itself if the Opt-f section’s balance goes below 25% of the value at the beginning of that cycle.


What was the procedure to test the two-tier Opt-f position system?

We took the current Signal Table closes signals and created two 10K trading histories of what would have been one year of trading activity. Thus, resulting in two collections of 10,000m years of trading data. One of the collections was to be used with the Optimal f position sizing portion, and the other one was employed in the 75%-portion of the account. The Python code for the entire simulation is shown below.

We did this procedure using several targets for the balance of the portion traded using Opt-f: 2X, 5X, 10X, and 20X. We focused the results on the following parameters: Average final capital, max final capital, min final capital, average trades need to 10X total capital appreciation, average max drawdown, The drawdown with 1% probability of occurrence. In the below table, we also present the results of the 1% risk and 100% Opt-f strategies. ( click the image to enlarge).


Discussion

We see that the 1% risk strategy is not bad at all since it can multiply by five the initial balance in one year. It does this with an average max drawdown of 8.79 percent, with the odds of reaching a 16.2% drawdown on one every 100 years. We see also that, on average, it needs 664 trades to multiply by ten the initial capital.  

On all two-tier columns, we see a remarkable fact that the min final capital is 10,486. That meant that in all the 10K years of simulated market action, not a single one ended below the initial 10K balance. Thus, this strategy seems to protect us against the loss of the initial capital. That is a terrific psychological reinforcement to withstand the high max drawdowns it presents.  The use of the 2X goal is the best choice for the less bold investors, as this method offers an average max drawdown of 38.32%, with a 1% chance of reaching 59% drawdown.  After one year, the average final capital is $8.5 million, with a starting capital of only 10K.  This positioning strategy multiplies by ten the capital, on average, every 113 trades. The second best choice is a 5X goal.  That will more than double the yearly returns at the expense of a near 50% drawdown on average.   On the table, we can see that the more we increase the goals to rebalance, the more the account growth, but also the max drawdown.

We can see that these strategies’ growth is orders of magnitude lower than fully Optf position sizing. Still, the attractiveness of this strategy is that the odds of being smaller than 10K after one year of trading are virtually none.

More ideas

We used 1% as the size used in 75% of the total capital in the preceding trading sizing proposals. Of course, we could modify that to better profit from the total capital with almost no increase in drawdown and fully preserving our initial capital. You can make your own simulations on this to find the best fit for you. As examples, let’s present three more simulations using Optf/10, Optf/ 5, and Optf/2 with 2X rebalancing goals. 


In the image above, we see that using Optf/5 in 75% of the capital will deliver huge profits with 40%-63% Drawdown figures and 79 trades to 10X capital appreciation. All this with almost no chance to blow up the account. 

Final words

This video shows exclusive and never taught position sizing methodologies that protect the initial capital and offer vastly superior results to the 1% risk standard methodology.  But you must be aware that we are assuming the trading strategy is effective long term. The trader will also need to find the safest optimal f value by performing the proper computer simulations.

That also shows that position sizing is part of a trading system that really helps you achieve your monetary objectives. And for optimizing it, you need to know the optimal f of the system you’re using.

Of course, the market will limit the trading size we can reach without influencing it, but as theory, these methodologies are real wealth multipliers for the serious trader.

To employ a two-tier methodology in the real market, you will need to be fully organized, have an appropriate spreadsheet to follow the trade results, have two split balances, and compute the size of the coming positions.

Categories
Cryptocurrencies

Monero Reaches 2-Year High, Is It the Next-Best Alternative?

Recently (Oct 2020), Monero hit $139 – its 2-year high, and investors are expressing renewed confidence in this crypto. What’s even more inspiring is the fact that the cryptocurrency has maintained a consistent sideways or upward – but not downward – trend since then. Before the 2017 crypto bull run, Monero always shied from surpassing the $1 mark. But the boom seemed to have inspired this crypto to take on the major players. 

On the other hand, investors are all over the place scrambling for Bitcoin, partly why it is currently shining in glory. While most of those jumping onto the Bitcoin frenzy might be a bit late to the fiesta, the case could be different for Monero investors. Could it be the next-best alternative to Bitcoin at the moment?

Let’s take a closer look at this crypto and determine whether it can give Bitcoin a run for its money.

What Makes Monero Special?

Monero was invented in 2014 with one goal: to facilitate private and anonymous transactions. But Bitcoin was already doing that! Well, not quite. Bitcoin was thought to be anonymous, but that is not the case. With the Bitcoin blockchain (and many others), it is possible to trace the transaction’s origin because the blockchain is transparent. 

Monero, on the other hand, provides a high level of obscurity for transactions. We can’t say that it is impossible or not to tell the source of an XMR transaction, but as of now, that possibility remains a matter of conjecture. 

In this age, users seem to cherish privacy, even when they are doing nothing illegal. As Monero positions itself as one of the most private and anonymous cryptocurrencies, it is gradually becoming a darling to many. 

Other than providing unmatched privacy and anonymity, Monero is also cheap, fast, and easy to use – qualities that appeal to both neophytes and seasoned users.  

The Sudden Interest in Monero

It’s not only speculators and investors who have expressed increasing interest in Monero – hackers and regulators are also realigning their strategies around this crypto. For instance, Sodinokibi, a ransomware (criminal hacking) group, recently announced that they would start taking ransom in Monero instead of Bitcoin. They added that their decision to abandon Bitcoin was based on privacy issues, which Monero does not face. 

If you follow dark web affairs, you know that there is a close relationship between cryptocurrency adoption for illegal activities and the growth of Monero. This can be evidenced by Bitcoin’s momentary decline in 2013 after Silk Road, one of the largest black markets, was seized by the FBI. If we draw parallels between BTC’s adoption in the black market and Monero’s interest in the underworld, there can be no denying that Monero will soon become a much sought-after gem. 

Authorities are also showing interest in the crypto, albeit not for investment purposes. In September, the US Internal Revenue Service announced that it’s giving out a bountiful reward to anyone who can help them trace the source of Monero transactions. Europol also reported that Monero is fast rising as the standard for dark web transactions.

These events suggest that XMR’s adoption is likely to increase. With increased adoption comes increased volumes, market capitalization, and prices. 

Monero’s Historical Performance

The coin was launched in 2014, exchanging at about $2 or 0.005 BTC. After struggling for several years, the 2017 crypto bull finally came to its rescue, raising its value to over $400 at some point. However, XMR’s performance against BTC had started rallying way before the crypto boom. Since mid-2016, XMR had already started gaining against Bitcoin. This was a noteworthy trend since XMR has largely maintained its growth against BTC.

The crypto has also grown its 24-hour trading volumes tremendously. Just a year ago, Monero seemed to struggle to reach $100 million in daily transactions. Even during the 2018 peak when it was fetching $400 in XMR/USD trades, daily volumes hardly surpassed $200 million. At the time of writing, XRM was exchanging at only $116, but the 24-hour volume was hitting over $2 billion. In other words, 24-hour volumes have increased 20-fold in 12 months. There is no doubt investors are increasingly trying out this alternative. 

XMR/USD or XMR/BTC?

If you are convinced that Monero is a worthy alternative to Bitcoin, there’s one crucial decision you need to make – and that is whether to trade XRM with Bitcoin or with USD. After all, most exchanges that list XMR offer both pairs. It is important to evaluate this decision because XMR’s relationship with BTC and USD hasn’t been linear – there are times when the crypto has fetched more BTC than the equivalent in USD. In fact, this has been the case during most of its lifetime, except for the last few weeks where Bitcoin has grabbed headlines for its performance. 

Based on the historical exchange rates, it would be more profitable to exchange XMR with BTC when selling than with USD. However, owing to the trend reversal in the last few weeks of Bitcoin’s glory, it is important to watch how the curve extends. 

Concerns You Might Consider

While Monero is generally promising, there are two major concerns you might want to evaluate before picking it as an alternative to Bitcoin. 

#1: It might not be available on your favorite exchange – Due to the crypto’s high level of privacy, some major exchanges do not list it. This is especially true for exchanges that seek to comply with regulators. As we have seen, Monero is increasingly becoming popular in the underground economy, and reputable exchanges might want to distance themselves from it.

#2: Monero is widely associated with facilitating illegal trade – When you mention that you are a Monero, Zcash, or Dash investor, chances are you might be mistaken for being part of the dark web economy. Well, this won’t dampen your chances of successful crypto investment, but it’s worth keeping in mind all the same.

Final Thoughts

Monero is one of the fast-rising altcoins besides the fact that it has had a good track record in financial performance. In 2020, the coin has grabbed regulators’ attention due to its increased adoption in the underground economy. At the same time, the coin has consistently gained against both the USD and BTC throughout the year, save for the last few weeks where it has lost slightly against BTC. Also noteworthy is that the crypto’s daily volume has increased more than 20 times since the beginning of the year – signaling its increasing adoption. Although there might be a few concerns regarding the use of this cryptocurrency for covert activities, there is no denying it is a worthy alternative to Bitcoin.

Categories
Crypto Daily Topic Cryptocurrencies

How to Buy Bitcoin with a Credit/Debit Card

Credit/debit cards have enabled us to make instant, convenient, and hassle-free payments since the founding of the Diners Club in the 1950s, and today, this possibility has been extended to the purchase of Bitcoin. Buying Bitcoin with a credit card is among the easiest ways to get yourself some crypto. 

But where can you buy Bitcoin using a credit card? And is it safe? What about transaction costs? We’ll look at these concerns and more in this article.

How You Can Buy BTC with a Credit Card

When it comes to buying BTC with a credit card, there are two main possibilities. 

i) Direct payment – This is the least confusing option. With direct payments, you go to the exchange’s website, make your purchase and use the Visa/MasterCard/AmericanExpress (or just the cards that are available) option. The checkout process will be similar to buying anything else with your credit card. 

ii) Through a payment gateway/ payment service provider – For reasons such as cost savings, bonuses, and offers, you might want to pay through a payment gateway or money transfer service provider such as PayPal and Skrill. If you’re new to buying BTC, or if you’re buying just a few coins, this long route might not make much sense. However, if you are a high-stake investor, you might want to take advantage of any slight margins, although with increased inconvenience.

To buy Bitcoin with your credit card through a payment gateway, you’ll need to load your payment gateway’s account with funds first. Then, when checking out from your exchange, you choose to pay with Skrill/PayPal or whichever method you’re using. 

Best Places to Buy BTC with a Credit Card

Most likely, you will be buying Bitcoin from a crypto exchange like Coinbase, Kraken, or eToro. There are other methods, such as buying from individuals, but we’ll be focusing on exchanges.

That said, the following are among the best exchanges where you can Bitcoin using your credit card. These exchanges have been selected based on ease of use, buying limit, security, and transaction costs. The exchanges are not ranked in any particular order.

#1. Coinmama

Purchases made with credit cards usually have various limits to mitigate fraud. Coinmana offers among the highest purchase limits. The exchange is also available globally, which makes it a convenient option wherever you are. Additionally, the exchange has a reputation when it comes to reliability and trust among its user community.

When buying BTC on Coinmama, you will need to register/ sign in and create a crypto wallet on the platform. Then, when you get to the step of selecting a payment method, you’ll be required to choose from either Visa or MasterCard. Card payments are instant and attract a 5% processing fee. This cost is a bit high compared to going through a payment provider such as Skrill (Skrill charges 2.5% of the transaction value). Nevertheless, the experience is swift.

#2. Coinbase

Coinbase allows you to buy up to $150 or €150 worth of BTC per week. Debit card payments are accepted in all countries where Coinbase operates. However, you cannot buy BTC with a credit card if you reside in the US, Canada, Australia, and anywhere within Europe. 

If you want to buy BTC on Coinbase using your card, you will need to set up your user profile and link your credit/debit card. Later on, when you are actually buying BTC, you will select your already-added card at checkout. Transactions cost 3.99% regardless of the amount, and settlement is instant. The buying experience on Coinbase is also smooth.

#3. Bitpanda

Bitpanda is another reputable exchange where you can buy BTC using your card. First, you will need a Bitpanda account to buy BTC. Once you log in to the account, you can navigate to the ‘Buy’ tab on the menu. Bitpanda allows you to add the payment method during checkout, so you don’t have to link your card in advance. 

After selecting ‘Buy,’ you will see large buttons with the names of some of the major cryptos and other buttons for payment methods. You will need to make the appropriate selections to proceed. If you pay by card, both credit and debit cards are supported, but it must be Visa/MasterCard. Once you have selected your card, the rest of the process is easy to complete. 

Bitpanda offers one of the most secure card payment options. To make a card payment for crypto purchases on this exchange, your card must have 3-D Secure verification enabled. Note that there’s nothing you can do if your card does not support this protocol (other than look for another exchange).

#4. CEX.io

CEX.io is one of the earliest cryptocurrency exchanges to exist. Even so, it has never moved its operations beyond Europe, some countries in South America, and some states in the US. It is still a great place to buy BTC using your card if you are from any of these regions

CEX.io boasts of unmatched security and trust. The exchange is registered in the US as a Money Services Business. In the UK, it is incorporated as a private limited company. CEX.io is also PCI-DSS compliant. PCI-DSS is the global security standard for card payment providers. Due to the company’s focus on security and compliance, user experience is adversely affected. For instance, transaction verifications can take up to 30 minutes. 

Security/ Safety

The security and safety of your credit/debit card are paramount. Generally, buying crypto using cards is not riskier than using your card for your regular shopping. However, it is important to do the basic checks to ensure that you are dealing with legitimate and reputable exchanges. 

When using your credit card to buy Bitcoin, you will inevitably share your details with your exchange. Thus, it is essential to ensure that you’re dealing with a legitimate exchange, and two, the exchange is reputable. If you leave your card details with a shady exchange, how can you be sure that your card details will not be used for fraudulent purchases?

Final Thoughts

Credit/debit cards are a relatively easy and convenient option for paying for your Bitcoin purchases. This payment option is also supported by most major exchanges like Coinbase, Coinmama, and Bitpanda. Additionally, paying for BTC with your card is safe, as long as you’re dealing with reputable exchanges. On the downside, cards have restrictive transaction limits, which may disadvantage large buyers. Also, some exchanges do not accept credit cards from certain countries. Whichever the case, you can always find an option among the many. 

Categories
Crypto Market Analysis

Daily Crypto Review, Dec 10 – Bitcoin Bulls Back in the Game as Sector Recovers From The Dip

The cryptocurrency sector is mostly green as cryptocurrencies took the day to recover from the sudden drop that occurred on Dec 8. Bitcoin is currently trading for $18,411, representing an increase of 1.25% compared to our last report. Meanwhile, Ethereum’s price has increased by 3.37% on the day, while XRP managed to gain 4.66%.

 Daily Crypto Sector Heat Map

WinCash gained 207.65% in the past 24 hours, making it the most prominent daily crypto gainer by far. It is followed by Nyan V2’s 181.02% and Pamp Network’s 172.94% gain. On the other hand, DMme lost 68.63%, making it the most prominent daily loser. It is followed by ALL BEST ICO’s loss of 64.69% and Moonday Finance’s loss of 54.48%.

Top 10 24-hour Performers (Click to enlarge)

Bottom 10 24-hour Performers (Click to enlarge)

Bitcoin’s market dominance has moved to the downside just under half a percent since we last reported, with its value currently being 62.6%. This value represents a 0.4% difference to the downside compared to the value it had when we last reported.

Daily Crypto Market Cap Chart

The cryptocurrency sector capitalization has increased significantly in the past 24 hours, with its current value being $546.31 billion. This represents a $10.23 billion increase when compared to our previous report.

_______________________________________________________________________

What happened in the past 24 hours?

_______________________________________________________________________

_______________________________________________________________________

Technical analysis

_______________________________________________________________________

Bitcoin

Bitcoin has spent the day slowly moving up after a sharp price descent, which brought it to $18,000. After establishing itself above $18,190, Bitcoin even tried to push further up above $18,600 but failed almost instantly, making its price go back to previous levels.

We want to point out (once again) Micheal van de Poppe’s call of a large CME gap looming between $18,275 and $16,995.

Due to the amount of support/resistance levels Bitcoin currently has, any push towards either the upside or downside could be a possible safe trade in the same direction.

BTC/USD 2-hour chart

Bitcoin’s daily, weekly, and monthly technicals are completely tilted towards the buy-side and show no bearish signs. Its 4-hour overview, however, is completely bearish.

BTC/USD 1-day Technicals

Technical factors (4-hour Chart):
  • Price is below both its 50-period and 21-period EMAs
  • Price is between its middle and bottom Bollinger band
  • RSI is has recovered from being oversold (43.38)
  • Volume is slightly above average
Key levels to the upside          Key levels to the downside

1: $18,600                                 1: $18,190

2: $18,790                                 2: $17,780

3: $19,000                                  3: $17,200

Ethereum

Ethereum has not only recovered from its drop to $530, where it hit the ascending (red) trend line but pushed back towards $600. Even though the price is not yet ready to tackle this resistance level, it has made an attempt to break the $581 level but failed and returned to the $565 one.

Ethereum traders should pay attention to whether the cryptocurrency will end up above or below $565, which may be an indicator of its short-term movement. Traders should also pay attention to Bitcoin’s movement whenever taking a trade with Ethereum.

ETH/USD 2-hour Chart

Ethereum’s daily and monthly technicals are completely tilted towards the buy-side and show no signs of bearishness. However, its 4-hour overview is completely bearish, while its weekly overview is bullish but shows slight neutrality as well.

ETH/USD 1-day Technicals

Technical Factors (4-hour Chart):
  • Price is below both its 50-period and 21-period EMAs
  • Price is slightly below its middle Bollinger band
  • RSI has recovered from being in the oversold territory (42.83)
  • Volume is slightly above average
Key levels to the upside          Key levels to the downside

1: $565                                     1: $550

2: $581                                      2: $525 

3: $600                                      3: $510

Ripple

XRP made a sharp (to the upside) price recovery as well, with its price pushing past $0.5435, as well as its $0.57 resistance (now support) levels. The fourth-largest cryptocurrency by market cap even tried to break $0.6 but got shut down swiftly. Its price is now consolidating slightly above $0.57 and showing no signs of potential dips.

XRP traders (finally) have the option to trade this cryptocurrency after several days of close-to-no volatility. Keeping track of Bitcoin’s movements when trading XRP is a must, as any change in Bitcoin’s price could change the outlook of the market as a whole.

XRP/USD 2-hour Chart

XRP’s daily, weekly, as well as monthly technicals, are completely tilted towards the buy-side and show no signs of neutrality or bearishness. Its 4-hour overview, on the other hand, is bearish with slight signs of neutrality.

XRP/USD 1-day Technicals

Technical factors (4-hour Chart):
  • The price is currently slightly below both its 50-period EMA, as well as its 21-period EMA
  • Price is slightly below its middle Bollinger band
  • RSI is neutral and recovered from being oversold (47.26)
  • Volume is slightly above average
Key levels to the upside          Key levels to the downside

1: $0.57                                   1: $0.5435

2: $0.6                                       2: $0.5

3: $0.63                                    3: $0.475

Categories
Forex Videos

Position Sizing Part 12 – Two Tier Optimal F – I

Position Sizing XII- Two-Tier Optimal f Part I


In our past video presentation about the Kelly Criterion and Optimal f position sizing methods, we have learned that using these position size methods bring the maximal growth factor to any trading account using a profitable strategy. But, optimal fraction position sizes also presented drawdowns of over 90%, making them unsuitable for any trader except for a robot.

Nevertheless, optimal fraction position size shows the fastest growth rate, meaning achieving a determined goal in minimal time. Consequently, if we were to devise a methodology to reduce drawdown at tolerable levels, diminishing the risk of ruin to zero, and boost the basic 1-percent risk equity progression to unseen levels, we could take advantage of a terrific methodology and produce psychologically acceptable growth optimization.  That is the object of the current video presentation. 

To make this analysis, we used the currently available data from our Live trading signals. That way, our study is as close to a real system as it can be. 

At the time of this writing, we have delivered 203 signals since March 20. Thus, about 51 signals per month, that is, 2.5 signals per trading day. The general statistics were:

STRATEGY STATISTICAL PARAMETERS: 
 Nr. of Trades        : 203.00
 Percent winners      : 65.52%
 Profit Factor        : 2.10
 Average Reward Ratio : 1.11
 Sample Statistics:      
 Mathematical Expectation : 0.3800
 Standard dev            : 1.3682
VAN K THARP SQN           : 2.7774

To find the safest optimal f, we did a Monte Carlo resampling of the original trade sequence. The resampling was done with what would have been one trading year using 10,000 resamples, supplying us with 10,000 years of synthetic market activity.

The resulting optimal fractions were plotted and shown below. We can see a Gaussian bell curve centered at 0.62.

But the average f is not a safe fraction because 50% of the values lie below the average. We seek an optimal f that guarantees as much as possible that no future values lie below it.

Opt f Key Values   
       max: 91.33%
   average: 62.58%
       min: 23.57%

Thus, to be safe, we want the minimum f, which is 23.57%. 

The Live Trade Signals using a fixed 1% risk per trade

To create a reference from which to compare our proposal, we have computed what would have been four years of trading activity using our Live Signals

The next figure shows the equity curves resulting from the 10K resamples, corresponding to a 1% dollar risk on each trade and over what would have been approximately one year of activity.

We see that starting with $10,000, the end capital of the equity curves range from $19,967 up to over $140,000, although the average ending capital is $53,122.

      Average ending Capital : 53,122.77
          Max ending Capital : 154,077.50 
           Min ending Capital: 19,967.23


From these data, we can also create an interesting statistic to answer the question of how many trades are needed to reach a determined goal. In this case, we present the Trades to reach 10X. The curve results from computing this value on all 10K equity curves and computes the odds relative to the number of trades.

In the case of the 1% risk, we see that the average time to reach 10X, the initial capital is about 650 trades, with a minimum of 400 days and a maximum of 1000 days. Not bad at all. But that can be improved dramatically using a mix of conservative and aggressive position sizing.

The optimal F Positioning Strategy

Using the optimal f positioning strategy, a bold investor will navigate in the turbulent waters of one of these equity curves:

The chart is on a semi-log scale because the range of values is too vast to handle on a linear chart. We see that the y-axis show scientific notation, but do not fret. The number of trailing zeros of the equity corresponds with the last digit is in superscript. For instance, in the previous figure, we see that the ending capital after one year of trades ranges from below $1,000 to a theoretical value with 22 trailing zeros.

The next figure shows the cumulated probability of reaching a certain number of trailing zeros:

We observe that a small portion of the equity curves end below 4 digits, meaning they are net losers.  The following data clarifies this by showing relevant figures:

      Average ending Capital : 517.14 billion
          Max ending Capital : 43,096,478,975,341.38 billion 
           Min ending Capital: 153.51
     Capital ending above 517 billion : 55.63 % of the equity curves
     Capital ending above 1 million :  92.51 %
     Capital ending above 100,000 : 92.96 %
     Capital ending below 10,000 :  6.8507 %
     Capital ending below 5,000 :  3.4253 %

And, next, the chart that shows the power of trading using optimal f. The chart shows the time to reach 10X the initial capital,

The graph shows that the average time to reach 10X growth (50% probability) went from about 620 days down to 42 days. The same growth achieved in one-tenth of the time!

The Two-tier risk system.

The proposed system aims to profit from the rapid growth of an optimal fraction position sizing while minimizing the risk of blowing up the account. In this video, we will outline the idea and, in the following videos, will present its results and also the optimal requirements to make it work and minimize the risk.

The critical value here is the percentage of times the optimal f ends below 10K in a determined period.  Here we will take 80 trades instead of one-year of trading, as this shows a more realistic use in a Two-tier system.

40-trade figures:

    Average ending Capital : 213,793 
        Max ending Capital : 5,127 billion 
         Min ending Capital: 154

     Odds of

             Ending above 46,474    : 51.74 %
             Ending above 1,000,000 : 29.61 %
             Ending above 100,000   : 62.82 %
             Ending below 10,000    : 13.35 %
             Ending below 5,000     : 10.40 %

The key idea is based on the odds of the trading capital ending below the initial 10K value. In the case of sequences of 80 trades, we see that the odds are roughly 13.3%, and the odds of ending below 50% of the original figure is just 10.4%. 

That is the risk for the opportunity to have an average of $213,793 ending capital, which is over 21X. The risk/ reward ratio of the proposition is 214/5, which is 43. That means we can be wrong up to 42 times and recover after just one good trading sequence. Our initial proposal is to take 1/4 of the capital to allocate for an opt f positioning strategy.

The Two-tier optimal f proposal 

  1. Take 25% of your current trading balance and use it for the optimal f strategy. Use the rest 75% for 1% risk trades or let it be in cash. (more variations possible)
  2. Let computations of the optimal f strategy be separated in its own pocket to compute the subsequent trades.
  3. The account will be rebalanced after a determined goal has been achieved or goes below a predetermined level ( in our case, we will rebalance if the Optf part drops below ¼ of the initial capital on each cycle).
  4. After rebalancing, a new cycle of 25%-75% allocation begins.

In our next video, we will deal with the results and trade parameters of this combined strategy, as well as our advice on which features are desirable to make this strategy optimal.


Categories
Crypto Daily Topic Forex Daily Topic Forex Videos

Position Sizing Part 1 Drawdown – Why You Keep Blowing Your Account!


Position Sizing. Drawdown- The dark side of Trade


This video will be dedicated to explaining the relation between performance and drawdown.  It is an essential topic since most of the trading community ignores the fact that the drawdown of a trading strategy or system is not an independent value. It is position sizing dependent. Furthermore, the profitability of a trading system is also dependent on the size of the position.

Imagine several investors trying to choose a copy-trading service, and you need to rank the potential candidates. Which parameter do you think most of them would choose to grade the quality of that group of systems?  Total returns? Average trade return? Percent winners? Drawdowns?

The majority would rank them by total returns, without any further analysis on how the returns were obtained. This could lead them to select the worst candidate instead. 

The fact is that returns and risks are interlinked in all investments.  You cannot increment returns without increasing the risk. Consequently, traders and investors must analyze both simultaneously.

Let’s look at the characteristics of returns vs. drawdown using a simple position sizing method applied to the trades of one year using a sound system such as our Live Signals Service. 

Let’s see first how this system behaves using just one mini-lot size, which corresponds to $1 per pip gained or lost. 

The figure corresponds to a trader having $1,000 initial capital, using a constant one micro-lot trade. To compute the maximum drawdown, we created 10,000 synthetic account paths using Monte Carlo resampling. The corresponding max drawdown distribution is shown below.

The Average Max Drawdown is 1.94 % with a very tiny possibility a 8% drawdown.

Let’s see how this system performs under increasing lot sizes:

1 mini-lot size

The corresponding drawdown curve  is shown below:

In this case, the average max drawdown goes to 11.77%. But, there is a 30% chance (about one in three) that max drawdown goes to 20%, and in about 2.5% of the occasions, the max drawdown went as high as 40%.

Let’s use now one lot

And the corresponding max drawdown curve is

In this case, the average max drawdown is 40%, but there is a 20% chance of a 65% drawdown and a 5% chance of an 85% drawdown.  40% drawdown is about the limit a usual trader can endure, but inevitably a 65% drawdown would force most traders to stop trading, even when we can see that the system is profitable.

We can see that even using a constant trading size, the drawdown grows with the position size. Of course, we can observe that the returns also grow. Furthermore, profits grow at a much higher rate than risk.  From the preceding examples, any astute observer can notice that moving from one micro-lot to one lot, 1-year returns went from $1,158 to $115,840, a 100X increment, while the drawdown moved from about 2% to 40%, a 20X increase.  

Therefore, the theory behind position sizing is aimed at optimizing both return and drawdown. Of course, there is no single solution to this problem. The solution must fit the particular psychology of the trader. 

Categories
Cryptocurrencies

Indicators DeFi Investors need To Know: Number 4 Is A must Have.

Decentralized finance (Defi) is one of the relatively new blockchain applications, and it can be confusing for newcomer investors. Be that as it may, the pace at which the space is growing leaves no time to ‘wait and see.’ DeFi is evolving crazy fast, and new metrics are being invented to help investors weigh their options. Given the novelty of the subject, there are no widely-accepted standards yet. Still, there are some common indicators that we can use to judge whether one DeFi protocol is better than the next.  

This article looks at some of the top metrics that you can use to compare DeFi protocols.

#1. Total Value Locked (TVL) 

This is perhaps the most-common indicator when it comes to evaluating DeFi protocols. TVL refers to the total of funds locked in a given protocol. An easier way to understand it is to think of it as the dollar value of all tokens held in a smart contract for a given DeFi project. 

As an investor, you can know the general interest in a particular DeFi by just looking at its TVL. It is equally useful when evaluating the market size of different projects. In crypto, TVL would be the equivalent of market capitalization. 

TVL is simple yet confusing. If a user deposits 10 BTC then borrows BTC 5 and thereafter deposits back the 5 BTC, the market would report 100 BTC. But, there have been deposits amounting to 140 BTC. That’s part of the confusion that’s associated with this metric. 

TVL was created by DeFi Pulse, the world’s leading DeFi resource. Although liquidity providers usually fund DeFi projects in crypto, TVL is measured in dollars. As pointed above, there has been confusion abounds regarding the accuracy of TVL. However, as initially mentioned, DeFi and all its metrics are still evolving. Until such a time when there will be general agreement on these indicators, TVL remains a useful metric for evaluating the investment potential of a DeFi project.

#2. Token Supply

Token supply tells investors how many tokens are ‘floating’ in an exchange. When there’s a high number of tokens floating in an exchange, token holders are likely letting go of their tokens, which creates an increase in the supply. This could be happening for the same reasons it happens in other money markets. For example, investors could be fearing that the market is getting riskier. 

A high volume of token supply could result from a whale selling off their shares in some instances. The same phenomenon could also be observed when investors use their holdings as collateral for a margin or futures trade. As such, while the token supply on exchanges can tip you off of an impending voluminous sale, it might not be as straightforward. Crypto is typically traded on centralized exchanges, although this trend is changing in favor of decentralized exchanges. The advantage of centralized exchanges is that they are usually able to maintain stronger liquidity. 

#3. Changes in Token Balances

Tracking token supply on exchanges is a savvy move. And as a trader, you can complement this by finding out how balances are changing. Volume tracking is a bit static and does not accurately picture a market’s current financial trend. Evaluating the changes in token balances will likely give you a better picture of what is happening.

Typically, a large change in token balances tells you that the market is currently volatile. For example, if large holders are accruing tokens, you might notice large withdrawals from exchanges. As is the case with the other metrics discussed above, treat this only as a guide.

#4. Unique Address Count

Unique address count is the number of addresses that are holding a given token. A high number of addresses likely means that there is a high number of users on that market. By contrast, if you only see a relatively small number of addresses, it could be that the DeFi protocol has yet to gain widespread adoption. 

Since the number of unique addresses is a static metric, it would be more meaningful to track the new addresses’ rate. This will give you a better picture of how fast users are joining the DeFi protocol. And just like how it works with bull runs in the money markets, the best time to join is when the adoption rate is high. This is the time when you would typically expect the fastest growth in your investment.

Beware, though: one user could create multiple addresses and distribute their tokens to all of them. Therefore, this indicator should also be used merely as a guide, and better yet, be used in combination with other indicators.

#5. Inflation

Inflation is the rate at which new tokens are being pumped into the ecosystem – just like with economic inflation. Usually, limited supply alludes to the rarity of tokens and hence a higher value. If new tokens are being minted easily and fast, existing ones will be devalued at the same rate. 

However, it’s advisable to approach this indicator with some caution. In economics, rising inflation encourages people to spend and thus promotes economic growth. The same phenomenon can be observed in DeFi, where an increasing supply of tokens can boost investor sentiment and actually result in bullish activity. In the same way, limited supply could only be temporary. Thus, it would be best if you did not conflate token scarcity with value. 

#6.Price-to-Sales Ratio

The price-to-sales ratio (P/S ratio) is used to assess whether an asset is undervalued or overvalued. In traditional finance, this ratio is obtained by dividing a company’s revenue by its stock price. In DeFi, it’s calculated by dividing the protocol’s market capitalization by its revenue. Generally, a relatively high value means that the DeFi project could be overvalued. 

#7. Non-Speculative Usage

Non-speculative usage refers to the usefulness of a token beyond mere hype. When you’re evaluating a token’s value, it is important to check whether there is a solid project behind the token. It might be difficult to track whether token purchases are based on speculation or people are actually buying them for specific uses. 

Final Thoughts

DeFi is a fast-rising financial tech that promises investors new and exciting opportunities. As a DeFi investor, it helps to be able to analyze and compare different protocols. The above indicators can steer investors in the right direction when it comes to evaluating different DeFi options. Always analyze each DeFi protocol by its merits or lack of them, and most importantly, do your own research.

Categories
Crypto Market Analysis

Daily Crypto Review, Dec 09 – Bitcoin Drops to $18,000; Crypto Market Tumbles

The cryptocurrency sector has dropped significantly as bears took over the market. Bitcoin is currently trading for $18,315, representing a decrease of 4.50% compared to our last report. Meanwhile, Ethereum’s price has decreased by 6.17% on the day, while XRP managed to lose 7.73%.

 Daily Crypto Sector Heat Map

ALL BEST ICO gained 19,990.71% in the past 24 hours, making it the most prominent daily crypto gainer by far. It is followed by COIL’s 151.88% and Amun Bitcoin 3x Daily Short’s 112.92% gain. On the other hand, Monavale lost 54.51%, making it the most prominent daily loser. It is followed by KIMCHI.finance’s loss of 52.82% and Iteration Syndicate’s loss of 51.70%.

Top 10 24-hour Performers (Click to enlarge)

Bottom 10 24-hour Performers (Click to enlarge)

Bitcoin’s market dominance has moved to the upside just under half a percent since we last reported, with its value currently being 63%. This value represents a difference of 0.4% to the upside when compared to yesterday’s value.

Daily Crypto Market Cap Chart

The crypto sector capitalization has decreased significantly in the past 24 hours, with its current value being $536.08 billion. This represents a $32.76 billion decrease when compared to our previous report.

_______________________________________________________________________

What happened in the past 24 hours?

_______________________________________________________________________

_______________________________________________________________________

Technical analysis

_______________________________________________________________________

Bitcoin

After spending the past couple of days in a very narrow range, Bitcoin has finally made a move as bears took over the market. The price went down rapidly and reached as low as $18,000 at one point, but then went slightly above this crucial level.

While Bitcoin is safe from breaking $18,000 to the downside at the moment, Micheal van de Poppe pointed out that a large CME gap is looming. The gap ranges from $18,275 to $16,995.

Lastly, the Hash Ribbons indicator has posted a buy signal, giving long-term investors the green light to invest in Bitcoin. This indicator has proven itself one of the best RoI indicators for Bitcoin when it comes to long-term investing.

BTC/USD 4-hour chart

Bitcoin’s long-term technicals (weekly and monthly) are completely tilted towards the buy-side, while its daily overview is still bullish but showing slight signs of neutrality. On the other hand, its 4-hour overview is completely bearish.

BTC/USD 1-day Technicals

Technical factors (4-hour Chart):
  • Price is currently below both its 50-period EMA and its 21-period EMA
  • Price is at its bottom Bollinger band
  • RSI is close to being oversold (31.73)
  • Volume is average
Key levels to the upside          Key levels to the downside

1: $18,600                                 1: $18,190

2: $18,790                                 2: $17,780

3: $19,000                                  3: $17,200

Ethereum

Ethereum wasn’t immune to the downturn either, with its price dropping from the sub-$600 levels all the way down to just above $550. Unlike Bitcoin, however, there are no CME gaps to worry about, and Ethereum seems quite stable above $550.

The only thing to worry about when anticipating Ether’s next price move is Bitcoin’s movement. At the moment, Bitcoin is dictating all consolidations, as well as large moves in either direction.

ETH/USD 4-hour Chart

Ethereum’s monthly overview shows a full tilt towards the buy-side, while its daily and weekly overviews still show some signs of neutrality. On the other hand, its 4-hour overview is bearish but shows slight signs of neutrality.

ETH/USD 1-day Technicals

Technical Factors (4-hour Chart):
  • The price is currently below both its 50-period EMA and its 21-period EMA
  • Price is at its bottom Bollinger band
  • RSI is in the oversold territory (28.61)
  • Volume is above average
Key levels to the upside          Key levels to the downside

1: $565                                     1: $550

2: $582                                     2: $525 

3: $600                                      3: $510

Ripple

The fourth-largest cryptocurrency by market cap moved to the downside as well, with its $0.545 support level holding up as the last-resort support. XRP is currently stable and trading between $0.545 to the downside and $0.571 to the upside, with its price, seemingly creating a double bottom (today and on Dec 5).

XRP traders might want to (still) refrain from trading XRP simply due to the disbalance of the risk and reward, as well as due to its low volatility.

XRP/USD 4-hour Chart

XRP’s longer weekly and monthly time-frames show complete bullishness, while its 4-hour overview is completely bearish. Its daily overview is still bullish but shows some signs of neutrality or even some bearishness.

XRP/USD 1-day Technicals

Technical factors (4-hour Chart):
  • The price is currently below both its 50-period EMA, as well as its 21-period EMA
  • Price is at its bottom Bollinger band
  • RSI is close to being oversold (34.36)
  • Volume is slightly above average
Key levels to the upside          Key levels to the downside

1: $0.571                                   1: $0.545

2: $0.6                                       2: $0.5

3: $0.63                                    3: $0.475

Categories
Crypto Videos

Asset Mangers Being Left Behind By Not Understanding The Fastest Growing Asset Ever… Bitcoin!


Asset Managers Risk Their Careers by Not Understanding Bitcoin

Shapeshift CEO Erik Voorhees has spoken about the future of financial management in the future, stating that every asset manager should, even now, have an understanding of Bitcoin based on its astonishing rate of return.

Voorhees commented on this topic while retweeting data shared by analytics platform Messari co-founder Dan McArdle that shows Bitcoin dramatically outperforming every other asset over the last decade. 


While gold has made a return of 32% and the S&P 500 has tripled its investors’ money, Bitcoin has posted an astonishing 7,837,884% gain in ten years.

Looking at its 10-year life, Voorhees believes that Bitcoin is “vastly superior to any other investment.” He then stated that:

“One could be forgiven for not understanding Bitcoin eight years ago… but any asset manager today who remains even somewhat ignorant of this phenomenon needs to seriously check what they are doing.”

Voorhees is not the only one talking about the recent embrace of Bitcoin by institutions and the rest of traditional finance that is believed to underpin the most recent rally. Just the past week alone, half a dozen experts in the traditional finance sector made similarly bullish observations. On December 2, crypto trading firm Genesis CEO Michael Moro made a prediction that 250 publicly traded companies will put at least some of their funds in Bitcoin by the end of 2021.

On December 4, former JP Morgan commodity trader Danny Masters told CNBC that it would soon be a “career-risk to not have Bitcoin in your portfolio.”

BlackRock CIO Larry Fink also spoke about Bitcoin and warned that Bitcoin’s success could have a substantial impact on the US dollar and that it will even “take the place of gold to a large extent.” 

Of course, every asset has its bulls and bears, and no matter how many pundits back Bitcoin, or how many institutions put their money into it, gold bug Peter Schiff still remains unmoved, stating that Bitcoin and gold have nothing in common and that Bitcoin will never replace gold.

Categories
Crypto Videos

Michael Saylor Comparing Bitcoin To Lebron James? Institutional Investment Skyrocketing!


Bitcoin is like ‘Lebron James’ – MicroStrategy CEO Michael Saylor


In an interview with economist Marc Friedrich, CEO of MicroStrategy, Michael Saylor said that Bitcoin is just not the same asset it was in 2015 or 2017. As Saylor stated, the arguments against Bitcoin that were relevant two or four years ago are simply no longer applicable.

Bitcoin has grown exponentially since its peak in 2017. The growth happened in terms of infrastructure, fundamentals, as well as adoption. In the past year alone, many institutions have started to increasingly see Bitcoin as a store of value and an inflation hedge rather than as a speculative asset.

In 2017, Bitcoin critics said the cryptocurrency was too volatile and that there was a substantial risk of it dropping to zero. Saylor emphasized that these arguments have close to no relevance now because Bitcoin has evolved significantly in recent years.

Saylor said that Lebron James played basketball from ages 8 to 18, but then matured and evolved into one of the all-time greats. He said that Bitcoin went through a very similar period, stating that he thought that it was important to address the fears and anxieties of the crypto and non-crypto community head-on, but that people that still think that Bitcoin might go to zero are still living in the 2015 and 2017 timeframe. He compared Lebron James’ talent, which was, according to him, erratic and volatile in the early stages of his gameplay. But then he grew up and “destroyed everybody and everything in his way.”


One of the major changes Bitcoin has experienced since 2017 is its market structure. Going back to 2017, retail platforms like BitMEX were the dominant players in the derivatives market. Institutional platforms such as the CME have consistently processed volumes that were similar to leading retail-focused exchanges.

However, as of December 4, the CME Bitcoin futures market has an open interest of $1.14 billion, which is considerably higher than Binance Futures, Bybit, Huobi, as well as BitMEX.

On-chain data also shows a considerable increase in institutional interest. According to data coming from IntoTheBlock, the number of transactions valued at over $100,000 has increased twofold in 2020. This is indicative of the growth in institutional activity, the analysts stated. Furthermore, the total volume transferred in these transactions has experienced an even larger growth with 6x increase over the same period.”

Based on various factors, including the fact that the already-significant institutional involvement in the Bitcoin market is only increasing, investors like Saylor remain confident that Bitcoin is evolving into an established store of value.

Categories
Crypto Daily Topic

Who is Satoshi Nakamoto (Creator of Bitcoin)? 

There’s no bigger mystery in the crypto world than the one of Bitcoin’s creator’s true identity. Satoshi Nakamoto is the pseudonym used by Bitcoin’s creator(s). More than 10 years after Bitcoin, Satoshi’s identity remains shrouded in mystery. 

The Bitcoin community is yet even to know if Satoshi is one person or a group of people. What they know is that in 2008, Satoshi published a paper: “Bitcoin: A Peer-to-Peer Electronic Cash System,” that completely changed finance as we know it. 

Nevertheless, that hasn’t stopped an active search for the mysterious figure. Several Satoshi ‘suspects’ have been unveiled, and not without controversy. Let’s look at some of the people widely theorized to be Satoshi. 

#1. Dorian Nakamoto

Dorian Prentice Satoshi Nakamoto is a Japanese-American engineer suspected of being Satoshi by Newsweek writer Leah McGrath Goodman back in 2014. At the time, McGrath published an ‘expose’: “The Face Behind Bitcoin.” McGrath had established that Nakamoto had previously worked as a systems engineer on classified projects for the US government and a computer engineer for financial services companies. 

McGrath said Nakamoto had let slip that he was the founder of Bitcoin. She alleged that during a face-to-face interview with him, he’d said about the currency: “I am no longer involved in that, and I cannot discuss it,” adding, “It’s been turned over to other people. They are in charge of it now. I no longer have any connection.” 

However, when he’d said he’s no longer involved with that, he’d meant his work with classified military projects years ago. Both in The Associated Press and on a Reddit Ask Me Anything, he said that he’d misinterpreted McGrath’s question as being related to that work. 

The “discovery” of Dorian Nakamoto was particularly mired in controversy. The Bitcoin community was not pleased with the “hit-job” type of piece – complete with a picture of his house – that McGrath wrote about him.  

The community also took notice of a message published for the first time in years on Nakamoto’s P2P Foundation site, saying, “I am not Dorian Nakamoto.” 

#2. Adam Back 

Adam Back is the CEO of blockchain company Blockstream. Some sections of the Bitcoin community suspect he’s Satoshi Nakamoto thanks to a YouTube video called “Unmasking Satoshi Nakamoto” Posted by the channel “Barely Sociable.” The video talks about several clues about why Back may be Satoshi Nakamoto. 

One of those reasons is that he was describing the technology underlying Bitcoin as far back as 1998. He also kind of disappeared from the public when Satoshi was actively involved in the project. Barely Sociable also pointed out that both Back and Satoshi use double spacing in their words, and they use British English spelling. The video also mentioned the possibility that Back can always leverage plausible deniability about the claim. After the video was published, Back engaged in a back and forth with Barely Sociable on Twitter. At the time of writing, the YouTube video has 548,592 views on Twitter. 

#3. Wei Dai 

Wei Dai is a computer engineer and cryptographer. He’s the creator of the b-money currency system and a fixture in the digital currency community ecosystem. On August 23, 2008, Satoshi Nakamoto wrote to Dai acknowledging his contribution to Bitcoin:” I was very interested to read your b-money page. I’m getting ready to release a paper that expands on your ideas into a complete working system.” 

Most of the evidence linking Dai to Bitcoin is substantial, though, and there’s no smoking gun evidence to prove that he really is Satoshi. Such evidence is based on the fact that Dai has the ability to create such a project, as well as his intensely private manner that is akin to Satoshi’s.

Also, if Dai were Satoshi, that means he’d have to have been playing a “double agent” role writing to himself and communicating with himself. This is highly unlikely.

#4. Hal Finney 

Hal Finney is an American cryptography pioneer who died of ALS in 2014. In the same year, Forbes journalist Andy Greenberg wrote an article on Hal Finney, highlighting that he was not only Dorian Nakamoto’s neighbor, but also a pioneer in the cypherpunk and cryptography space. Not only that, Finney had been the first-ever recipient of a BTC transaction from Satoshi. 

Greenberg then worked with writing analysis firm Juola & Associates and asked them to compare Finney’s writing with that of Satoshi. Apparently, they found his writing was closer to Satoshi’s than other candidates submitted to Newsweek, Fast Company, and the New Yorker. But they also found Satoshi’s emails to Finney more closely resembled the style in Bitcoin’s original white paper as compared to Finney’s emails. 

Greenberg theorized that Finney could have been a ghostwriter for Nakamoto or has used his neighbor Dorian Nakamoto as cover. Finney denied being Satoshi. After Greenberg met Finney and saw the email exchanges between them and his and Bitcoin’s wallet history, he concluded that he was telling the truth. 

#5. Craig Wright 

Craig Wright is an Australian computer scientist and techpreneur. On Dec 8, 2015, Wired ran an article by Andy Greenberg and Gwern Branwen describing an Australian academician called Craig Stephen Wright who “either invented bitcoin or is a brilliant hoaxer who very badly wants us to believe he did.” 

The same day, Gizmodo published a story featuring documents allegedly obtained by a hacker who breached or “breached” Wright’s email accounts, claiming that Satoshi Nakamoto was a joint pseudonym for Craig Wright and his longtime friend, Dave Kleiman. Kleiman was a computer forensics expert who died in mysterious circumstances in 2013.

Following the article, Wright quickly disappeared from the web for several months only to resurface on May 2, 2016, and declare that he was Bitcoin’s creator. He also wrote an article apologizing for taking the original private approach and a refusal to provide proof of access to one of Bitcoin’s earliest keys. Several publications have rubbished the claims that Wright is Satoshi. He’s also currently embroiled in litigation with Dave Kleiman’s estate. The lawsuit claims Wright defrauded Kleiman of millions of worth of Bitcoin. 

#6. Nick Szabo 

Nick Szabo is a computer scientist, legal and cryptography scholar who’s widely credited for pioneering the concept of smart contracts in the ’90s. In 2008, he developed a decentralized currency – Bit Gold, which he described as “a protocol whereby unforgeable costly bits could be created online with minimal dependence on trusted third parties.” This is in agreement with Bitcoin, in which bits produced by a distributed network of computers worldwide independently verify transactions.

Writer Dominic Frisby floated the idea that Nick Szabo is Satoshi in his book “Bitcoin: The Future of Money?” Frisby talked to a stylometric analyst who apparently concluded that Szabo’s writing style is similar to Satoshi’s. His other ‘proof’ was that both Szabo and Satoshi reference legendary Austrian economist Carl Menger. Frisby also established Szabo had worked for DigiCash, a cryptographic electric money attempt in the early ’90s. According to Frisby, all these clues alluded to Szabo being Satoshi. 

However, Szabo has repeatedly refuted the idea that he’s Satoshi, saying to Frisby in one of their correspondences: “Thanks for letting me know. I’m afraid you got it wrong doxing me a Satoshi, but I’m used to it.” 

Final Thoughts

The fervor behind Bitcoin’s creator is understandable. After all, the currency is not just digital money – it’s a movement – one that has shaken the very core of finance. Some of the people mentioned in the list are known for their pioneering work that helped lay the foundation of Bitcoin. Others have been active in the currency’s development from the beginning, while others appear to ride on the coin’s popularity for whatever ends. But if you think about it, the mystery surrounding Bitcoin is partly behind its wild success and possibly its ‘untouchable’ status. The Bitcoin community and, indeed, the world should be happy that we have Bitcoin and not be so fixated on its creator. 

Categories
Cryptocurrencies

Buying Bitcoin with Skrill: Don’t Try Before Reading This!

Bitcoin is the world’s most popular currency. So it’s not a surprise that most payment platforms worth their salt support the currency. One of these platforms is Skrill, the London-headquartered money transfer company that’s now one of the most popular globally. 

This article looks at how you can purchase Bitcoin via Skrill. We’ll dive briefly into what Skrill is, whether you should consider using it, and the best places to buy BTC with Skrill. 

What is Skrill?

Skrill is an international payment platform through which users can transfer, send, and receive money from across the globe. It sets itself apart from other money transfer companies such as PayPal through low-cost transactions. You can open a Skrill account in any of the 30+ supported currencies. Once you have an account, you can add other currencies if you’d like to receive payments in different currencies. Skrill is widely accepted by merchants worldwide, including cryptocurrency exchanges, which is why you need to know how you can purchase Bitcoin using Skrill. 

Should You Buy Bitcoin with Skrill?

Wondering whether it’s worth buying Bitcoin from Skrill? Apart from being just another option (the more options you have, the better), Skrill can save you some money. Additionally, you can buy Bitcoin directly from your Skrill account with your local Fiat currency. There are many ways you can fund your Skrill account to facilitate a crypto purchase. Skrill also offers convenience and ease of use through its mobile app. Finally, crypto purchases are instant, and your account is credited with the balance within seconds. 

With that, let’s take a look at where and how you can do it so. 

Best Places to Buy Bitcoin with Skrill

#1. Skrill

Skrill itself is one of the best places where you can buy BTC. Buying Bitcoin from Skrill is incredibly easy and straightforward. If you have an account, you will see the option when you log in. The interface is particularly user-friendly – simple, elegant, and minimally designed. 

To buy BTC from your Skrill account, you will need to fund it first. The quickest way to do so is to use your credit card. Whichever card you’re using, funding your account will cost you around 2.5% of the transaction value. Most of the major cards are accepted. 

Apart from Bitcoin, you can also buy other major cryptos on the platform. This is especially important if you’d like to diversify your crypto investment portfolio. As a bonus, you can also sell crypto from within your Skrill account. So buying BTC on Skrill is not only highly convenient, but it’s also option rich. 

#2. Paxful

Paxful is a peer-to-peer (P2P) Bitcoin marketplace launched in 2015. The platform allows you to buy and sell Bitcoin to other users. Like all other P2P marketplaces, users can browse through different seller profiles and select the one that offers the best rates and accepts Skrill payments.

Whether you have an account or not, Paxful allows you to filter sellers by country, accepted payment methods, and so on. When you select a seller, the platform gives you more details regarding the offer and the seller. You can even see the seller’s rate in comparison to the average market rates and determine whether their offer is fair. If your Skrill account is already funded, buying Bitcoin from Paxful is super easy. You will only need to check out with Skrill and complete the easy steps that follow. 

Best of all, Paxful summarizes many options for you, allowing you to quickly and simply purchase Bitcoin. 

#3. Capital.com

Capital.com is a UK-based crypto broker that allows users to buy and sell most of the major cryptocurrencies. Since it’s a broker, you’ll be either buying or selling directly to the company. If you are conscious of the risks of buying crypto from a P2P exchange, Capital.com is a great go-to option. 

#4. eToro

eToro is one of the biggest crypto exchanges, and it supports buying Bitcoin using Skrill. eToro is a social trading platform, which means it allows you to copy-trade. The platform is designed mostly for experienced traders. Nevertheless, its copy trading feature allows novices to take part.

When it comes to buying Bitcoin, eToro is one of the most sophisticated trading platforms. It presents multiple dashboards offering a preview of the most important BTC indicators, real-time prices included. Setting up an account is a little cumbersome as it requires you to provide numerous details. However, once all is set up, the rest of the purchase process is relatively easy. 

#5. Coingate

Coingate is a cryptocurrency payment gateway that allows businesses across the globe to accept Bitcoin. Crypto traders can also buy and sell their digital assets on the platform without making any deposit. When you choose to buy Bitcoin using Skrill, you’ll be able to make an instant payment without the need for registration or verification, as long as you’re verified on the platform. Coingate’s speed and ease of use make it an ideal option for users who want to buy Bitcoin quickly and without hassle. 

Coingate is sometimes criticized for offering poor rates and unsatisfactory customer service. However, user experience on the platform is generally smooth, and you’re unlikely to face challenges buying Bitcoin or paying with your Skrill account. 

#6. Bitpanda

Bitpanda is a world-famous crypto exchange that allows users to buy and sell various digital assets with the convenience of mobile and desktop options. Bitpanda has made buying/selling Bitcoin as easy as ABC. To buy Bitcoin with Skrill on Bitpanda, you need only follow three steps:

  • Create a Bitpanda account or log in if you have an existing one.
  • Verify your identity and fund your Bitpanda wallet. When depositing funds, you will be directed to select the source of funds, where you’ll choose Skrill.
  • Proceed to buy Bitcoin.

The difference between Bitpanda and Coingate is that with Coingate, you have to fund your Coingate account first. However, the whole buying experience is fast and user-friendly. 

Final Thoughts

Skrill is one of the most recognized global money transfer platforms. The platform attracts users with its low-cost money transfer offerings. When it comes to buying Bitcoin with Skrill, users get various options ranging from Skrill itself to the numerous exchanges that accept Skrill payments. If you’re using Skrill on a different platform, you need to evaluate the platform’s ease of use, transaction fees, and available withdrawal options. As for Skrill itself, Bitcoin purchases are simple and instant, which you should take advantage of.

Categories
Crypto Market Analysis

Daily Crypto Review, Dec 08 – BTC, ETH and XRP Preparing for a Big Move; Crypto Sector in Consolidation Mode

The cryptocurrency sector has spent the past 24, mostly consolidating, as it failed to reach past its resistance levels on Monday. Bitcoin is currently trading for $19,180, representing a decrease of 0.65% compared to our last report. Meanwhile, Ethereum’s price has decreased by 1.14% on the day, while XRP managed to lose 1.65%.

 Daily Crypto Sector Heat Map

Prophet gained 358.97% in the past 24 hours, making it the most prominent daily crypto gainer. It is closely followed by Seigniorage Shares’ 344.54% and xBTC’s 340.23% gain. On the other hand, CryptoBet lost 95.85%, making it the most prominent daily loser. It is followed by Semux’s loss of 90.60% and Bitball Nyan v2’s loss of 51.05%.

Top 10 24-hour Performers (Click to enlarge)

Bottom 10 24-hour Performers (Click to enlarge)

Bitcoin’s market dominance has moved to the upside over half a percent since we last reported, with its value currently being 62.6%. This value represents a difference of 0.6% to the upside when compared to yesterday’s value.

Daily Crypto Market Cap Chart

The crypto sector capitalization has increased in the past 24 hours, with its current value being $568.82 51.68 billion. This represents a $17.24 billion increase when compared to our previous report.

_______________________________________________________________________

What happened in the past 24 hours?

_______________________________________________________________________

_______________________________________________________________________

Technical analysis

_______________________________________________________________________

Bitcoin

Bitcoin has continued with its slow movement as another low volatility day passed. The largest cryptocurrency by market cap oscillated between $18,905 and $19,431. The one time it dropped under the $19,000 mark, it found support in the 50-period moving average, which has proven to be a strong (both support and resistance) level.

Due to the low volatility, traders can’t really do much at the moment. However, they can prepare for the next move Bitcoin makes.

Lastly, the Hash Ribbons (one of the best accumulation indicators) indicator has posted a buy signal, giving long-term investors the green light.

BTC/USD 4-hour chart

Bitcoin’s technicals on both short and long time-frames are bullish, with its weekly time-frame showing full tilt to the buy-side and its 4-hour, daily, and monthly time-frames tilting more towards neutrality.

BTC/USD 1-day Technicals

Technical factors (4-hour Chart):
  • Price is slightly above its 50-period EMA while being at its 21-period EMA
  • Price is at its middle Bollinger band
  • RSI is neutral (51.61)
  • Volume is slightly below average
Key levels to the upside          Key levels to the downside

1: $19,500                                 1: $19,000

2: $19,666                                 2: $18,790

3: $20,000                                  3: $18,600

Ethereum

Ethereum has, just like Bitcoin, had quite a slow day, with its price moving slightly down. At the moment, the second-largest cryptocurrency by market cap doesn’t seem like it will tackle $600, as its volume is too low to pressure this major resistance level. However, if and when a bull run past $600 happens, traders will have a great opportunity to catch a safe trade with a stop-loss slightly below $600 and a possible target of $620 or $630.

ETH/USD 4-hour Chart

Ethereum’s monthly overview shows a full tilt towards the buy-side, while its daily and weekly overviews show some signs of neutrality. On the other hand, its 4-hour overview is completely bearish.

ETH/USD 1-day Technicals

Technical Factors (4-hour Chart):
  • The price is slightly above its 50-period EMA while being slightly below its 21-period EMA
  • Price is at its middle Bollinger band
  • RSI is neutral (48.32)
  • Volume is below average
Key levels to the upside          Key levels to the downside

1: $620                                     1: $600

2: $630                                     2: $530 

3: $735                                      3: $510

Ripple

The fourth-largest cryptocurrency by market cap has close to no volatility, as well as very low volume on most exchanges. With the price movement being non-existent, there is not much to say about the current XRP trading. However, whenever the trading range is getting this narrow, a breakout is on the horizon.

XRP has created a flag formation on the 1-day chart, signaling that an increase in volume could bring a breakout to the upside and a possible spike of up to 60%, which would take the coin’s price above $1,00.


XRP/USD 4-hour Chart

XRP’s longer time-frames (weekly and monthly) show complete bullishness, while its 4-hour and daily overviews show some signs of neutrality or even bearishness.

XRP/USD 1-day Technicals

Technical factors (4-hour Chart):
  • The price is at its 50-period EMA, as well as at its 21-period EMA
  • Price is at its middle Bollinger band
  • RSI is neutral (50.46)
  • Volume is well below average
Key levels to the upside          Key levels to the downside

1: $0.666                                   1: $0.6

2: $0.78                                     2: $0.596

3: $0.79                                   3: $0.535

Categories
Crypto Videos

What Would it Take for Ethereum to Fail?


What Would it Take for Ethereum to Fail?

Ethereum 2.0 has recently launched its Beacon Chain, concluding Phase 0 of a scaling effort. Although he expressed quite a bit of faith in Ethereum 2.0, Celsius CEO and founder Alex Mashinsky believe nothing has to be set in stone. The network could lose its spotlight if it doesn’t manage to scale quickly, effectively, and significantly.

“Ethereum needs to prove to the market that it can scale its transactions 100x without compromising on either security or decentralization,” Mashinsky stated when asked about Ethereum 2.0’s next hurdle after its Beacon Chain launch. “If Ethereum fails to scale, Cardano and Polkadot will take over the market.”

As of Thursday, December 3, Ethereum’s network hosts somewhere in the ballpark of 13 transactions per second, according to data coming from Blockchair. A 100-fold increase from now would total the network capacity to roughly 1,300 transactions per second.

Ethereum has served as the top blockchain for building decentralized applications over the past years. In 2020, the DeFi sector boom has largely taken place on Ethereum’s blockchain, as well. This surge in activity has led to incredibly high network traffic that Ethereum could not handle, and that at times resulted in high transaction fees. 

With Ethereum 2.0’s shift from a proof-of-work and onto a proof-of-stake consensus algorithm, scaling advancements should be evident very soon. Ethereum co-founder Vitalik Buterin previously stated that he believes the network has the possibility to scale to an astonishing 100,000 transactions per second.

The aforementioned network’s upgrade, however, faced a fair bit of delays before achieving Phase 0 earlier this month. MyEtherWallet founder said that he expects Ethereum 2.0’s next phases to take years to fully play out. Mashinsky didn’t give any specific time estimates, but he did give his vote of confidence in the network upgrade idea as a whole.

“I am a big believer in this upgrade, even if it will take longer than anticipated to scale and solve all the problems,” he said.

It’s important to note that Ethereum’s native token, Ether, also plays into the equation. Phase 0 requires all interested parties to lock up at least 32 Ether each, with a total of 524,288 Ether needed for the Beacon Chain launch. The Ether must remain locked until Phase 2 is live, and that could take years.


As more and more Ether is locked up for Ethereum 2.0 or used on different DeFi and CeFi platforms, the prices push to higher levels simply due to the scarcity effect. Almost all decentralized exchanges are denominated in Ether, which is also a huge advantage for Ethereum.

Categories
Crypto Videos

An Ethereum Fund Launching On The Toronto Stock Exchange!

Ethereum Fund Launching on the Toronto Stock Exchange

Canadian digital asset investment manager company 3iQ will be launching an IPO of an Ethereum exchange-traded trust, called The Ether Fund, on the Toronto Stock Exchange under the ticker QETH.U. 

The maximum offering for the trust launch is $100 million, and 3iq announced that the offering’s closing date would be no later than Thursday, December 10 of this year. 3iQ currently counts more than $400 million CAD under management. The company maintains a right focus on just several cryptocurrencies, including Bitcoin, Litecoin, and Ethereum.

In a press release that came out Thursday, December 3, 3iQ noted that the listing comes with a patriotic backstory behind it. “The concept of Ethereum was first developed in Canada in 2013, and then launched by a group of technologists coming from all over the world,” the company mentioned.


Ethereum’s co-founder and main figure, Vitalik Buterin, is Canadian-Russian, and his family moved to Toronto when he was just six years old.


Traders south of Canada’s borders have already demonstrated a remarkable appetite for publicly available Ethereum investment options. Despite an incredible price premium, which at points went to as much as 500% relative to net asset value for Grayscale’s Ethereum trust ETHE, the company reports that more and more investors have decided to test the waters and try investing in crypto.

These funds and trusts are the preferred methods of investing in crypto for many traders, as not many people are able or willing to provide their own crypto custody and security options.

On top of that, traders have enjoyed a rapid expansion of this sector, with new fund offerings surfacing across the globe in recent months. In November alone, VanEck launched a Bitcoin exchange-traded note product in Germany, as well as the VanEck Vectors Bitcoin ETN, while 3iQ introduced The Bitcoin Fund to Canada.

Categories
Crypto Daily Topic Forex Daily Topic

How to Trade Forex Anonymously with Bitcoin

Anonymous trading used to be a reserve for high-profile investors. But with the increasing acceptance of crypto in forex trading, anyone can trade anonymously now. There are both advantages and limitations to trading anonymously. If you choose to trade forex anonymously, you could use Bitcoin or any altcoin accepted by your broker. 

In this article, we’ll look at what it means to trade anonymously, why you would do it, and, most importantly, how to use Bitcoin in this endeavor.

KYC-Based vs. Anonymous Forex Trading

Unlike crypto trading, forex investment is a highly-regulated industry. For this reason, regulators require forex brokers to conduct extensive know-your-customer (KYC) processes before allowing traders in. Traditionally, exchanges have had no provision for anonymity. However, over time, many have switched to anonymous/hybrid trading practices. 

So, what is anonymous trading? Anonymous trading happens when investors choose to conceal their identity, although their trading activity remains visible in the order book. Usually, an investor will choose between trading on an anonymous (national) exchange or opt for the more private dark pools. 

Anonymous brokerage firms are still regulated and thus do not provide complete anonymity – regulators can still access personal information about a particular trader and their activity. On the other hand, dark pools are private trading platforms that are generally out of the investing public’s reach. They can be registered and operate legally, like conventional brokerages. 

Whether you’re trading in an open brokerage or a dark pool, crypto is particularly useful in keeping transactions identityless. 

With that, let’s find out why you would consider trading anonymously. 

Why Trade Forex Anonymously?

Motivations for trading anonymously may differ slightly between investors. However, the following are common reasons. 

  • Protecting identity – For personal reasons, you might opt to remain an unknown investor on the market. Sometimes one just desires privacy – be it to circumvent some restrictions, keep away stalkers, etc.
  • Protecting your strategy – If you’re a particularly savvy trader, your tricks will always be at risk of being copied. But if you trade with your identity concealed, you’re making it difficult for them to join the dots that make up your strategy. 
  • To conceal your intention – Crypto markets are sentimental, and if traders see you buying or selling in large volumes, prices can move, sometimes to your disadvantage. In such a case, buying or selling anonymously allows speculation to shape the course of price movements.

Using Bitcoin to Trade Forex Anonymously 

It’s very possible to trade forex using crypto. And while you can use any crypto to trade forex (as long as your broker allows it), Bitcoin has some advantages. Obviously, the main one is its wide acceptability. BTC’s volatility also makes it a suitable currency for investment. That said, this is how you can use Bitcoin to trade forex. 

#1. Get Bitcoin – Naturally, the first step is to acquire Bitcoin. For this, you will need to visit an exchange (not a forex exchange, though). Familiarize yourself with the likes of Coinbase, Binance, and Changelly. 

#2. Find a good broker – Not all forex brokers accept Bitcoin. Those that do may be referred to as Bitcoin deposit forex brokers. 

#3: Deposit Bitcoin with the broker and provide them with the finer details of the trade they should execute.

Of course, this is a high-level overview of the process. There are intricacies involved, such as how to evaluate brokers and the risks and the benefits of using Bitcoin to trade crypto that you need to be aware of. Let’s take a look at these below: 

Top 10 Bitcoin Deposit Forex Brokers

The list of Bitcoin deposit forex brokers is growing by the day. Some of the truly tried-and-tested include the following. Links go to a full review of the broker, where available.

#1. IC Markets – This broker is regulated by the Australian Securities and Investments Commission. They accept deposits from $200 in any of the supported currencies, including BTC. With IC Markets, you can get a leverage of up to 500:1. IC Markets allows its customers to trade Forex, Metals, indices, bonds, stocks, and digital currencies.

#2. EagleFX – EagleFX is a beginner-friendly broker with whom you can trade from as low as $10. The platform offers fast account setup and supports over 55 currencies and 32 digital assets. Withdrawals are also pretty fast. With leverage of 1:500, experienced traders can equally benefit from the platform. One of the things making EagleFX stand out is that it appeals to all levels of traders – from beginners to seasoned investors.

#3. CedarFX – CedarFX is a rather interesting option, as it offers zero commission trading with very tight spreads. This broker offers traders six asset classes: digital assets, stocks, indices, metals, futures, and commodities. When trading with CedarFX, the best part is that investors get to choose from a wide array of options. CedarFX’s leverage goes up to 1:500 and also accepts a minimum $10 deposit.

#4. FX Choice – Just like IC Markets, FX Choice is an electronic communication network (ECN). They accept deposits from $100 in a range of crypto and fiat currencies. The broker offers maximum leverage of 200:1 and a variety of Forex pairs, metals, indices, and digital assets.

#5. Longhorn FX – This broker seeks to attract beginner investors with low minimum deposits starting from $10. You can get leverage up to 1:500 to trade with over 55 currency pairs. Withdrawals are fast and easy, which increases its appeal. 

#6. Cryptorocket – This broker allows investors to trade various instruments that include crypto, commodities, stocks, and forex. Leverage of up to 1:500 is possible, and it can be applied to trade some 35 crypto pairs, 55 fiat currency pairs, among other asset classes. The broker features institutional-grade liquidity that guarantees investors competitive pricing. Also, Cryptorocket uses straight-through processing – so you can be sure there will be no price manipulation.

#7. Think Markets – Think Markets is a market maker non-dealing desk kind of broker. You can start with any amount for your deposit, which is encouraging for new users. It is regulated by the Australian Securities and Investments Commission (AU), the Financial Conduct Authority (UK), and the Financial Sector Conduct Authority (ZA). 

#8. FXTM – FXTM is an ECN market maker regulated by the Financial Services Commission of Mauritius. You can start trading from a minimum of $5 (or its equivalent in any of the supported currencies). The broker offers maximum leverage of 1:1000.

#9. HotForex – HotForex is also a market maker that accepts deposits from $5. It is regulated by the Dubai Financial Services Authority and accepts several base currencies. The maximum leverage you can get is 1:1000. 

#10 Hugosway – Hugosway is a well-established broker with offices in Kingstown, St. Vincent and the Grenadines. The broker accepts bank transfers as well as crypto funding while offering its customers fast times on deposits and withdrawals. It allows trading in digital assets, forex, indices, and metals.  The minimum deposit is $50 using credit card and bitcoin, and $10 using Vload.

Benefits of Trading Forex with Bitcoin

  • Increased privacy – When you trade forex using Bitcoin, you don’t need to share your personal financial info.
  • Increased leverage – Many brokerage firms offer leverage to Bitcoin traders. If you know how to use leverage, this can be hugely beneficial.
  • Potentially lower costs – Bitcoin deposit forex brokers are reportedly lowering brokerage fees to attract the new breed of BTC-forex investors.
  • Lower deposits allowed – Again, it appears like Bitcoin deposit forex brokers are using this strategy to attract new investors.
  • Easier cross-border trading – Thanks to Bitcoin being a global currency, you can trade with any broker from anywhere.

Risks of Trading Forex with Crypto

  • Volatility – Since Bitcoin’s prices change continuously, a broker may take advantage of traders by receiving their Bitcoin using the day’s lowest rate and exchanging it at the day’s highest rates. 
  • The leverage temptation – The special leverage used to entice BTC-forex brokers is a great risk to novice investors.
  • Mixing of asset classes – Bitcoin and forex are different asset classes. This use of an ‘intermediary’ currency increases trading complexity and risks.
  • Bitcoin’s inherent risks – Bitcoin, like all cryptos, can be easily stolen if not properly secured. A broker that is licensed and reputable ensures the safety of your funds.

Final Thoughts

Using Bitcoin to trade anonymously offers several benefits. You can take advantage of the higher leverage, lower deposits, lower costs, easier cross-border trading, and so on. There is also an ever-increasing number of Bitcoin deposit forex brokers you can experiment with. However, ensure to employ plenty of caution and thoroughly research brokers so you don’t lose money, and start slow, testing it with minimum deposits and thin trades. Overall, anonymous forex trading with Bitcoin is an exciting endeavor that you can explore – whether you’re a veteran or new to the game. 

Categories
Crypto Daily Topic

How to Spot Scams in Decentralized Finance 

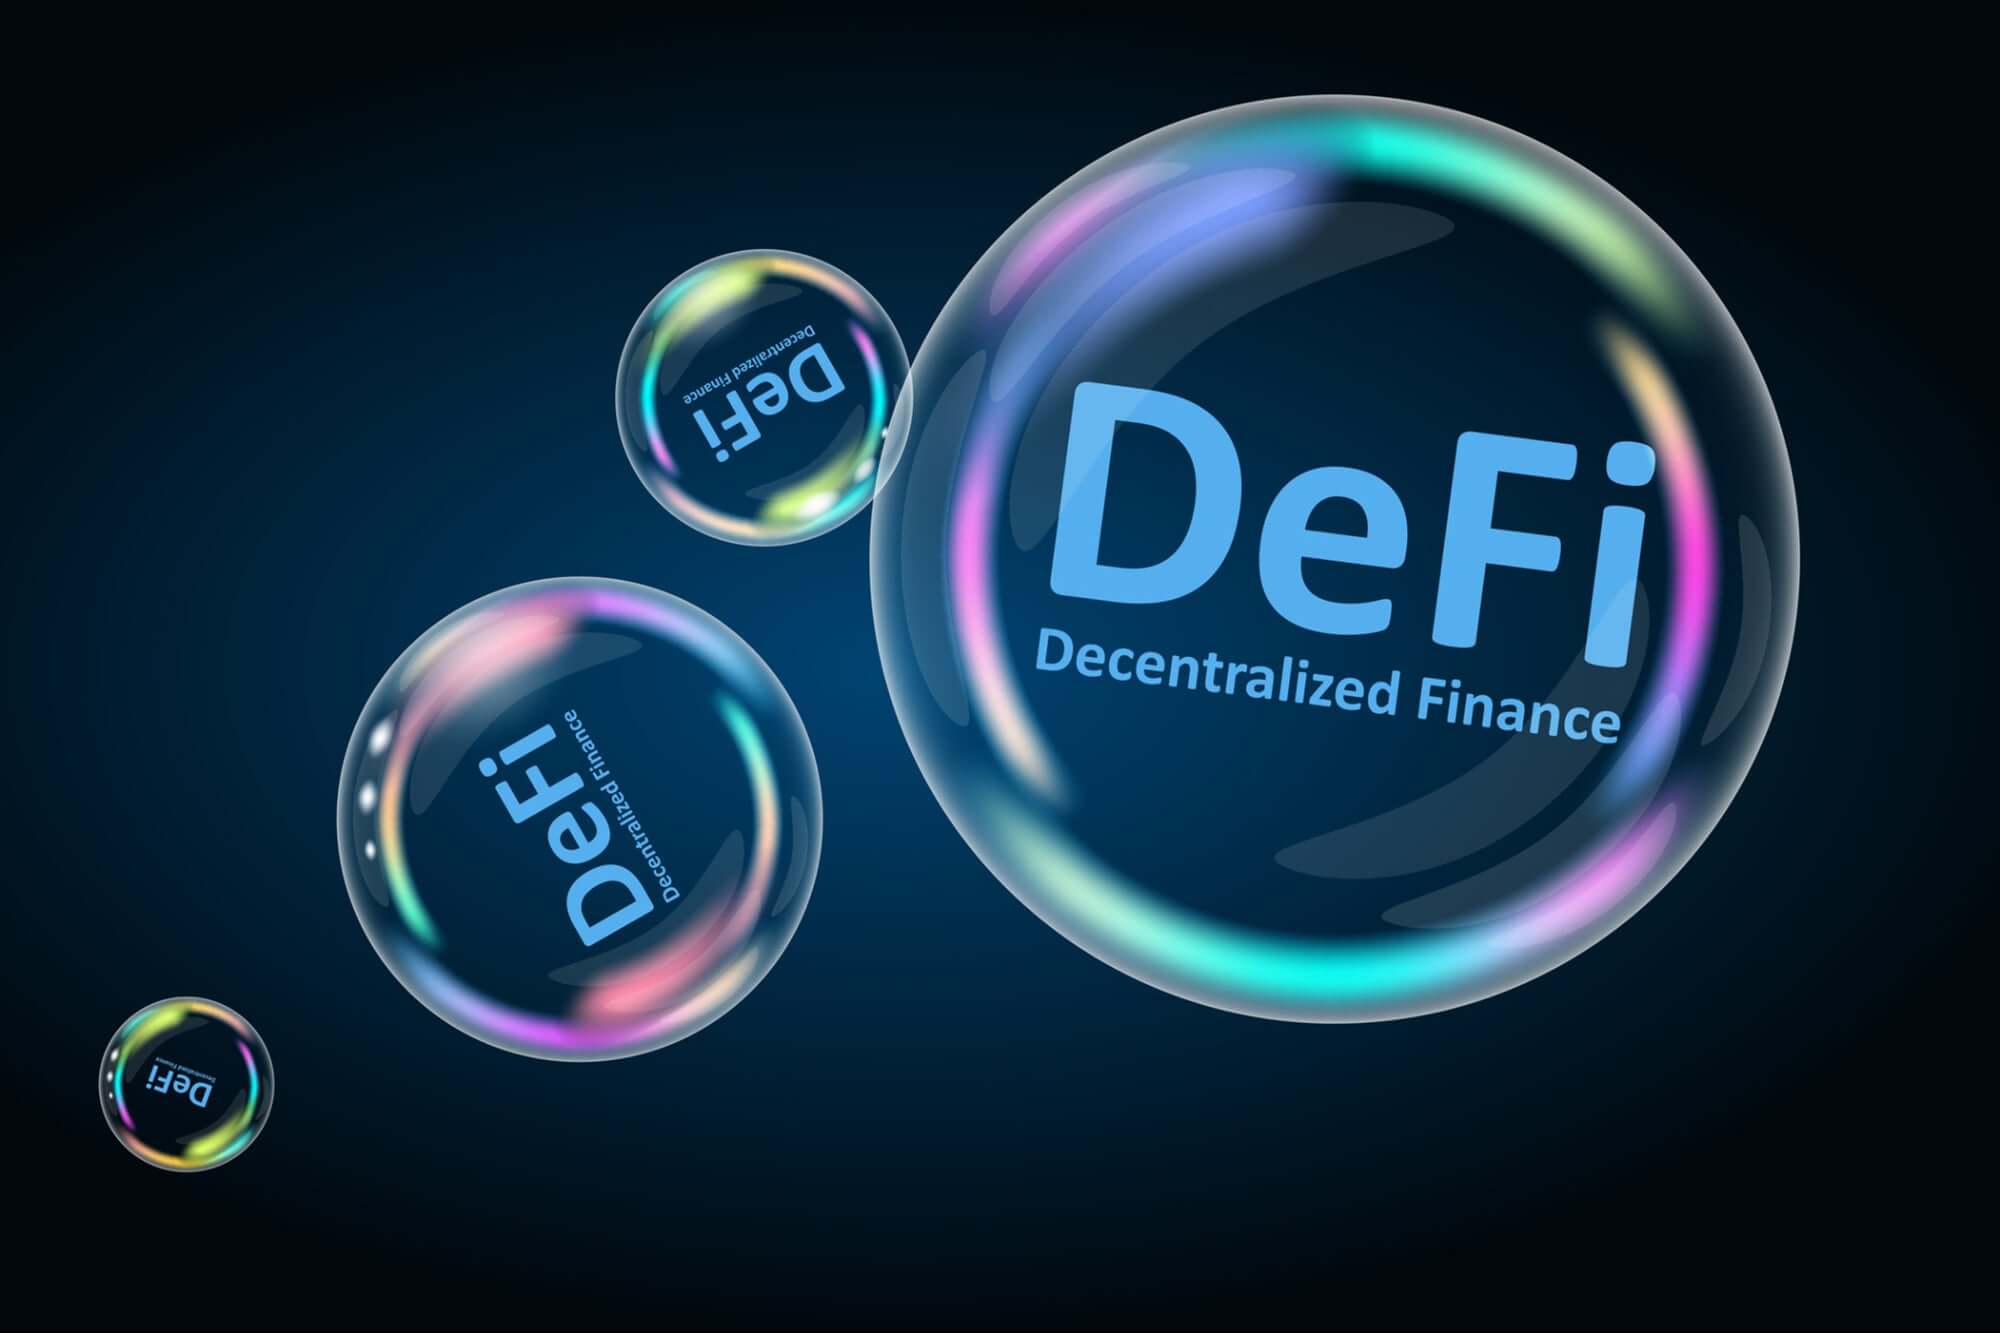
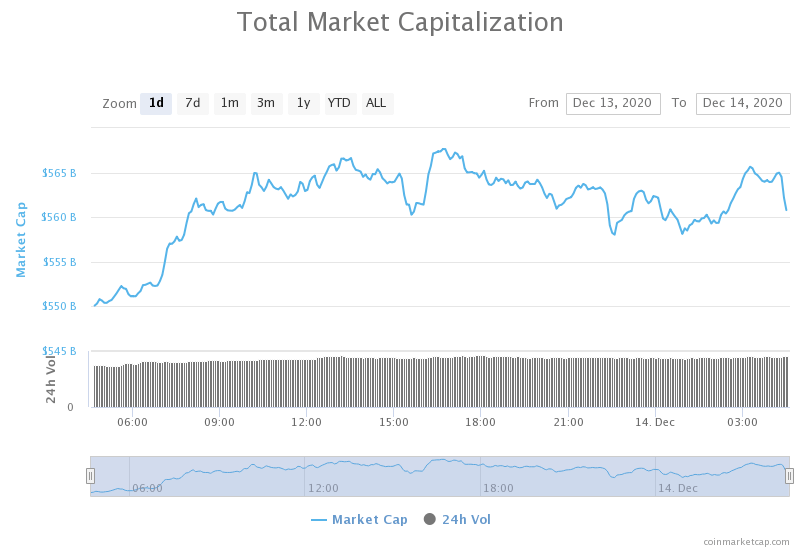
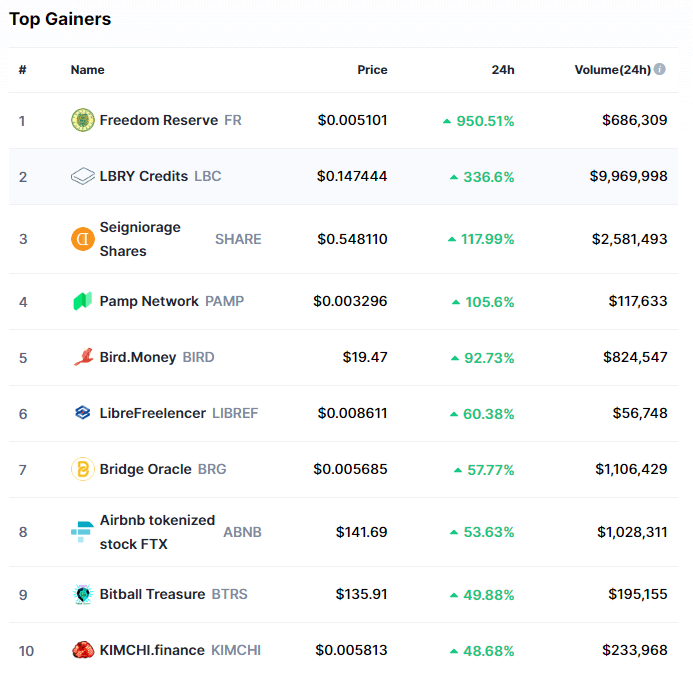
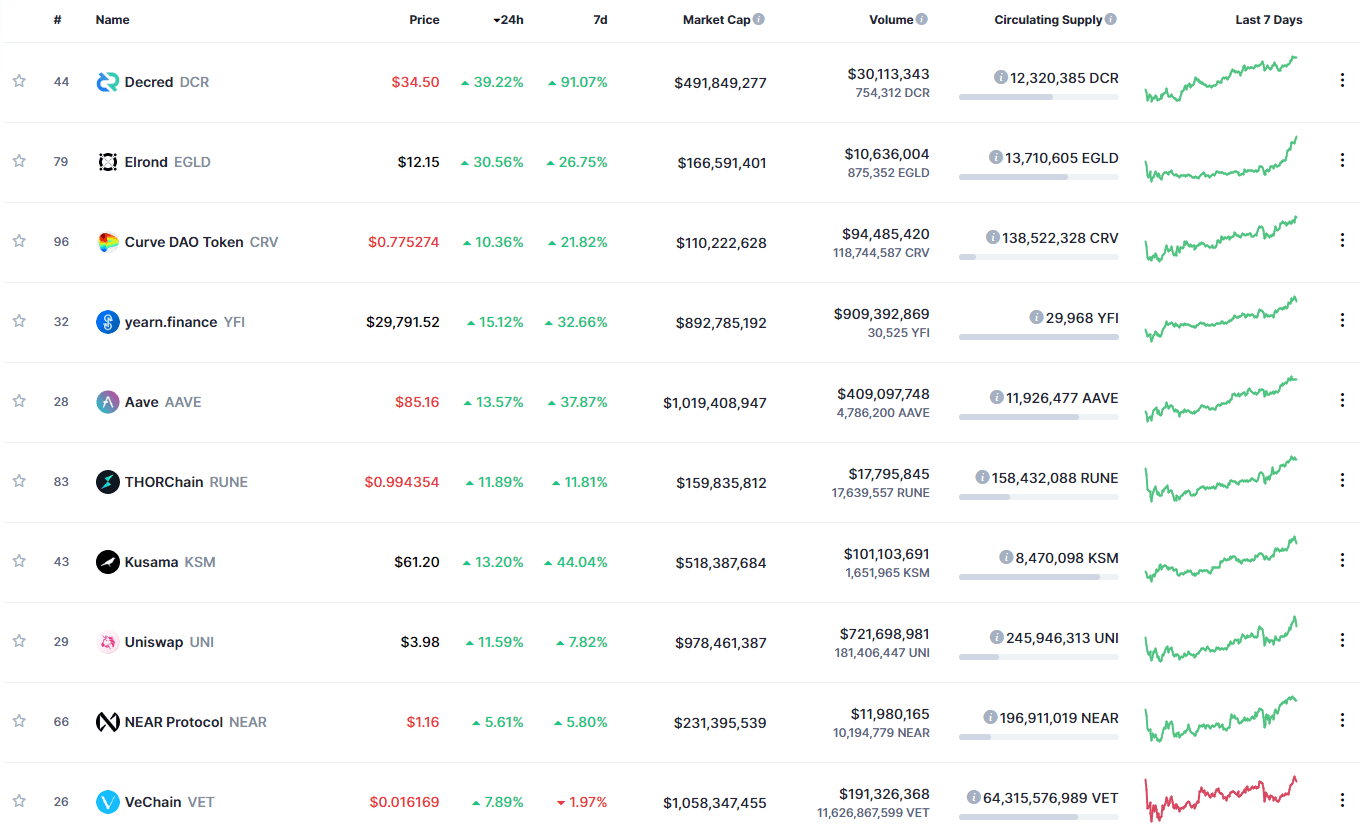
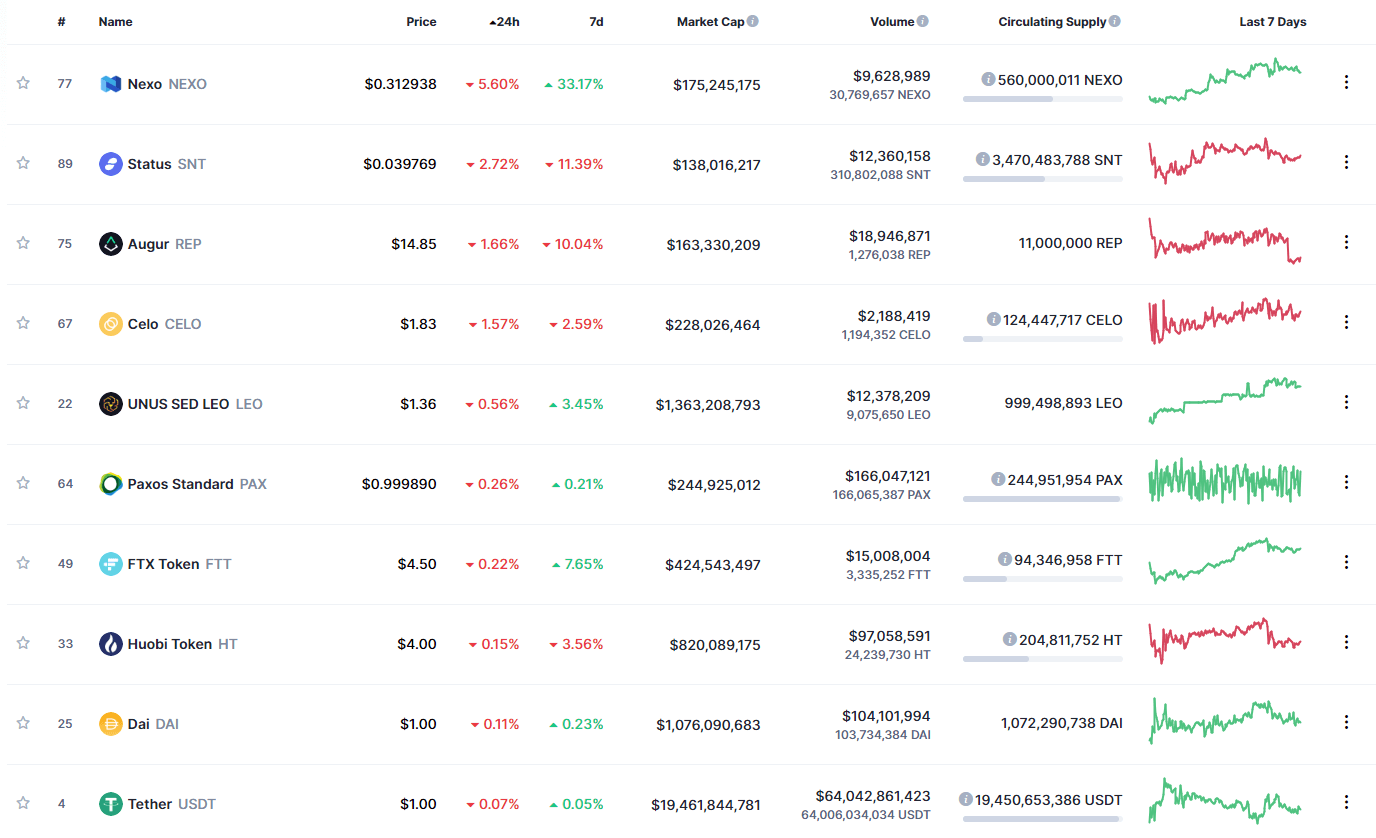
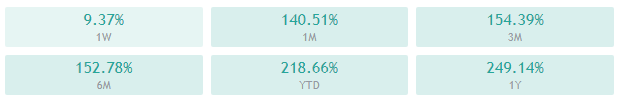
If you have been in the crypto industry for more than a minute, you’ve probably heard about decentralized finance (DeFi). It is one of the fastest-growing sectors in the crypto scene, having registered an 1116% increase this year. DeFi grew tremendously, increasing from $674 million in January to $14.185 billion today.

However, the impressive growth also comes with a drawback; DeFi scam projects. 

Thanks to FOMO, scammers are jumping on board the DeFi craze. Blockchain’s properties of being permissionless and decentralized make it easy for anyone to launch fraudulent scams. Scam cases have been so prevalent that prominent entrepreneurs, such as Craig Wright, write off DeFi completely. 

The truth is that not all projects are fake. So, how do you separate the wheat from the chaff? 

More on that later, but first, let’s have a look at the common DeFi scams you should be aware of. 

Common Types of DeFi Scams

Although criminals will come up with all kinds of DeFi scams, they most likely will fall under any of these four categories. 

i) Exit Scams

Exit scams are perhaps the most widespread DeFi scams around. In this case, developers announce a project’s launch and stir the crypto scene with details of the project. Once they have people talking about the project, the criminals disappear with all the funds locked in the protocol. 

Exit scams are usually hard to trace, thanks to the decentralized nature of blockchain. However, in an isolated incident, the world’s largest crypto exchange, Binance, announced in November that it had recovered 99% of the funds stolen from the platform through an exit scam. 

ii)Pump and Dump

Pump and dump schemes are no stranger to the financial world. These schemes are typical in the stock world and are used to boost stock prices on false statements. Crypto pump and dump schemes work similarly. Investors who are in on the scheme start by creating a buzz around a particular DeFi token. They increase the coin’s awareness on different social media channels, which results in a price increase. More unsuspecting investors get on board and buy the tokens, which further increases its price. 

Once the group reaches its target, the initial investors start selling their tokens. The massive sale of the tokens causes a dip in the prices. While the initial investors make a profit, those unconnected to the scam deal with significant losses. 

iii) Admin Imitator

Most of these scams happen on social media platforms such as Twitter, Telegram, and Discord. Usually, DeFi developers use this platform to form a community around their projects. 

Scammers use these platforms to target unsuspecting investors. They pose as one of the members of the support team and convince investors by using the same image and usernames as legitimate members of the development team. 

The scammers then pretend there’s an issue with the project and inform users of the same. They ask the users to send ETH to a specific address or send their private keys to solve the issue. 

iv) Discord Bot Scam

This is a relatively new tactic that scammers are using. The criminals create a bot representative of the DeFi project, which they use to send updates, news, and features updates via a link. Users who click on the link are then redirected to a compromised version of the DeFi platform. These bot scams usually end up in numerous phishing attacks on the users. 

5 Questions You Should Ask to Identify a DeFi Scam

So, how do you tell a legitimate DeFi project from a scam?

Before you invest your money, you need to ensure the project is viable. Finding the answer to these five questions will help you identify a DeFi scam from miles away. 

What’s the Project’s Purpose?

It may seem like an obvious question, especially for an investor who’s new to the crypto scene. However, taking a keen look at the project’s purpose can help you avoid hefty losses. 

DeFi projects are supposed to be innovative, and the legitimate ones usually are. However, most of the upcoming projects have nothing to offer and are only riding on the ongoing craze. 

Before committing your money, have a clear idea of what the project is all about. Does it bring anything new to the crypto scene? Is it an innovative solution? How different is it from its competitors?

Is There a Smart Contract Audit?

Project audits are a common feature in the DeFi space. For smart contracts, audits are an essential part of the development and help to ensure the project’s code is secure. 

Despite it being a requirement for developers to deploy their code with an audit, most don’t adhere to this. The audits are quite expensive, so scammers won’t bother incurring the additional costs. 

Sure, an audit report for a DeFi project doesn’t mean the platform is entirely safe and shouldn’t be a decisive benchmark for the ideal project. However, it’s an excellent indicator to help you weed out scam projects.  

Who Are The Founders?

Most investors don’t give a second thought about the founders, but it helps to have some information on them. 

Anonymity in the crypto space is not new; after all, it is one of the pillars of blockchain technology. Therefore, it’s not unusual to come across DeFi projects whose founders choose to remain anonymous. 

So, are all DeFi projects run by anonymous founders a scam? Not at all. However, if the founders are anonymous, they cannot be held accountable in case anything goes wrong. So, you can always go for a project with unknown founders, but you run the risk of losing everything and having no one to go after if you lose your money. 

Is There Any Developmental Activity?

One of the best features of DeFi is that most of the platforms are open-source. This means that the development team avails the code to the public so that anyone can make changes to it. Therefore, if you have any code-knowledge, you can always check out the source code to identify any malicious activity. 

The best part about open-source DeFi projects is that if they raise enough interest, more people get on board. You, therefore, have more people checking out the source code for any bugs; thus,  increasing the chances of spotting anything off. 

You should also check the developer’s activity. Are they often deploying new codes? It may not be enough to spot a fake, but a project with zero developer activity should undoubtedly raise some eyebrows. 

How is the Token Distribution?

When finding out more about a DeFi project, you should always pay keen attention to its tokenomics. For starters, find out more about the token’s allocation. 

As expected, the founders will probably hold the lion’s share for themselves. However, this could end up being a problem if the developers are scammers. They can easily hike the token’s prices and later dump their coins in the market, causing the token to lose its value. 

Additionally, the distribution model used is essential. An exclusive presale will mean that only a select few will acquire the tokens at first and cause hype around the project on social media. Airdrops are likely to cause a sell-pressure, while IEOs are more reliable since crypto exchanges put their reputation on the line. 

Do Your Own Research!

Figuring out whether a DeFi project is about to dupe, you can be an uphill task- yet, it’s quite necessary. After all, no one wants to lose their hard-earned money. 

Although these five crucial questions will give you a headstart, they aren’t conclusive. Before placing your money in a sinking ship, do your own research and learn all you can about the project. Not all DeFi projects are a scam, and if you get a legitimate one, it could end up being a worthy investment with massive profits.

Categories
Crypto Market Analysis

Daily Crypto Review, Dec 07 – ETHE and GBTC Grayscale Funds Reach All-Time High Average Daily Volumes in November

The cryptocurrency sector has spent the weekend recovering from the price descent on Dec 3 and 4. Bitcoin is currently trading for $19,288, representing an increase of 0.16% compared to our last report. Meanwhile, Ethereum’s price has decreased by 1.49% on the day, while XRP managed to lose 0.74%.

 Daily Crypto Sector Heat Map

Omnitude gained 241.76% in the past 24 hours, making it the most prominent daily crypto gainer. It is closely followed by KIMCHI.finance’s 185% and Badger DAO’s 123.92% gain. On the other hand, DAV Coin lost 71.6%, making it the most prominent daily loser. It is followed by Semux’s loss of 66.12% and Bitball Treasure’s loss of 65.05%.

Top 10 24-hour Performers (Click to enlarge)

Bottom 10 24-hour Performers (Click to enlarge)

Bitcoin’s market dominance has barely moved to the downside since we last reported, with its value currently being 62.1%. This value represents a difference of 0.3% to the downside when compared to Friday’s value.

Daily Crypto Market Cap Chart

The crypto sector capitalization has decreased over the weekend. Its current value is $551.68 billion, representing an $18.83 billion decrease when compared to our previous report.

_______________________________________________________________________

What happened in the past 24 hours?

_______________________________________________________________________

_______________________________________________________________________

Technical analysis

_______________________________________________________________________

Bitcoin

Bitcoin has spent the weekend trying to recover from the downturn it had on Dec 3 and 4. The largest cryptocurrency by market cap has formed a triangle formation that is respected throughout the weekend and then broke it to the upside. While the move was short-lived, the overall short-term bullishness has increased.

Some traders see a bull flag instead of the triangle formation, which makes the possibly future even more bullish. Posting any short trades would most likely be more risky than profitable at the moment.

It is also important to note that the Has Ribbons (one of the best accumulation indicators) indicator has posted a buy signal.

BTC/USD 4-hour chart

Bitcoin’s technicals on all time-frames are bullish, with 4-hour and weekly time-frames showing full tilt to the buy-side and daily and monthly time-frames tilting more towards neutrality.

BTC/USD 1-day Technicals

Technical factors (4-hour Chart):
  • Price is above its 50-period EMA and slightly above its 21-period EMA
  • Price is slightly above its middle Bollinger band
  • RSI is neutral (54.36)
  • Volume is below average
Key levels to the upside          Key levels to the downside

1: $19,500                                 1: $19,000

2: $19,666                                 2: $18,790

3: $20,000                                 3: $18,500

Ethereum

Ethereum has spent the weekend slowly pushing towards the upside, reaching just under $600 and bouncing off the resistance level. Its current failure to break $600 is not a big red flag, as Ethereum’s large moves are (lately) mostly caused by Bitcoin’s movement.

Ethereum traders have a great opportunity to catch a safe trade if ETH/USD breaks $600. A stop-loss slightly below $600 and a possible target of $620 or $630 would make quite a viable trade.

ETH/USD 4-hour Chart

Ethereum’s 4-hour, weekly, and monthly overviews show a full tilt towards the buy-side, while its daily overview shows some signs of neutrality.

ETH/USD 1-day Technicals

Technical Factors (4-hour Chart):
  • The price is slightly above its 50-period and at its 21-period EMA
  • Price is at its middle Bollinger band
  • RSI is neutral (50.51)
  • Volume is slightly below average
Key levels to the upside          Key levels to the downside

1: $620                                     1: $600

2: $630                                     2: $510 

3: $735                                      3: $500

Ripple

The fourth-largest cryptocurrency by market cap experienced slightly more volatility over the weekend than during the previous week, with its price hovering between $0.542 and $0.626. The $0.6 level is currently holding quite well as a support line, and XRP shows no signs of dropping below it unless some external factor surfaces.

Trading XRP is, even with the slight increase in volatility, a near-impossible feat at the moment. Trading other (more volatile) cryptocurrencies could be a much better option.

XRP/USD 4-hour Chart

XRP’s 4-hour, weekly, and monthly overviews show complete bullishness, while its daily overview shows some signs of neutrality.

XRP/USD 1-day Technicals

Technical factors (4-hour Chart):
  • The price is at both its 50-period EMA and its 21-period EMA
  • Price is at its middle Bollinger band
  • RSI is neutral (53.49)
  • Volume is slightly below average
Key levels to the upside          Key levels to the downside

1: $0.666                                   1: $0.6

2: $0.78                                     2: $0.596

3: $0.79                                   3: $0.535

Categories
Crypto Videos

Goodbye XRP! What Happens if XRP Gets Deemed a Security?


What Happens if XRP Gets Deemed a Security?

Ripple CEO Brad Garlinghouse believes that his company can and will still thrive under a hypothetical scenario where its cryptocurrency XRP is declared a security by the United States lawmakers. 

Appearing on episode 439 of the Anthony Pompliano’s Pomp Podcast, Garlinghouse spoke about the implications of XRP being declared a security by the US Securities and Exchange Commission. He said such a position is possible but that it would run contrary to the view that prevails among G20 markets.

While stating that “it’s very hard to look at XRP and say that it is a security,” Garlinghouse said:


“If XRP were deemed a security in the United States… you know, we have other G20 markets that have a completely different view. I’m not aware of any market in the world that thinks that XRP is a security.” Garlinghouse added that “over 90% of RippleNet customers are actually out of the United States,” suggesting that a possible unfavorable securities designation wouldn’t exactly hinder the company’s underlying business, but only its short-term popularity. If XRP were to be declared security in the US, investors would need to complete a broker-dealer registration with the US SEC.

XRP’s regulatory status has been a subject of intense scrutiny for a very long time now, with veteran futures and forex trader Peter Brandt being the latest of many public figures in line to declare it a security.

On the other hand, Congressman Tom Emmer, a Republican from the state of Minnesota, argued in August that XRP should not be deemed a security.

Ripple has been the subject of a major class-action lawsuit from disgruntled investors claiming that XRP is a security. This lawsuit alleges false advertising as well as unfair competition charges against Ripple. An amended filing from March 2020 claimed that Garlinghouse was shopping XRP to prospective investors while liquidating his holdings at the same time.

XRP is back in the limelight at the end of November as the market pushed its price above a multi-year high. The rally was a subject of heavy profit-taking, falling more than 28%.

Categories
Crypto Videos

How To Spot Bitcoin Bull & Bear Cycles Beginners Edition!


Bitcoin Bull and Bear cycles – Beginners Edition


Animals Bear Fighting With Bull

Since its launch over a decade ago, Bitcoin has seen a number of bull and bear cycles, with each one of them being greater than the last. However, many have tried to find an answer to the main question: What drives these cycles? Co-founder of Decred Jake Yocom-Piatt has claimed that the answer certainly lies within the human brain.

“Bitcoin’s bull and bear cycles are both functions of generic human psychology, attention spans, as well as its deterministic and diminishing issuance,” Yocom-Piatt stated.

Over the years, numerous parties have tried to find the reason behind and argue different cases for Bitcoin’s cycles, including PlanB’s infamous stock-to-flow model, which projects Bitcoin prices in the future based on its programmed halving events that happen every four years.

One major characteristic that sets Bitcoin apart from every other asset is its deflationary nature. It is programmed to have a finite supply, and that, combined with the ease of movement it provides, allows for borderless value storage better than any asset before.

Then, one might wonder whether the programmed supply that Bitcoin possesses dictates its price cycles on some level. This refers to its mining reward being cut in half every four years, essentially decreasing the amount of new Bitcoin put out on the market each time a block is mined. Its 21 million coins supply cap may also factor into this equation.

“Bitcoin’s rate of supply is constantly shrinking as a percentage of the circulation, with the addition of a massive supply shock every halvening,” explained Yocom-Piatt.

“Bull runs occur when the demand begins to outstrip the supply, driving up the price, which then gets the attention of myopic investors. After some time passes, these myopic investors’ attention span for a bull market fades away, and we revert back to a bear market. With each bull cycle, the overall awareness of Bitcoin grows, further sowing the seeds for the next bull cycle.”

Bitcoin recently approached its 2017 all-time high of $20,000, receiving a big chunk of mainstream media coverage during the time of the push towards the upside.

Categories
Crypto Market Analysis

BTC/USD Weekly Chart Analysis + Possible Outcomes

In this weekly BTC/USD analysis, we will be taking an in-depth look at the most recent technical formations, as well as look for the possible short-term price outcomes.

Overview

Bitcoin has spent the past week recovering levels it lost in a Nov 25 crash and even managed to push to a new all-time high on some exchanges. Still, the end-goal of Bitcoin above $20,000 was not reached.

Bitcoin’s institutional activity is more than booming, with news coming out left and right about companies investing in crypto, financial institutions preparing to embrace Bitcoin as an asset class, as well as regulators allowing Bitcoin to be held in employees’ company-funded 401k plans. On the other hand, Not being able to push past the $20,000 resistance level due to an incredible amount of sell orders near it has brought Bitcoin bears another day of hoping that the price will go lower.

Technical factors


Bitcoin has continued moving up until reaching an all-time high on some exchanges and then creating a doji candle followed by an inverted hammer candle on a weekly time-frame, indicating a possible bearish outlook as Bitcoin has most likely reached its short-term top. Looking at the shorter time-frames, such as the 4-hour one, we can see that Bitcoin has formed either a triangle formation or (if we include the movement from that started on Nov 27) a bull flag, which goes against the previously mentioned bearish outlook. Any break from the channel Bitcoin is trading in at the moment could mean a strong move towards that side.

The hash ribbons indicator flashed a BUY signal, which is an incredibly important update for long-term investors, as this indicator was the most consistent investment tool when it comes to RoI.

Likely Outcomes

Bitcoin’s sending out mixed signals on different time-frames, indicating indecisiveness from the retail sector. On the other hand, companies and institutions show incredibly bullishness as they are buying up Bitcoin over-the-counter. While a move to the downside is quite possible at the moment, the overall current trend is bullish, and short-selling could possibly harm traders’ portfolios more than they can improve it.

1: If Bitcoin fails to establish itself above $19,100 and breaks the range to the downside (slightly less likely), its most likely target will be $18,450. Due to a large number of buy orders in the zone between $18,190 and $18,450, this is the most likely place for reaccumulation and a push towards the upside after a pullback.

2: If Bitcoin manages to push towards the upside, first breaking $19,100 and then the descending black line (top line of the triangle formation), we can expect the price to attempt another push above $20,000, with the possibility of breaking it this time. If Bitcoin proves to be in a bull flag formation rather than a triangle formation, the profit target stays the same ($19,666 with possibly taking some profits along the way).

Entering any trade with having a target of above $20,000 is quite risky, and it would be better to play it safe and end the trade pre-$20,000 and then re-enter it if the price confidently moves up. The same goes for entering a short trade with sub-$18,450 in mind.

Categories
Cryptocurrencies

Arbitrage Trading in 2021? Here Is How I Make A Kill

Cryptocurrency provides so many avenues for people to make money. Whether it’s trading, mining, staking, or lending, you can make money from crypto in any of several ways. However, one method that flies under the radar (and hence many people don’t know about!) is arbitrage trading. Arbitrage trading is a way through which you can make extra cash in a (relatively) risk-free manner.

This article explores the world of arbitrage trading. And, in the end, you will know whether it’s for you. 

What’s Arbitrage Trading? 

Arbitrage trading is an approach to trading that exploits the differences in the price of a cryptocurrency in various exchanges. For instance, let’s say Bitcoin is trading at $9,000 on Coinbase but at $9,200 on Huobi. A savvy trader might move in to take advantage of this price difference by buying the currency from Coinbase and immediately selling it at the price listed on Huobi. 

One may wonder, what causes the difference in pricing of the same asset on different exchanges? This could be due to issues like an exchange having a limited supply of a currency and hence selling it at a higher price than other exchanges that have the currency in a higher volume. 

Various crypto arbitrage methods

You can participate in arbitrage trading using either of three ways: spatial, cross-border, and statistical. 

#1.Spatial Arbitrage

This method involves exploiting the imbalance in prices of a cryptocurrency on two exchanges. While Exchange A might have set Bitcoin at $8,000, exchange B might be offering it at $8,400. A trader can buy the crypto from Exchange A and sell it on Exchange B. Such discrepancies are likely to occur due to the unregulated nature of the market. 

#2. Cross-border arbitrage

This method is not so different from spatial arbitrage – the only difference is that the exchanges involved are in different countries. It can be difficult to pull off cross-border arbitrage because it can be difficult to move the assets between such exchanges. 

#3. Statistical Arbitrage

This is the most sophisticated arbitrage of all three. Statistical arbitrage involves mathematical modeling using bots that take advantage of pricing imbalances that can exist in very short amounts of time. 

Why is Crypto Arbitrage Trading Worth it? 

There are several reasons why you might want to dip your toes in crypto arbitrage trading. Let’s look at these:

#1. Fast and easy profits

If your arbitrage trading goes according to plan, it’s a quick way to earn a profit. Since the process depends on speed, it’s easier to make money than with regular trades.

#2. Lots of opportunities

There are practically hundreds of exchanges where you can trade crypto, meaning you have lots of arbitrage opportunities.

#3. The crypto market is still growing and volatile 

The crypto market is still young, and there are no structures in place, meaning most exchanges will not share information and work independently. Most cryptos undergo quick rises and equally quick drops, causing price discrepancies and profitable arbitrage opportunities.

#4. Limited competition

In the crypto space, there’s less competition when you compare with the traditional finance market. Not many traders are looking to explore crypto, much less crypto arbitrage, making the field so much less competitive. 

#5. Guaranteed price disparities

It’s almost a given that a given cryptocurrency will have different prices on different exchanges – with the difference between 3% to 5% and sometimes (though rarely) even up to more than 20%.

#6. Choosing an exchange for crypto arbitrage

Fancy giving crypto arbitrage a trial? The first step is to evaluate the desired exchanges and then registering. Some exchanges require customers to have their account verified, which may take days or weeks, depending on the exchange. Others will require you to deposit money before you can start trading. Still, other exchanges may be less strict in their onboarding process, but most of them will require you to undergo a Know Your Customer (KYC) process. 

What to consider before you sign up on an exchange

  • Fees: When it comes to trading, fees matter, period. Always try and go for low fees. However, don’t sacrifice quality for cheap fees. Always find a balance.
  • Geography: Check whether an exchange or its features are restricted in your jurisdiction. 
  • Reputation: Check what people are saying about the exchange before you put in your money. Search on Google, check various crypto platforms, and so on. The goal is to avoid shady and spammy exchanges. 
  • Withdraw time: An exchange might take hours or days to allow cashouts, so make sure to understand the rules beforehand.
  • Account verification: Some exchanges allow you to withdraw money or provide full access to the markets only after verifying your account. Always confirm the procedure for the exchange before you sign on.
  • Liquidity: Exchanges do not have liquidity in equal measure. If you’re planning on trading large quantities of funds, make sure the exchange has sufficient liquidity.

The Potential Downsides of Arbitrage Trading

Just like with any worthy endeavor, crypto arbitrage trading has its downsides. Let’s see what you need to look out for: 

KYC Restrictions: As we’ve mentioned above, nearly every exchange has KYC regulations in place. You need to observe these regulations, even if they are inconvenient. For instance, you may need to have a bank account in the home jurisdiction of the exchange. Other requirements may include verifying your identity, and so on. Sometimes these procedures can take days before you’re allowed to trade. 

Safety of funds: Since you will be moving funds across several exchanges, you will most likely need to have funds across all of them. Most of the time, such funds are stored in online wallets, making them susceptible to theft. Some lesser-known exchanges could also steal from customers. It would be best if you were extra vigilant with where you sign up for trading. 

Fees: Exchanges usually charge a definite percentage of your profit as fees. Ensure to calculate this before you start celebrating 

The larger the trades, the more the profit: Profits from Bitcoin trading can be very meager when you factor in the processing delays and fees. So to make any substantial profits, you may need to trade more or increase the volume.

Withdrawal limits: Some exchanges impose withdrawal limits once trade volumes cross a certain threshold. This means you will not withdraw all your money within the same day.

Timing: Transactions can take minutes to be completed, depending on the blockchain. This is a very long time in the world of crypto. By the time they are over, you may have lost your potential profit. Indeed, many are times when you may not receive profits as the markets correct themselves, and the profits turn into a loss. You may have bought crypto in one exchange in some cases, but by the time you transfer them to the other, the markets have moved in the opposite direction.

Slow transactions: As crypto increases in popularity, so does trading volumes on crypto exchanges increase. This may make for slower transactions, which is the last thing you want in arbitrage trading. 

Competition: As more people move into crypto trading, the more the competition, and the fewer arbitrage opportunities for everyone

Final Words 

Arbitrage trading is a worthwhile way to make extra money with crypto. As long as you play your cards smart – and quickly – you can make good bucks. But like anything, there are a few downsides. However, you win some and lose some. That’s just life. 

Categories
Crypto Daily Topic

What Really Is Selfish Mining: Will Bitcoin Survive This?

Mining is the process through which new Bitcoin blocks are generated. Individual nodes on the Bitcoin network race against time in a series of guesses for the right block. Due to the large size of the network and transaction load, this process is resource-intensive – it requires sophisticated computing equipment and consumes massive amounts of power. 

Selfish mining is when a miner withholds newly generated blocks then releases them to the public ledger when they have formed the longest chain. Other legitimate miners may join the selfish miner on their private network due to the possibility of higher returns. The practice is neither illegal nor disallowed, but selfish mining undermines Satoshi’s vision of decentralized production and distribution of money. 

How Selfish Mining Works

Mining involves solving complex cryptographic puzzles, which are guesses. Depending on the difficulty of the puzzle being solved, and the associated power costs, the reward you can earn from this process can vary greatly. As such, even if miners combine effort, the overall output for each miner is proportional to the individual effort invested. 

This was the case until researchers Ittay Eyal and Emin Gun Sirer discovered that miners could actually cheat the system by hiding the newly-generated blocks from the public blockchain. Transactions will still be verified, and new BTC generated because the newly-generated blocks are made available on the selfish miners’ private networks. By withholding the new blocks from the public blockchain, such miners circumvent the infrastructure restrictions that make mining resource-intensive and speed up the discovery process. 

Whatever makes selfish mining possible is a vulnerability on the Bitcoin network that uses the longest chain rule to indicate which chain to follow. Usually, the correct chain to follow is the one with the highest number of new blocks – in other words, the one with the highest proof of work. Since it is possible to withhold a block and release it after accruing several of them, one can always wait until they have several blocks then release them to the public blockchain. This will result in other miners following that chain and surrendering their earnings to the owner of this chain. 

How It Impacts Bitcoin’s Integrity

Undoubtedly, selfish mining poses a threat to Bitcoin’s integrity. Cryptocurrencies sell on the premise that they are decentralized and tamper-proof. Thus, the idea that a group of people can collude to subvert the system’s mechanics raises concern. 

Of particular concern is how selfish mining increases the possibility of a 51% attack. Over time, selfish miners can create mining pools with an ever-growing hash rate. As more parties join the pools, their chances of acquiring majority power increases. Eventually, this may allow them to block other miners, reverse transactions, exclude transactions, and so on. However, considering how large the Bitcoin network is, there is only a low likelihood that a mining syndicate will gather enough resources to take most of the power. Additionally, Bitcoin enthusiasts believe that the motivation for selfish mining is lower than the rewards. If other parties decide to join selfish miners in their pools, they might eventually be unable to recover the investment they made in their mining operation.

The practice of selfish mining is also wasteful in that miners spend serious resources trying to find a block that another miner is withholding. Thus, it is only economical for all miners to just play by the rules. In short, this is neither a sustainable nor responsible way to generate earnings on the Bitcoin network. 

How Selfish Mining Undermines the Decentralization Philosophy 

Decentralization is at the heart of Bitcoin’s philosophy. Satoshi envisioned that no person or group of people would have the authority to control the production or distribution of coins on the network. 

When a selfish miner generates a new block, their chain will be shorter than the public blockchain. However, if they keep hoarding blocks, their chain might eventually become longer than the one on the public blockchain. Naturally, honest miners will be inclined to join the private chain to earn more because the private network has a better chance to realize new blocks faster. If the selfish miner keeps ‘recruiting’ rational miners to their pool, they could eventually control the majority of the public blockchain. In essence, they will have all the power to generate and distribute Bitcoin. 

Is It Anything New?

Selfish mining is not entirely new, and for that reason, it should be particularly worrying to Bitcoin users. At the moment, two-thirds of all Bitcoin generated is mined in China, which is not a result of selfish mining. It just happens that it is easier to access ASICs in the country, plus electricity is way cheaper there than in other mining locations. As such, concerns have been raised about whether China has had a mining monopoly of sorts. Whatever the case, there is no indication that Chinese miners are working as a single enterprise. 

Are There Consequences?

If only a few miners adopt selfish mining, the overall impact on the blockchain network will be negligible. On the other hand, if all miners, hypothetically, take up selfish mining, their efforts will cancel out. Renowned economists have reiterated that it seems to make sense, while theoretically, the practice is not economically viable. Paul Sztorc, a popular economist, thinks that selfish miners will lose motivation upon realizing they are only backstabbing each other. In conclusion, selfish mining does not have enough economic motivation to become a widespread practice. 

Also, this activity may adversely impact Bitcoin’s reputation, which may cause its price to drop. Consequently, selfish miners will earn more Bitcoins but ones that are devalued. 

What’s the Future of Selfish Mining?

Selfish mining is likely to remain in theory or limited practice due to the reasons we’ve mentioned earlier. As we have seen, the major challenge with this practice is that if it becomes widespread, it will turn into a dirty game as selfish miners will be competing in hoarding new blocks. While this decreases the economic motivation, it might not exactly protect the Bitcoin network from the inefficiencies created. 

So, what would be a better solution? A research paper has proposed a scheme for penalizing nodes that withhold new blocks. The proposal ensures that miners who generate new blocks and fail to publish them on the blockchain have their mining rewards reduced. This would be an ideal penalty for selfish miners, but it appears as if the practice is not a huge threat currently.

Final Thoughts 

Selfish mining can allow mining syndicates to increase their revenue by always creating the longest chain and attracting other miners to their pools. While the threat is realistic, the likelihood of widespread selfish mining is diminished. The practice is wasteful, and if it becomes widespread, all miners lose their rewards. As we wait to see if indeed the threat will ever become substantial, Bitcoin users can rest easy knowing that Satoshi’s vision of decentralized production and distribution of money lives on. 

Categories
Cryptocurrencies

Just How Promising is the NFT Market?

The NFT market is the collection of all NFT trades. So, let’s define NFTs first. An NFT (Non-Fungible Token) is a special kind of crypto token that just cannot be exchanged for another (possibly) equivalent token. 

In the cryptocurrency universe, there are coins, tokens, and other miscellaneous digital assets; and there are non-fungible tokens. Of all these, NFTs stand out for one cool reason: each token is different and can be uniquely identified. Let’s contrast them with currencies – a dollar bill can be exchanged for another dollar bill to put this into perspective. But it wouldn’t be that straightforward exchanging a diamond ring with another. 

Crypto Tokens Primer

Before diving deep into NFTs and their promising future, let’s first review cryptocurrency tokens from a wider perspective. 

Generally, a crypto token is a digital representation of an asset or a specific utility. For instance, such a token could represent redeemable loyalty points. Typically, these tokens can be exchanged for cryptocurrencies, fiat currency, or some special privileges. Like all other cryptocurrencies, they reside on the blockchain – which allows them to leverage all the benefits of distributed ledgers.

NFT Applications

One of the things that make the NFT market potentially explosive is its increasing adoption in various applications. Within the last few years, developers have come up with NFT-based solutions for different use cases. Let’s look at a few of these:

  • Crypto art – This emerging concept is a blend of art and blockchain technology. The idea has been used to help artists claim ownership of their works, create currencies specifically for buying artworks, and verify artwork’s authenticity, among other uses. Judging by the number of startups, there is growing interest in the use of NFTs in art. 
  • Digital collectibles – Collectibles such as trading cards have been developed based on NFTs. The Rare Pepes and Age of Chains projects are good examples of how NFTs have inspired the generation and distribution of digital collectibles. 
  • Gaming – The gaming industry is undoubtedly seeing unprecedented disruption levels, thanks to the invention of NFTs. There are already a myriad of NFT use cases within the gaming sector, and this list is growing. To understand the weight of NFTs’ potential in gaming, note that gaming activity on Cryptokitties (an Ethereum-based game that allows players to purchase, collect, breed, and sell virtual cats) once caused a traffic jam on the Ethereum blockchain. 

Why NFT Is set for Exponential Growth

As of June 2020, the total sales of NFTs had reached $100 million. The 1-year market performance of NFTs (between November 2019 and November 2020) has not been characterized by dramatic rises and falls – as has been the case with some of the major cryptocurrencies. Even so, the NFT market has shown a slow but steady growth within that period. Developments in the sector suggest that NFTs could only grow faster. Below are the top five reasons why you should think so too.

#1: Scarcity 

NFTs are designed with scarcity at the very core of their philosophy. Tokens such as trading cards and in-game assets exist in minimal quantities. For instance, each virtual cat on Cryptokitties is unique. This means that if you fancy the cat and really want to have it, you must be willing to spend some coins. This would not be the case if you could duplicate the cat or if all cats were equal.

As crazy as the idea sounds, the game’s logic’s psychological aspects make it work just as intended. The idea that there is only one unit of a certain item drives its demand.

#2: Fun and Simplicity

Compared to cryptocurrencies, NFTs are fun and simple to understand. These two features make it easy to learn and adopt NFTs for different uses. There is a multitude of NFT users who don’t even know they are enjoying the fruits of blockchain. In contrast, most cryptocurrency users are forced to learn some of the hard stuff about how crypto’s work is like picking a good wallet, avoiding scams, etc. In short, NFTs were invented (or have been adapted) majorly for fun use. 

Needless to say, the increasing use of NFTs in gaming will promote its adoption. Games have been used to promote the adoption of computers, health interventions, learning activities, and much more. These are all indications that the use of NFTs in gaming will give its adoption a power boost and ultimately contribute to this market’s growth.

#3: High Acceptance in Asia

Asia plays a crucial role in the gaming world. Even before cryptos came into existence, South Korea’s gaming industry had already invented the concept of redeemable in-house currencies, something that could allow you to convert in-house currencies to South Korean Won. Many fun, cute little characters (including many of the emojis we know today) were born in Japan.

The fact that most NFT projects (games in particular) target the Asian market means that they are likely to fit naturally into the region’s cultural context, and this will organically drive up the growth of the NFT market. 

#4: Attractive Investment

NFTs present themselves as equally attractive (if not more) as cryptocurrencies. Part of this high appeal comes from their simple nature. NFTs also highly resemble real-world valuables, which investors are already familiar with. An example is rare artworks whose valuation is widely criticized for being arbitrary. Factors such as who previously owned an artwork, the reputation of the gallery where it is curated, its provenance, etc., can exponentially drive up the artwork’s value. 

Back to NFTs – developers can easily create crypto artworks, such as game characters, and assign them these “special attributes.” In case you’re wondering why everyone won’t just create their characters and make money, well, it all boils down to scarcity. And this heavily depends on developer’s/investor’s creativity.  

#5: Mainstream Adoption 

NFTs are making their debuts in different sectors of the mainstream economy, and they are already creating a frenzy. Nike, for example, has filed a patent for its proposed CryptoKicks – physical shoes with digital identities. CryptoKicks will allow Nike’s customers to set apart genuine sneakers from knock-offs. Since it will be possible to trace a pair of sneakers’ ownership history, we might start seeing high-stake auctions and the like. The bottom line is, NFTs have officially entered the mainstream economy, and it won’t be the same again. 

Final Thoughts

NFTs are among the latest inventions on the blockchain. While they have been adapted for several utilities, their use in gaming is particularly notable. To date, NFTs worth $100 million have been traded – which is a sign of investor confidence in the relatively new concept. Also, 2020 has been a fairly good year for the sector, which has so far recorded a slow but steady growth. NFTs are easy to learn and use, which gives them an edge when it comes to quick adoption among user communities. Coupled with scarcity, high adoption in Asia, its attractiveness to investors, and increasing mainstream adoption, the future of NFTs is highly promising. Naturally, the next thing to look out for is how to take advantage of this promising future. 

Categories
Crypto Market Analysis

Daily Crypto Review, Dec 4 – Bitcoin Above $19,000; Ether Fighting for $600

The cryptocurrency sector has spent the day trying to regain its recent highs, with Ethereum breaking $600 and Bitcoin breaking $19,000. Bitcoin is currently trading for $19,314, representing an increase of 1.14% compared to our last report. Meanwhile, Ethereum’s price has increased by 2.15% on the day, while XRP managed to lose 0.52%.

 Daily Crypto Sector Heat Map

The past 24 hours have passed without any major winners or losers in the top100 cryptos. Ren gained 5.23% in the past 24 hours, making it the most prominent daily gainer in the top100. It is closely followed by Band Protocol’s 4.44% and VeChain’s 4.08% gain. On the other hand, Decentraland lost 4.98%, making it the most prominent daily loser. It is followed by Uniswap’s loss of 4.79% and Kyber Network’s loss of 4.49%.

Top 10 24-hour Performers (Click to enlarge)

Bottom 10 24-hour Performers (Click to enlarge)

Bitcoin’s market dominance has barely changed since we last reported, with its value currently being 62.4%. This value represents a difference of 0.1% to the upside when compared to yesterday’s value.

Daily Crypto Market Cap Chart

The crypto sector capitalization has decreased just slightly in the past 24 hours. Its current value is $570.51 billion, representing a $0.54 billion decrease compared to our previous report.

_______________________________________________________________________

What happened in the past 24 hours?

_______________________________________________________________________

_______________________________________________________________________

Technical analysis

_______________________________________________________________________

Bitcoin

Bitcoin has spent the day trying to break its immediate resistance (which is sitting at $19,490). However, all attempts throughout the day have been unsuccessful, which prompted Bitcoin to pull back slightly. However, the largest cryptocurrency by market cap has established its presence above $19,000 with confidence once again.

Bitcoin is quite unpredictable at the moment, making safe trades hard to find. Traders should pay attention to BTC volume and enter trades with a high profit/loss ratio to quickly mitigate the risk of things turning from good to bad.

BTC/USD 1-hour chart

Bitcoin’s technicals on all time-frames are bullish, but they all show some signs of neutrality (or even bearishness) alongside the overall bullishness.

BTC/USD 1-day Technicals

Technical factors (4-hour Chart):
  • Price is currently above its 50-period EMA and slightly above its 21-period EMA
  • Price is at its middle Bollinger band
  • RSI is neutral (56.72)
  • Volume is average
Key levels to the upside          Key levels to the downside

1: $19,500                                 1: $19,000

2: $19,666                                 2: $18,790

3: $20,000                                 3: $18,500

Ethereum

Ethereum has spent the day following Bitcoin’s movement, with its price first pushing towards the upside and then pulling back as it was unable to break a certain level (in this case, $620. On the other hand, the second-largest cryptocurrency by market cap has seemingly established its presence above $600, though not with nearly as much conviction as Bitcoin did.

If Ethereum traders followed our advice from yesterday’s analysis, they would have made quite a good profit by longing Ether after it broke $600, with a stop-loss set slightly below this level. While trading Ethereum is still quite possible, the current high correlation with Bitcoin’s movement makes Bitcoin a (possibly) better option to trade, simply due to fewer variables a trader would have to consider.

ETH/USD 1-hour Chart

Ethereum’s daily and monthly overviews are completely bullish, while its 4-hour and weekly time-frames show some form of neutrality next to the overall bullishness.

ETH/USD 1-day Technicals

Technical Factors (4-hour Chart):
  • The price is currently above its 50-period and slightly above its 21-period EMA
  • Price is at its middle Bollinger band
  • RSI is neutral (57.22)
  • Volume is average
Key levels to the upside          Key levels to the downside

1: $620                                     1: $600

2: $630                                     2: $510 

3: $735                                      3: $500

Ripple

The fourth-largest cryptocurrency by market cap has had another extremely slow day, with its price barely fluctuating at all. The low volume and low volatility are continuing throughout the week, with XRP just barely moving to the downside as a response to the minor pullback caused by Bitcoin’s movement.

Trading XRP is a near-impossible feat at the moment, as the cryptocurrency currently shows no volatility and (therefore) no trade opportunities.

XRP/USD 2-hour Chart

XRP’s daily and monthly overviews are completely bullish, while its weekly time-frames show bullish sentiment with a hint of neutrality. Its 4-hour overview, however, is completely bearish.

XRP/USD 1-day Technicals

Technical factors (4-hour Chart):
  • The price is (at the moment of writing) slightly above its 50-period EMA and slightly below its 21-period EMA
  • Price is slightly below its middle Bollinger band
  • RSI is neutral (48.53)
  • Volume is slightly below average
Key levels to the upside          Key levels to the downside

1: $0.666                                   1: $0.6

2: $0.78                                     2: $0.596

3: $0.79                                   3: $0.535

Categories
Crypto Daily Topic Cryptocurrencies

How to Mine Litecoin: No One Will Ever Tell You This

Litecoin is one of the most popular cryptocurrencies today. The currency is a clone of Bitcoin and appears to ride on the popularity of the pioneer cryptocurrency. However, the crypto has its own merits – like being a ‘lighter’ version of Bitcoin and thus being used in day-to-day transactions. Litecoin is faster than Bitcoin – having a block time of 2.5 minutes compared to Bitcoin’s 10 minutes, meaning it’s quicker and easier for Litecoin miners to make money. 

Litecoin was created in 2011 by Charlie Lee, a former Google engineer. He modeled it after Bitcoin but with certain modifications intended to help it scale compared to Bitcoin. At the time of writing, the currency has a per-token value of $69.54 and a market rank of #7 with a market capitalization of 4.59 billion. 

In this piece, we’ll take a look into the nitty gritties of mining Litecoin.  

#1. Mining equipment

In the early days of Litecoin, the cryptocurrency could be mined using CPUs and GPUs. Litecoin uses the Scrypt hashing protocol – the first successful cryptocurrency to use it. Lee opted for Scrypt instead of Bitcoin’s SHA-256 due to the former being lighter and also because”using Scrypt allows one to mine Litecoin while also mining Bitcoin.” 

However, it’s no longer possible to turn a profit when mining Litecoin with CPUs and GPUs. This is because as competition has ramped up for the currency, mining difficulty has increased, requiring miners to use application-specific integrated circuits (ASICs) developed specifically for the currency. One of the most popular ASICs for Litecoin include Bitmain’s Antminer and LTCMaster. ASICs tend to go for around $1,000 for older models and around $2,000 for newer models. It’s best to go for the newer models, which are more effective. 

 #2. Should you join a mining pool? 

Once you’ve identified which hardware to use, the next decision will be to mine solo or join a mining pool. A mining pool is a group of miners who share computing power to multiply the chances of finding a block and earn mining rewards. Mining alone means you will get to keep all the mining rewards plus a fraction of the transaction fees. (The current mining rewards are 12.5 LTC per block. This will be halved in the next Litecoin halving, which will happen in 2023). And even then, this will require that you have massive hash power (multiple ASIC machines). Mining with a single ASIC is almost guaranteed never to turn a profit. 

By contrast, concentrated computing power in pool mining makes it many times easier for the pool to discover new blocks and attain a reward. The reward is then distributed according to the contribution of each miner. Bear in mind pool mining itself is not guaranteed to turn a profit since it depends on chance, but earnings via a pool are more steady than solo mining. 

Before you join a mining pool, make sure to investigate it thoroughly. Some pools out there are outright scams, while others are just plain shady. Also, it’s not uncommon for a mining pool to fall victim to hacks. So always check a pool’s security history and how they handled any breaches, reputation, member reviews, and management team. Also, try not to keep large amounts of your proceeds with the pool. It’s good practice to transfer proceeds to your wallet as soon as possible. 

Some of the most trusted and popular Litecoin pools out there include F2Pool, LitecoinPool.org, ViaBTC, and ProHashing.

Litecoin: Cloud Mining 

ASICs and pools are not for everyone. Maybe you want to mine Litecoin and don’t have the means or desire to splurge on expensive hardware. Well, you’re in luck because there’s an option of cloud mining that allows you to pay a remote data center to do the mining for you.

With this option, you will be required to put up a certain amount of money – but not nearly as much as you would for an ASIC – to get access to the cloud mining platform. The more you invest, the more you stand to gain from the platform. 

We can’t stress this enough – cloud mining is even more susceptible to scams than mining pools. There are individuals out there who are happy enough to take strangers’ money without an actual mining operation going on on their side. This behooves you to do serious research before getting entangled with any cloud miner. One of the most reputable cloud mining sites is Scotland-based Hashflare, which also has data centers in Estonia and Iceland. Hashflare has been around since 2014 – demonstrating its credibility and staying power. 

Wallets 

The last thing you need to consider is where to store your Litecoin. You have a variety of options starting with the Litecoin Core Client. This is a wallet by the Litecoin Foundation and is open-source, feature-packed, and updated regularly to make it more robust and easier to use. With the Litecoin Core Client, you can store, send, and receive Litecoin as well as view the transaction history of the blockchain. To use this wallet, you have to download the full blockchain on your computer. Of course, it will take up a lot of space, but it pays a lot of security dividends in the long run. The wallet supports Windows, MacOS, and Linux. By using Litecoin Core, you also contribute to the network’s security and decentralization since you’re running a ‘full node.’ 

You also have the option of a cold storage wallet. A cold wallet is one that’s not connected to the internet. This means it is unhackable, and hence very safe. If you have a large sum of Litecoin, a cold storage wallet is your best go-to option. There are also paper wallets that constitute a physical paper in the form of a QR code or a string of alphanumerics. A paper wallet is safer than an online wallet, but it’s vulnerable to theft and damage through fire, water, and wear and tear. You can increase your paper wallet security by laminating it and putting it in a safe place that only you know about. These days, people even strongly advocate for ‘brain wallets,’ which constitute memorizing a seed phrase that you can use to recreate your private key. Obviously, a brain wallet is the most secure of all these options.

Other people choose to keep their crypto funds on exchanges. Exchanges have the advantage of quickly swapping your crypto for fiat. However, this option is not recommended. That’s because exchanges are famously the target of hacking, and you can lose your money in the case of a security breach. Also, you have limited control over your Litecoin in such a wallet. 

Final Thoughts 

Litecoin is one of the most relevant cryptocurrencies, and investing in it through mining is a savvy move. Of course, there are risks to every profitable endeavor, so make sure to do your due diligence before you go all in. 

Categories
Cryptocurrencies

Bitcoin or Ethereum in 2021, Where Should You Invest?

Bitcoin started the year (2020) on a rather low key, fetching only an average of $7,500 until July when things started looking up. Ethereum seemed to play the same tune for the first half of the year. Unsurprisingly, both cryptocurrencies showed steady growth against the dollar from July onwards. This trend can be confusing to investors – should you invest in Bitcoin or Ethereum in the coming year? In this article, we help clear the confusion by addressing each currency’s nature, its performance in 2020, and its prospects in the coming year. 

Are We Comparing Apples to Oranges?

Seasoned investors will be quick to note that Bitcoin versus Ethereum is an odd comparison, and they’d be right. Bitcoin is inherently a currency and not much more. On the other hand, Ethereum has DApps, smart contracts, tracking of digital collectibles, and many other uses. So, on a broader scale, comparing Bitcoin and Ethereum might not make sense. 

However, Ethereum has ETH, which is pretty much tradable like BTC. You can invest in ETH just as you would do with BTC. So, we can go ahead and compare BTC and ETH as investment alternatives.

Bitcoin versus Ethereum Price Trend 

Bitcoin usually sets price trends for all other cryptocurrencies, and any instabilities faced by the network sends ripples across the entire cryptocurrency universe. The performance of both Bitcoin and Ethereum followed a similar trajectory in most of 2020. In the first half of the year, Bitcoin seemed to struggle, and so did Ethereum. Both hit their all-time lows around March, but a keen analysis of the price history reveals that Ethereum was always trailing

This is an advantage if you are planning to invest in Ethereum since you have a better chance of predicting how things might turn out in the short run. If the 2020 Bitcoin-Ethereum price trend spills over to 2021, you can assume that ETH price fluctuations will follow Bitcoin in about 7 days. For instance, if you plan to buy ETH, wait for BTC to drop consistently for about 7 days and then jump in. Of course, do not religiously rely on this trend as other forces might come to play and disrupt the pattern.  

Adoption and Ease of Use

A cryptocurrency’s appeal and ease of adoption can give it some edge when it comes to investment. When there are plans to adopt a cryptocurrency for some industry use, its price usually hikes. For instance, in October, PayPal announced that it would start allowing Bitcoin spending on its network from early 2021. The plan is to incorporate most of the major cryptos ultimately. Still, the company mentioned that it would start with Bitcoin, which was good news for Bitcoin investors more than any other crypto investors. There had been rumors about this announcement from the beginning of October, and Bitcoin’s prices were already going up as the month began. Bitcoin was exchanging at the time of writing at almost $14,000 – the highest in 30 months. 

Visa and MasterCard had already introduced crypto credit and debit cards. They are currently seeking to extend the availability of these cards to Europe and states in the US that have yet to be covered. Cryptocurrencies are increasingly integrating into the mainstream economy, and we are likely to see an increase in such activities in 2021. Given that Bitcoin’s ease of adoption gives it an advantage over other cryptos, it might be a better choice. 

Consider the Impacts of the US Elections

US elections usually seem to shake the global economy. During Trump’s first presidential contest, there was widespread uncertainty over economic and political outcomes. Speculation that he could win led to a weakening of the dollar relative to the four major currency pairs. Bitcoin’s prices rose slightly at the same time – indicating that the two events could have been related. Generally, if there is political uncertainty, the dollar may weaken and cause reduced stock markets’ activity. In such cases, investors may turn to crypto trading.

If the elections sail smoothly, we can expect minimal disturbance to the stock markets. However, if political turmoil follows the elections, there is a chance investors will shy away from the stock markets, and, conversely, activity in the crypto space may increase. Naturally, Bitcoin would take the lead as others follow. 

Bitcoin’s Prospects in 2021

Since the start of Bitcoin’s bear market in 2018, the currency has struggled to surpass the symbolic $10,000 mark, which can be considered its 30-months resistance threshold, only hitting the high twice but briefly. However, since July 2020, Bitcoin seemed to have overcome the resistance, maintaining a minimum of $10K and having peaked at $13,950 in November. Between October 17th and 27th of the same month, Bitcoin leaped a whopping $2,000! All these arguments indicate that the currency is strongly poised for the bull market in the coming months.

Overall, things are looking up for Bitcoin. The upcoming PayPal integration and adoption by Visa and MasterCard are also expected to give it a major boost. Nevertheless, if you’re considering investing in Bitcoin now or in early 2021, bear in mind that a resistance/support flip at $14,000 is conceivable. Therefore, you may want to hold on until you observe downward movement within the $14,000-$12,500 range. 

Ethereum’s Prospects in 2021

Ethereum has exhibited a lot of uncertainty in 2020. For instance, between March 6th and March 12, the currency dropped from $243 to $112 – losing more than half of its value in less than a week. However, it showed steady growth between April and July before making a sudden upward move to $380 in August. Since then, it has appeared to be oscillating between resistance at $380 and support at $320. Of course, there have been sudden but brief spikes and falls in between, but this resistance/support pair gives a general idea of how the currency has been performing in the last quarter of 2020. 

There are numerous Ethereum projects that are currently going on, and others scheduled for early next year. Most of these ventures are decentralized applications (DApp) projects. However, none of them seem to have the potential to disrupt the crypto economy substantially. This could be partly because Ethereum has a rather low rate of adoption. Based on these observations, we are unlikely to see the currency make a bullish run. Even so, slow and steady growth in 2021 is very much conceivable. 

Judging from its performance in the last half of 2020, it would be safe to assume that Ethereum will be a low-risk-low-return investment, at least for the better part of 2021. 

Final Thoughts

Both Bitcoin and Ethereum offer exciting investment opportunities. Each has a unique profile that makes it suitable for different investor needs. Both currencies have also shown relative stability and growth in the last half of 2020. However, the high volume of activity involving Bitcoin indicates a higher likelihood of the currency shooting even higher in 2021. On the other hand, Ethereum seems to be poised for slow but steady growth in the next few months. All in all, it seems like a good time to consider investing in either. Just ensure you set your investment goals and check that they are aligned with the currency’s growth trends. 

Categories
Crypto Market Analysis

Daily Crypto Review, Dec 3 – PayPal and BlackRock Heads Extremely Bullish on Bitcoin; Crypto Sector Consolidating

The cryptocurrency sector has spent the day stabilizing after a sudden drop. Bitcoin is currently trading for $18,997, representing an increase of 0.48% compared to our last report. Meanwhile, Ethereum’s price decreased 0.64% on the day, while XRP managed to lost 0.01%.

 Daily Crypto Sector Heat Map

Decred gained 39.22% in the past 24 hours, making it the most prominent daily gainer in the top100. It is closely followed by Elrond’s 30.56% and Curve DAO Token’s 10.36% gain. On the other hand, Nexo lost 5.60%, making it the most prominent daily loser. It is followed by Status’s loss of 2.72% and Augur’s loss of 1.66%.

Top 10 24-hour Performers (Click to enlarge)

Bottom 10 24-hour Performers (Click to enlarge)

Bitcoin’s market dominance hasn’t changed since we last reported, with its value currently staying at 62.3%. This value represents a 0% difference when compared to yesterday’s value.

Daily Crypto Market Cap Chart

The crypto sector capitalization has increased significantly in the past 24 hours. Its current value is $571.05 billion, representing a $10.27 billion increase compared to our previous report.

_______________________________________________________________________

What happened in the past 24 hours?

_______________________________________________________________________

_______________________________________________________________________

Technical analysis

_______________________________________________________________________

Bitcoin

Bitcoin has spent the day recovering from yesterday’s pullback and trying to regain $19,000. However, this level has proven to be a solid resistance zone, and it is unsure whether Bitcoin will manage to push over it. On the other hand, the overall sentiment around the largest cryptocurrency by market cap is incredibly bullish, mostly due to the massive investments coming from the institutional side.

Bitcoin is very volatile and unpredictable at the moment, making the trades quite hard to pull off. Traders should pay attention to volume and watch smaller time-frames and enter trades with a high profit/loss ratio to mitigate the risk when things go bad.

BTC/USD 4-hour chart

Bitcoin’s short-term technicals are completely bullish, while its weekly and monthly technicals show some signs of neutrality alongside the overall bullishness.

BTC/USD 1-day Technicals

Technical factors (4-hour Chart):
  • Price is above its 50-period EMA and slightly above its 21-period EMA
  • Price is at its middle Bollinger band
  • RSI is neutral (54.55)
  • Volume is average
Key levels to the upside          Key levels to the downside

1: $19,000                                 1: $18,790

2: $19,500                                 2: $18,500

3: $19,666                                  3: $18,240

Ethereum

Ethereum has spent the day mostly flat and hovering right under the $600 mark. The second-largest cryptocurrency by market cap has continuously failed to break the immediate resistance level but did not back down from it.

Ethereum traders have a good chance of catching a safe trade with a stop-loss slightly below $600 if Ether pushes above $600 (either because of its own price movement or as a response to Bitcoin breaking $19,000 with conviction).

ETH/USD 4-hour Chart

Ethereum’s daily and monthly technicals are completely bullish, while its 4-hour and weekly time-frames show some neutrality next to the overall bullishness.

ETH/USD 1-day Technicals

Technical Factors (4-hour Chart):
  • The price is above its 50-period and at its 21-period EMA
  • Price is at its middle Bollinger band
  • RSI is neutral (54.35)
  • Volume is average
Key levels to the upside          Key levels to the downside

1: $600                                     1: $510

2: $630                                     2: $500 

3: $735                                      3: $490

Ripple

The fourth-largest cryptocurrency by market cap has had another slow day, with its price fluctuating between $0.6 and $0.64. The $0.6 support level seems to be holding quite well, while the $0.625 level got ignored several times, which made us remove it from the key levels section.

Trading XRP is almost impossible as the cryptocurrency currently has no volatility and (therefore) no trade opportunities.

XRP/USD 4-hour Chart

XRP’s daily and monthly technicals are completely bullish, while its 4-hour and weekly time-frames’ show bullish sentiment with a hint of neutrality.

XRP/USD 1-day Technicals

Technical factors (4-hour Chart):
  • The price is slightly above its 50-period EMA and at its 21-period EMA
  • Price is at its middle Bollinger band
  • RSI is neutral (51.08)
  • Volume is slightly below average
Key levels to the upside          Key levels to the downside

1: $0.666                                   1: $0.6

2: $0.78                                     2: $0.596

3: $0.79                                   3: $0.535


Categories
Crypto Videos

Facebook’s Libra Reportedly Launching in Jan 2021 as a USD Stablecoin!


Facebook’s Libra Reportedly Launching in Jan 2021 as a USD Stablecoin

According to a new report, the very controversial and long-awaited digital currency Libra could see the light of day as soon as Jan 2021. After more than a year of scrutiny from global financial regulators, Facebook’s Libra will launch in the form of a US dollar-backed digital currency, as Financial Times reported on Nov 27.


The Financial Times cited three people involved in the Libra project, as they stated that Libra Association’s plans would eventually add more fiat currencies to the digital currency’s basket of assets.

While the exact launch date is still unknown, January 2021 has been brought up several times as the most likely option. However, the launch date would ultimately depend on when the Libra Association receives regulatory approval from the Swiss Financial Market Supervisory Authority to operate as a payments service.

A FINMA spokesperson declined to make any statements or comments regarding Libra’s potential launch in January 2021. Instead, the representative referred to Libra’s announcement on its licensing process, stating, “In accordance with its practice, FINMA will not provide any public information on the status of the current and ongoing procedure, nor speculate on when it may reach completion.”

Initiated in Jun 2019, the Libra Association faced quite a bit of regulatory scrutiny, which caused a number of member companies such as PayPal and MasterCard to subsequently back out from the project. The basket of currencies that was originally supposed to back Libra included several fiat currencies, including the US dollar, euro, the Japanese yen, the British pound, as well as the Singapore dollar.

According to the Financial Times’ report, several Libra members believe that the appointment of HSBC legal chief Stuart Levey as CEO was a turning point for the Libra project.

Categories
Crypto Videos

CRYPTO – Cypherpunk Holdings Becomes 9th largest Public Bitcoin Whale!


Cypherpunk Holdings Becomes 9th-largest Public Bitcoin Whale


Cypherpunk Holdings, a privacy-focused investment company from Canada, has recently upped its stake in Bitcoin while simultaneously dumping Monero and Ethereum. The company disclosed on Nov 26 that it has added 72.979 Bitcoin to its reserves and that the expansion of its Bitcoin portfolio share started on June 30, 2020.

Cypherpunk funded this acquisition by liquidating its holdings of Monero and Ethereum, as well as through partial proceeds that came from a private placement of CA$505,000, or the US $388,000, closed on Aug 27. As an aftermath of the accumulation, the company now has 276.479 Bitcoin in its reserves, making it the ninth-largest public holder of Bitcoin. At current values, Cypherpunk’s stake in Bitcoin is worth just over $4.8 million.

At the moment, at least 14 publicly traded companies held Bitcoin on their books, with Cypherpunk being one of them. Combined, their holdings now amount to 66,896.59 Bitcoin, or $1.2 billion. This number is equivalent to roughly 3.2% of Bitcoin’s current circulating supply.

Cypherpunk Holdings, which currently trades on the Canadian Securities Exchange, has numerous privacy-focused businesses under its name, including Wasabi Wallet as well as Samourai Wallet. The company’s blockchain investments also include Hydro66, a green cloud infrastructure platform, and smart contract protocol Chia Network.

Cypherpunk Holdings is run by Antanas Guoga, also known as Tony G, a Lithuanian businessman, politician, and former professional-level poker player. He currently serves as an elected member of the Seimas, a legislative branch of the Lithuanian government. Prior to this, he served as a member of the European Parliament for Lithuania.

More and more public companies are converting their various holdings into Bitcoin as a more suitable store of value nowadays. MicroStrategy is the most prominent example of this trend, as it has converted most of its cash holdings into Bitcoin. The company now sits on a whopping 38,250 Bitcoin after nearly doubling its holdings this year. Galaxy Digital is the second-largest public Bitcoin holder, sitting at 16,402 Bitcoin, followed by Square holding the third-largest Bitocin holder spot with 4,709 Bitcoin.

Categories
Cryptocurrencies

How To Avoid the Bitcoin FOMO and Double Your Investment

‘The hardest thing to do in a bull market is to sit,’ says Mike Novogratz, a renowned Bitcoin evangelist. This is a feeling most investors can relate to. In a bull market, prices surge, and volumes skyrocket. And with the wave comes an irresistible urge to board the bandwagon – the fear of missing out (FOMO).

Beginning July 2020, Bitcoin has shown steady performance against the dollar and altcoins. However, it’s the currency’s performance in October and November that has left investors scrambling for the 18.5 million or so Bitcoins in existence. The Bitcoin FOMO is officially here, and many investors will make blind decisions. 

This article will look closely at the ongoing frenzy, what it means to investors, and how to approach it. 

Bitcoin in 2020

Bitcoin started 2020 modestly, only managing to fetch about $7K in January. It briefly jumped to $10K before plunging into an abyss, exchanging at less than $5K in March. But that seems to have marked the end of the dramatic falls. From mid-March, the currency started recovering steadily, and towards the end of July, it hit the symbolic $10K figure. Every time Bitcoin climbs to $10K, investors start getting all fidgety, as has been the case several times.

Since Bitcoin reached $10K in July, it has been going up almost consistently. In less than three months, it has gained over 50%, which is more than impressive. It isn’t easy to point out with certainty how things will turn out. However, investor greed and excitement is likely to push the figures even higher, at least in the short run.

What is the Fear and Greed Index Saying?

The crypto Fear and Greed Index is a contrarian scale that expresses investors’ general sentiment with regards to fear and greed. The idea is that when fear is high up there, investors will shy from trading, and that will cause prices to decline. On the converse, if investor greed is high, increased trading, and prices will rise. 

Different crypto fear and greed indices have shown a consistent increase in greed. A higher score represents more greed, while a low score represents more fear. Since these two factors are on opposite sides of the scale, one declines as the other increases. As reported by the fear and greed indices, the trend has closely resembled Bitcoin’s price trends all year long. 

Trading volume can give a clear picture of what is going on in the Bitcoin market. Exchanges everywhere are reporting sky-high volumes. 

An increase in volume usually triggers an increase in prices and hence an increase in market cap. 

What Has Caused the Sudden Interest?

When Bitcoin reached $10K in July, there was news all over the interweb covering this historical moment. Crypto evangelists and analysts, once again, resurfaced giving their expert opinions and predictions on how Bitcoin was going to double its value unless something ‘really wrong’ happens. You could look at it like a self-fulfilling prophecy, where speculators create so much hype that the market inevitably skews to their predictions. We certainly cannot underestimate the power that speculators have on market movements. In this case, there can only be little doubt that positive news about Bitcoin’s prospects contributed to increased interest in the currency. 

News is not the only positive thing that has been going around. In 2020, there has been a particular corporate interest in crypto. Several organizations, some of them high-ranking, have expressed interest in adopting cryptocurrencies. In October, Square – a global financial services provider – bought 4,000 Bitcoins for about $50 million, saying that it believes Bitcoin aligns well with the company’s purpose. Spending such amounts of corporate cash on buying crypto signifies corporate confidence in the future of cryptocurrencies. 

Just recently also, PayPal announced plans to have Bitcoin and other cryptos on its payments platform. This announcement was immediately followed by a surge in BTC prices to reach $12K. Several other top-tier corporations have expressed interest in mainstreaming cryptocurrencies, and this is undoubtedly part of the cause of the sudden surge in interest in crypto. 

What You Should Do

If you had not invested in Bitcoin before it broke the $10K barrier, you might be late to the party. Normally, by the time the buying frenzy kicks in, early-bird investors will be counting profits. Look at it this way, those who bought Bitcoin before July 26, that’s right before it surpassed the $10K high, are already counting a 50% profit less than three months down the line (BTC was at $15K at the time of writing). 

Even so, not all is lost. There are many indications that the Bitcoin market will be on the bull run for some time – how long that is, is a matter of conjecture. Therefore, you can still invest in BTC at this time and make profits. 

If you are determined to take the risk, here are some things to consider:

#1: Set Your Investment Goal – One of the unforgivable mistakes an investor can make is not to set goals. Such blind investments unsurprisingly end in tears. Setting a goal means having a plan for when to buy and when to sell. Just like gambling, you have to know when to hold them and when to walk away. For instance, you can decide to buy and sell when the price hits a certain figure, or you could decide to sell after a fixed term – regardless of whether you have gained or lost.

#2: Do Your Due Diligence – This is usually mandatory. Even if a reputable investor has advised you, you still have to do your due diligence. This may include seeking a second opinion, evaluating your finances, finding out whether you are ready to bear the risk, and so on. Because at the end of the day, it is your money that is at stake. Rushing into buying Bitcoin, especially amid such hype, may be regrettable. 

#3: Consider Altcoins – While all the attention is on Bitcoin, investors are busy ignoring other cryptocurrencies. When the Bitcoin market eventually heads for the bear run, investors might look at other cryptos. If you invest in the right altcoin at this time, you might be where Bitcoin’s early bird investors were before the frenzy began. 

#4: Sit on Your Hands and Lock Your Phone – Well, not literally, but if you can’t resist the temptation even when nothing makes sense, just avoid the markets altogether. This decision might save the little you have from drowning away in a possible market crash. As far as investment is concerned, you can consider that a profit.

Final Thoughts

Bitcoin’s recent performance has generated a lot of interest among investors. People are rushing to buy BTC, as evidenced by the increase in trading volume across exchanges. It would be great if we could all join the bandwagon, but extra caution is necessary for such market movements. Avoiding the hype is key in making a sound investment decision. You can invest in altcoins or simply avoid the markets until such a time when you can be under less pressure to make decisions. 

Categories
Crypto Daily Topic

Forget Bitcoin; This Is The Altcoin Everyone Is Rushing To Buy.

Fusion is one of those cryptocurrencies that came not just as another currency but as a platform for innovation. Although it is an open technology that can be used in various applications, this crypto is best known for powering decentralized finance (DeFi). Like Ethereum and Ripple, which are both currencies and innovation platforms, Fusion also offers FSN, its native currency.

Fusion is currently among the least valued crypto in market capitalization and trading volume, but this is likely to change. If innovations on the platform pick up the pace, Fusion will soon be trading in the big league of major cryptocurrencies. 

In this article, we review this underrated crypto and explain why, as an investor, you should keep an eye on Fusion.

Fusion is Driving the DeFi Revolution 

As already mentioned, Fusion’s niche is in the financial technology innovation space. The crypto seeks to achieve this through:

#1: Enriching digital assets – Businesses can use Fusion to create bonds, futures, and other financial instruments with the end goal of separating asset ownership and rights. This is the kind of innovation that traditional finance needs. 

#2: Creating digital exchanges – Fusion provides tools that businesses can use to create any kind of exchange – decentralized, centralized, private, and any other whose need might come up. Using Fusion’s digital exchange tools, low-cost transactions become an even closer reality. 

#3: Managing licenses and royalties – Fusion provides businesses with a platform they can use to issue time-bound licenses and collect royalties for intellectual property while circumventing the traditional challenges associated with these processes.

These are only a few use cases that show Fusion is a crypto with real utility. And as you might know, utility is what gives crypto the potential for growth. With this knowledge, there is no denying that this cryptocurrency has a bright future. 

While these proposed use cases only show that Fusion has the potential for exponential growth, there are more compelling reasons why you should think the crypto is set to rise. Let’s dig deeper.

Why Fusion Will Rise 

We have already seen that Fusion is a crypto with real utility. Solely based on this information, speculators can bet their dollars on the crypto’s future success. But would its financial and technological outlook pass the scrutiny of analysts? Let’s analyze this together.

#1: Fusion is still undervalued – The crypto entered the scene in February 2018 at $3.60 and rallied within three months to reach $9 with a market capitalization of over USD 270 million. The market corrected months later, and the prices went below the $1 mark, where they have stagnated ever since. 

At the time of writing, Fusion ranks at position 453 by market capitalization. Given that Fusion is a solid project, this position does not reflect the cryptocurrency’s true potential. It rose in the past; it will rise again. 

#2: Fusion’s WeDeFi project is gaining momentum – WeDeFi is a DeFi project whose goal is to promote DeFi’s mass adoption. It sounds similar to some of Ethereum’s DeFi projects, but its bull’s-eye focus on mass adoption gives it an edge. Anyway, DeFi is already on the rise, and this makes Fusion even more promising. 

#3: You can earn passively by staking – Fusion allows you to earn (at the time of writing) a 17% annual percentage yield (APY) by locking your funds on the network for at least 30 days. Unlike Bitcoin and other networks that rely on proof-of-work, Fusion uses proof-of-stake to verify transactions. According to the Staking Rewards website, Fusion ranks favorably, even higher than most of the top 30 cryptos. You don’t need expensive mining equipment or even the technical know-how – just delegating your savings to stake is enough to multiply your investment! Once investors learn this secret, Fusion’s stakes will increase. 

#4: Fusion supports smart contracts – There is an interesting feature called “Time Lock” that allows users to schedule transactions. It works like standing orders – a Fusion token holder can play around with their tokens on the network, but when the scheduled transaction is due, the tokens will be automatically transferred to their new owner. This feature will open up innovation on the network and spur its growth. 

#5: Fusion will soon support cross-chain token swap – Fusion is the house of innovation, and this time, they want to make it even easier to exchange any crypto token with any other. Dubbed ‘Anyswap,’ this one-of-a-kind innovation will allow infinite crypto pair exchanges – fully secured with DCRM interoperability. Even Ethereum’s ERC-20 is not there yet. One can only imagine how attractive this innovation will be to investors. 

#6: Fusion has stable liquidity – Currently, many exchanges support FSN/BTC, FSN/ETH, and FSN/USDT pairs, quite impressive for a crypto that is not even on the top 400 list. Is this a sign of their faith in the imminent growth of the cryptocurrency? 

We can go on and on unearthing the unique features that demonstrate that Fusion is poised for success. But, to clear all doubt, let’s take a look at the numbers – after all, numbers don’t lie. 

Fusion’s Financial Outlook

In the whole of 2020, Fusion has mostly traded below $0.50 and maintained its market cap roughly between 5 and 35 million dollars – a marginal variation by crypto market cap trends. One would say that the crypto is uneventful and perhaps lacks the volatility desired by investors. While there’s some truth in this school of thought, investors with a low-risk appetite and a long-term vision might find this relative stability desirable. In the long run, all indicators point to Fusion’s growth, and the coin’s historical stability means that investors can hope for more rallies than corrections. 

Fusion’s 24-hour volume (at the time of writing) was roughly $2 million. This is the volume at a time when the coin was exchanging at $0.26. In contrast, its 24-hour volume was only $7 million when it was exchanging at more than $9. What we’re saying here is that the crypto’s trading volumes have yet to reach their potential explosive heights. When that happens (indicators say it shall come to pass), Fusion’s value will skyrocket, and investors will reap big.

Final Thoughts

Fusion is one of the most underrated cryptos, yet, it is among the most innovative with lots of potential. With solid utility, a good track record, and numerous innovations in the pipeline, this cryptocurrency is poised for success. Currently, it is marked by relatively low trading volumes, market cap, and exchange rates. However, on the brighter side, it can be exchanged for several common currencies – both crypto and fiat, which guarantees investors liquidity. As we have seen, there are many reasons to believe that the future of Fusion is promising. 

Categories
Cryptocurrencies

Top Crypto Cashback Apps 2020

Crypto cashbacks or crypto awards are programs that allow you to get small Bitcoin awards when you spend money in a store. When you make a purchase, you’ll instantly be rewarded with a fraction of what you spent. The rewards will be in the smallest units of Bitcoin – satoshis.

Now, it’s perfectly understandable for new users to be apprehensive about some of these apps, considering the rampant fraud in the crypto world. Such hesitation is completely understandable. And the good news is: there are so many legit apps out there. 

Many people may be familiar with renowned cashback services like Rakuten, Honey, Ibotta, and Drop. But with the current growth of Bitcoin and other cryptocurrencies, other cash rebate apps are fast emerging.

In this article, we will look at legitimate apps that one can use to earn crypto rebates.

#1. Lolli

Lolli stays true to the ‘spend less shop more’ mantra. With this app, you can earn free Bitcoin when you shop online from over 500 participating sites. You can shop for various products ranging from clothes, stationery, card decks, toiletries, food, etc., and earn bitcoin while at it. 

This app has attracted a large user base due to its user-friendly interface, the variety of brands supported, and easy installation process. The only problem is that the application is currently only available on the desktop.

Some of the brands that reward clients with cashback rewards include: 

  • Travel industry – booking.com, Expedia, etc.
  • Food providers – Coffee Bean and Tea Leaf, Postmates, etc.
  • Fashion and beauty – Sephora, Nike, Topshop, etc.
  • Entertainment providers – Groupon, best buy
  • Services industry – GoDaddy, Udemy, etc.

These are but some examples. Many other vendors support Lolli. 

You can earn up to a max of 10% in cashback on your purchases. You only need to download the Lolli desktop plugin on Chrome to get going.

#2. Pei

Pei is a mobile app available on Android and iOS devices, and it is free to download. It allows you to earn BTC when you use your credit/debit card to complete a transaction. Apart from BTC, you can earn USD and gift cards through the use of your affiliated card.

This app is racking up a lot of attention because of its unique feature: double-dip rewards. This means that apart from amassing cashback, you can also earn points in Pei. These points are redeemable on their website, and you can use them to check out your shopping cart.

After downloading the app, you can register, attach a chosen card, and generate awards from purchase payments. Rewards are not credited to your account immediately. Each payment from your affiliated card that is reflected in your app provides points to your available total. The app has indicated support for other currencies in the near future (apart from BTC and USD). 

#3. Foldapp

This app is unique in the sense that you can earn rewards both online and offline. Foldapp offers you a prepaid program that you can use to purchase gift cards from a specific retailer. What’s even more interesting? You can do this before making an actual purchase. These gift cards allow you to earn bitcoin rewards and cashback. With this app, you can acquire crypto coins when you’re actually shopping in retail shops. 

#4. Bitcoin Rewards

This app allows you to earn free Bitcoin whenever you shop online. The catch is, you can only earn BTC from brands that have partnered with BTC Rewards. That’s no cause for worry, though, as a huge number of brands are participating. Also, along with BTC, you can choose from BCH and BNB to complete your payment. 

The app constantly updates on social media platforms with the latest cashback offers and other gift coupons associated with Bitcoin. Currently, these include discount codes and cashbacks from Rosegal and Contiki.

#5. Coinseed

Amazon and eBay are renowned online retail shops. With this particular app, you can earn crypto cashbacks from shopping in these virtual stores. Using the app, you can also earn Bitcoin when shopping at Walmart. 

Coinseed is considered one of the best platforms for earning cashbacks, mainly because of its automated investment and trading features. These features set it apart from other apps.

#6. Captain Bitcoin

There is nothing as irksome as experiencing pop-up ads while browsing the internet. With this app, you can turn around the annoyance and actually earn from watching short ads. These advertisements are usually from established companies. 

#7. Earn.com

With this app, you can earn cashback rewards by participating in tasks that take less than five minutes to complete. The tasks can include; taking part in studies, filling questionnaires, or responding to emails.  

Once completed, Earn.com allows you to get a small amount of Bitcoin. You can easily cash out your BTC earnings and spend them freely.

Users can set up an Earn.com public profile, which will enable them to receive messages and tasks from anonymous contacts.

#8. Stormshop

This platform can be easily accessed through Android and iOS devices. It is available in more than 187 countries and is connected to more than 400 merchants.

Cashbacks and rewards are available in various cryptocurrencies like ETH, LTC, DAI, Storm, among many others. You can earn cashback rewards through shopping in participating retail stores.

#9. CoinRebates

With this app, no matter how much you spend, you will earn fixed cashback awards. This platform is quite popular because of the number of businesses that have partnered with the app since its debut. Some of the partnering companies include; Walmart, Macy’s, and Expedia. 

Depending on the company you decide to do retail trade with, cashback ranges between 1.5 and 20%. Companies like Udemy provide 24 Bits, i.e., the platform’s currency, with each dollar you spend.

CoinRebates is not limited to U.S. users – European residents can equally enjoy the platform. Anyone can earn from the app as long as they are capitalizing on the rebates, and the competing stores can provide shipping support to the user’s country of origin.

Conclusion

Crypto cashback apps offer users a variety of options for earning crypto rewards. You can earn crypto by just watching ads, completing simple tasks, shopping, and more. And the icing on the cake is that these apps are simple and straightforward to use. That said, go forth and take advantage of this easy way to earn crypto. 

Categories
Crypto Market Analysis

Daily Crypto Review, Dec 2 – Traders Sell the News on ETH 2.0 Phase 0 Launch; Crypto Market in the Red

The cryptocurrency sector has dipped as the market entered a “selloff” mode the moment Ethereum’s 2.0 Phase 0 launched. The largest cryptocurrency by market cap is currently trading for $18,843, representing a decrease of 3.83% on the day. Meanwhile, Ethereum lost 2.83% on the day, while XRP managed to lost 6.17%.

 Daily Crypto Sector Heat Map

SushiSwap gained 34.83% in the past 24 hours, making it the most prominent daily gainer in the top100. It is closely followed by Kusama’s gain of 10.74% and Ampleforth’s 9.05% gain. On the other hand, HedgeTrade lost 10.21%, making it the most prominent daily loser. It is followed by Horizen’s loss of 9.44% and Ethereum Classic’s loss of 8.77%.

Top 10 24-hour Performers (Click to enlarge)

Bottom 10 24-hour Performers (Click to enlarge)

Bitcoin’s market dominance has decreased slightly since we last reported, with its value currently staying at 62.3%. This value represents a 0.1% difference to the downside when compared to yesterday’s value.

Daily Crypto Market Cap Chart

The crypto sector capitalization has decreased significantly in the past 24 hours. Its current value is $560.78 billion, representing a $17.09 billion increase compared to our previous report.

_______________________________________________________________________

What happened in the past 24 hours?

_______________________________________________________________________

_______________________________________________________________________

Technical analysis

_______________________________________________________________________

Bitcoin

Bitcoin has spent the day pulling back from its all-time highs and towards the $18,500 level. Its price formed a triangle formation on the 30-minute time-frame right after the price dump (which happened at the exact moment ETH 2.0 Phase 0 launched, as people were selling the news) and then broke it to the downside. Its price is now fighting for the $18,790 level (78.6% Fib retracement).

Bitcoin is quite volatile and unpredictable at the moment, but short trades in either direction could be viable. Traders should pay attention to volume and watch smaller time-frames and catch formations to trade off of them.

BTC/USD 30-minute chart

Bitcoin’s technicals on all time-frames are slightly tilted towards the buy-side. However, they show slight neutrality signs, except for the monthly overview, which is completely bullish.

BTC/USD 1-day Technicals

Technical factors (4-hour Chart):
  • Price is far above its 50-period EMA and at its 21-period EMA
  • Price is at its middle Bollinger band
  • RSI is near the overbought territory (52.95)
  • Volume is average
Key levels to the upside          Key levels to the downside

1: $19,000                                 1: $18,790

2: $19,500                                 2: $18,500

3: $19,666                                  3: $18,240

Ethereum

Ethereum has, just like Bitcoin, pulled back as traders sold the news of ETH 2.0 Phase 0 launching. While its move wasn’t as pronounced, the second-largest cryptocurrency by market cap did lose quite a bit of value, as well as most likely confirmed its position below $600. The double top formation was confirmed, which added to the decisiveness of the drop.

Ethereum traders should pay close attention to Bitcoin’s movement, as it currently dictates the market direction regardless of what news moves the market (news on Bitcoin or any other altcoin).

ETH/USD 4-hour Chart

Ethereum’s daily and monthly technicals are completely bullish and show no signs of neutrality. However, its 4-hour and weekly time-frames’ sentiment is bullish but shows some neutrality.

ETH/USD 1-day Technicals

Technical Factors (4-hour Chart):
  • The price is far above its 50-period and at its 21-period EMA
  • Price is at its middle Bollinger band
  • RSI is near being overbought (55.86)
  • Volume is average
Key levels to the upside          Key levels to the downside

1: $600                                     1: $510

2: $630                                     2: $500 

3: $735                                      3: $490

Ripple

The fourth-largest cryptocurrency by market cap had a pretty slow day, with its price hovering slightly above the $0.6 mark. Its price did feel the push towards the downside that the whole crypto sector experienced, but to a much lesser extent. XRP has found support at its 4-hour 50-period moving average, above which it is currently trading.

Trading XRP is almost certainly an inferior option to trading Bitcoin and Ethereum at the moment, as both the volume and volatility are low.

XRP/USD 4-hour Chart

XRP’s daily and monthly technicals are completely bullish and show no signs of neutrality. However, its 4-hour and weekly time-frames’ sentiment is bullish but shows some neutrality.

XRP/USD 1-day Technicals

Technical factors (4-hour Chart):
  • The price is slightly above its 50-period EMA and slightly below its 21-period EMA
  • Price is slightly below its middle Bollinger band
  • RSI is neutral (49.86)
  • Volume is below average
Key levels to the upside          Key levels to the downside

1: $0.666                                   1: $0.625

2: $0.78                                     2: $0.596

3: $0.79                                   3: $0.535