General Overview
Crypto Coin Market Cap: $270,492,089,135
24h Vol: $16,547,075,818
BTC Dominance: 42.3%
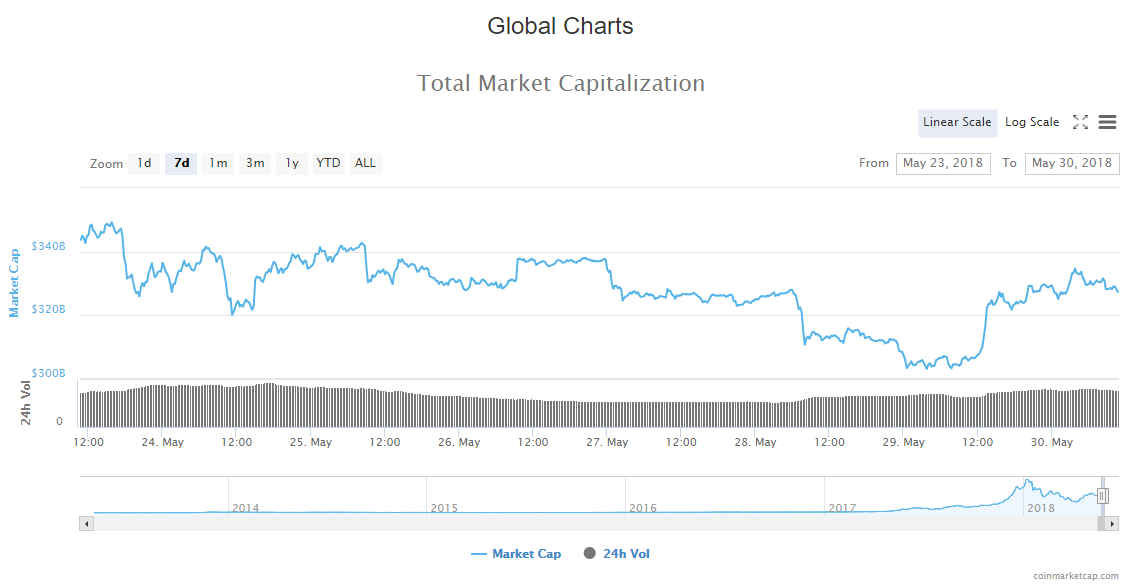
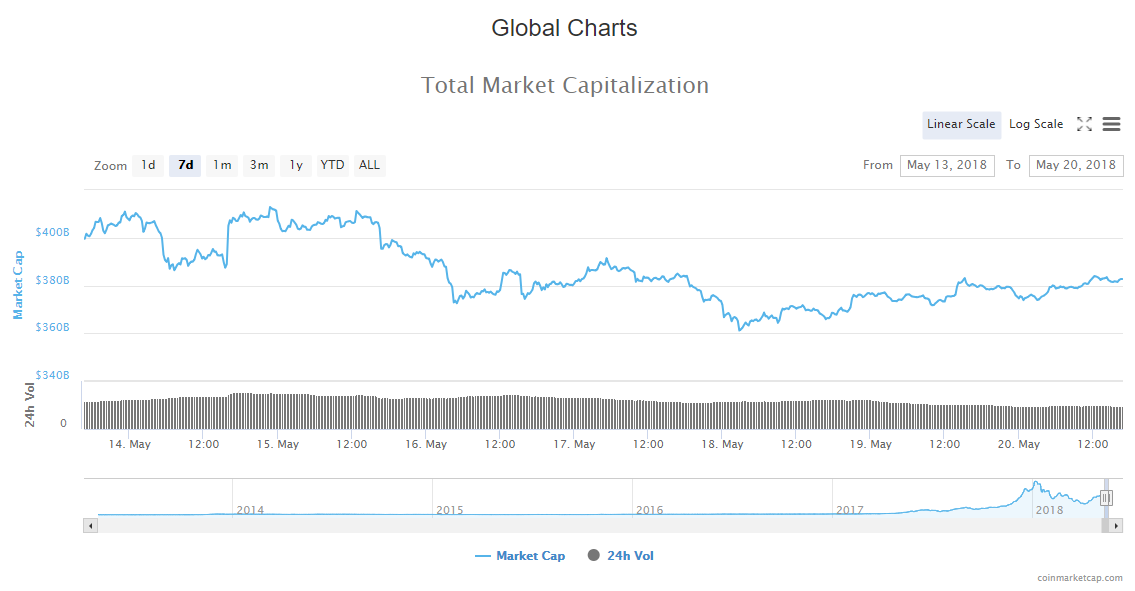
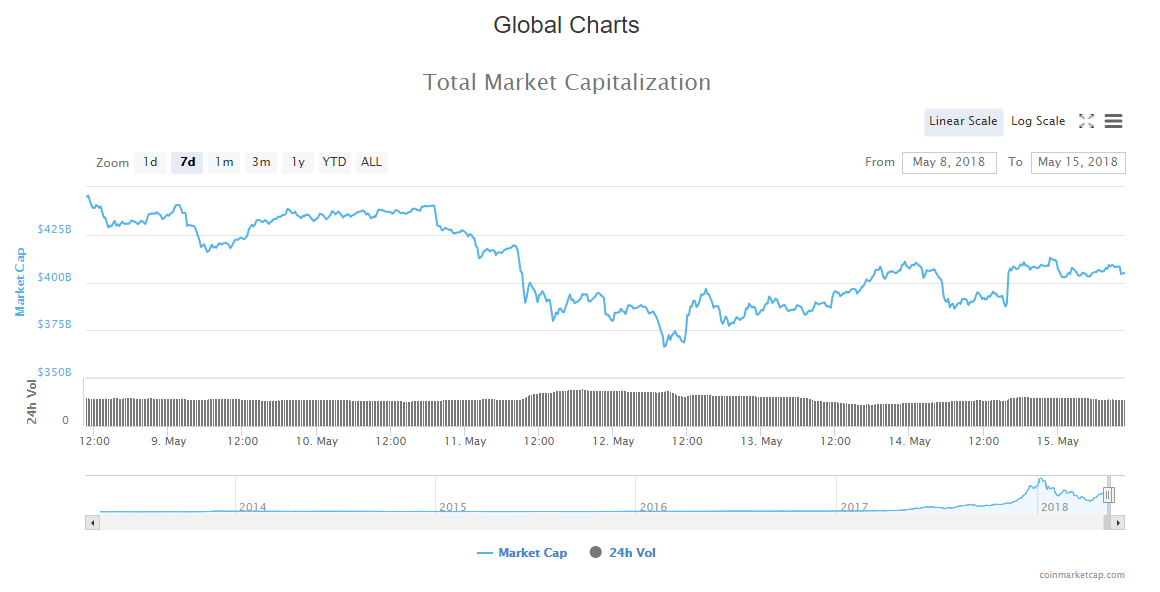
Last Monday on 25th of June, cryptocurrency market capitalisation was 258,924,000,000$ at it’s highest point. Since then, the market cap fell all the way to 232,613,000,000$ on Friday 29. On Saturday the evaluation rose from those levels back to the levels of Monday’s open, and now we are seeing a breakout as the evaluation exceeds Monday’s around $258B. Because the global chart is lagging behind a bit, I have drawn with a brush were the chart should be at the moment.

The market is in the green at the moment. Biggest gainers so far among top 100 coins are: Neo 16%, 0x 18.56%, Verge 18.3%, Wanchain 15%. The average percentage increase is around 6% but there are a lot of coins that have gained 10% or more in the lasts 24 hours, which is a sign of recovery.
News
There are a number of significant news items that came out in the last 7 days. Out of those that could impact the market I point out the following:
Facebook will no longer ban crypto ads, but ICOs are still on the blacklist and only verified accounts can post them, according to their announcement. This headline is good, as Facebook ads will help expose the market, however, if they are in control of the type of projects they are going to allow or particular cryptocurrencies, Facebook will have control of the content displayed to the users, and they could, in fact, help manipulate that market, or create a general impression that is aligned with their agenda around a particular coin or project. For example, I don’t believe that they are going to allow promoting Steemit which is a blockchain based social media rival that pays out their users with their native coin. But we are yet to see what happens, as the pressure is applied on to major players but the technological advancements of the blockchain.
Other significant headlines that could impact the market as they bring more exposure and open up the space for new participants are that Binance launches a crypto-fiat exchange in Uganda– Binance Uganda, as reported by cointelegraph. This will bring more cryptocurrency exposure to the retail investors.
On the other hand Blockchain.com – the best-known crypto wallet and blockchain explorer data service has introduced their institutional platform, Blockchain Principle Strategies (BPS). BPS will offer over-the-counter services managed by experts from Goldman Sachs, JP Morgan, and UBS as part of the platform.
Analysis
BTC/USD
From last Monday, the price of Bitcoin has increased by 5.13% coming from 6282$ to the low at 5800$ at its lowest point back to 6443$ and now above the level of last Monday’s open at 6618$.
Looking at the hourly chart, we can see that the price has found support on the unconfirmed triangle support, and broken the downtrends resistance line as it’s heading in an upward trajectory. The first target I am looking at is an unconfirmed baseline support 2 (purple dotted line) at 7054$. I am expecting the first significant resistance from there to 7320$ area, and if the price gets passed through that resistance I am expecting the price to go to around 8000$.
Market sentiment
Daily chart technicals signal a sell.
Oscillators are on neutral and moving averages signal a sell.
Pivot points
S3 4649.7
S2 5440.2
S1 5915.8
P 6230.7
R1 6706.3
R2 7021.2
R3 7811.7
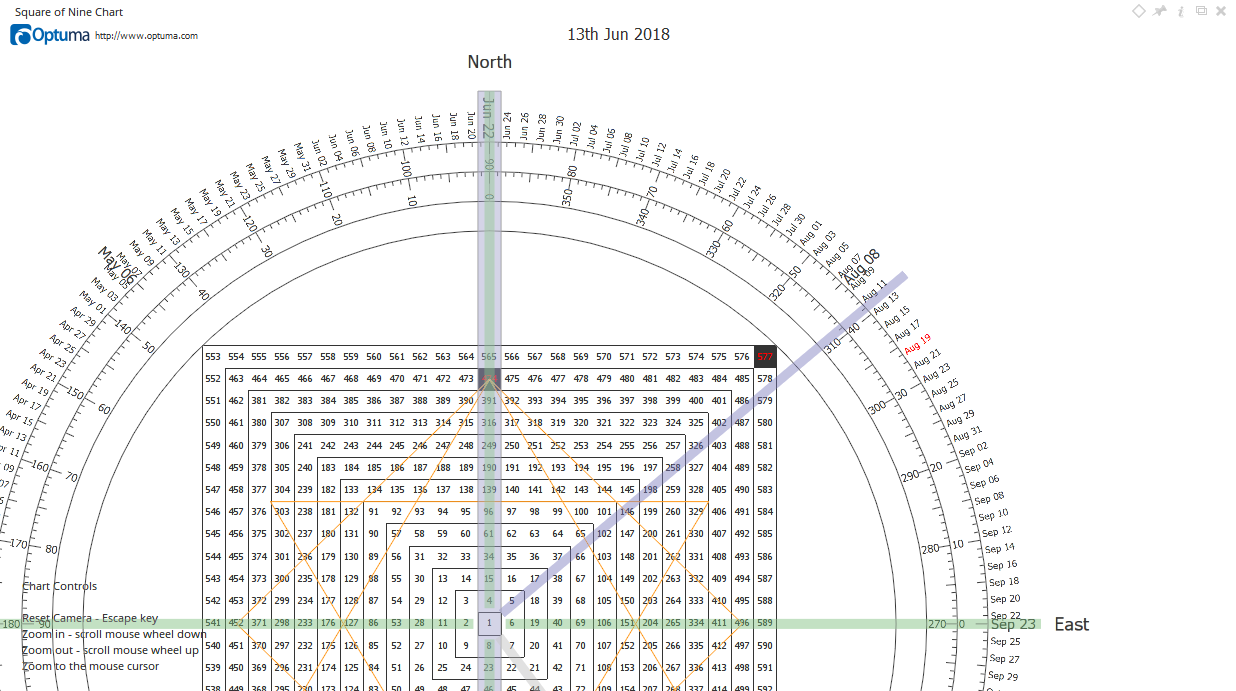
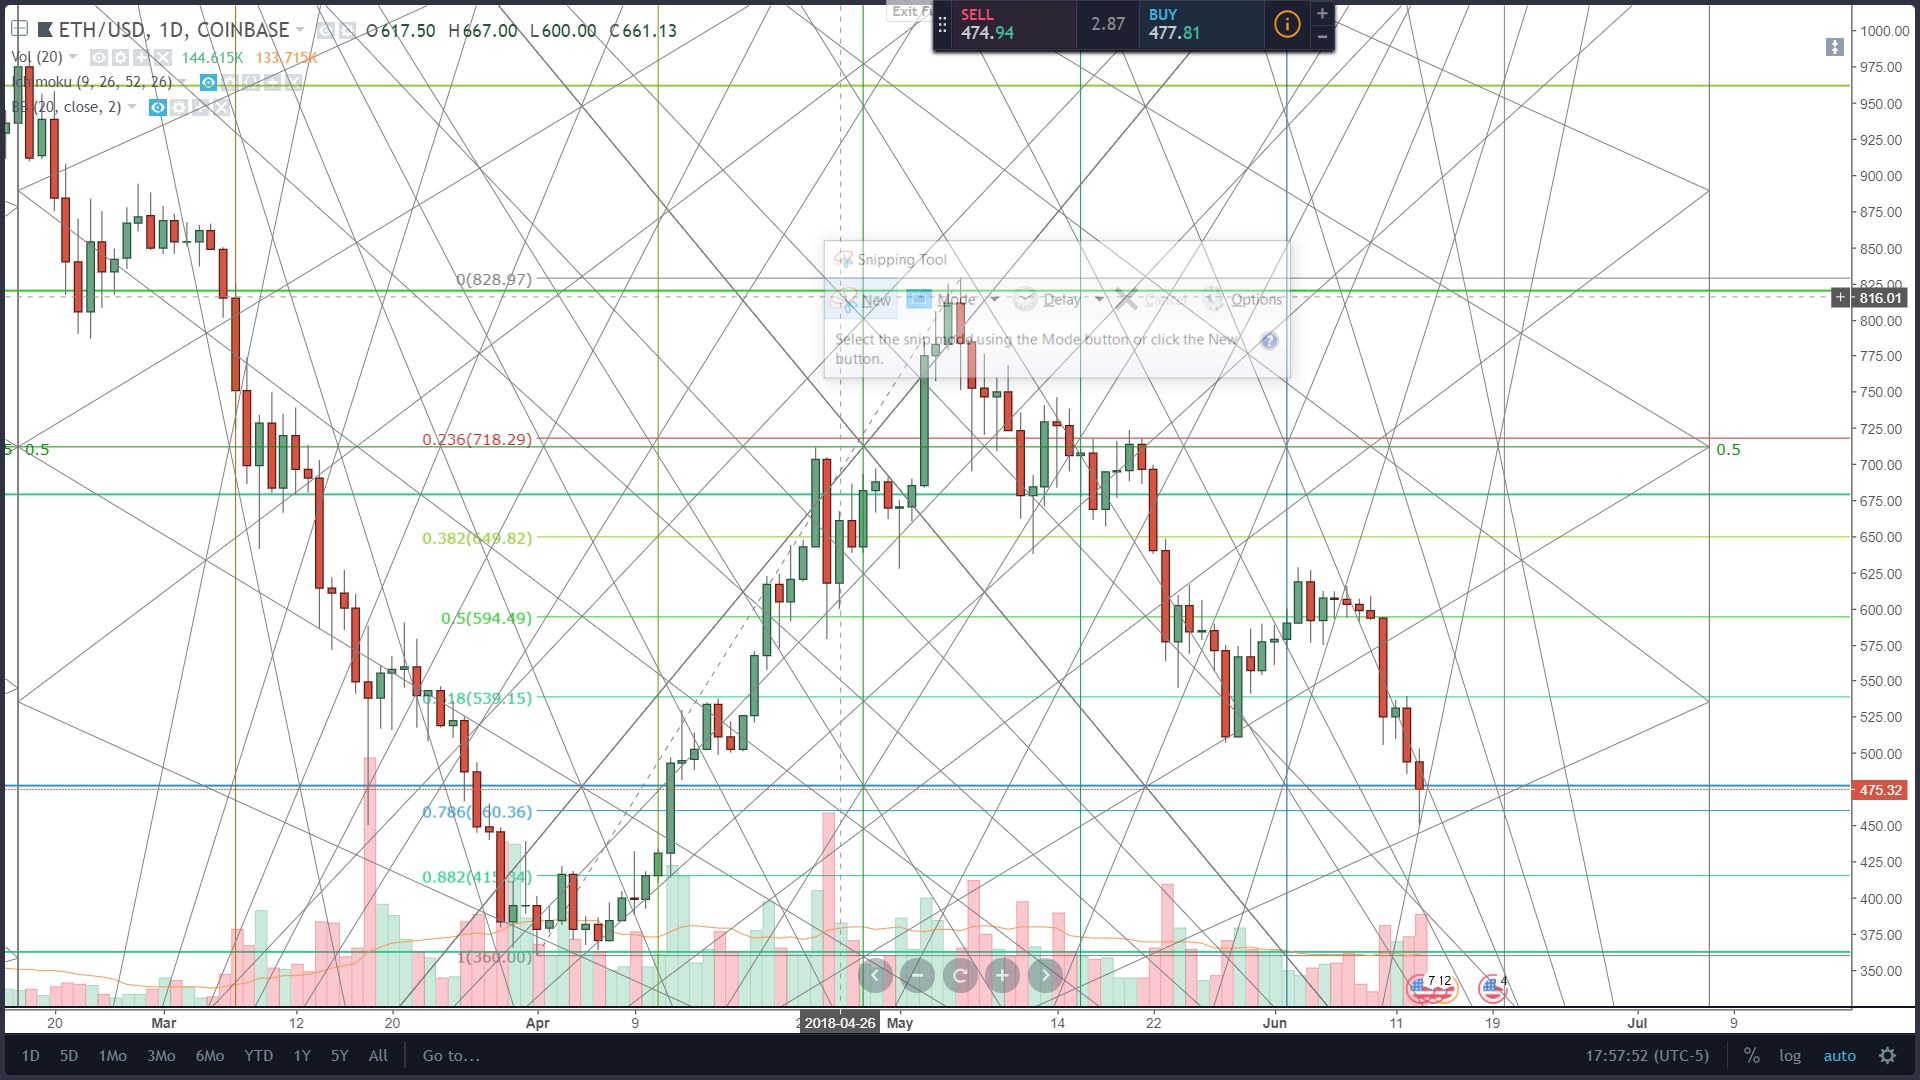
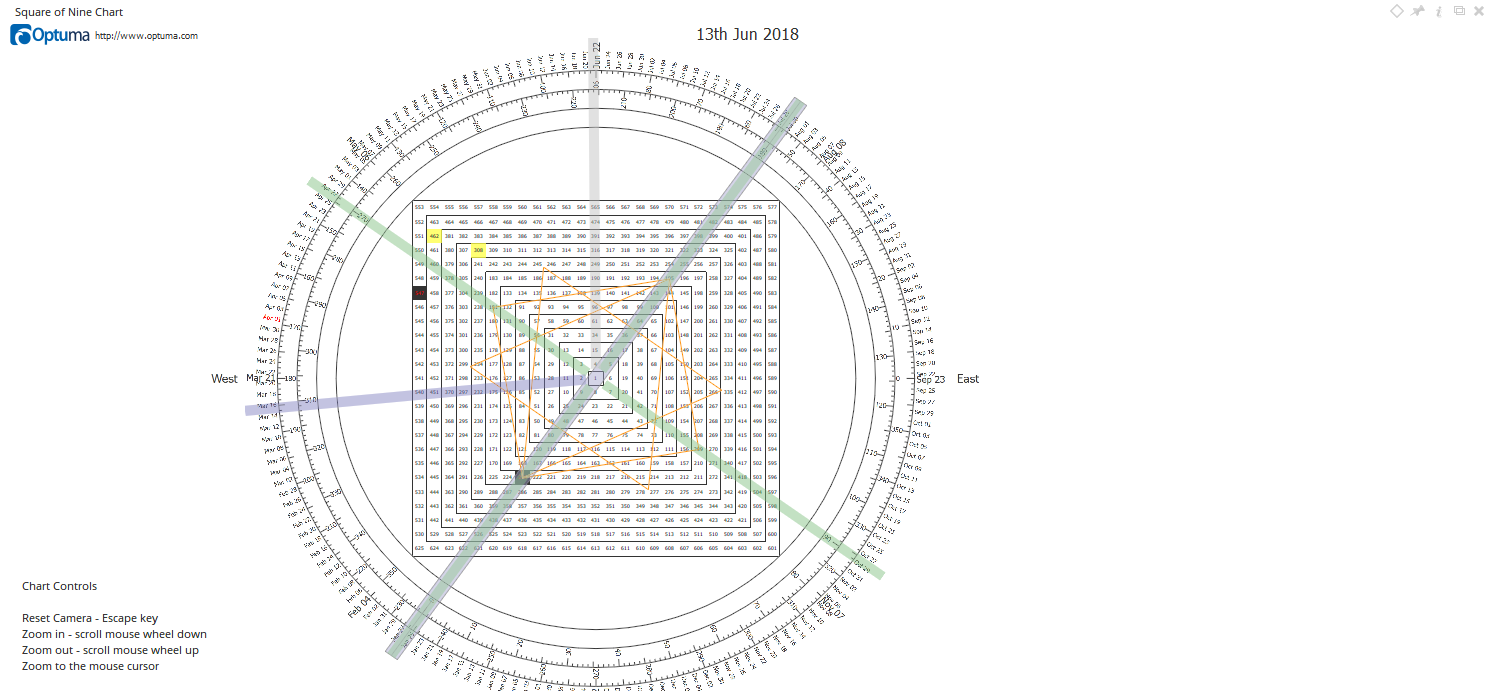
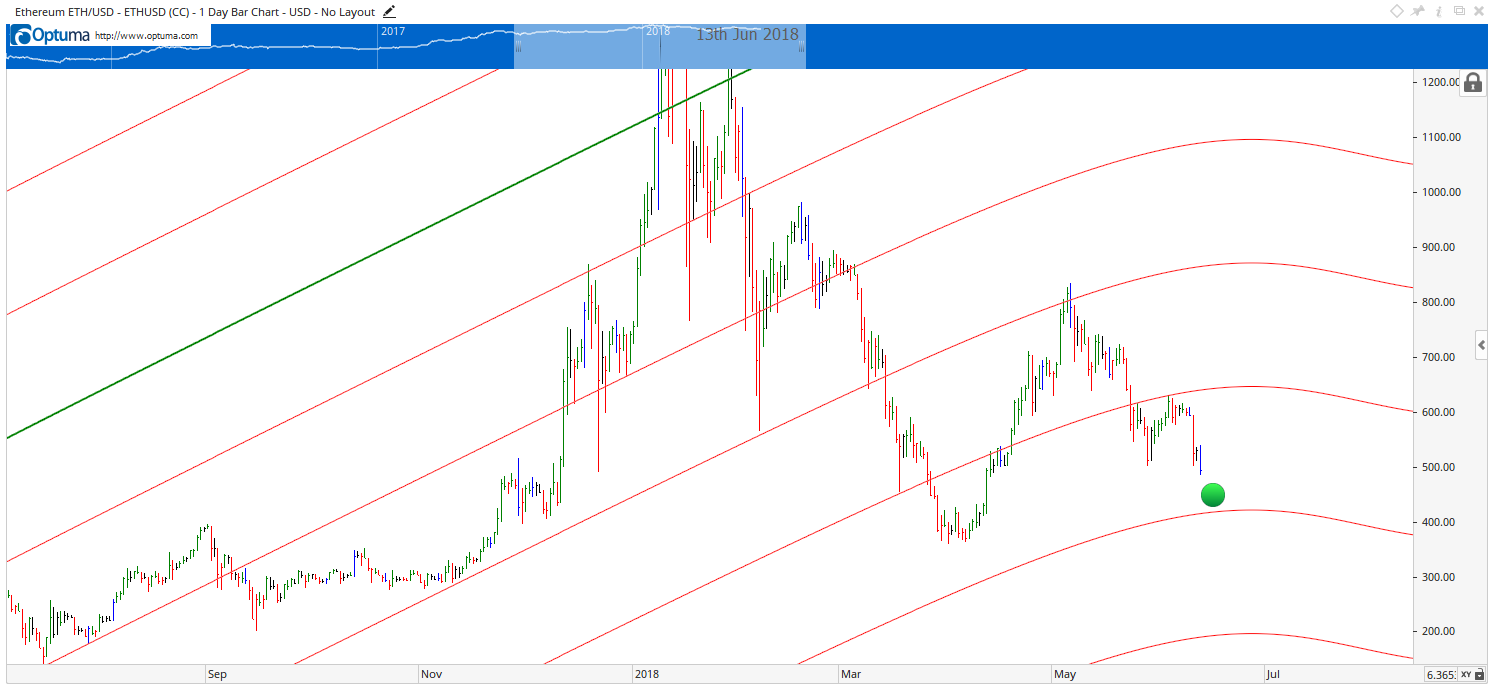
ETH/USD
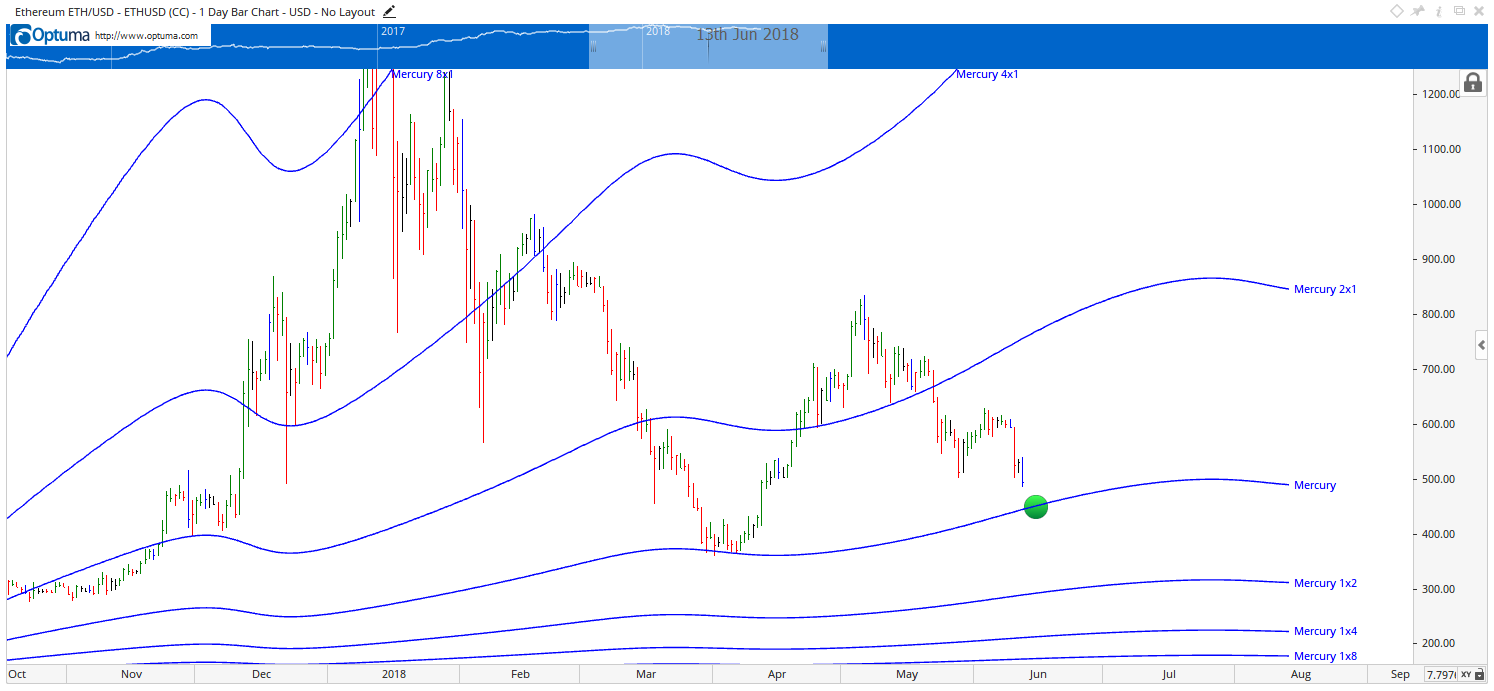
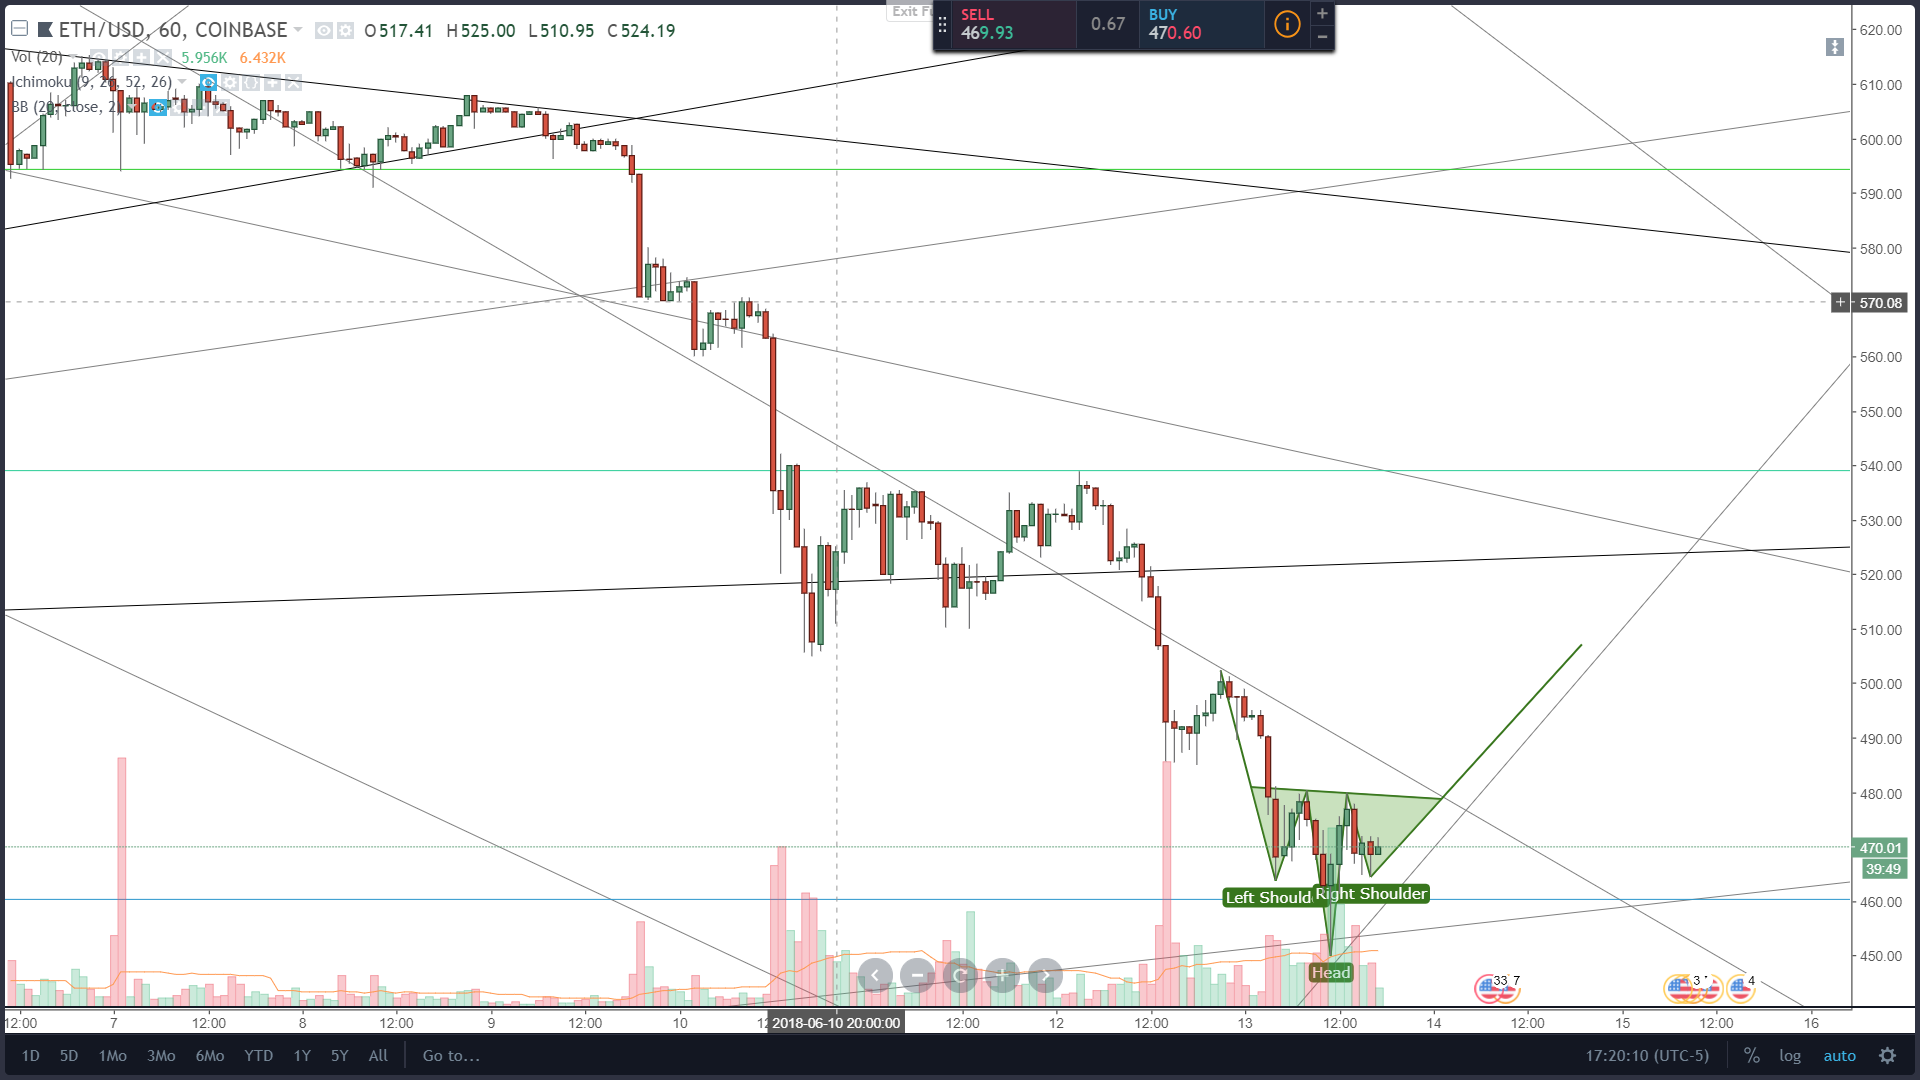
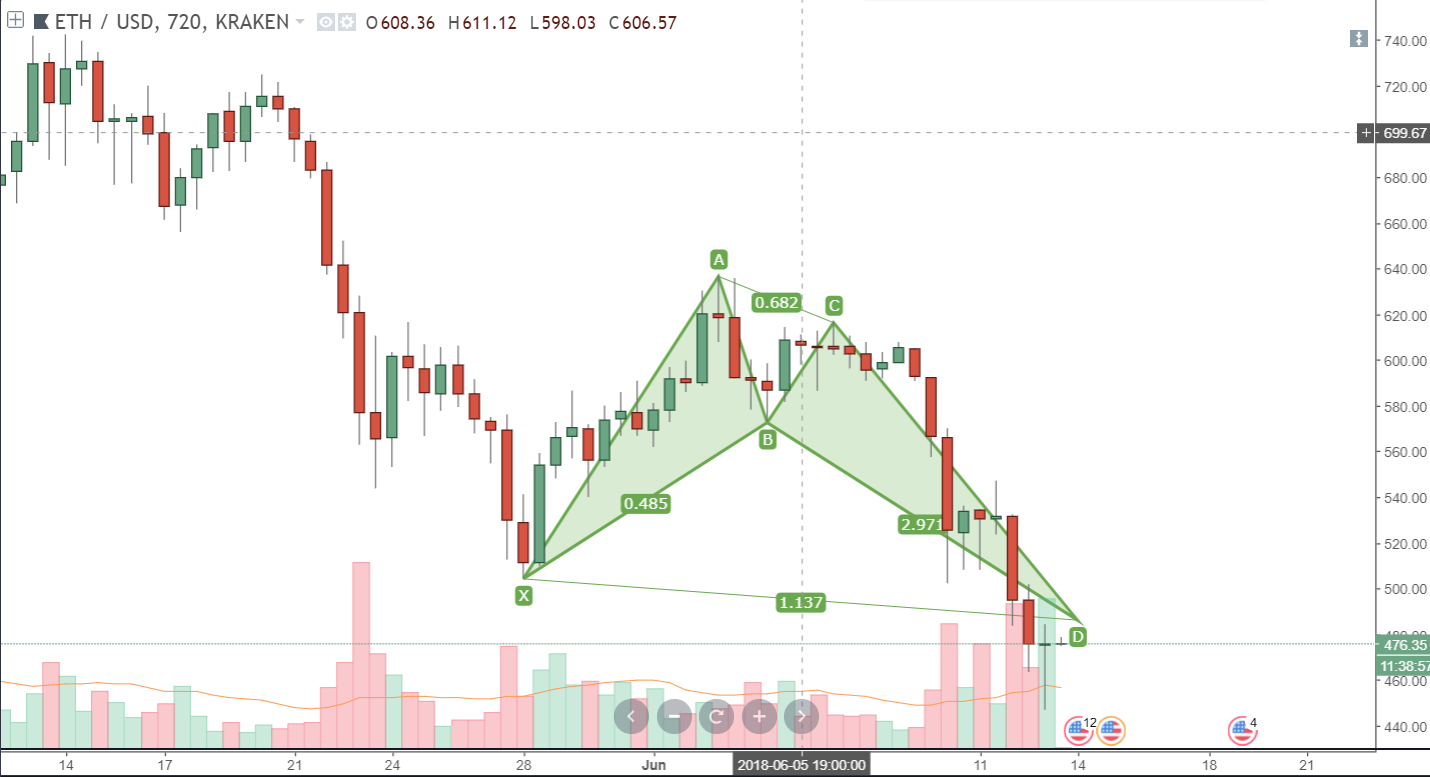
From last Monday’s opening at 451$, the price of Ethereum has increased by 5.34% as its currently sitting around 475$.
On the daily chart, we can see that the correction has ended and it was a WXY correction just like I pointed out it would most likely be in the charting section last week. I have pointed out that this correction might make another low and be complete as a WXYXZ sideways correction but that from those levels around 400$ the price is going up soon. Currently, the price has broken the downtrends resistance line and is heading upward steeply after consolidating in a descending channel.
Market sentiment
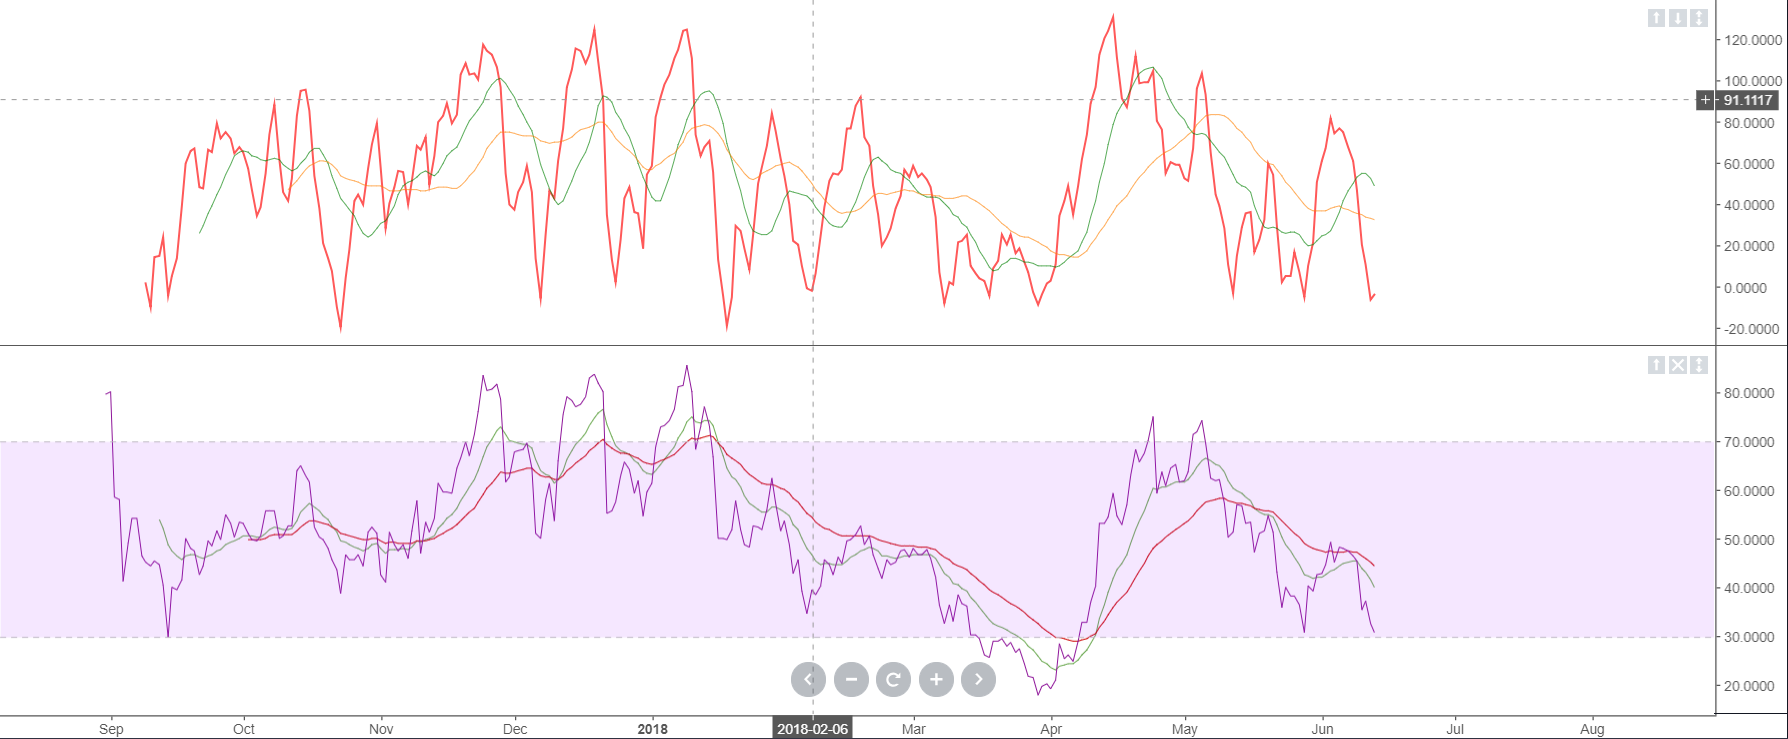
Ethereum is in the sell zone, as indicated by daily chart technicals.
Oscillators are on neutral, and moving averages signal a strong sell.
Pivot points
S3 303.76
S2 374.27
S1 414.06
P 444.78
R1 484.57
R2 515.29
R3 585.80
LTC/USD
In the last 7 days, the price of Litecoin has risen by 5.42% from the opening on last Monday at 81.5$ to 85.8$ where it is currently sitting.
The price of Litecoin has found support at around the 72$ level, which is the level from where the price went on to create the all-time high. Today the price has broken the downtrends resistance line and is in an upward trajectory. Like in the case of Bitcoin, I am expecting this upward movement to be the final wave Z from the WXYXZ correction from which the price is heading lower afterwards. Some of the significant level to look out for in the following week is from 111$ to 124$ which was considers as a support area, and probably now serves as strong resistance, so I will be closely monitoring what happens at those levels because I am expecting the price to go higher than 124$.
Market sentiment
Litecoin is in the sell zone as indicated by daily chart technicals.
Oscillators are on neutral and moving averages signal a strong sell.
Pivot points
S3 55.377
S2 67.393
S1 74.299
P 79.409
R1 86.315
R2 91.425
R3 103.441
NEO/USD
The price of Neo has increased by 15.38% coming from 31.6$ last Monday to 36.42$ where it is currently.
Looking at the Neo daily chart we can spot the similarities between the current candle formation and the last time the price of Neo has recovered from its lowest. As I have measured with the Fibonacci retracement tool, last time the price recovered to the 0.5 Fibonacci level, and I have projected the same recovery this time which fits perfectly with the potential interaction with the uptrend baseline support that was broken. In price terms, I am expecting the price of Neo to rise to around 56.89$.
Market sentiment
Neo is in the sell zone as the daily chart technicals indicate.
Pivot points
S3 16.25
S2 23.49
S1 27.20
P 30.73
R1 34.44
R2 37.97
R3 45.21
DASH/USD
From last Monday’s open at 238.9$, the price of Dash has increased by 5.46% as its currently sitting at 250.8$.
Looking at the daily chart we can see that like in the case of other cryptos that are covered in this report, the price has broken the downtrends resistance line and is heading upward. I have labelled this correction as WXYXZ and as you can see it has ended. I have projected that the price is mostly going to recover to the 384$ as that is the half of the range from the last retracement, much like it did two prior times.
Market sentiment
Dash is in the sell zone, as indicated by daily chart technicals.
Pivot points
S3 155.17
S2 195.52
S1 217.44
P 235.88
R1 257.79
R2 276.23
R3 316.58
ADA/USD
From last Monday’s open at 0.135$, the price of Cardano has increased by 11.42% as its sitting around 0.151$.
As you can see from the daily chart, the 5 wave move down has ended, and the price is now starting to recover in an upward movement after it broke the downtrends resistance. I am expecting the price to go up to 0.23$ where the first major resistance line is and corresponds with the half of the range.
Market sentiment
Cardano is in the sell zone.
Pivot points
S3 0.076333
S2 0.103199
S1 0.120628
P 0.130065
R1 0.147494
R2 0.156931
R3 0.183797
Conclusion
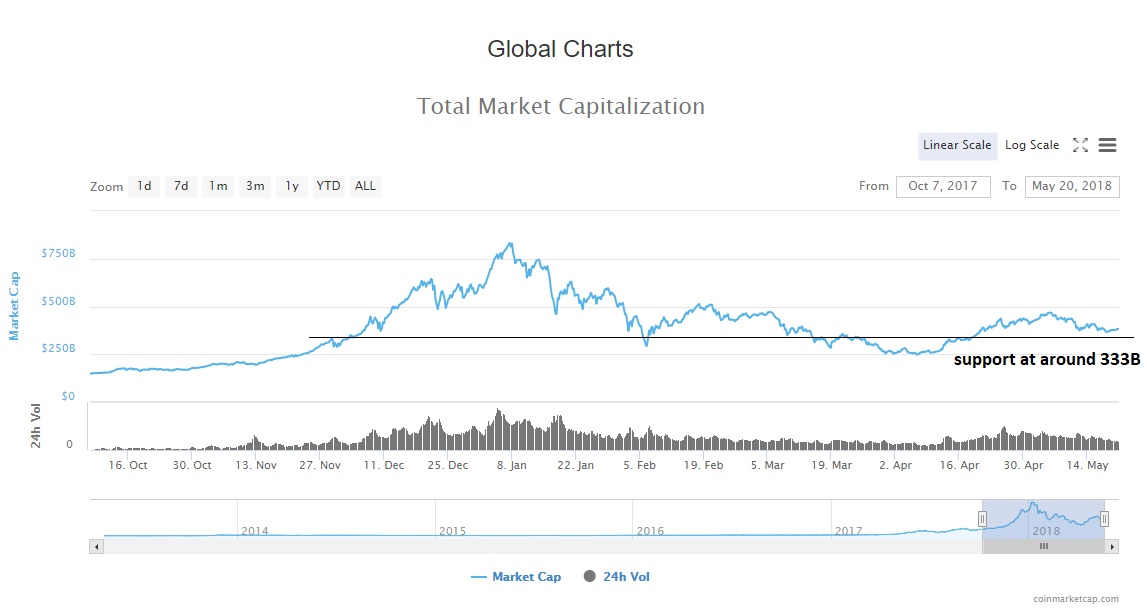
Crypto Coin Market Cap: After the prices have tested the old lows and dipped beyond them a bit we are seeing a trend reversal taking place. As the chart of the cryptocurrencies analysed in this report point out, this is going to be a short-term recovery, before another drop.
This was my projection from 02.06.2018 in which I have drawn the recent low the recovery I am expecting before another potentially final drop to around 178B level.

This recovery might serve as a great shorting opportunity, but as there is so much manipulation going on, things can get pretty uncertain, so be careful.