Introduction
Scalping is a trading strategy that helps traders to take advantage of minor price movements on lower timeframes. It is one of the quite popular ways of trading the Forex market. There are many successful scalpers who make a lot of money by scalping the minor price moves. To be a scalper, we must be emotionally intelligent and have the ability to make quick decisions.
Scalpers place anywhere from 0 to a few hundred trades in a single day. Ideally, smaller movements in price are easier to catch compared to the longer moves. Typically while day trading, if the win/loss ratio is less than 50 percent, traders still make money. On the other hand, in scalping, it is critical to win most of the trades. Otherwise, we will end up on the losing side.
Stochastic Oscillator
Stochastic is a wonderful indicator developed by George C. Lane in late 1950. This indicator doesn’t follow the price or volume like other popular indicators in the market. Instead, it follows the speed and momentum of the changes that occur in price before the trend formation. Stochastic is a range bounded indicator, and it oscillates between the 0 and 100 levels.
Typically, a reading above 80-level is referred to as the overbought signal, and a reading below the 20-level indicates an oversold signal. The Stochastic indicator consists of two lines, where one reflects the actual value of the indicator for each session, and another reflects its three-day simple moving average. The intersection of these lines indicates the reversal in price action.
Bollinger Bands
Bollinger Bands is a technical indicator developed by John Bollinger in the 1980s. It is a leading indicator, and it consists of two bands and a centerline. Out of the two bands, one stays above the price action, and the other stays below. Both of these bands contract and expand depending on the market’s volatility. When price action hits the lower band, it indicates a buy trade, and when it hits the upper band, it indicates a sell trade.
The Strategy
The strategy we are going to discuss is one of the most basic but effective scalping strategies ever used in the market. The idea is to apply both indicators (Bollinger Band & Stochastic) on the price chart. When the price action hits the lower Bollinger band, and the Stochastic is at the oversold area, it is an indication for us to go long. Conversely, when the price action hits the upper Bollinger band and if the Stochastic is at the overbought area, we can go short.
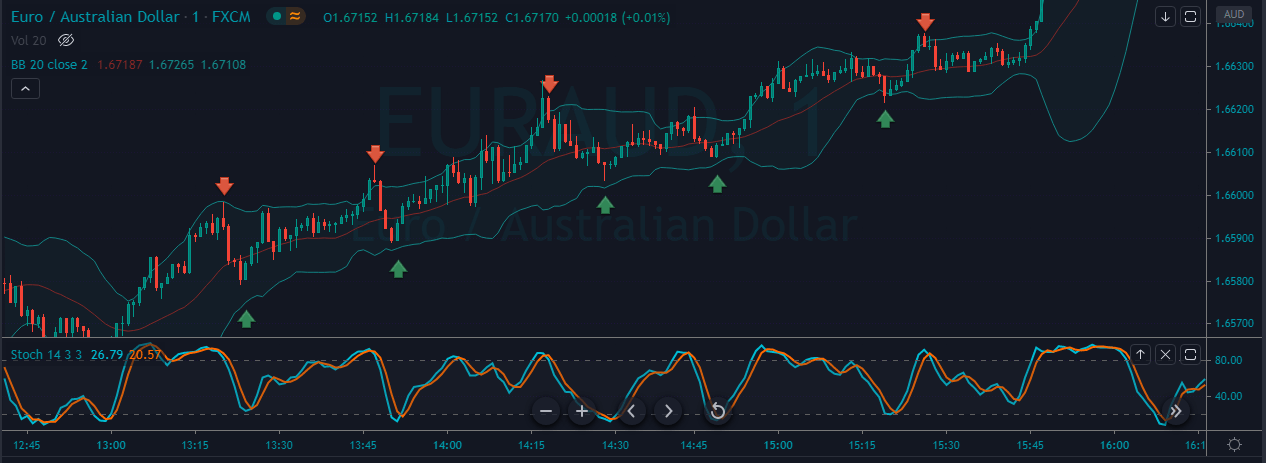
In the chart below, we can see that our strategy has generated a few buy/sell signals in the EUR/AUD Forex pair. The price action was in an overall uptrend. When both of the indicators gave us the signal, we took both buy and sell entries accordingly. In the chart below, the buy trades have given us some good profits, but in the sell trades, the profit was comparatively less. Always remember that these things are quite common in scalping. If you are an aggressive scalper, trade both buy sell signals. But if you are a trader who prefers to scalp the market with the trend, follow the next strategy.
Scalping The Market By Following The Trend
Buy Example
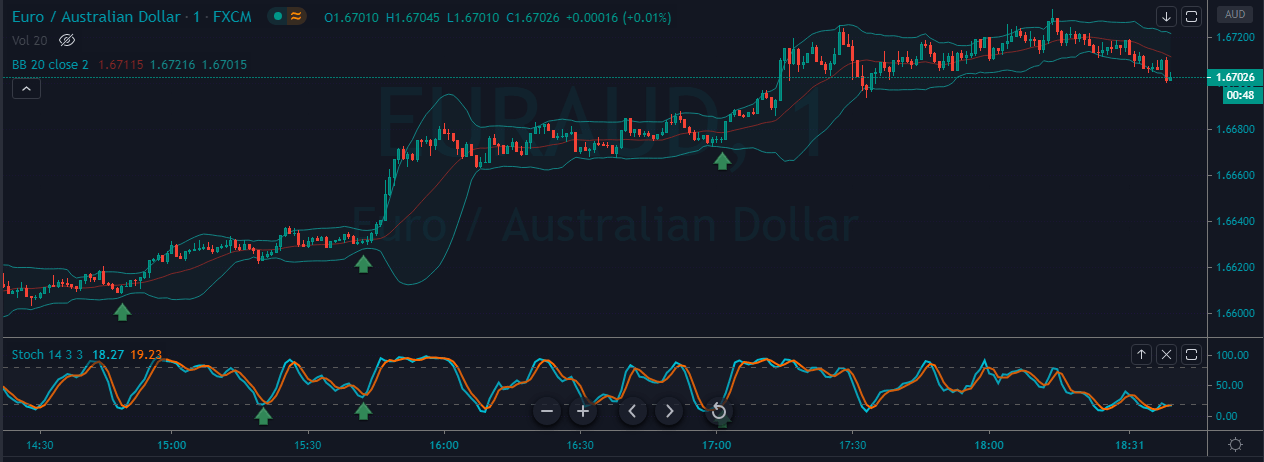
The chart below represents an uptrend in the EUR/AUD Forex pair. As you can see, by following our strategy, this pair has given us three buy signals, and all the trades were quite healthy and have performed well in the market. If you scalp the market by following the trend, it is easy to make big gains. For scalping, it is required to put smaller stops. Hence, always go for 4 to 5 pip stop-loss and 10 to 15 pip target. You can also exit your positions when the price hits the upper Bollinger band.
Sell Example
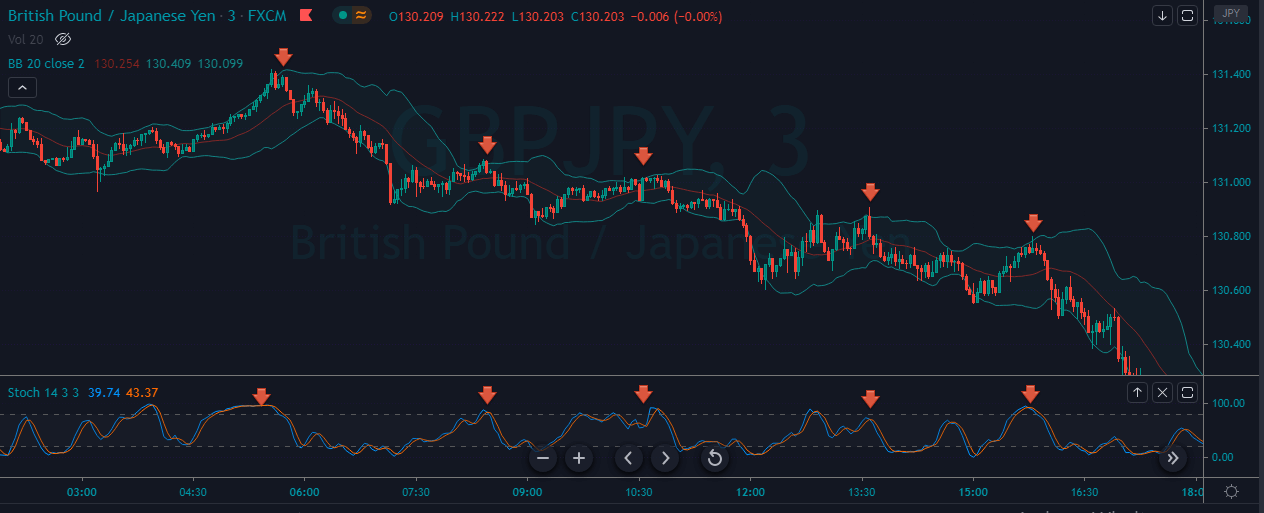
The below 3-minute chart of the GBP/JPY forex pair represents a couple of sell trades. As you can see, all the sell trades in this pair performed very well. We can also observe that every time the price action prints a brand new lower low. We took all the five selling trades on a single trading day, an all of them hit the take-profit range. So if we scalp the market by following the trend, it will be quite easy to make some profits from the market. The red arrows on the Stochastic and Bollinger Band indicators represent the sell signals.
Scalping The Ranges
Just like the trends, it is easy to scalp the ranges as well. In fact, the ranges are even easier to scalp than the trend because the support and resistance lines of the range offer extra signals for us. For ranges, all you need to do is to hit the sell when price action hits the top of the range and hit buy when prices hit the range bottom. If you add the Bollinger Bands and Stochastic indicator, the signals generated by the market will be stronger.
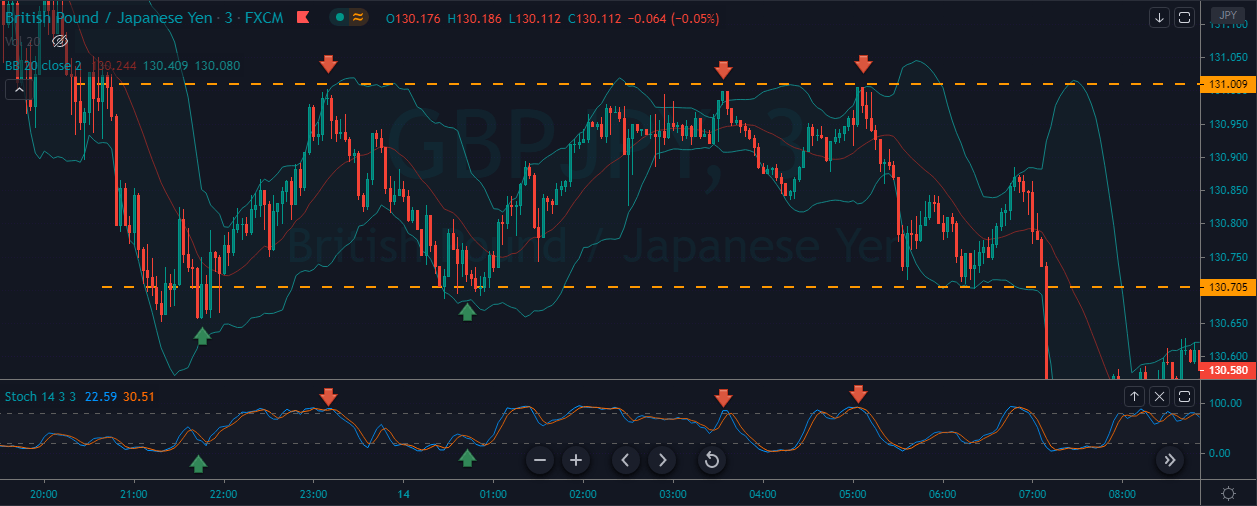
The chart below indicates a couple of buy/sell signals in the GBP/JPY 3-minute Forex chart. As you can see, we have gone long when prices hit the bottom of the range, combined with our strategy. The same applies to the sell-side. We have gone short when the price action hits the top of the range while respecting our strategy rules.
Conclusion
Scalping trading involves entering a trade for a shorter period of time to take advantage of small price fluctuations. When you enter a trade, it is advisable to risk lesser money and place as many trades as you can. We must have control over our inner greed and aim for smaller targets. In the beginning, it will be difficult for you to scalp the market as the smaller timeframes move way faster. You need to train your eyes a bit to understand the lower timeframes properly. Always try to scalp with a bigger trading account because the trading commissions can quickly eat up the smaller accounts.

2 replies on “Pro Scalping Technique By Combining Stochastic With Bollinger Bands”
It was a very informative article about scalping, I however, picked up in the sub-heading STRATEGY.
The last paragraph of this heading, we go long when the price hits the lower Band of the Bollinger Bands not Short as it is written here.
Please correct me if I am missing something.
Thanks and kind regards,
You are partially right.
The correct text should say
“When the price action hits the lower Bollinger band, and the Stochastic is at the oversold area, it is an indication for us to go long. Conversely, when the price action hits the upper Bollinger band and if the Stochastic is at the overbought area, we can go short”
Thanks for your notice. We have already corrected it in the article.