This is the second article in a series of articles highlighting the importance and effectiveness of Japanese candlesticks in your trade plan.
Chart 1 – Original Trade Idea
If you haven’t read my first article in this series, you can read it here. That first article describes my approach to trading and how I identify trade setups. The trade I took back in December 2018 to go long on GBPNZD was one of the best performing trades I’ve had in the past two years. It remains a great trade! I wrote the following as justification for my trade idea.
Dec 12, 2018
Holy 2,000+ pip trade batman
The GBPNZD pair has a massive upswing potential, with little risk. And I’m just talking about a move to the center of the linear regression channel.
- The weekly chart shows two hammer candles – with the current week showing strong buying from the lows. Massive buying actually – firm rejection lower so far.
- The Chikou Span/Lagging Span is right near the bottom of the cloud – the probabilities of the Chikou Span just crossing below the bottom of the cloud on a weekly chart is very little, especially given that we’ve had ten weeks down without any meaningful retracement.
- YUGE bullish divergence that goes from July of 2017 to the present weekly low. It’s ridiculous.
This could be one of the biggest trades I’ve ever made – and the realistic target is 2,000 pips above, and the risk is only 275 – I’ll take those odds. And it’s very probable we trade higher than the center of the regression channel.
Using Candlesticks
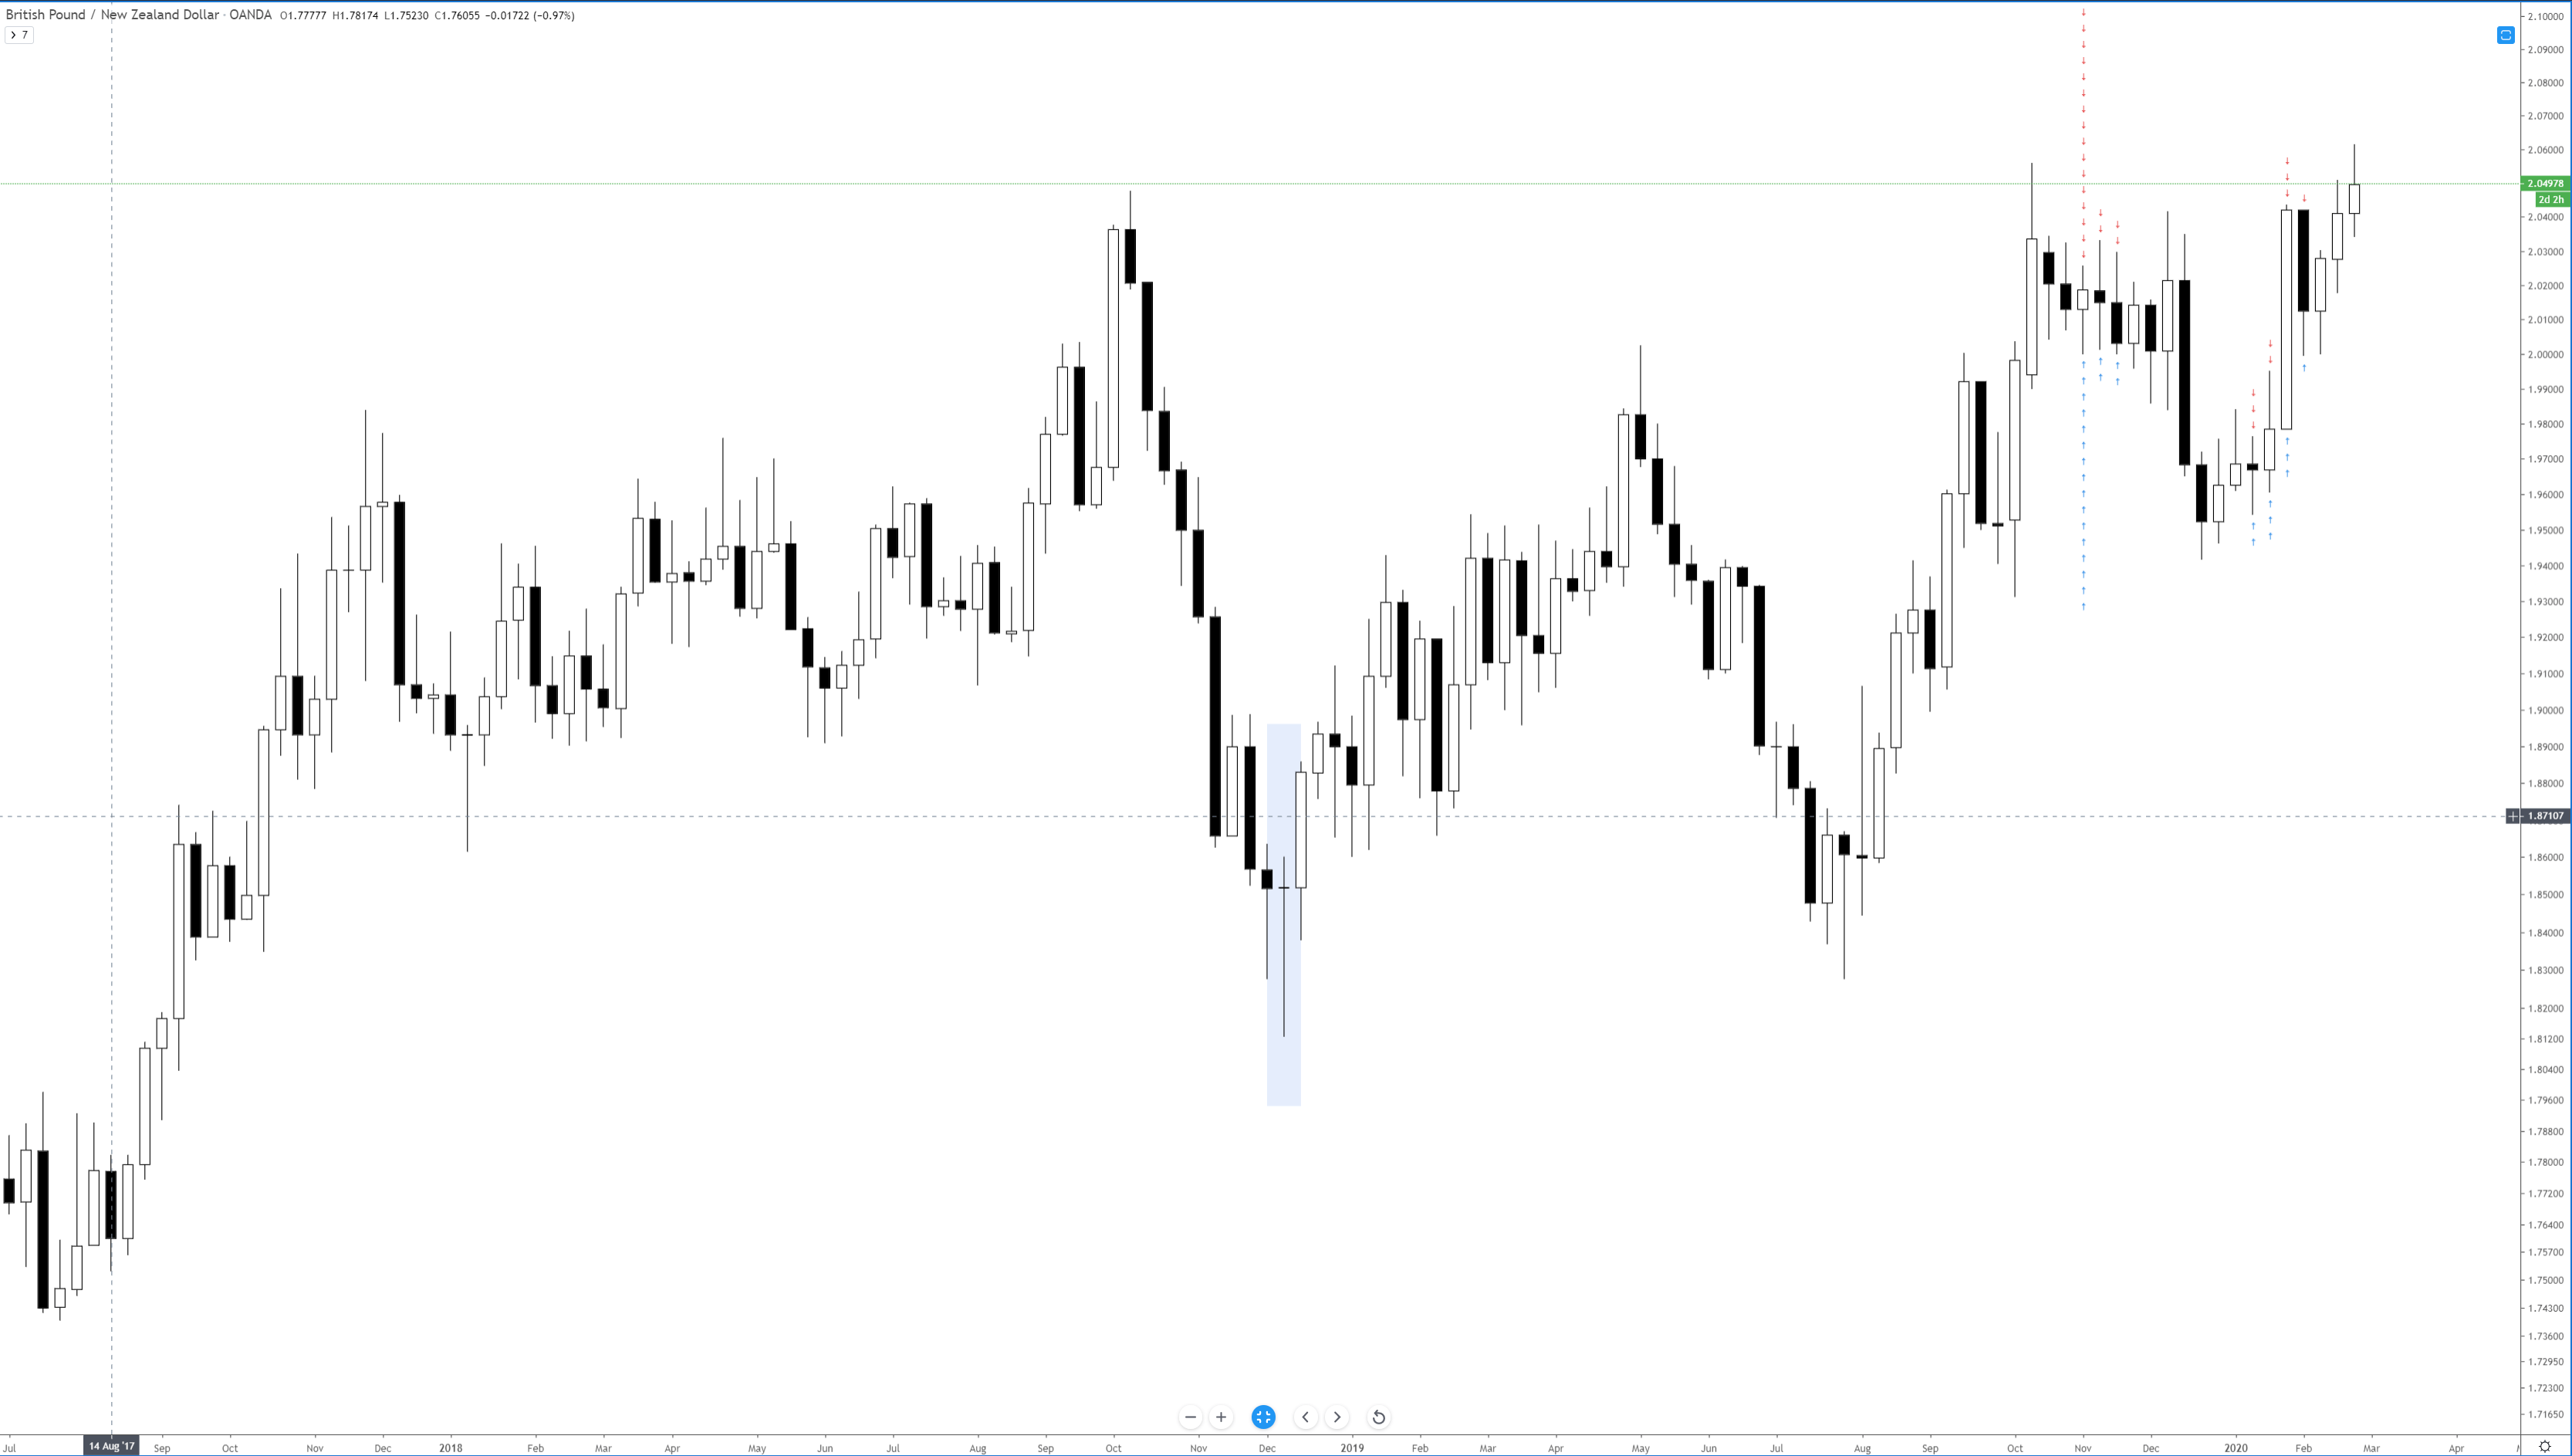
If you are interested in learning about Japanese candlesticks, you should really pick up the Bloomberg Visual Guide to Candlestick Charting by Michael C. Thomsett. There are over 200 different candlestick patterns in his book. And that is not even all of them! There are some patterns that exist that are very rare and very powerful. One of those rare and powerful patterns is on the GBPNZD weekly chart below:

The candlestick highlighted above is known as a dragonfly doji. As I wrote in my original trade idea, my entire purpose for going long was based on the existence of two consecutive hammers. When I saw these candlesticks occur on the weekly chart, I knew I was onto a big trade opportunity. Why? Because candlesticks are incredibly useful on weekly charts. Candlesticks were never meant to be used on anything less than a weekly chart – that might explain why they are more powerful on weekly charts. Just look at that dragonfly doji. It’s important to remember something about Japanese candlesticks: they tell a story. What does the dragonfly doji tell us? Panic and fear. Panic and fear for anyone short on the GBPNZD.
Look how long the wick is! That means a ton of sellers were able to push prices lower but gave up all of those gains – bulls took over. Anyone who was short during that weekly candlestick either covered immediately or experienced significant pain and had to cover eventually. Ultimately, the trade idea and initial profit target ran from the entry at 1.8457 to the bottom of the regression channel, where it wicked against at 1.9494 – a 1,037 pip move.
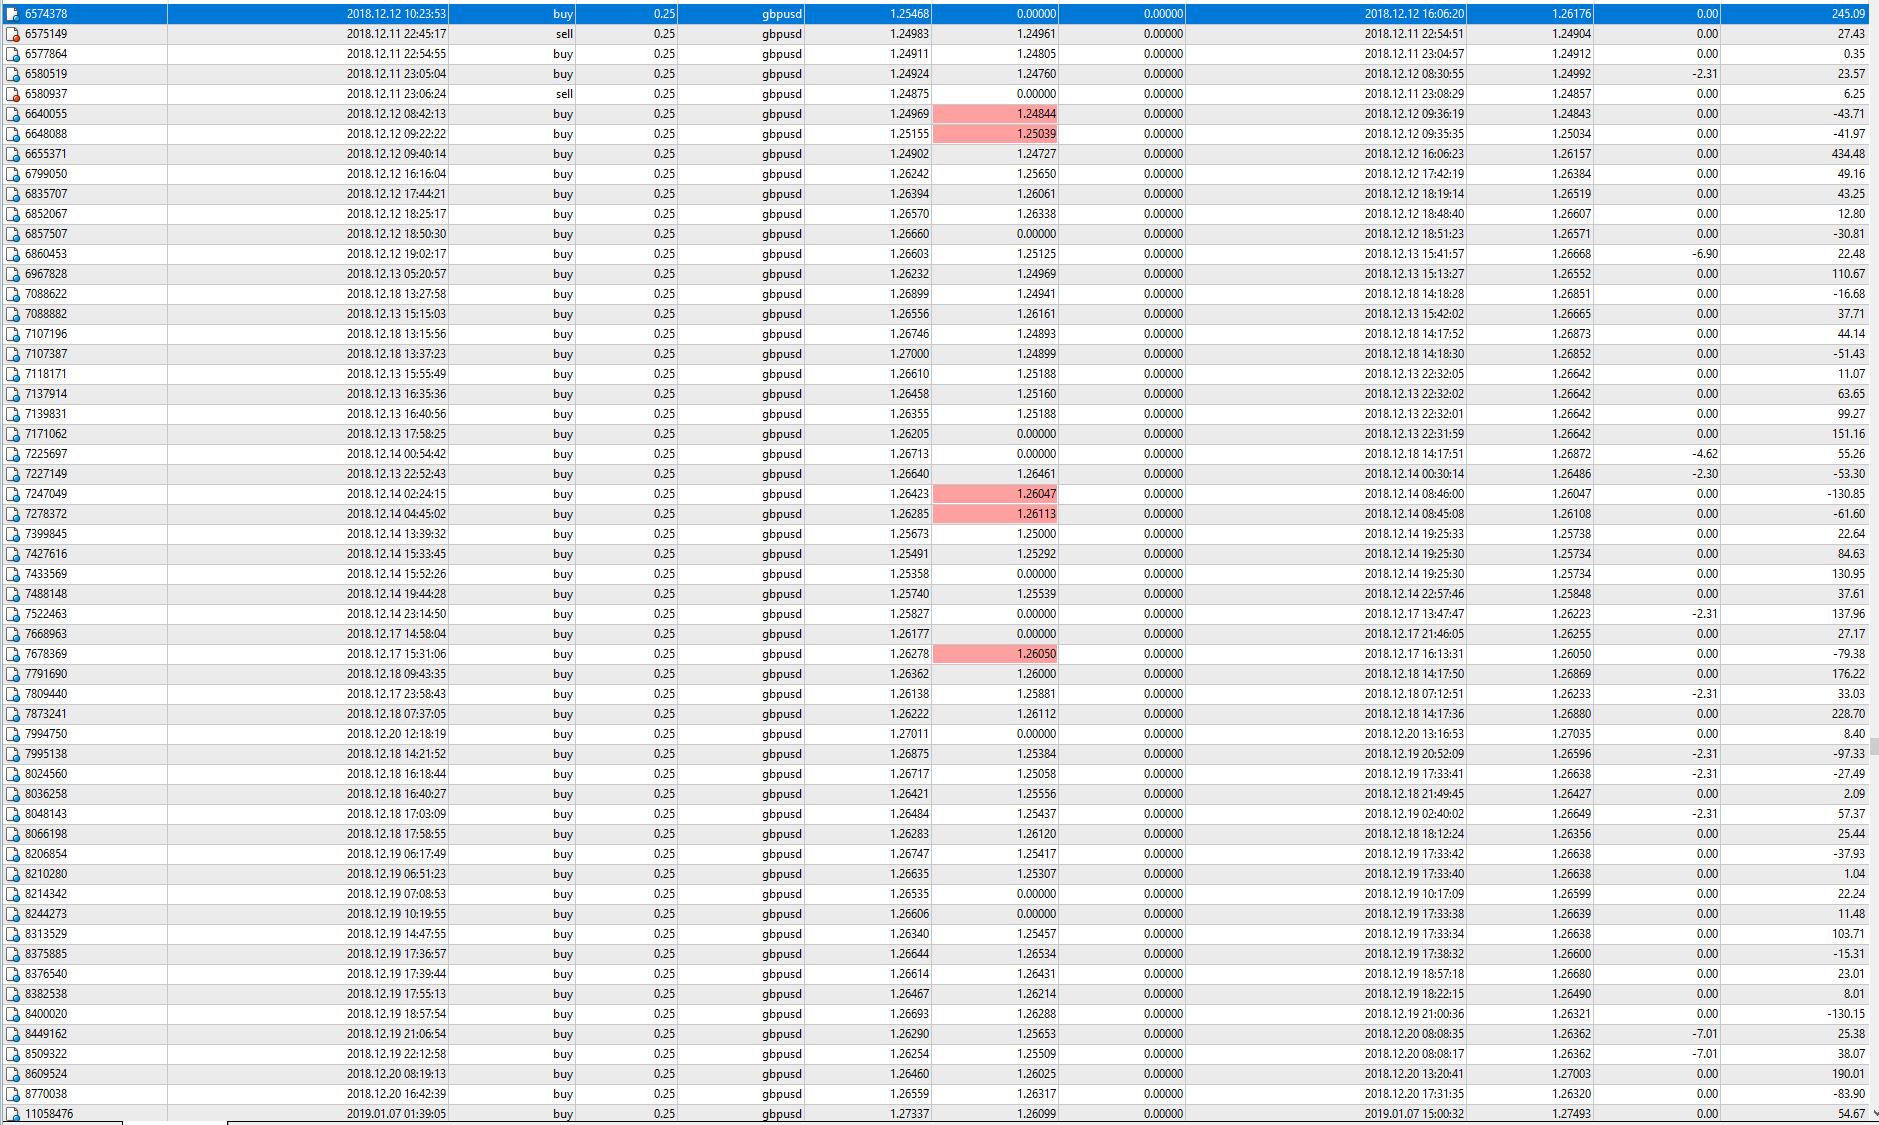
My actual trade results from that period:


