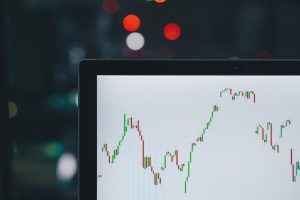
Forex trading is a popular activity among investors, traders, and speculators worldwide. It involves the buying and selling of one currency against another in the hope of making a profit from the price difference. To succeed in forex trading, it is important to have a good understanding of the markets, the various trading strategies, and the tools used in analyzing and tracking market trends. One of the essential tools for forex traders is the ability to show trades at the bottom of forex charts. In this article, we will explain how to show trade at the bottom of forex charts.
First, it is important to understand what a forex chart is. A forex chart is a graphical representation of the price movements of a currency pair over a specific period. Forex charts are used by traders to analyze market trends, identify potential trading opportunities, and make informed trading decisions. There are several types of forex charts, including line charts, bar charts, and candlestick charts.
To show trades at the bottom of a forex chart, traders need to use a trading platform that supports this feature. Most trading platforms offer this functionality, which allows traders to see their trades at the bottom of the chart, along with other relevant information such as the entry price, exit price, stop loss, and take profit levels.
To enable this feature, traders need to follow the following steps:
Step 1: Open the trading platform and select the currency pair you want to trade.
Step 2: Open a new order ticket by clicking on the “New Order” button or by pressing the F9 key.
Step 3: Enter the trade details, such as the currency pair, trade size, stop loss, take profit, and entry price.
Step 4: Click on the “Buy” or “Sell” button to execute the trade.
Step 5: Once the trade is executed, the trading platform will display the trade details at the bottom of the chart.
In addition to showing trades at the bottom of a forex chart, traders can also use other tools and indicators to analyze market trends and make informed trading decisions. Some of the popular tools and indicators used by forex traders include moving averages, Bollinger Bands, MACD, RSI, and Fibonacci retracements.
Moving averages are used to identify trends in the market by smoothing out price fluctuations over a specific period. Bollinger Bands are used to identify potential trading opportunities by measuring the volatility of the market. MACD is used to identify changes in market momentum, while RSI is used to identify overbought and oversold conditions in the market. Finally, Fibonacci retracements are used to identify potential support and resistance levels in the market.
In conclusion, showing trades at the bottom of forex charts is an essential tool for forex traders. This feature allows traders to see their trades at a glance, along with other relevant information such as the entry price, exit price, stop loss, and take profit levels. To enable this feature, traders need to use a trading platform that supports this functionality. Additionally, traders can use other tools and indicators to analyze market trends and make informed trading decisions. With the right tools and knowledge, traders can succeed in forex trading and achieve their financial goals.


