Forex trading is a complex and dynamic field that requires attention to detail and an understanding of the market. One of the key elements of successful forex trading is the ability to read and interpret volume. Volume refers to the number of trades made in a currency pair at a specific time period. It is a crucial aspect of forex trading as it provides valuable insights into market sentiment, trend strength, and potential price movements. In this article, we will explain how to see volume with forex and how it can be used to improve your trading strategy.
Understanding Volume in Forex
In forex trading, volume is measured in lots. A lot is the standard unit of measurement for forex transactions and represents 100,000 units of the base currency. Therefore, if you buy one lot of EUR/USD, you are buying 100,000 euros. The volume of a currency pair is the total number of lots traded at a particular time. For example, if the volume of EUR/USD is 1,000 lots, it means that 100 million euros have been traded at that time.
Volume is a critical indicator of market sentiment and can be used to confirm or contradict other technical analysis indicators. It is an essential tool for traders who want to understand the strength of a trend, the potential for a reversal, and the level of participation in the market.
How to Read Volume in Forex
There are several ways to read volume in forex, and each method has its advantages and disadvantages. The most common methods include:
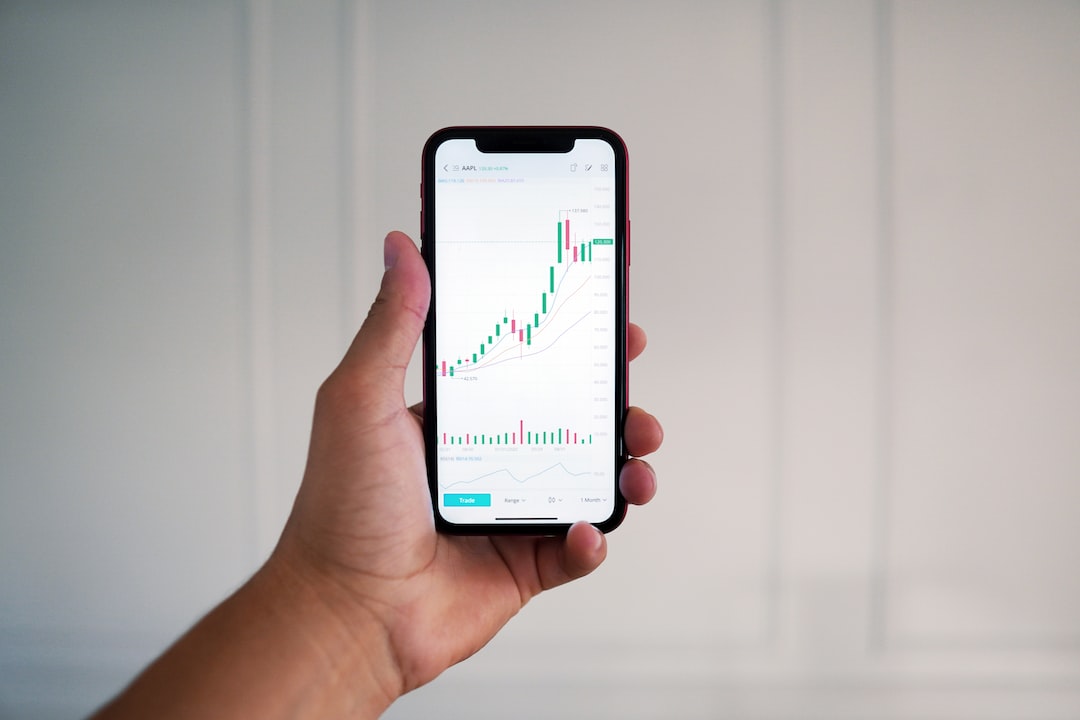
1. Volume bars: Volume bars are the most straightforward way to read volume in forex. They are visual representations of the volume of a currency pair over a specific time period. Each bar represents the number of lots traded during that period, and the height of the bar indicates the total volume. For example, a bar that is twice as high as another bar represents twice the volume. Volume bars are available on most forex trading platforms and can be customized to suit your needs.
2. Volume indicators: Volume indicators are technical analysis tools that use mathematical formulas to calculate the volume of a currency pair. These indicators are typically displayed as histograms or lines on a chart and can be overlaid with other technical indicators. Some popular volume indicators include the Chaikin Oscillator, On-Balance Volume (OBV), and the Volume Weighted Average Price (VWAP).
3. Tick volume: Tick volume is a measure of the number of price changes in a currency pair. It is not a direct measure of the volume of trades but provides insight into the level of activity in the market. High tick volume indicates a high level of market activity, while low tick volume indicates a lack of participation.
Using Volume to Improve Your Trading Strategy
Volume is a powerful tool that can be used to improve your trading strategy in several ways. Here are some examples:
1. Confirming trend: Volume can be used to confirm the strength of a trend. If the volume is increasing along with the price, it indicates a strong trend. Conversely, if the volume is decreasing as the price increases, it may indicate a weak or unsustainable trend.
2. Identifying potential reversals: Volume can also be used to identify potential trend reversals. If the volume is decreasing as the price increases, it may indicate that buyers are losing interest, and a reversal may be imminent.
3. Identifying market participation: Volume can be used to identify the level of participation in the market. High volume indicates a high level of market participation, while low volume may indicate a lack of interest. This can be useful in predicting potential price movements and identifying trading opportunities.
In conclusion, volume is a critical aspect of forex trading that provides valuable insights into market sentiment, trend strength, and potential price movements. It can be read in several ways, including volume bars, volume indicators, and tick volume. Understanding how to read and interpret volume can help you improve your trading strategy and make more informed trading decisions.